ArcGIS Basics: Somerville Creating a Map with ArcMap
|
|
|
- Allen Cameron
- 6 years ago
- Views:
Transcription

1 ArcGIS Basics: Somerville Creating a Map with ArcMap Written by Barbara M. Parmenter, revised by Carolyn Talmadge on 8/18/2017 for Tufts Data Lab 1. INTRODUCTION... 1 DOWNLOAD THE TUTORIAL DATA PREVIEWING AND MANAGING DATA WITH ARCCATALOG... 2 STARTING ARCCATALOG... 2 UNDERSTANDING AND USING FOLDER CONNECTIONS... 2 WORKING FROM HOME OR IN ANOTHER TUFTS COMPUTER LAB... 2 NAVIGATING IN ARCCATALOG... 4 COPYING AND DELETING GIS DATA SETS IN ARCCATALOG... 5 PREVIEWING GEOGRAPHY AND ATTRIBUTE TABLES... 7 READING DATA DOCUMENTATION (METADATA)... 8 GET TO KNOW YOUR DATA... 9 SUMMARY CREATING A MAP WITH ARCMAP... 9 OPENING ARCMAP AND ADDING DATA LAYERS... 9 USING ARCCATALOG WITHIN ARCMAP TO ADD DATA GETTING AROUND A MAP DEFINING THE GENERAL AND SYMBOLOGY PROPERTIES FOR A LAYER DRAWING A LAYER BASED ON AN ATTRIBUTE VALUE (LAND USE CODES) LOADING A LAYER FILE LABELING A LAYER BASED ON AN ATTRIBUTE FIELD MEASURING FEATURES AND DRAWING A MAP TO SCALE USING DATA FROM ARCGIS ONLINE CREATING A MAP FOR PRINTING OR EXPORTING AS A DIGITAL GRAPHIC SAVING MAP FILES UNDER DIFFERENT NAMES ADDING A SECOND DATA FRAME TO SHOW AN INSET MAP PRINTING OR EXPORTING YOUR MAP Introduction This tutorial introduces you to ArcGIS and shows you how to create a simple map using urban and state data sources. ArcCatalog and ArcMap are two modules in ArcGIS Desktop. You use ArcCatalog to manage your data and ArcMap to create maps, query data, perform analysis, and most of the other basic GIS operations. ArcMap is the module that you will use most frequently. The tutorial may take 3-4 hours to complete. Download the tutorial data Download the GIS_tutorial_data.zip file that accompanies this tutorial. The data can also be found in the S:\Tutorials & Tip Sheets\Tufts\Tutorial Data\ArcGIS_Basics_Somerville. Copy and paste this zipped file to your H Drive. If you re working in the Data Lab, unzip this file to your H: drive into a new folder called ArcGIS Basics. To do so, right click on the folder and click Extract To ArcGIS Basics. At home or in another Tufts lab, unzip it in a location of your choice. This results in two subfolders containing data from MassGIS (the Massachusetts GIS Repository) and the City of Somerville, MA.
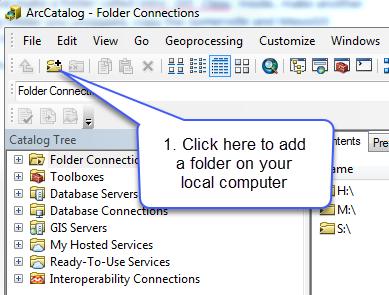
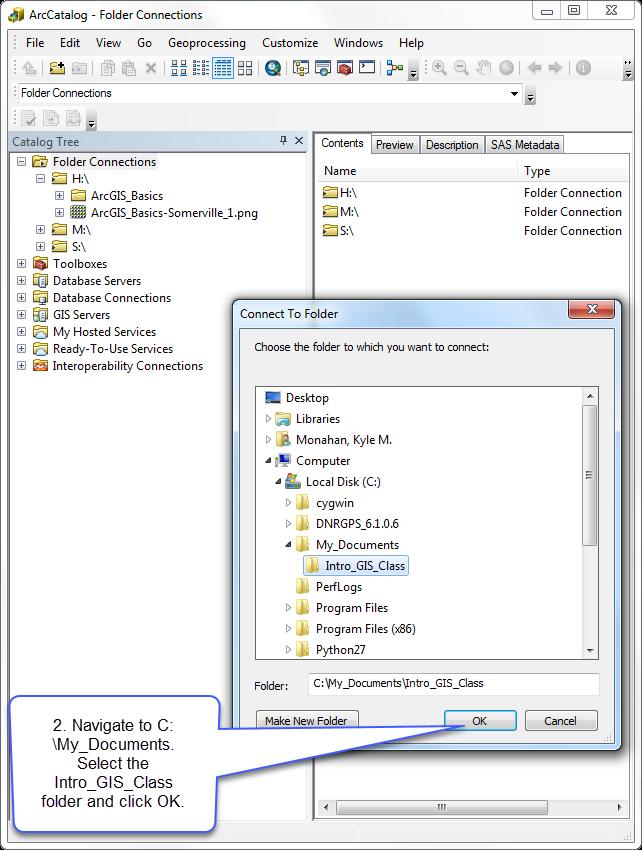
2 2. Previewing and Managing Data with ArcCatalog ArcCatalog is one of the modules in ArcGIS. You use it to manage your data sets (copying, pasting, deleting, and reading metadata if available). Starting ArcCatalog Start ArcCatalog by going to Start All Programs GIS Applications ArcGIS ArcCatalog (note: This might be in a different location in Boston or on the Grafton Campuses. Additionally, on your home computers with the ArcGIS student license installed, the ArcGIS program may be under Programs -ArcGIS ). The catalog tree on the left of the ArcCatalog window looks similar to a standard Windows file manager view, but the ArcCatalog tree only shows data that can be read by ArcGIS. Understanding and Using Folder Connections On the left side of the screen, you will see the Catalog Tree. This shows all of the locations where you can access GIS data. If you are in the Tufts Data Lab, you will see that you have three folder connections already to H:, S:, and M:. The H: drive is your personal storage space. The M: drive holds data sets that Tufts has acquired for your use. The S: drive holds class specific materials. The folder connection is a direct connection to these spaces in ArcGIS, and allows you to quickly access your data without navigating repeatedly through long folder paths. Working from Home or in another Tufts Computer Lab If you are working in the Data Lab, skip this section! Go to next section Navigating in ArcCatalog (Middle of p. 4). At home or other locations outside the Tufts Data Lab, you will not have pre-set folder connections. You will need to add these yourself. The first step is to think about how best to organize your work, and create the folders necessary in your home computer using your Windows software. We suggest making a folder for your GIS class, and then subfolders for your various assignments. On your home computer, navigate to My Documents and make a folder called Intro_GIS_Class. Inside, make another folder called ArcGIS Basics. Open the GIS_Tutorial_Data folder you unzipped, copy the Somerville and MassGIS subfolders, and paste them into this new ArcGIS Basics folder. Now, you need to connect to this data in ArcCatalog. This is how I would create a Folder Connection to that folder in ArcCatalog: 2
3 3

4 Select only the folder! Don t drill down to the data itself! That way you have a connection to the folder holding all of your data. Look back to your Folder Connections in the Catalog Tree on the left side of the screen. Expand the Folder Connections folder if it is not already (by double clicking) and you will see your new connection, as shown below: Navigating in ArcCatalog 1. In ArcCatalog, navigate to the location of the GIS data (in the Tisch Data Lab, this should be your H:/ArcGIS Basics/GIS_Tutorial_Data folder) 2. On the left side of the window, click to open the MassGIS/Physical_Resources folder (click on the plus signs to expand the list and see the data within this folder) 3. Click on the landuse_poly_clip file. This is a data set from the state of Massachusetts showing land use polygons (e.g., residential, commercial, agriculture). The landuse_poly_clip file is called shape file. This is a very common GIS data format, created by ESRI, the makers of ArcGIS. This is very important: a shape file actually consists of several files. Try looking at this file using Windows file manager within the regular windows folder. You will see several files making up that one Shape file as shown below: 4


5 Windows File Manager View of landuse_poly_clip shape file ArcCatalog Tree view of landuse_poly_clip shape file All these files are necessary for this land use data set to be readable in a GIS software program. That's one reason why ArcCatalog is a better program than Windows File Manager for managing GIS data. If you copy landuse_poly_clip in ArcCatalog to another folder, the ArcCatalog program knows to copy all the associated data files with it. Copying and deleting GIS data sets in ArcCatalog You can do the following ONLY if you are in the Tufts Data Lab! If you re working at home, skip this section and continue to the next section (Previewing geography and attribute tables) 1. In the Catalog Tree, look in the Somerville folder you ll see a data set called Parcels2004. That s a bit dated for current mapping! We have a 2009 Parcels data set on our GIS data server that you can use for this tutorial if you have access to the Tufts GIS Data Server (M: drive). 2. In the Catalog Tree, navigate to M:\City\Somerville\MIS 3. Right-click on SomervilleParcels09.shp and choose Copy 5


6 4. In ArcCatalog, navigate back to your H: drive and the Somerville folder. 5. Right-click on the Somerville folder and choose Paste. 6. You should now see SomervilleParcels09.shp in the folder. If you successfully copied the 2009 parcels to your tutorial data set, then in the Catalog Tree, delete the Parcels2004 data set on your H: drive either highlight it and press the delete key or right-click on it and choose Delete (delete it only if you were able to copy the 2009 data set to your H: drive, otherwise do NOT delete Parcels2004! You can use the 2004 or 2009 data set for the rest of this tutorial). ArcCatalog has helped you capture all of the associated files, and delete or copy them as necessary you just had to click on one file. If you used Windows Explorer, you would have had to make sure you selected all of the associated files, shown below. That s why it s so important to use ArcCatalog for copying, deleting and renaming files: 2009 Parcel files making up the GIS data set 2004 Parcel files making up the GIS data set 6

7 Previewing geography and attribute tables 1. Click on landuse_poly_clip (located in MassGIS\Physical_Resources) in the catalog tree. Click on the Preview tab above the right screen pane in order to view the shapefile. 2. You should now see what landuse_poly_clip actually looks like. 3. Click on the Identify tool at the top tool bar ( ) and then click on one of the land use features in the shapefile. You will see the information stored in the attribute table about that polygon. It doesn t make much sense yet! 4. Use the zoom and pan tools ( ) to zoom in and out and pan around in the preview map. With the zoom in tool (magnifying glass with a plus sign), you should use the mouse to draw a box around the area you want to zoom in to (click on one corner, keep the mouse button held down, and drag it to the opposite corner of the box before releasing). With the zoom-out tool, you also create a box - the current view will then be "zoomed out" to fit inside the box you created. To use the pan tool, select the hand-shaped tool, then hold down the mouse button while you pan any direction to move the map. If your mouse has a scroll wheel, you can use that to zoom in and out. 5. To get back to the first (default) view, click on the world icon ( ) - this takes you to the full extent of that particular data layer. 6. You can preview the attribute table (table of associated tabular information for a GIS data layer) by going down the Preview form and choosing Table. This shows all the records in the GIS layer. Scroll down and across to see the entire table. 7

8 Reading data documentation (metadata) When you were previewing the land use data set, it was difficult to understand what it was supposed to be representing. And it was impossible to understand the coding scheme without further information. It is critical to have documentation about the data you are using, and to document data that you create. Data documentation is called metadata. 1. MassGIS, the statewide GIS clearinghouse, has excellent metadata online. Click here to read about the land use data set: 2. Look through the land use data documentation. You can use this metadata to understand: a) Is the land use data set up to date (i.e., do you know from this data set what an area s land use is today)? b) For what years is land use documented? c) What was the source of information for determining land uses? 3. Scroll down the MassGIS land use metadata web page until you find information about the attributes and the codes that represent land uses. 4. Back in ArcCatalog Preview tab, preview Geography (so you see the map) and use the Identify icon to click on it. What was that area s land use in 1971? Had it changed by 1999? 5. Metadata is also sometimes accessible within ArcCatalog, but only if the agency that created the data has written metadata in a format that ArcCatalog can read. With landuse_clip_poly still highlighted in the Catalog Tree, click on the Description tab above the map frame (located to the right of the Preview tab. Click No if you are asked whether to upgrade metadata. You will see a shortened version of the MassGIS metadata page here. 6. Try using ArcCatalog to read the description of other data sets in your MassGIS folder. Are all the data sets documented in ArcCatalog? 8
9 7. Do the same for some of the data sets in the Somerville folder. What do you find when you look at metadata for the Somerville data sets? All US Federal agencies are required to document their GIS data following a geospatial metadata standard set out by the US government. Most state agencies will also document their GIS data, but not necessarily to the Federal standard. Local agencies vary widely in their documentation. Some do not document their data well or at all. Metadata is critical to data users - without it, you may not know what a particular data layer represents, when it was created, if it is complete, what the attributes mean, or what format it is in. We will discuss the importance of metadata more in class. Get to know your data Use what you have learned to look at other data sets in the GIS tutorial data set, including data for the City of Somerville. Preview the maps and tables, and look at the metadata. Note that you can see the full list of MassGIS data layers here: There is no equivalent online clearinghouse for the Somerville data. Summary ArcCatalog is a useful way to manage your GIS data, for organizational functions like moving, copying, and renaming. It also offers access to metadata if the source agency has put the documentation into a format that ArcGIS can read. In many instances, you ll find metadata online, or in a text file accompanying your data set. Sometimes, metadata may not exist at all. It s up to you to search for it and make sure you understand the data you are using. You can also open ArcCatalog within ArcMap this can be very helpful. We ll do this in the next part of the tutorial. 3. Creating a Map with ArcMap You will now learn the basics of using GIS data to explore an area and create a map. Your efforts will be focused on Somerville, Massachusetts. Opening ArcMap and adding data layers To start ArcMap , choose Start All Programs GIS Applications ArcGIS ArcMap (note: on home computers with the ArcGIS student license installed, the ArcGIS program may be under Programs -- ArcGIS ). It will take a minute to start. 1. When the first dialog box comes up, highlight the option to start with a new blank map and press OK. 9


10 2. On the top of your screen, choose Customize Toolbars, and make sure that Standard and Tools are visible. They will have check marks next to them; if not, click once on each. 3. On the left side of the screen, you should see your Table of Contents area. Right now it should only say "Layers". If you do not see this separate area, choose Window Table of Contents. 4. Use the mouse to pass over the various tools that have been docked, and see what they do. 5. Click on the Plus sign to Add Data 10
. In the Data Lab that will be your H: drive.")

11 6. If you re in the Data Lab, you ll see a list of default folder connections (M:, S: and H:). Navigate to where you have stored the Tutorial Data Set (MassGIS and Somerville). In the Data Lab that will be your H: drive. If you re working outside the Data Lab, and you have already made a folder connection in ArcCatalog, it should be available under Folder Connections in ArcMap: 7. Navigate to the Somerville folder and add all the data layers you see below (hold down the CTRL key to select multiple files at once substitute 2009 Parcels if you have those): If you missed adding one of the layers, click on the Add Data icon again and add them. 11


12 Using ArcCatalog within ArcMap to Add Data It s often useful for data management to have ArcCatalog open within ArcMap, and this also provides another way of adding data. 8. Within ArcMap, choose Windows Catalog from the main menu this adds ArcCatalog to your ArcMap session. 9. Click on the auto-hide pin icon in the top right corner of the Catalog box to pin it in place (otherwise it disappears after every interaction). Note: In the Tufts Data Lab you should have at least three folder connections in addition to any folder connections you have added manually. 10. Expand the folder that has your GIS tutorial data set and navigate to MassGIS Physical Resources. 11. Click and hold on the Hydro25k_poly_clip file and drag it into your ArcMap window after it draws, take a look at it what does it seem to represent? 12. Drag Hydro25k_arc_clip into your ArcMap window what does it represent? (hint: MassGIS has metadata here: Your map is a bit of a mess with all these layers! 13. In the Table of Contents, turn off (uncheck) all of the data layers except for street centerlines (Streetscl), hydro25k_poly_clip, and parks. They should remain listed in the Table of Contents, but should not be visible in the map view. Now you know two ways to add data to a map: by using the Add Data button, or by dragging them from ArcCatalog. It is very handy to have ArcCatalog open in ArcMap while you work, so you should get used to making its window visible at the beginning of every ArcMap session (remember to pin it in place!) Getting around a map 1. Zoom in to a part of Somerville using the Zoom In tool when using the zoom tool, you can click and drag a box around the area you would like to zoom in to. 12
 and then click on street centerlines or parks. 4. Can you find Professors Row on the Tufts University Campus?")
13 2. Use the zoom in, zoom out, and pan tools to move around the map, and the Zoom to Full Extent tool to go back to the full view after you have played with these, Zoom In to Somerville again. 3. If you can't get your bearings, try clicking on the Identify icon ( ) and then click on street centerlines or parks. 4. Can you find Professors Row on the Tufts University Campus? Click on the Find icon (docked on your Tools Toolbar), click on the Features tab, and type in Professors Row, then click on Find. 5. A list of results will be produced. Click on one, and you ll see a flash at its location on the map you may have to move the dialog box to see the location, or zoom out your map view. You can also right-click on a result and get different options like Zoom to and Pan to. 6. Close the Find box. 7. Right-click on Streetscl and choose Label Features (be sure you right-click on the actual name and not on the line symbol). Labels should appear on some streets. 8. Try zooming and panning again with the labels on. 9. Turn on the Buildings layer. If the buildings don t appear, they may be under another layer layers can block one another, depending on how much area they cover. You can make them draw on top by clicking on the Building layer and dragging it up above the other layers in the catalog. This is how you move layers around on a map. Turn the Building layer off again for now. 10. When you are done looking around, right-click on the CityBoundary layer and choose Zoom to Layer ( ) this fills the screen with the Somerville City Boundary area. Note: the CityBoundary layer will not appear itself, 13
.")
14 however, because it is turned off you just zoomed to its extent. If you want to see it, left click once on the small box next to its name in the Table of Contents. 11. Choose File Save. In the lab, save to the H: drive under the ArcGIS Basics folder. Name the map file basemap1.mxd. This action creates a map file (.mxd). A map file is a very small file that contains pointers to your data sets and remembers what you had up in your session. If you quit ArcMap at this point, the next time you start it, you can choose to start with this existing mapfile and it will automatically pop up all the data layers you added in your first session and with the view of the data just as you left it. Thus, map files are easy ways to save work. But beware - map files do not actually contain the data layers, they only have pointers to the data layers. If you copied your basemap1.mxd file and tried to open it on a home computer without the GIS data layers it is referencing (e.g. parks, hydro25k_poly, streetcl), an ArcMap session would start and list the data in the table of contents but nothing would appear because it would not be able to find the data it is pointing to. Save your map file frequently, and always save it at the end of a session! Defining the General and Symbology Properties for a Layer In this section of the tutorial, you will learn how to organize your data layers' properties to start bringing some coherence to the map. If you haven't turned off the labels already, turn them off now by right-clicking on the Streetscl data layer and unchecking Label Features. This will speed things up while you work. Assigning proper layer names First, you need to give the data layers better names than what they have (e.g., Streetcl should say "Streets") 1. Right click on the Streetscl layer and choose Properties (alternatively, you can double-click on the data layer name). 2. When you see the Properties dialog box, click on the General tab. In the Layer Name box, type in Streets instead of streetscl. Press OK when finished. 14
.")
15 Note: this does not change the name of the original data set - it only changes the name as it appears in this session of ArcMap and as it will appear on your final map. If you went back to ArcCatalog, streetscl would still be the name used. 3. Give all the other layers more coherent names as best as you can (e.g. City Boundary instead of CityBoundary, Ponds and Rivers instead of hydro25k_poly_clip, Streams instead of hydro25k_arc_clip ). In the future, we will deduct points on assignments for having non-standard English "data-speak" names like "streetscl" appearing in your map Assigning proper colors Your map would be a lot better if the water were colored blue, the parks green, etc. 1. Right-click on the hydro25k_poly_clip layer ( Ponds and Rivers or whatever you have called it now) to bring up the Properties dialog box again. 2. Click on the Symbology tab 3. To change the color of the layer, click on the colored box under Symbol - this should bring up the Symbol Selector box. 4. Click on the small colored box next to Fill Color, to see colors to choose from choose a blue color for water 5. Press OK when you are finished, and OK again to return to your map. 15

16 6. Color the parks layer green. 7. Turn on the buildings (left click once on the box to the left of its name in the Table of Contents) and color them a light gray. a. Note that the buildings still appear fairly black that s because the symbology settings have applied a black outline around the gray fill. You (and your map's viewers) do not need to see these outlines. Turn the outlines off by going back to the layer's properties and the Symbology tab. Once again click on the colored box under Symbol. Then click on the small box just right of Outline Color, and choose No Color. Press OK and OK again to get back to your map. This is how you turn outlines off (you can also change their color or thickness). 16
. 10. Drag the Neighborhoods layer to the top of the Table of Contents. 11.")
17 8. Turn on the neighborhoods layer and go to its symbology properties. Use the Hollow scheme (no fill color, with an outline), and make the outline width thicker (e.g., 2) as shown below: 9. Turn on the labels for Neighborhoods (right-click on Neighborhoods layer and choose Label Features). 10. Drag the Neighborhoods layer to the top of the Table of Contents. 11. Using what you have learned, give appropriate colors to your other layers, with the exception of the Parcels layer. A tip for coloring roads: The road centerlines, at least for non-major roads, often look best in a map if they are colored a light gray. That way they show up but won't dominate the map. 12. When finished, choose File Save again. Now your basemap1.mxd file will remember all the colors and names you have assigned. It's starting to look better... Drawing a layer based on an attribute value (land use codes) Some of your layers would look better if you could distinguish between types of features in the same layer. The Parcels layer, for example, shows property boundaries but doesn t give us more information when drawn with a single color. You can use an attribute field to symbolize your data to reflect the field values. Suppose we want to color parcels by their major type of use (e.g., commercial, residential). The attribute table contains relevant information in this regard, but unfortunately, we have no metadata to explain each attribute column. Obviously, to know what attribute fields are appropriate for use in symbolizing your data, you must be familiar with the attribute table structure, its fields, and the possible values of each significant field. Sometimes this can get confusing because there may be many fields, and the values in those fields are codes with which you are not familiar. This is when metadata becomes very important. Without metadata, you are stuck trying to track down this kind of important information about the data set. Still we can figure out some attributes by looking at the Parcels attribute table. 1. Turn on the Parcels layer so it is visible. 17
 field. If you are using the Parcels 2009 dataset, look for Use_Des.")
18 2. Open up the attribute table for the Parcels layer by right-clicking on the Parcels layer name in the table of contents and choosing Open Attribute Table. 3. Scroll across the table until you see the Use_descri (Use Description) field. If you are using the Parcels 2009 dataset, look for Use_Des. Note that there are a number of uses in the parcel data layer. 4. Look to the right of the Use_descri column and you will see a CLS column (in the 2009 dataset, it will be four columns to the right). Look at the values in the CLS column and compare them with the Use_description column. What do you think the CLS values represent? 5. Right-click on the CLS name at the top of the column and choose Sort Ascending as shown below: 6. Scroll through the values, comparing them to Use Description is it any clearer what the R, C, I, and E represent? Note: there will be several records of Null values to initially scroll through. 7. Close the attribute table. 8. Double-click on the Parcels layer to open up properties and click on the Symbology tab. 9. On the left side of the Symbology dialog box, click on Categories, and then Unique Values. 10. From the pull-down menu under Value Field, select Use_descri (or Use_Des). 18

19 11. Next, click on Add All Values - each unique value in the Use_descri field of the attribute table will appear with its own color. Your dialog box should look something like this 12. Press OK to return to your map. 13. Zoom into an area so you can clearly see individual parcels. You may have to reorder the layers in the Table of Contents to see the change. This way of coloring by land use is interesting, but there are far more uses than there are colors, so you can t really tell which parcel has which use. This is NOT a good way to communicate land use! What might be a better way to visualize land uses? Fortunately, there is a more generalized land use attribute field in the Parcels data layer, as you saw earlier the CLS field. Looking at the attribute table, and knowing something about parcel assessment and planning, we will surmise that the codes are as shown in the table below. The planning profession also has some generally acceptable color standards for visualizing land use that we provide here (see the APA s Land Base Classification System Level 1 Color Standards for the official recommendations from the American Planning Association): Code and Use R Residential C Commercial I Industrial E Exempt (meaning the landowners do not pay property taxes, indicating government, educational, religious, or other tax-exempt civic use) Standard Land Use Color yellow red purple blue 19

20 1. Double-click on the Parcels layer to get its symbology properties choose Categories Unique Values again, and set the Value Field to CLS. 2. Click on Add All Values. 3. Fill in the dialog box as you see below, changing color and text note: You can change the name of a category by clicking on it in the label column. Set the colors for each category according to the box above. You can do so by individually double-clicking on the colored boxes. Your categories may appear in a different order then shown below. Note that there was a blank row. That s because when we chose add all values for the CLS field, the software found a lot of blank values. We don t know what they are, so we call them Unknown. 4. You can move the classes around (e.g., to make Residential come first, etc.) by highlighting the class (e.g., R) and using the arrow keys to the right to move it up or down. 5. Uncheck All other values, so that does not appear in your Table of Contents or Legend. 6. As you can see, it takes a lot of time to set up the data layers to be colored and labeled appropriately. Save your map file again at this point (File Save) and if you quit now, you would be able to get back to your map session again very quickly, including all your colors and labels. Loading a layer file Important Note: The following steps may result in ArcGIS crashing and the program closing, so save your map file before continuing (File Save). If the program closes, use My Computer to navigate to your saved map file (basemap.mxd) and double-click on it. This will start ArcMap again and it will open to where you were. After that, you can repeat the following steps, and it should work fine. This is a good lesson that you should save your map file frequently! Layer files are special files that contain formatting (color, labels, etc.) for a particular data set. There are two good examples of layer files created by the folks at MassGIS for major roads and railroads. To load these layer files: 1. Click on the add data icon and navigate to the MassGIS / Infrastructure folder 2. Add the two files that end in.lyr as show below: 20
 by Major Roads in the Table of Contents: This means that the layer file cannot find the actual data source (for the major roads, this is the EOTMAJROADS_clip shape file). 5.")
 and choose Data Repair Data Source. 6.")
21 3. 4. You ll see a red exclamation mark (!) by Major Roads in the Table of Contents: This means that the layer file cannot find the actual data source (for the major roads, this is the EOTMAJROADS_clip shape file). 5. Try turning on the Major Roads layer by check-marking it. Turn it off and then turn it on again, which brings up a Set Data Source dialog box in that dialog box, click on EOTMAJROADS_clip.shp in the MassGIS\Infrastructure folder. a. If a dialog box does not appear, right-click on the layer name (Major Roads) and choose Data Repair Data Source. 6. In the navigation box, look for the MassGIS/Infrastructure folder containing the EOTMAJROADS_clip.shp file - click on the shape file and ADD it. Make sure to checkmark it in the Table of Contents to turn it on. 21

22 The Railroads layer may or may not appear use the same steps as above if necessary. You ll see that these layer files include colors, line styles, and labels, including highway shields for the interstate and state routes, and different railroad symbols depending on the current status of the track. These were set by the staff at MassGIS and saved as layer files to accompany the GIS data sets. You can have many layer files for one GIS file, displaying the same GIS data in different ways (for example, you could display parcels to show land use or to show land value). 7. Save your basemap1.mxd mapfile again. Labeling a layer based on an attribute field When you checked the "Label Features" button for streets and neighborhoods, you were using a function that allows you to label features based on an attribute field for the layer. When you use that function, it labels all the features in the map. You can also label features one at a time by pointing to them. First, however, you need to set up the Label properties to choose which field you will use to label, font, color, etc. Before continuing, turn off the MassGIS major roads and railroads, as well as the Parcels layers this will speed things up a bit as you continue to work on your map. Save your map. Changing the formatting of labels Earlier, you turned on the labels for the Neighborhoods layer. Let s say you want to have the Neighborhood names stand out more on the map. We can do this by changing the label s format. 1. If the Neighborhoods labels are not turned on, turn them on now (right-click on the Neighborhoods layer and check Label Features) 2. Right click on the Neighborhoods layer name and choose Properties. 3. Click on the Labels tab. 22

23 4. Make sure that the Label field says HOOD_NAME. 5. You can choose the font, size and color of your labels by clicking on the Symbol... button try the Neighborhood name bold with 12pt font. 6. When you are done, return to your map. 7. If you don t like the results, adjust the label format again as you wish. Check out some of the predefined label styles. Interactively labeling particular parks 1. The labels we have been adding are based on attribute table value. Open the Parks attribute table (right-click on the layer name and choose Open Attribute Table). 2. Look through the table. You will see that a field called Park_Name contains the park name. We want to use this field for labels. 3. Close the table, and open the layer Properties of Parks. 4. Click on the Labels tab. 5. Make sure that the Label field says Park_Name. 6. Using the same steps as before, make the park name italic. 7. When you are done, return to your map. 8. No labels appear yet. Try labeling all the park features at once by right-clicking on the layer name and choosing Label Features. This turns the labels on. There are a lot of labels and this makes for a rather messy map. We want to label only the largest parks. 9. Turn off the Label Features function. 10. Click on the Parks layer in the Table of Contents and drag it up so that it is at the TOP above the other layers. 23

24 11. To label features interactively (one by one) you need the Draw toolbar. Choose Customize -Toolbars, and click on the Draw. 12. In the Draw toolbar, click on the arrow nest to the "A" icon and then the Label icon as shown below: 13. A pop-up box appears on screen you can ignore this for now but note that it is set to use the label properties you just defined. 14. Click on a larger park. The label will appear. (Note: if you accidentally click on another feature like a street, its label will appear instead zoom into the map if you need to get a better view of a park). If needed, click the Edit toolbar at the top of the screen, and then Undo. 15. Label some other large parks. 16. Close the interactive labeling box when you re finished. 17. You can move or delete a label by selecting it with the select elements icon on the Tools menu. To move it, click on the label with the pointer icon (this selects the label) and move it to where you want it. To delete it, select the label and press the delete button. 18. Close the Draw toolbar for now or just drag it out of the way. 19. Save your mapfile when you re finished. 24

. 3.")
25 Measuring features and drawing a map to scale Making measurements and scaled maps is a very important GIS function. Measuring distances and areas 1. Click on the Measure tool in the Tools toolbar. 2. Click somewhere on the map to start a measuring line. Drag the line somewhere else and click again. You will see two measurements reported in the Measurement window. The first, segment, gives the distance (in meters) of the line you just drew. The second, Length, gives the total distance. Click on a third point in the map. You will see the new segment distance plus the total distance of both segments. Double-click on the map to stop measuring (or choose a different tool). 3. If you want to measure in a different unit, click on the little black triangle as shown below and select a new distance unit: 4. Try calculating the area in acres of the Somerville section of the Tufts campus (turn on the buildings to help guide you) use the polygon tool in the Measure tool as shown below and set the area units to acres: Hint: If you want to measure a new area or length, close the measure tool and open it again. 25

26 Drawing a map at a set scale Many professional map users expect printed maps to be at a standardized scale. USGS topographic maps are printed at 1:100,000 scale (1 inch on the map equals 100,000 inches in the real world or about 1.58 miles) and at 1:24,000 scale for example (1 inch on the map equals 24,000 inches in the real world, or 2000 feet or about 0.38 miles). In ArcGIS you can scale your map to any scale, but you are also offered standard scales from which to choose. 1. Set the scale of your map to 1:24,000: 2. Experiment with some of the other map scales. Which scale would be good for a detailed map of East Somerville or the Tufts campus? What about for a study of transportation in metropolitan Boston? 3. Try typing in in the scale box this creates a map at 1:12,000 scale (1 inch on the map equals 12,000 inches in the real world, or 1000 feet). It s important to start becoming familiar with map scales. You have been using what is called a unitless scale e.g., 1:24,000 means 1 of any unit on the map (inches, centimeters, feet) equals 24,000 of those same units in the real world. Using Data from ArcGIS Online Note: the following task will sometimes not work, most likely due to server issues. If it fails, try it again. Also be sure to save your mapfile before starting the next step because ArcMap may crash. Increasingly, ESRI and city and state agencies are setting up online GIS data servers that you can access from ArcGIS. We re going to use some of these services now, adding imagery and a basemap. 26


27 1. Click on File Add Data Add Basemap: 2. Click on Imagery and then Add: It will take a few moments to load the imagery. 27

28 3. You ll get a warning about the geographic coordinate system click Close on that warning for now. Click Yes if you get a warning about the Hardware Accelerator. 4. Be patient the imagery will take a while to draw! 5. Once you see the imagery, try zooming into a small area, like the Tufts campus or a few buildings. You ll see that it takes a minute but that the imagery will sharpen. 6. Turn off the imagery for now (it will be listed in the Table of Contents as Basemap). 7. Click on File Add Data Add Basemap again, and this time choose Topographic. 8. Once the Topographic map appears, try comparing it with some of your other map layers. What are the advantages of using this Topographic map service? Do you see any disadvantages? Making data layers transparent Suppose you wanted to show land use by category over aerial imagery. You can display layers above the aerial imagery or shaded relief to be somewhat transparent if you like. 1. Turn off the World Topographic Map service. 2. Turn on the World Imagery again. 3. Turn on the parcels (they should still be colored by general land use). 4. Zoom into Davis Square or Tufts University or Union Square. 5. Right-click on the parcels layer and open its properties. 6. Go to the Display tab. Set the Transparent entry to 70% and press OK to see what happens (it may take a while to draw). 7. When you re done experimenting, save your map file again. 28

29 Creating a map for printing or exporting as a digital graphic Now you re ready to create a well-designed map. But please read the following first. When you create a map, you should include the map itself, plus a title, a legend, a scale, and a north arrow. You should also provide the name of the cartographer (you), a date, and acknowledgements about data sources. Here is an example of a complete map: It is important in a map not to include too much information. You would not want a map that includes all the data layers you have in your ArcMap session from this tutorial. It would be much better to do several maps, e.g., one showing the general layout of Somerville with streets and parks, another showing land use, possibly one showing the buildings in black with all the other space blank (this is called a Nolli map by urban designers and is used to explore a community s built fabric). You may also include other elements on your map, for example, more explanatory text, charts, tables, photos, or other images. Note that you can also have more than one more than one data frame on a layout for example, you can have a small locational reference map (as in the map above) or an inset map to show an area in more detail. See the next section (Adding a data frame to show two or more maps on a layout) for instructions about how to do this. To do all this, you will move into Layout View. Layout View is much like viewing the page layout when you are working in a word processing software. You should do all the preliminary work and analysis in the data frame view (where you have been up to now in this tutorial), then move into Layout View only when you are ready to create a map. For detailed information about layouts, see Help ArcGIS Desktop Help Professional Library Mapping and Visualization Page Layouts. If you don t already have it open, start ArcMap and bring up your map file from the earlier part of this tutorial. 29
30 Setting up a map layout 1. Before you start a map layout, it is important to think through what you want to do and how you want your map to look. What do you want to show? How large do you want your final map to be? Portrait or landscape orientation? Do you need space for additional text or graphics? This tutorial example will assume a paper size (8x11 inch) map but often you are making map for publications where they must be smaller, or for Powerpoint where they need to be a certain size (e.g., 7.5x10 inches), or for posters where they may be much larger than 8x In ArcMap, choose View Layout View from the main menu. 3. The view changes to show your data frame on a page layout and a new toolbar appears the Layout toolbar. 4. The first thing you should do is to set up your Page properties. Choose File Page and Print Setup. 5. In the Page Setup dialog box, make sure that the page size is set to Letter. Also check either Portrait or Landscape (which would be better for the map you want to create? The example map is in Landscape orientation). Press OK to return to the map. Moving around in the page and data frame It is very important to understand the difference between the Layout toolbar and the regular (data frame) Tools toolbar. They share similar tools (zoom in and out, pan) but the layout tools work on the layout as if you were zooming in and out of the paper itself, while the same tools on the Tools toolbar work on the data inside the data frame (e.g., zoom into Davis Square). You will get confused occasionally, but once you get the hang of the two toolbars, you will be off and running. For now experiment with both to see what happens. The Tools Toolbar The Layout Toolbar Use these to navigate within the data frame on your map (e.g., you want the data frame to be slightly more zoomed into Davis Square, or you need to pan the data frame to the north). The 1:1 tool is particularly useful to see what the map features and text looks like at actual print size. The Zoom to Whole Page tool entire page view. will take you back to the Resizing and moving the data frame You will always need to re-size things in your map, especially the data frame itself which contains the map image. On the left below is something you might see when you first start a layout. In this case we are moving and resizing our data frame so that it fills the upper 4/5ths of our page. We ll then put a title, legend, and other map requirements in the blank space along the bottom of the page: Data frame and layout page not adjusted Data frame after resizing and moving to fit the layout page 30


31 Moving and re-sizing in ArcMap works similarly to most other programs where you use graphics. The key is selecting the element first. 1. To resize and move the data frame, use the Select Elements pointer to select the frame first. 2. Use the small grab points on the corners and sides to resize. 3. Place the cursor anywhere over the data frame to move it. 4. Alternative: With the frame selected, right click and select Properties Size and Position. You can adjust the size of the frame here. If you switch the sizes in the width and height boxes, the data frame will appear in landscape format. 31

32 Inserting a title, north arrow, and legend These are all usually required elements on a map. You access them by going to the Insert item on the main menu bar. You can read more about these by going to Help - ArcGIS Desktop Help Professional Library Mapping and Visualization Page Layouts, but here are a few tips: 32

33 Use the Insert menu function to insert the required map elements: Insert Scale Bar The scale bar you select will be in the Display units of your data frame (e.g., feet). If you want a different unit, doubleclick on the scale bar. In the Scale Line Properties dialog box, select a different Division Unit. Insert Legend There are lots of ways to improve your legend. For starters, let s say we re creating a land use map. We want the legend and map to focus on land use. We have imagery in the background as in the example map, but everyone knows what that is, it doesn t have to be identified in the legend. To control what goes on the legend: 1. Choose Insert Legend from the main menu. 33

34 2. Adjust what is in the legend so that only Land Use (Parcels) is there: 3. Click the Next button, noticing the different settings options, until you get the option to click Finish. 4. You can modify an existing legend by double-clicking on it to bring up the legend properties. For example in the Legend Properties, you can tell it NOT to show the word Legend or you can change that word to something else. Notice these settings were available when you inserted the legend, but you can access them again here. 34


35 5. Still in the Legend Wizard box, click on the Items tab, highlight Somerville Parcels 2009 or Parcels 2004, and then click on Style: 6. Try out different styles and preview how they will look: 35
36 7. Press OK, and OK again. If the map goes back to one column and you want two, double-click on the Legend again and under the Items tab, type in 2 for columns Selecting Elements Remember, you always have to select an element before you can move, resize, or change its properties. Use the select pointer icon on the Tools Toolbars. You can select more than one element by holding down the CTRL key as you click on each element. Modifying an element after insertion You can usually modify an element after you have inserted it by selecting it and then double-clicking on it. The relevant dialog box will appear for that element (e.g., title, legend, scale bar). Inserting text To put in your name as the cartographer, and any other information, use the Insert -Text function. Remember also to include a date. You should also have a data source note that the data comes from the City of Somerville and MassGIS. Add more text for any more descriptions or explanation. You can change font properties on selected text by right-clicking on the selected text and choosing Properties. Inserting a Picture Note that you can also insert images into the data frame. Deleting and trying again If modifying an existing element doesn't work, remember that you can always select an item and delete it if you don't like it. Select it using the select pointer, and press delete. Especially useful if your legend gets messed up - just delete and insert a new legend again to start fresh. Extent If you accidentally move the extent of your map, you can use the pan (the hand) tool or the back button to return to your desired location. Saving map files under different names Once you have created one map in a layout you like, you can save your map file (File Save As) to be the name of that map (e.g., Somerville Land Use). You can then use the same layout but change some of the visible features and save as a new map name (e.g., Somerville Streets, or Somerville Parks). This allows you to make maps fast once you have a good layout, and it allows you to make maps of the same area at the same scale, but showing different layers of information. Choose File Save As now and save the map file to an appropriate new name. Adding a second data frame to show an inset map You can add a second (or more) data frames to your ArcMap session. Only one data frame will appear at a time in the data frame view (right-click on the data frame name and choose Activate to see the data frame you want). But in the layout, all the data frames will appear. This can be handy for putting in a small "locator" map as in the Land Use Map example: 36


37 Adding a second data frame for a locator map Multiple data frames can get a little tricky, and will take some practice. Play with them some, and remember to save map files frequently under different names in case you mess up and want to return to a previous view. In this example, we ll use a new data frame to insert a locator map. 1. In Layout View, choose Insert Data Frame from the main menu a new data frame box appears in your layout. You ll see the New Data Frame listed in the table of contents: 37

38 2. Move and resize the new data frame box so it is in the location you want it here we are taking it to the bottom right corner of our layout: 3. You can add data to this data frame just as you did to the first one, or in the Table of Contents, you can drag a layer from the first frame to the second. Try dragging the Somerville City Boundary layer from the original data frame (called Layers) down to the New Data Frame and turn it on 4. Use the Add Data icon to add the data set TOWN_POLYM from the tutorial data set under MassGIS\Political_Boundaries these are town boundaries for all of Massachusetts. 5. Make sure to drag the town boundaries below the Somerville City Boundary. 6. Make the TOWNS_POLYM fill color white with a gray outline. 7. In the table of contents, right-click on New Data Frame and choose Properties 38

39 8. Click on the Frame tab and change the Background color to blue this will make the water appear blue. 9. Press OK to see the results. 10. Save your map file! Setting up locator map boundary box Finally, we re going to show a boundary box on our Locator Map. 39

40 1. Right-click on the new data frame to get its Properties dialog box back. 2. Click on Extent Indicators tab and follow the instructions below, then press OK: 3. If all this was successful, save your mapfile! Otherwise delete and try again. Printing or exporting your map To print, you must export to a digital graphic format like.pdf. Printing works just like any other Windows program, so we won t cover that here, but feel free to print your map. The ability to export to a digital format is very useful. If exporting to an image, remember to set your page size to the appropriate dimensions - this may mean custom dimensions, e.g., a small image to fit on a computer screen, a powerpoint presentation, a web site, or word document. When creating a layout for digital export, you should think ahead about what size you want your final image and lay out the map accordingly, and be sure to use font sizes that are readable at the final map size. 1. When you have your layout the way you want it, choose File Export Map. 2. In the Export dialog box that appears, navigate to your tutorial folder and give the image a name. 3. For Save as Type: choose a format - we recommend.gif or.pdf format because they come out well and are readable across a variety of platforms. The only problem with PDF formats is that they do not recognize all text fonts, so stay simple with your font types - e.g., Arial or Times New Roman. 40
ArcGIS Basics: Exploring Somerville
 ArcGIS Basics: Exploring Somerville Written by Barbara M. Parmenter, revised 9/21/2013 1. INTRODUCTION... 1 DOWNLOAD THE TUTORIAL DATA... 2 2. PREVIEWING AND MANAGING DATA WITH ARCCATALOG... 2 STARTING
ArcGIS Basics 2: Creating a Map with ArcMap
 ArcGIS Basics 2: Creating a Map with ArcMap Revised 25 August 2010 Tufts University Author: Barbara Parmenter Introduction... 1 Part 1 - Opening ArcMap and adding data layers... 2 Part 2 - Defining the
ArcGIS Basics: Creating a Map with ArcMap (India Data)
") ArcGIS Basics: Creating a Map with ArcMap (India Data) Written by Barbara Parmenter and Irina Rasputnis, updated by Carolyn Talmadge on January 14, 2015 INTRODUCTION...1 MUGAR LAB NOTE: MAPPING A NETWORK
ArcGIS Basics: Creating a Map with ArcMap (India Data) Written by Barbara Parmenter and Irina Rasputnis, updated by Carolyn Talmadge on January 14, 2015 INTRODUCTION...1 MUGAR LAB NOTE: MAPPING A NETWORK
ArcGIS Basics: India Creating a Map with ArcMap
 ArcGIS Basics: India Creating a Map with ArcMap Written by Barbara Parmenter and Irina Rasputnis, updated on August 30, 2016 INTRODUCTION... 1 NOTE FOR MUGAR LAB USERS: MAPPING A NETWORK DRIVE IN WINDOWS...
ArcGIS Basics: Mapping the US
 ArcGIS Basics: Mapping the US Revised February 15, 2010 Tufts University Author: Barbara Parmenter Introduction...1 Part 1 - Opening ArcMap and adding data layers...1 Part 2 Moving around the Map...4 Part
Geographical Information Systems Institute. Center for Geographic Analysis, Harvard University. LAB EXERCISE 1: Basic Mapping in ArcMap
 Harvard University Introduction to ArcMap Geographical Information Systems Institute Center for Geographic Analysis, Harvard University LAB EXERCISE 1: Basic Mapping in ArcMap Individual files (lab instructions,
Basic Mapping: Livelihood Zones In Haiti
 Basic Mapping: Livelihood Zones In Haiti - 2009 Barbara Parmenter, revised by Carolyn Talmadge 9/10/2017 for ArcMap 10.5.1 DATA SOURCES... 1 MAPPING NETWORK DRIVES OUTSIDE THE DATA LAB... 2 SETTING UP
Basic Mapping: Livelihood Zones In Haiti
 Basic Mapping: Livelihood Zones In Haiti - 2009 Barbara Parmenter, revised by Carolyn Talmadge 9/10/2016 DATA SOURCES... 1 MAPPING NETWORK DRIVES OUTSIDE THE DATA LAB... 2 SETTING UP YOUR ARCMAP SESSION...
Explore some of the new functionality in ArcMap 10
 Explore some of the new functionality in ArcMap 10 Scenario In this exercise, imagine you are a GIS analyst working for Old Dominion University. Construction will begin shortly on renovation of the new
Exercise 1: An Overview of ArcMap and ArcCatalog
 Exercise 1: An Overview of ArcMap and ArcCatalog Introduction: ArcGIS is an integrated collection of GIS software products for building a complete GIS. ArcGIS enables users to deploy GIS functionality
SAGIS Property Map Viewer Instruction Manual Instructions for using the SAGIS Property Map Viewer. Published December 21, 2018.
 SAGIS Property Map Viewer Instruction Manual www.sagis.org/map Instructions for using the SAGIS Property Map Viewer. Published December 21, 2018. 1 Instructional Videos Click on a link to watch a video
Geocoding Reference USA data in ArcMap 9.3
 Tufts GIS Tip Sheet Geocoding Reference USA data in ArcMap 9.3 Written by Barbara Parmenter Revised 3/1/2011 In this exercise, you will map businesses or services for a town in the Boston metropolitan
Downloading shapefiles and using essential ArcMap tools
 CHAPTER 1 KEY CONCEPTS downloading shapefiles learning essential tools exploring the ArcMap table of contents understanding shapefiles customizing shapefiles saving projects Downloading shapefiles and
Geocoding vs. Add XY Data using Reference USA data in ArcMap
 Geocoding vs. Add XY Data using Reference USA data in ArcMap 10.4.1 Written by Barbara Parmenter. Revised by Carolyn Talmadge 2/27/2017 GETTING BUSINESS DATA FROM REFERENCE USA BY NAICS AND CITY... 2 MODIFY
Introduction to GIS & Mapping: ArcGIS Desktop
 Introduction to GIS & Mapping: ArcGIS Desktop Your task in this exercise is to determine the best place to build a mixed use facility in Hudson County, NJ. In order to revitalize the community and take
Tutorial 1 Exploring ArcGIS
 Tutorial 1 Exploring ArcGIS Before beginning this tutorial, you should make sure your GIS network folder is mapped on the computer you are using. Please refer to the How to map your GIS server folder as
STUDENT PAGES GIS Tutorial Treasure in the Treasure State
 STUDENT PAGES GIS Tutorial Treasure in the Treasure State Copyright 2015 Bear Trust International GIS Tutorial 1 Exercise 1: Make a Hand Drawn Map of the School Yard and Playground Your teacher will provide
Exercise 1: Getting to know ArcGIS
 The Scenario You are working for the California Visitor s Commission. You have been asked to prepare a map of California for several dignitaries from out of the country. Your map will need to include enough
Creating a Smaller Data Set from a Larger Data Set Vector Data
 Creating a Smaller Data Set from a Larger Data Set Vector Data Written by Barbara Parmenter, revised by Carolyn Talmadge January 16, 2015 USING THE SELECTION METHOD QUICK METHOD BY CREATING A LAYER FILE...
Geography 281 Map Making with GIS Project Two: Map Design Issues in ArcMap
 Geography 281 Map Making with GIS Project Two: Map Design Issues in ArcMap This activity provides an introduction to the map design process. It takes you through a typical sequence from the initial decision
MAPLOGIC CORPORATION. GIS Software Solutions. Getting Started. With MapLogic Layout Manager
 MAPLOGIC CORPORATION GIS Software Solutions Getting Started With MapLogic Layout Manager Getting Started with MapLogic Layout Manager 2011 MapLogic Corporation All Rights Reserved 330 West Canton Ave.,
Geography 281 Mapmaking with GIS Project One: Exploring the ArcMap Environment
 Geography 281 Mapmaking with GIS Project One: Exploring the ArcMap Environment This activity is designed to introduce you to the Geography Lab and to the ArcMap software within the lab environment. Please
GIS Basics for Urban Studies
 GIS Basics for Urban Studies Date: March 21, 2018 Contacts: Mehdi Aminipouri, Graduate Peer GIS Faciliator, SFU Library (maminipo@sfu.ca) Keshav Mukunda, GIS & Map Librarian Librarian for Geography (kmukunda@sfu.ca)
Lab 2. Practice with ArcGIS
 Lab 2. Practice with ArcGIS Purpose: To practice map composition and printing in ArcGIS To Do and Hand In: Compose, print, and hand in two maps, described below. Maps due in lab one week after assignment.
Step by Step GIS. Section 1
 Step by Step GIS Section 1 Contact the web page given below for the data required to do the exercises (http://www.pasda.psu.edu/default.asp) Before beginning the tutorials please visit the Preparation
Introduction to using QGIS for Archaeology and History Workshop by the Empirical Reasoning Center
 Introduction to using QGIS for Archaeology and History Workshop by the Empirical Reasoning Center In this workshop, we will cover the basics of working with spatial data, as well as its main uses for archaeology.
Geography 281 Mapmaking with GIS Project One: Exploring the ArcMap Environment
 Geography 281 Mapmaking with GIS Project One: Exploring the ArcMap Environment This activity is designed to introduce you to the Geography Lab and to the ArcMap software within the lab environment. Before
Map Direct Lite. Quick Start Guide: Map Layers 5/14/2018
 Map Direct Lite Quick Start Guide: Map Layers 5/14/2018 Contents Quick Start Guide: Map Layers... 1 Map Layers in Map Direct Lite.... 3 What is a Basemap Layer?... 4 Change the Basemap Using the Basemap
Tutorial 1: Finding and Displaying Spatial Data Using ArcGIS
 Tutorial 1: Finding and Displaying Spatial Data Using ArcGIS This tutorial will introduce you to the following: Websites where you may browse to find geospatial information Identifying spatial data, usable
City of Richmond Interactive Map (RIM) User Guide for the Public
 User Guide for the Public") Interactive Map (RIM) User Guide for the Public Date: March 26, 2013 Version: 1.0 3479477 3479477 Table of Contents Table of Contents Table of Contents... i About this
Interactive Map (RIM) User Guide for the Public Date: March 26, 2013 Version: 1.0 3479477 3479477 Table of Contents Table of Contents Table of Contents... i About this
Geocoding Reference USA data in ArcMap 10.1
 Geocoding Reference USA data in ArcMap 10.1 Written by Barbara Parmenter, revised 2/21/2014 GETTING BUSINESS DATA FROM REFERENCE USA BY NAICS AND CITY... 2 MODIFY YOUR EXCEL FILE... 5 STARTING ARCMAP...
LAB 1: Introduction to ArcGIS 8
 LAB 1: Introduction to ArcGIS 8 Outline Introduction Purpose Lab Basics o About the Computers o About the software o Additional information Data ArcGIS Applications o Starting ArcGIS o o o Conclusion To
_Tutorials. Arcmap. Linking additional files outside from Geodata
 _Tutorials Arcmap Linking additional files outside from Geodata 2017 Sourcing the Data (Option 1): Extracting Data from Auckland Council GIS P1 First you want to get onto the Auckland Council GIS website
1. Start ArcMap by going to the Start menu > All Programs > ArcGIS > ArcMap.
 Learning ArcGIS: Introduction to ArcMap 10.1 The Map Document Feature Manipulation Navigating ArcMap Map Documents, Layers, and Features Shapes, Location, and Attribute Data Symbology Zoom, Pan and Map
City of La Crosse Online Mapping Website Help Document
 City of La Crosse Online Mapping Website Help Document This document was created to assist in using the new City of La Crosse online mapping sites. When the website is first opened, a map showing the City
Office of Geographic Information Systems
 Office of Geographic Information Systems Print this Page Fall 2012 - Working With Layers in the New DCGIS By Kent Tupper The new version of DCGIS has access to all the same GIS information that our old
Designing & Creating your GIS Poster
 Designing & Creating your GIS Poster Revised by Carolyn Talmadge and Kyle Monahan 4/24/2017 First think about your audience and purpose, then design your poster! Here are instructions for setting up your
MAPLOGIC CORPORATION. GIS Software Solutions. Getting Started. With MapLogic Layout Manager
 MAPLOGIC CORPORATION GIS Software Solutions Getting Started With MapLogic Layout Manager Getting Started with MapLogic Layout Manager 2008 MapLogic Corporation All Rights Reserved 330 West Canton Ave.,
Read and accept the following disclaimer:
 How to use the Person County Tax Parcel Viewer Visit gis.personcounty.net and click to view the Tax Parcel Viewer or go to gis.personcounty.net/taxparcelviewer Read and accept the following disclaimer:
Introduction to GIS A Journey Through Gale Crater
 Introduction to GIS A Journey Through Gale Crater In this lab you will be learning how to use ArcMap, one of the most common commercial software packages for GIS (Geographic Information System). Throughout
GIS IN ECOLOGY: CREATING RESEARCH MAPS
 GIS IN ECOLOGY: CREATING RESEARCH MAPS Contents Introduction... 2 Elements of Cartography... 2 Course Data Sources... 3 Tasks... 3 Establishing the Map Document... 3 Laying Out the Map... 5 Exporting Your
ArcGIS Drivers Permit. Using ESRI ArcView 10 and NH GRANIT Data
 ArcGIS Drivers Permit Using ESRI ArcView 10 and NH GRANIT Data UNH Cooperative Extension September 2011 Original Draft: September 2011 Exercise manual by: Anne Deely University of New Hampshire Cooperative
CVEN 2012 GEOMATICS LAB SPRING 2016 INTRO TO ESRI ARCGIS
 CVEN 2012 GEOMATICS LAB SPRING 2016 INTRO TO ESRI ARCGIS Objectives 1. Download and Add Data into ArcMap 2. Symbolize and Label Features 3. Navigate and Investigate the Map 4. Explore Attributes and Metadata
Intro to GIS (requirements: basic Windows computer skills and a flash drive)
") Introduction to GIS Intro to GIS (requirements: basic Windows computer skills and a flash drive) Part 1. What is GIS. 1. System: hardware (computers, devices), software (proprietary or free), people. 2.
Introduction to GIS Intro to GIS (requirements: basic Windows computer skills and a flash drive) Part 1. What is GIS. 1. System: hardware (computers, devices), software (proprietary or free), people. 2.
Geography 281 Map Making with GIS Project Six: Labeling Map Features
 Geography 281 Map Making with GIS Project Six: Labeling Map Features In this activity, you will explore techniques for adding text to maps. As discussed in lecture, there are two aspects to using text
Designing & Creating your GIS Poster
 Designing & Creating your GIS Poster Revised by Carolyn Talmadge, 11/26/2018 First think about your audience and purpose, then design your poster! Here are instructions for setting up your poster using
GIS LAB 1. Basic GIS Operations with ArcGIS. Calculating Stream Lengths and Watershed Areas.
 GIS LAB 1 Basic GIS Operations with ArcGIS. Calculating Stream Lengths and Watershed Areas. ArcGIS offers some advantages for novice users. The graphical user interface is similar to many Windows packages
Map Viewer User Guide
 Map Viewer User Guide Sea Level Scenario Sketch Planning Tool Version 2, 2017 University of Florida GeoPlan Center Introduction The purpose of this document is to guide users on how to use the Sea Level
Map Functions August 3, 2015 Triangle Homes Group
 Map Functions August 3, 2015 Triangle Homes Group Preston Neighborhoods and Property Map The Map is an interactive web based using ArcGIS Online by ESRI ESRI is the world s largest Geographic Information
Using MS Publisher. Launch MS Publisher: Start > All Programs > Microsoft Office > Publisher. Setting up Document Size and Orientation
 Designing and Creating your GIS Poster Revised by Carolyn Talmadge 1/20/2015 First think about your audience and purpose then design your poster! Here are instructions for setting up your poster using
Creating a reference map
 Chapter 1 Creating a reference map Reference maps are basic, traditional maps. Their purpose is to illustrate geographic boundaries for cities, counties, and other areas. Reference maps have no underlying
Budget Exercise for Intermediate Excel
 Budget Exercise for Intermediate Excel Follow the directions below to create a 12 month budget exercise. Read through each individual direction before performing it, like you are following recipe instructions.
Manitowoc County, WI Advanced Access GIS Viewer User Documentation
 Manitowoc County, WI Advanced Access GIS Viewer User Documentation Introduction Extensive time was put into developing this website both from a display, and from a printing and scaling perspective. This
On the Web sun.com/aboutsun/comm_invest STAROFFICE 8 DRAW
 STAROFFICE 8 DRAW Graphics They say a picture is worth a thousand words. Pictures are often used along with our words for good reason. They help communicate our thoughts. They give extra information that
Lab 1: Exploring ArcMap and ArcCatalog In this lab, you will explore the ArcGIS applications ArcCatalog and ArcMap. You will learn how to use
 Lab 1: Exploring ArcMap and ArcCatalog In this lab, you will explore the ArcGIS applications ArcCatalog and ArcMap. You will learn how to use ArcCatalog to find maps and data and how to display maps in
A Guide to Using the Planning Office s Interactive Maps
 A Guide to Using the Planning Office s Interactive Maps This guide is intended to assist the user in using the maps provided on the County Planning Office website that are branded as Interactive Maps.
Getting Started with GIS using ArcGIS 10.6 What is GIS? and - Module 1 Creating a map document
 Getting Started with GIS using ArcGIS 10.6 What is GIS? and - Module 1 Creating a map document Marcel Fortin Map & Data Library mdl@library.utoronto.ca 2018 http://mdl.library.utoronto.ca This workshop
HBS Training - IT Solutions. PlanWeb. Introduction
 HBS Training - IT Solutions PlanWeb Introduction CONTENTS Logging on to the system...3 The PlanWeb Window...5 The Tool Bar...6 The Status Bar...6 The Map Window...6 The Information Window...7 Changing
OnCOR Silverlight Viewer Guide
 Getting Around There are many ways to move around the map! The simplest option is to use your mouse in the map area. If you hold the left button down, then click and drag, you can pan the map to a new
Development Authority of the North Country (DANC) Internet Mapping Application Instructions Public Viewer 1. Purpose. 2. Logging-in. 3.
 Internet Mapping Application Instructions Public Viewer 1. Purpose. 2. Logging-in. 3.") Development Authority of the North Country (DANC) Internet Mapping Application Instructions Public Viewer 1. Purpose The purpose of this document is to outline basic functionality of the DANC Internet
Development Authority of the North Country (DANC) Internet Mapping Application Instructions Public Viewer 1. Purpose The purpose of this document is to outline basic functionality of the DANC Internet
v SMS 12.1 Tutorial GIS Requirements GIS Module Map Module ArcGis (Optional) Time minutes Prerequisites None Objectives
 Time minutes Prerequisites None Objectives") v. 12.1 SMS 12.1 Tutorial Objectives This tutorial demonstrates how to read in data, visualize it, and convert it into SMS coverage data that could be used to build a numeric model. This tutorial will
v. 12.1 SMS 12.1 Tutorial Objectives This tutorial demonstrates how to read in data, visualize it, and convert it into SMS coverage data that could be used to build a numeric model. This tutorial will
Downloading Census Data from American Factfinder for use in ArcGIS
 Downloading Census Data from American Factfinder for use in ArcGIS Written by Barbara Parmenter, revised September 24 2013 OBTAINING DATA FROM AMERICAN FACTFINDER (AFF)... 1 PREPARING AMERICAN FACTFINDER
Greenville County Internet Mapping System User s Guide
 Greenville County Internet Mapping System User s Guide Version 2.0 Greenville County Geographic Information Systems May 30, 2006 Table of Contents NAVIGATING TO THE ONLINE MAPPING APPLICATIONS...- 3 -
v SMS 11.1 Tutorial GIS Requirements GIS Module Map Module ArcGis (Optional) Time minutes Prerequisites None Objectives
 Time minutes Prerequisites None Objectives") v. 11.1 SMS 11.1 Tutorial GIS Objectives This tutorial demonstrates how you can read in GIS data, visualize it, and convert it into SMS coverage data that could be used to build a numeric model. We will
v. 11.1 SMS 11.1 Tutorial GIS Objectives This tutorial demonstrates how you can read in GIS data, visualize it, and convert it into SMS coverage data that could be used to build a numeric model. We will
RAPIDMAP Geocortex HTML5 Viewer Manual
 RAPIDMAP Geocortex HTML5 Viewer Manual This site was developed using the evolving HTML5 web standard and should work in most modern browsers including IE, Safari, Chrome and Firefox. Even though it was
Mapping Tabular Data
 Mapping Tabular Data ArcGIS Desktop 10.1 Instructional Guide Kim Ricker GIS/Data Center Head (713) 348-5691 Jean Niswonger GIS Support Specialist (713) 348-2595 This guide was created by the staff of the
HBS Training - IT Solutions. PlanWeb. Intermediate
 HBS Training - IT Solutions PlanWeb Intermediate CONTENTS Logging on to the system...3 The PlanWeb Window...5 The Tool Bar...6 The Status Bar...6 The Map Window...6 The Information Window...7 Changing
Lab 3. Introduction to GMT and Digitizing in ArcGIS
 Lab 3. Introduction to GMT and Digitizing in ArcGIS GEY 430/630 GIS Theory and Application Purpose: To learn how to use GMT to make basic maps and learn basic digitizing techniques when collecting data
St. Joseph County. GIS Department FetchGIS Web Map Tutorial
 St. Joseph County GIS Department FetchGIS Web Map Tutorial 2 Table of Contents Contents Slide #(s) Where to Find the Web Map 3 Disclaimer 4 Turning On and Off Map Layers 5 Searching for Parcels 6 More
Page 1 of 16 CONTENTS:
 Page 1 of 16 CONTENTS: HOME-BOX -- (PG.2) o PROPERTY OWNERSHIP o ADDRESS SEARCH o I WANT TO AERIAL IMAGERY AND BASE MAPS -- (PG.2) o IMAGERY WITH LABELS ON/OFF o TOPOGRAPHY ON/OFF o TRANSPARENCY ZOOM IN
Lab Exercise 1: ArcGIS Basics
 Massachusetts Institute of Technology Department of Urban Studies and Planning 11.520: A Workshop on Geographic Information Systems 11.188: Urban Planning and Social Science Laboratory Lab Exercise 1:
Basic Tasks in ArcGIS 10.3.x
 Basic Tasks in ArcGIS 10.3.x This guide provides instructions for performing a few basic tasks in ArcGIS 10.3.1, such as adding data to a map document, viewing and changing coordinate system information,
CHAPTER 1 COPYRIGHTED MATERIAL. Getting to Know AutoCAD. Opening a new drawing. Getting familiar with the AutoCAD and AutoCAD LT Graphics windows
 CHAPTER 1 Getting to Know AutoCAD Opening a new drawing Getting familiar with the AutoCAD and AutoCAD LT Graphics windows Modifying the display Displaying and arranging toolbars COPYRIGHTED MATERIAL 2
4. If you are prompted to enable hardware acceleration to improve performance, click
 Exercise 1a: Creating new points ArcGIS 10 Complexity: Beginner Data Requirement: ArcGIS Tutorial Data Setup About creating new points In this exercise, you will use an aerial photograph to create a new
ArcGIS 9. Using ArcReader
 ArcGIS 9 Using ArcReader Copyright 2003 2004 ESRI. All Rights Reserved. Printed in the United States of America. The information contained in this document is the exclusive property of ESRI. This work
BIO8014 GIS & Remote Sensing Practical Series. Practical 1: Introduction to ArcGIS Desktop
 BIO8014 GIS & Remote Sensing Practical Series Practical 1: Introduction to ArcGIS Desktop 0. Introduction There are various activities associated with the term GIS, these include visualisation, manipulation
Lab 3: Digitizing in ArcMap
 Lab 3: Digitizing in ArcMap What You ll Learn: In this Lab you ll be introduced to basic digitizing techniques using ArcMap. You should read Chapter 4 in the GIS Fundamentals textbook before starting this
Citizens MapViewer User Manual
 Citizens MapViewer User Manual This guide has been designed with step-by-step instructions to help familiarize you with using the city s Citizens MapViewer. Each of the controls (menus and buttons) is
v SMS 12.2 Tutorial GIS Requirements GIS Module Map Module ArcGis (Optional) Time minutes Prerequisites None Objectives
 Time minutes Prerequisites None Objectives") v. 12.2 SMS 12.2 Tutorial Objectives This tutorial demonstrates how to read in data, visualize it, and convert it into SMS coverage data that could be used to build a numeric model. This tutorial will
v. 12.2 SMS 12.2 Tutorial Objectives This tutorial demonstrates how to read in data, visualize it, and convert it into SMS coverage data that could be used to build a numeric model. This tutorial will
Tutorial for Lane County Mapping Applications
 Tutorial for Lane County Mapping Applications Contents Overview... 2 Tools... 2 Navigation Tools... 3 Display Tools... 5 Information Tools... 6 Sharing Tools... 7 Common Tasks... 9 Identify or Show Data
Overview of ArcGIS Online Applications. Champaign County
 Overview of ArcGIS Online Applications Champaign County Champaign County GIS Consortium Updated: April 2017 Table of Contents ArcGIS Online Application Overview... 3 Map Interface Symbology and Terminology...
Number Screen Element. App Lake County Logo: Displays the logo for Lake County, Colorado.
 The Main Screen When you open any of the Lake County maps, a screen similar to the one below will appear. The buttons at the bottom will vary between maps, the order will remain similar. Number Screen
Town of Amherst, NY. GIS Map Machine User Guide. Map Window Search Functions. Help. Toolbar. Layer Control. Scale Bar
 Town of Amherst, NY GIS Map Machine User Guide Toolbar Map Window Search Functions Help Layer Control Scale Bar Map Window Main Elements The MAP WINDOW is the main focus of the screen and where the map
Full Search Map Tab. This map is the result of selecting the Map tab within Full Search.
 Full Search Map Tab This map is the result of selecting the Map tab within Full Search. This map can be used when defining your parameters starting from a Full Search. Once you have entered your desired
Peoria County Front Desk Map Application
 Peoria County Front Desk Map Application Quick Guide, 2017 At a First Glance This guide will tell users all they need to know about the Peoria County Front Desk application which can be found on the Peoria
How to Align a Non- Georeferenced Image to an Existing Geographic Layer or Georeferenced Image
 How to Align a Non- Georeferenced Image to an Existing Geographic Layer or Georeferenced Image Written by Barbara M. Parmenter, revised 14 October 2011 You can align, or georeference, scanned maps to existing
Juniata County, Pennsylvania
 GIS Parcel Viewer Web Mapping Application Functional Documentation June 21, 2017 Juniata County, Pennsylvania Presented by www.worldviewsolutions.com (804) 767-1870 (phone) (804) 545-0792 (fax) 115 South
1. NJDEP Landscape 3.3 Viewer Interface
 Using the Landscape Project through NJDEP Landscape 3.3 Viewer Google Chrome or Mozilla Firefox are recommended for the use of this app. Navigate to the NJDEP-DFW s Landscape Project web page at www.njfishandwildlife.com/ensp/landscape/
GIS LAB 8. Raster Data Applications Watershed Delineation
 GIS LAB 8 Raster Data Applications Watershed Delineation This lab will require you to further your familiarity with raster data structures and the Spatial Analyst. The data for this lab are drawn from
Working with International Census Data in GIS
 Working with International Census Data in GIS Updated February 23, 2015 Table of Contents SETTING UP... 1 DATA SOURCES... 1 TABULAR CENSUS DATA... 2 2001 Tabular Census Data... 5 GEOGRAPHIC DATA... 5 JOINING
Guide to Mapping Website (Public) December 2016 GC_236594
 December 2016 GC_236594") Guide to Mapping Website (Public) December 2016 GC_236594 Table of Contents Guide to Mapping Website (Public)... 1 December 2016... 1 Quick Start... 3 Map Layers... 4 How do I?... 5 Draw on the Map...
Guide to Mapping Website (Public) December 2016 GC_236594 Table of Contents Guide to Mapping Website (Public)... 1 December 2016... 1 Quick Start... 3 Map Layers... 4 How do I?... 5 Draw on the Map...
Greater Bridgeport Regional Council Municipal GIS Viewer Training April 2015
 Greater Bridgeport Regional Council Municipal GIS Viewer Training April 2015 GBRC GIS Web Training Table of Contents Introduction........................................................... 3 Viewer Components.......................................................
Press the Plus + key to zoom in. Press the Minus - key to zoom out. Scroll the mouse wheel away from you to zoom in; towards you to zoom out.
 Navigate Around the Map Interactive maps provide many choices for displaying information, searching for more details, and moving around the map. Most navigation uses the mouse, but at times you may also
Creating and Editing a New Shapefile
 Creating and Editing a New Shapefile Written by Barbara Parmenter, revised October, 0 CREATING AND EDITING A NEW SHAPEFILE... CREATING THE GEOGRAPHIC FEATURE (POINT, LINE, OR POLYGON)... CREATING THE ATTRIBUTE
USING CCCR S AERIAL PHOTOGRAPHY IN YOUR OWN GIS
 USING CCCR S AERIAL PHOTOGRAPHY IN YOUR OWN GIS Background: In 2006, the Centre for Catchment and Coastal Research purchased 40 cm resolution aerial photography for the whole of Wales. This product was
Tip Sheet: Using the Selection Tools for Querying
 Tip Sheet: Using the Selection Tools for Querying Written by Barbara M. Parmenter, revised 10/2/2015 OVERVIEW OF SELECTION TOOLS... 1 TIPS FOR USING SELECT BY ATTRIBUTE... 3 TIPS FOR USING SELECT BY LOCATION...
Add to the ArcMap layout the Census dataset which are located in your Census folder.
 Building Your Map To begin building your map, open ArcMap. Add to the ArcMap layout the Census dataset which are located in your Census folder. Right Click on the Labour_Occupation_Education shapefile
GEOG 487 Lesson 4: Step-by-Step Activity
 GEOG 487 Lesson 4: Step-by-Step Activity Part I: Visually Explore Trends In Part I, we will explore several tools and technique to make it easier to visually interpret patterns in your data using ArcGIS.
Multi-LCC Mississippi River Basin Gulf Hypoxia Initiative. ScienceBase and Data Basin User Guide
 Multi-LCC Mississippi River Basin Gulf Hypoxia Initiative ScienceBase and Data Basin User Guide Data delivery for the Gulf Hypoxia Initiative is carried out through the use of two websites: ScienceBase
Using Syracuse Community Geography s MapSyracuse
 Using Syracuse Community Geography s MapSyracuse MapSyracuse allows the user to create custom maps with the data provided by Syracuse Community Geography. Starting with the basic template provided, you