A CHILD S GUIDE TO DIRECT DATALOGGING WITH EXCEL. (All brickbats and bouquets gladly received - on the Arduino forum)
|
|
|
- Dale Hunt
- 6 years ago
- Views:
Transcription
1 A CHILD S GUIDE TO DIRECT DATALOGGING WITH EXCEL version 5 (All brickbats and bouquets gladly received - on the Arduino forum) This is an aide memoire for the PLX-DAQ macro for Excel. Parallax do not address the use of their freebie with Arduino. The objective is to use this macro in order to feed data direct from Arduino to Excel. Essentially, the macro enables Excel to work just like any other terminal programme but has the advantage of producing direct input into where you really want it, and it can give you live graphs as well as a data file. I m sure you can get pretty sophisticated with the Excel commands, but this start might be all you need. 1. MINIMUM REQUIREMENTS Hardware: Any Arduino capable of serial output to a PC Software: Microsoft Office 2000, Windows XP The PLX-DAQ macro for Excel. This available for free from Note that there may be a maximum requirement. I know that PLX is OK with Excel 2007 under Windows 7, but I m not sure about later versions. It costs nothing to try it. Note also that there is a limit to the number of COM ports that PLX can address which, for me, precludes the use of Bluetooth. 2. WHAT IS PLX? It has taken me about two years to work out that PLX_DAQ is just a terminal interface for Excel. All the things you do with the data are what you do with Excel. I got PLX-DAQ because of the ability to make graphs on the fly but this is not some mystical ability of PLX- DAQ, all that is happening is that PLX-DAQ expedites normal Excel procedures. There is no difference between the making of my old Excel graph and PLX-DAQ except that manually entering one line of data each day is not nearly as spectacular as PLX-DAQ receiving a line of data each second automatically from Arduino. 3. AREAS OF OPERATION There are two separate things to do: 1. Format the output from Arduino so that it is properly interpreted by Excel 2. Understand the use of the macro within Excel. 4. ARDUINO The following code example is lifted from a current project. Activities include 1. read three temperature sensors at one second intervals. 2. record those readings along with time on an SD card 3. derive the difference between first two readings 4. send the appropriately formatted data to serial to be received by Excel
2 The vital feature to note is that the material sent from Arduino is a mixture of data and Excel commands. The Excel commands do not preclude the use of other terminal programmes. Only three Excel commands are used in this exercise LABEL, DATA, and TIME LABEL signifies that the following material is just a label DATA signifies that the following is DATA TIME is the command to get the PC time and write it in the first cell. Note that this is a local call, the time does not come from Arduino. The sheet header, if required, is written when the reset is pressed. The line is in the setup section. Serial.println("LABEL,Time,InTemp,OutTemp,diff,DrainTemp"); Which labels the first five columns. At the appropriate position in the loop, are the following commands: Serial.print("DATA,TIME,"); // Excel commands Serial.print(InTemp); Serial.print(", "); Serial.print(OutTemp); Serial.print(", "); Serial.print(diff); Serial.print(", "); Serial.println(DrainTemp); This tells Excel to put the PC time in the first column and fill the next four with numeric data. This data is the same floats the were sent to any other terminal programme, and a maximum of 26 items will be accepted. Note that, in an exercise like this, you can get by with only one line of code to use PLX-DAQ the time stamp. Indeed, there could be occasions when you don t actually need that either. Note that the section in the PLX help file is called Control Directives, as are the commands. There is a lot of extra stuff but you can ignore their admonishions about carriage returns, it clearly does not apply to Arduino, just use Serial.println for the last in the normal manner. If you are a bit short of confidence, you can do a test run using the serial monitor. It is quite readable. 5. EXCEL Download and install the macro in the normal manner. The installation includes a desktop folder with two shortcuts inside. Note that the help file is pretty comprehensive, even though it does not refer to Arduino. The objective is to get the right material into Excel, regardless of where it originated. Your job is simply get Arduino to talk the same language.. The vital bit is that Excel is not started by the usual procedure, it is started from the macro. This may be common practice but it is the only Excel macro I use. Once Installed, Excel is started through through the shortcut in the desktop folder. You need to allow the macro to run and then you should see this window over an Excel sheet.

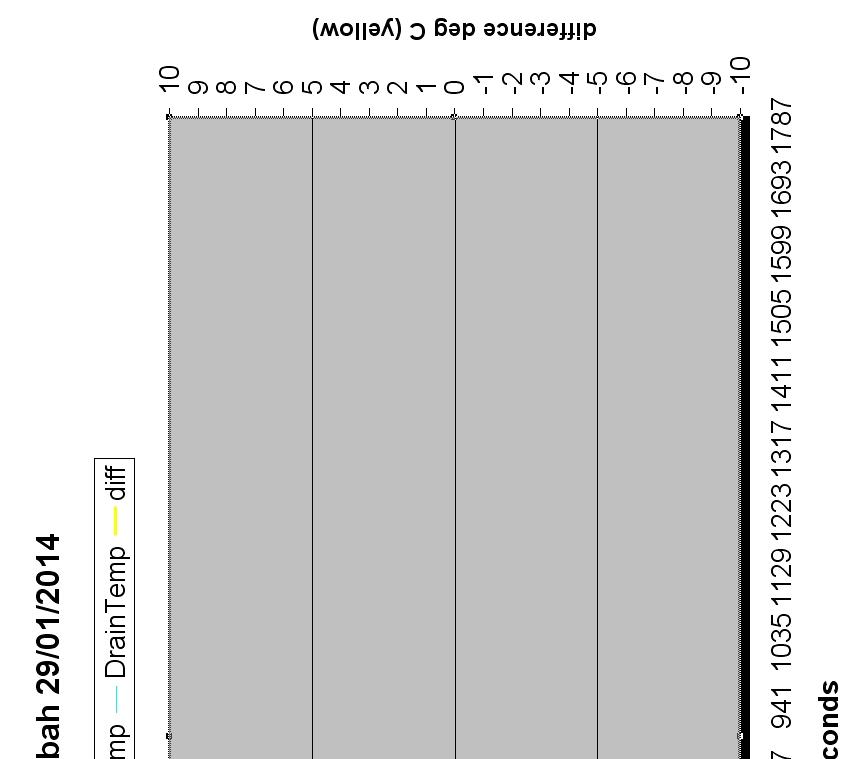
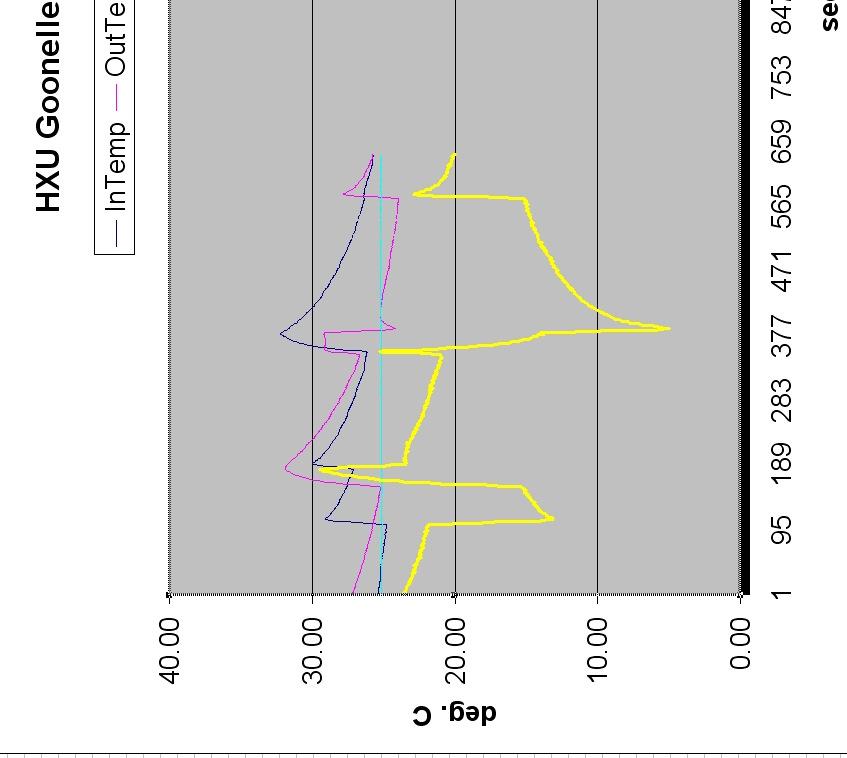
3 This is used to make the connection and start Excel. The connection is made via the USB cable in the normal manner, and the port is the same as that used by the Arduino IDE. The baud rate must match that in the Serial,begin command in the Arduino programme. By having the Reset on Connect box ticked, serial commands in the setup section of the Arduino programme will be implemented i.e. the title. At the start Excel opens with a dummy sheet. Ignore this, it will dump it when Arduino starts. Run Arduino and click the connect button in the PLX window. You shouldn t be left in any doubt about what is going on there is quite a lot After Arduino goes through its startup procedure, your titles should go up, the C status goes green, R flashes red on receipt, the message line at the bottom will advise of each line of data being accepted, and yes, the numbers come into the cells. 6. LIVE GRAPHS The live graph facility works but you need to get used to it. It is normal Excel, PLX-DAQ just feeds the data into the cells. The latest version of Excel may be better at this. Some familiarity with Excel graph-making won t go astray. I think there are a couple of secrets with graphs though. If you want a live graph, it is usually one where data is measured against time and the regular dispatches from Arduino are a sufficient time-cycle in themselves. In short, while the timestamp is included in the data lines on the work sheet, Excel doesn t need them on the graph and I think it gets along better without them. If you want to start at a specific point, the Clear Columns button in the PLX-DAQ window is ideal. No need to reset Arduino or reconnect. The procedure below is for a four-line graph with two y-axes. It was originally planned to use four lines. The main problem with graphs is that default is soul-destroying and the configuration equally so, but each aspect is configurable and it is quite versatile. So the objective is to get it right and hang onto it for dear life as a template. The Excel chart wizard suffices 1. Run your Arduino programme so that the data is being entered.

4 2. Highlight the relevant data column and select Chart from the Insert menu. This is the standard chart wizard. Select the plain-vanilla chart called Line and click Next. Don r be tempted to try anything fancy. If you use the press-to-view button, you will probably get a fair idez of what is going on. 3. This is a vital bit. The data range. The graph is about time and the duration needs to be determined. Here, Arduino is looping at about 1Hz and we want a graph for half an hour 1800 seconds. The range offered in the wizard is simply the wipe over columns B to E and down to the last data line written at the time of the click. This is edited as follows ='Simple Data'!$D$1:$D$1800 You have already done the series, so click next.


5 4. Give it some titles as you see fit. Note particularly that the labels for the lines, InTemp, OutTemp etc., cannot be edited with the graph tools and, in this case, is data from Arduino. And go through the tabs. I made no change to the axes. I called for major and minor gridlines. The picture goes black, don t panic. This is a time graph, so the X-axis is important, and the legend is moved to the top. Click Finish and see godawful mess. 5. Left click on the graph and stretch it to something useful but probably discouraging, and possibly meaningless as well. 6. Here comes the cavalry Each item on the graph is individually configurable.

6 In the above example, the titles and legend have defaulted quite nicely. This is not normal but you can attend to them by right clicking on them to change the font and colour. The first item for attention is likely to be the Y-axis, so right click on a figure to get to the format dialogue. Nearly everything has been changed. I just blunder with the X-axis, the objective is to get some sensible grid-lines, and get rid of what looks like a black background. Now comes the magic bit run one of the lines on a different Y axis. Right-click on any data point on the Line, select Format Data Series, select the Axis tab and select Secondary Axis. Note that there appears to be nothing that can be done about the way the X-axis counts. You can specify the interval but you are stuck with starting at 1, not Note that, once the graph is going, you can right click on the line and change the weight or colour. Note also that Excel is not above changing the graph type while you are configuring something. Indeed the Excel graph procedure is far from intuitive and can be flakey, but the results are worthwhile. Picture shows graph in progress at about 650 seconds.
7
Open a new Excel workbook and look for the Standard Toolbar.
 This activity shows how to use a spreadsheet to draw line graphs. Open a new Excel workbook and look for the Standard Toolbar. If it is not there, left click on View then Toolbars, then Standard to make
Word: Print Address Labels Using Mail Merge
 Word: Print Address Labels Using Mail Merge No Typing! The Quick and Easy Way to Print Sheets of Address Labels Here at PC Knowledge for Seniors we re often asked how to print sticky address labels in
 » How do I Integrate Excel information and objects in Word documents? How Do I... Page 2 of 10 How do I Integrate Excel information and objects in Word documents? Date: July 16th, 2007 Blogger: Scott Lowe
The first thing we ll need is some numbers. I m going to use the set of times and drug concentration levels in a patient s bloodstream given below.
 Graphing in Excel featuring Excel 2007 1 A spreadsheet can be a powerful tool for analyzing and graphing data, but it works completely differently from the graphing calculator that you re used to. If you
How to Make a Line Graph with Phase Lines in Excel 2007
 How to Make a Line Graph with Phase Lines in Excel 2007 Performance Aid Purpose The purpose of this document is to provide you with instructions to reference as you create a line graph in Excel 2007. It
Chapter 10 Working with Graphs and Charts
 Chapter 10: Working with Graphs and Charts 163 Chapter 10 Working with Graphs and Charts Most people understand information better when presented as a graph or chart than when they look at the raw data.
QUICK EXCEL TUTORIAL. The Very Basics
 QUICK EXCEL TUTORIAL The Very Basics You Are Here. Titles & Column Headers Merging Cells Text Alignment When we work on spread sheets we often need to have a title and/or header clearly visible. Merge
Civil Engineering Computation
 Civil Engineering Computation First Steps in VBA Homework Evaluation 2 1 Homework Evaluation 3 Based on this rubric, you may resubmit Homework 1 and Homework 2 (along with today s homework) by next Monday
Charts in Excel 2003
 Charts in Excel 2003 Contents Introduction Charts in Excel 2003...1 Part 1: Generating a Basic Chart...1 Part 2: Adding Another Data Series...3 Part 3: Other Handy Options...5 Introduction Charts in Excel
SAMLab Tip Sheet #5 Creating Graphs
 Creating Graphs The purpose of this tip sheet is to provide a basic demonstration of how to create graphs with Excel. Excel can generate a wide variety of graphs, but we will use only two as primary examples.
SHOW ME THE NUMBERS: DESIGNING YOUR OWN DATA VISUALIZATIONS PEPFAR Applied Learning Summit September 2017 A. Chafetz
 SHOW ME THE NUMBERS: DESIGNING YOUR OWN DATA VISUALIZATIONS PEPFAR Applied Learning Summit September 2017 A. Chafetz Overview In order to prepare for the upcoming POART, you need to look into testing as
Access: You will have to
 Access: You will have to Create a new blank database Import data from a text file and set up the fields correctly Add some records to the table Create some reports. o For these reports you will need to
Intermediate Excel 2003
 Intermediate Excel 2003 Introduction The aim of this document is to introduce some techniques for manipulating data within Excel, including sorting, filtering and how to customise the charts you create.
(Refer Slide Time: 02.06)
") Data Structures and Algorithms Dr. Naveen Garg Department of Computer Science and Engineering Indian Institute of Technology, Delhi Lecture 27 Depth First Search (DFS) Today we are going to be talking
Data Structures and Algorithms Dr. Naveen Garg Department of Computer Science and Engineering Indian Institute of Technology, Delhi Lecture 27 Depth First Search (DFS) Today we are going to be talking
This activity will show you how to use Excel to draw cumulative frequency graphs. Earnings ( x/hour) 0 < x < x
 0 < x < x") Pay rates for men and women - Excel 2007 activity This activity will show you how to use Excel to draw cumulative frequency graphs. Information sheet The table gives the results from a survey about hourly
Pay rates for men and women - Excel 2007 activity This activity will show you how to use Excel to draw cumulative frequency graphs. Information sheet The table gives the results from a survey about hourly
Chapter 2 The SAS Environment
 Chapter 2 The SAS Environment Abstract In this chapter, we begin to become familiar with the basic SAS working environment. We introduce the basic 3-screen layout, how to navigate the SAS Explorer window,
Excel 2. Module 3 Advanced Charts
 Excel 2 Module 3 Advanced Charts Revised 1/1/17 People s Resource Center Module Overview This module is part of the Excel 2 course which is for advancing your knowledge of Excel. During this lesson we
SAMLab Handout #5 Creating Graphs
 Creating Graphs The purpose of this tip sheet is to provide a basic demonstration of how to create graphs with Excel. Excel can generate a wide variety of graphs, but we will use only two as primary examples.
Printing Envelopes in Microsoft Word
 Printing Envelopes in Microsoft Word P 730 / 1 Stop Addressing Envelopes by Hand Let Word Print Them for You! One of the most common uses of Microsoft Word is for writing letters. With very little effort
if only it were real the UGS download unpacked how part of your desktop might look a genuine Arduino NANO
 grasping the nettle Once the A3 Laser is assembled and configured, well happy days, but before that there s a mountain to climb installing the software. A complete account of this might be called A3 Laser
Tricking it Out: Tricks to personalize and customize your graphs.
 Tricking it Out: Tricks to personalize and customize your graphs. Graphing templates may be used online without downloading them onto your own computer. However, if you would like to use the templates
2 A little on Spreadsheets
 2 A little on Spreadsheets Spreadsheets are computer versions of an accounts ledger. They are used frequently in business, but have wider uses. In particular they are often used to manipulate experimental
Chemistry 1A Graphing Tutorial CSUS Department of Chemistry
 Chemistry 1A Graphing Tutorial CSUS Department of Chemistry Please go to the Lab webpage to download your own copy for reference. 1 When you open Microsoft Excel 2003, you will see a blank worksheet: Enter
2. create the workbook file
 2. create the workbook file Excel documents are called workbook files. A workbook can include multiple sheets of information. Excel supports two kinds of sheets for working with data: Worksheets, which
Using Excel to produce graphs - a quick introduction:
 Research Skills -Using Excel to produce graphs: page 1: Using Excel to produce graphs - a quick introduction: This handout presupposes that you know how to start Excel and enter numbers into the cells
Let s begin by naming the first folder you create Pictures.
 1 Creating a Folder on Your Desktop Saving A Picture to Your Folder Creating Desktop Wallpaper from Pictures on the Internet Changing Your Home Page Creating a Shortcut to a Web Page on Your Desktop One
Appendix C. Vernier Tutorial
 C-1. Vernier Tutorial Introduction: In this lab course, you will collect, analyze and interpret data. The purpose of this tutorial is to teach you how to use the Vernier System to collect and transfer
Outlook is easier to use than you might think; it also does a lot more than. Fundamental Features: How Did You Ever Do without Outlook?
 04 537598 Ch01.qxd 9/2/03 9:46 AM Page 11 Chapter 1 Fundamental Features: How Did You Ever Do without Outlook? In This Chapter Reading e-mail Answering e-mail Creating new e-mail Entering an appointment
Operation Manual. for the. Data Logging Software. Version 7.1. (Isoft.xls)
") for the Data Logging Software Version 7.1 (Isoft.xls) TetraTec Instruments GmbH 1 GENERAL HINTS 1.1 Typographical Conventions Displayment Means marks a work procedure, which you must implement references
for the Data Logging Software Version 7.1 (Isoft.xls) TetraTec Instruments GmbH 1 GENERAL HINTS 1.1 Typographical Conventions Displayment Means marks a work procedure, which you must implement references
Spreadsheet and Graphing Exercise Biology 210 Introduction to Research
 1 Spreadsheet and Graphing Exercise Biology 210 Introduction to Research There are many good spreadsheet programs for analyzing data. In this class we will use MS Excel. Below are a series of examples
Excel Tutorial. Look at this simple spreadsheet and then answer the questions below.
 Excel Tutorial During this introduction you will learn the basics of how to use Excel, which means making a spreadsheet, creating a graph from that spreadsheet, and then interpreting the data to answer
Practical 1P1 Computing Exercise
 Practical 1P1 Computing Exercise What you should learn from this exercise How to use the teaching lab computers and printers. How to use a spreadsheet for basic data analysis. How to embed Excel tables
Studying in the Sciences
 Organising data and creating figures (charts and graphs) in Excel What is in this guide Familiarisation with Excel (for beginners) Setting up data sheets Creating a chart (graph) Formatting the chart Creating
Introduction to the workbook and spreadsheet
 Excel Tutorial To make the most of this tutorial I suggest you follow through it while sitting in front of a computer with Microsoft Excel running. This will allow you to try things out as you follow along.
Depending on the computer you find yourself in front of, here s what you ll need to do to open SPSS.
 1 SPSS 11.5 for Windows Introductory Assignment Material covered: Opening an existing SPSS data file, creating new data files, generating frequency distributions and descriptive statistics, obtaining printouts
Making Tables and Graphs with Excel. The Basics
 Making Tables and Graphs with Excel The Basics Where do my IV and DV go? Just like you would create a data table on paper, your IV goes in the leftmost column and your DV goes to the right of the IV Enter
Step-by-step guide to making a simple graph in Google Sheets Mariëlle Hoefnagels, University of Oklahoma
 Step-by-step guide to making a simple graph in Google Sheets Mariëlle Hoefnagels, University of Oklahoma The following tutorial includes bare-bones instructions for using Google Sheets to make two types
SAMLab Tip Sheet #4 Creating a Histogram
 Creating a Histogram Another great feature of Excel is its ability to visually display data. This Tip Sheet demonstrates how to create a histogram and provides a general overview of how to create graphs,
DOWNLOAD PDF EXCEL MACRO TO PRINT WORKSHEET TO
 Chapter 1 : All about printing sheets, workbook, charts etc. from Excel VBA - blog.quintoapp.com Hello Friends, Hope you are doing well!! Thought of sharing a small VBA code to help you writing a code
Excel 2013 Intermediate
 Instructor s Excel 2013 Tutorial 2 - Charts Excel 2013 Intermediate 103-124 Unit 2 - Charts Quick Links Chart Concepts Page EX197 EX199 EX200 Selecting Source Data Pages EX198 EX234 EX237 Creating a Chart
easydnc version 4.7 Installation and user guide When printing - A4 paper/format is recommended.
 easydnc version 4.7 Installation and user guide When printing - A4 paper/format is recommended. Copyright 1995 2012 Axis Controls Ltd. The information contained in this document has been carefully checked
HOUR 12. Adding a Chart
 HOUR 12 Adding a Chart The highlights of this hour are as follows: Reasons for using a chart The chart elements The chart types How to create charts with the Chart Wizard How to work with charts How to
Introduction to Access 97/2000
 Introduction to Access 97/2000 PowerPoint Presentation Notes Slide 1 Introduction to Databases (Title Slide) Slide 2 Workshop Ground Rules Slide 3 Objectives Here are our objectives for the day. By the
Excel Basics Rice Digital Media Commons Guide Written for Microsoft Excel 2010 Windows Edition by Eric Miller
 Excel Basics Rice Digital Media Commons Guide Written for Microsoft Excel 2010 Windows Edition by Eric Miller Table of Contents Introduction!... 1 Part 1: Entering Data!... 2 1.a: Typing!... 2 1.b: Editing
How To Get Your Word Document. Ready For Your Editor
 How To Get Your Word Document Ready For Your Editor When your document is ready to send to your editor you ll want to have it set out to look as professional as possible. This isn t just to make it look
3. Saving Your Work: You will want to save your work periodically, especially during long exercises.
 Graphing and Data Transformation in Excel ECON 285 Chris Georges This is a brief tutorial in Excel and a first data exercise for the course. The tutorial is written for a novice user of Excel and is not
41126 Cognento (MODENA) Italy Via Bottego 33/A Tel: +39-(0) Internet: Fax: +39-(0)
 Italy Via Bottego 33/A Tel: +39-(0) Internet: Fax: +39-(0)") QUICK ANALYZER User Guide Version 5.3 Index 1.0 Generality... 2 LICENSE AGREEMENT... 3 2.0 Channels Configuration... 4 2.1 IdroScan Data Log Management... 6 3.0 Test Results... 9 4.0 Excel Export... 10
QUICK ANALYZER User Guide Version 5.3 Index 1.0 Generality... 2 LICENSE AGREEMENT... 3 2.0 Channels Configuration... 4 2.1 IdroScan Data Log Management... 6 3.0 Test Results... 9 4.0 Excel Export... 10
Welcome Back! Without further delay, let s get started! First Things First. If you haven t done it already, download Turbo Lister from ebay.
 Welcome Back! Now that we ve covered the basics on how to use templates and how to customise them, it s time to learn some more advanced techniques that will help you create outstanding ebay listings!
How To Upload Your Newsletter
 How To Upload Your Newsletter Using The WS_FTP Client Copyright 2005, DPW Enterprises All Rights Reserved Welcome, Hi, my name is Donna Warren. I m a certified Webmaster and have been teaching web design
Creating Page Layouts 25 min
 1 of 10 09/11/2011 19:08 Home > Design Tips > Creating Page Layouts Creating Page Layouts 25 min Effective document design depends on a clear visual structure that conveys and complements the main message.
Welcome to Introduction to Microsoft Excel 2010
 Welcome to Introduction to Microsoft Excel 2010 2 Introduction to Excel 2010 What is Microsoft Office Excel 2010? Microsoft Office Excel is a powerful and easy-to-use spreadsheet application. If you are
Microsoft Excel 2007
 Microsoft Excel 2007 1 Excel is Microsoft s Spreadsheet program. Spreadsheets are often used as a method of displaying and manipulating groups of data in an effective manner. It was originally created
Microsoft Access II 1.) Opening a Saved Database Music Click the Options Enable this Content Click OK. *
 Opening a Saved Database Music Click the Options Enable this Content Click OK. *") Microsoft Access II 1.) Opening a Saved Database Open the Music database saved on your computer s hard drive. *I added more songs and records to the Songs and Artist tables. Click the Options button next
Microsoft Access II 1.) Opening a Saved Database Open the Music database saved on your computer s hard drive. *I added more songs and records to the Songs and Artist tables. Click the Options button next
Chemistry 30 Tips for Creating Graphs using Microsoft Excel
 Chemistry 30 Tips for Creating Graphs using Microsoft Excel Graphing is an important skill to learn in the science classroom. Students should be encouraged to use spreadsheet programs to create graphs.
Microsoft Excel 2007
 Learning computers is Show ezy Microsoft Excel 2007 301 Excel screen, toolbars, views, sheets, and uses for Excel 2005-8 Steve Slisar 2005-8 COPYRIGHT: The copyright for this publication is owned by Steve
HTML and CSS a further introduction
 HTML and CSS a further introduction By now you should be familiar with HTML and CSS and what they are, HTML dictates the structure of a page, CSS dictates how it looks. This tutorial will teach you a few
Y8 IT in Science Using Forces
 Y8 IT in Science Using Forces IT in Science Information Technology can be used in all subjects but is very useful for Science. We can use Information Technology in Science to help us with all these things:
RIS shading Series #2 Meet The Plugins
 RIS shading Series #2 Meet The Plugins In this tutorial I will be going over what each type of plugin is, what their uses are, and the basic layout of each. By the end you should understand the three basic
Arduino IDE Friday, 26 October 2018
 Arduino IDE Friday, 26 October 2018 12:38 PM Looking Under The Hood Of The Arduino IDE FIND THE ARDUINO IDE DOWNLOAD First, jump on the internet with your favorite browser, and navigate to www.arduino.cc.
Table of Contents. How to use this document. How to use the template. Page 1 of 9
 Table of Contents How to use this document... 1 How to use the template... 1 Template Sections... 2 Blank Section... 2 Signature Sheet... 2 Title Page... 2 Roman Numerals Section (i, ii, iii, iv )... 3
XP: Backup Your Important Files for Safety
 XP: Backup Your Important Files for Safety X 380 / 1 Protect Your Personal Files Against Accidental Loss with XP s Backup Wizard Your computer contains a great many important files, but when it comes to
Quick Guide. Choose It Maker 2. Overview/Introduction. ChooseIt!Maker2 is a motivating program at first because of the visual and musical
 Choose It Maker 2 Quick Guide Created 09/06 Updated SM Overview/Introduction This is a simple to use piece of software that can be tailored for use by children as an alternative to a pencil and paper worksheet,
Basic Computer Skills: An Overview
 Basic Computer Skills: An Overview Proficiency in the use of computers and common software packages is essential to completing technical tasks and in communicating results. The basic skills required include:
Sten-SLATE ESP Kit. Description and Programming
 Sten-SLATE ESP Kit Description and Programming Stensat Group LLC, Copyright 2016 Overview In this section, you will be introduced to the processor board electronics and the arduino software. At the end
The hi4em Dummies Guide To Business Objects InfoView
 The hi4em Dummies Guide To Business Objects InfoView Updated on 21 st September 2007 Who to Blame: Dan Parkes Introduction Welcome to the hi4em dummies guide to Business Objects InfoView. This guide is
Microsoft POWERPOINT Training. IT ESSENTIALS Producing Effective PowerPoint 2013 Presentations (IS763) October 2015
 October 2015") Microsoft POWERPOINT Training IT ESSENTIALS Producing Effective PowerPoint 0 (IS) October 0 Book online at: Royalholloway.ac.uk/it/training Self-Study packs also available th October 0 Table of Contents
Microsoft POWERPOINT Training IT ESSENTIALS Producing Effective PowerPoint 0 (IS) October 0 Book online at: Royalholloway.ac.uk/it/training Self-Study packs also available th October 0 Table of Contents
These are notes for the third lecture; if statements and loops.
 These are notes for the third lecture; if statements and loops. 1 Yeah, this is going to be the second slide in a lot of lectures. 2 - Dominant language for desktop application development - Most modern
MIS 0855 Data Science (Section 006) Fall 2017 In-Class Exercise (Day 15) Creating Interactive Dashboards
 Fall 2017 In-Class Exercise (Day 15) Creating Interactive Dashboards") MIS 0855 Data Science (Section 006) Fall 2017 In-Class Exercise (Day 15) Creating Interactive Dashboards Objective: Create a dashboard with interactive data filtering using Tableau Learning Outcomes: Understand
MIS 0855 Data Science (Section 006) Fall 2017 In-Class Exercise (Day 15) Creating Interactive Dashboards Objective: Create a dashboard with interactive data filtering using Tableau Learning Outcomes: Understand
Creating and Modifying Charts
 Creating and Modifying Charts Introduction When you re ready to share data with others, a worksheet might not be the most effective way to present the information. A page full of numbers, even if formatted
These instructions will help guide you through uploading the BMW Safari GPS routes file to your GPS device.
 BMW Safari GPS route file installation instructions These instructions will help guide you through uploading the BMW Safari GPS routes file to your GPS device. The file type used for the BMW Safari routes
PowerPoint Basics: Create a Photo Slide Show
 PowerPoint Basics: Create a Photo Slide Show P 570 / 1 Here s an Enjoyable Way to Learn How to Use Microsoft PowerPoint Microsoft PowerPoint is a program included with all versions of Microsoft Office.
The name of our class will be Yo. Type that in where it says Class Name. Don t hit the OK button yet.
 Mr G s Java Jive #2: Yo! Our First Program With this handout you ll write your first program, which we ll call Yo. Programs, Classes, and Objects, Oh My! People regularly refer to Java as a language that
Using Mail Merge in Microsoft Word 2003
 Using Mail Merge in Microsoft Word 2003 Mail Merge Created: 12 April 2005 Note: You should be competent in Microsoft Word before you attempt this Tutorial. Open Microsoft Word 2003 Beginning the Merge
RoastLogger Arduino/TC4 driver installation for Windows 9/10/13 By John Hannon (JackH) at Homeroasters.org
 at Homeroasters.org") This procedure was written for the Arduino Uno board with the TC4 shield. Please check the Arduino site for software if you are using a different model. I have not tested it, but this procedure should
This procedure was written for the Arduino Uno board with the TC4 shield. Please check the Arduino site for software if you are using a different model. I have not tested it, but this procedure should
1 Introduction to Using Excel Spreadsheets
 Survey of Math: Excel Spreadsheet Guide (for Excel 2007) Page 1 of 6 1 Introduction to Using Excel Spreadsheets This section of the guide is based on the file (a faux grade sheet created for messing with)
Introduction to Microsoft Excel 2007
 Introduction to Microsoft Excel 2007 Microsoft Excel is a very powerful tool for you to use for numeric computations and analysis. Excel can also function as a simple database but that is another class.
PART 7. Getting Started with Excel
 PART 7 Getting ed with Excel When you start the application, Excel displays a blank workbook. A workbook is a file in which you store your data, similar to a three-ring binder. Within a workbook are worksheets,
Software Compare and Contrast
 Microsoft Software Compare and Contrast Word Easy to navigate. Compatible with all PC computers. Very versatile. There are lots of templates that can be used to create flyers, calendars, resumes, etc.
Excel programmers develop two basic types of spreadsheets: spreadsheets
 Bonus Chapter 1 Creating Excel Applications for Others In This Chapter Developing spreadsheets for yourself and for other people Knowing what makes a good spreadsheet application Using guidelines for developing
Entering Data in the Spreadsheet
 Excel How To Parts of the Spreadsheet Tiffany Davis, Briggs Elementary School A, B, C, etc. are the heads of the columns. 1, 2, 3, etc. are the heads of the rows. A cell is created by the intersection
Installation Manual. Introduction
 Introduction In order to cater for everyone with differing levels of computer knowledge, this guide goes into a lot of detail and therefore looks rather large. It should only take a few minutes to complete
8 MANAGING SHARED FOLDERS & DATA
 MANAGING SHARED FOLDERS & DATA STORAGE.1 Introduction to Windows XP File Structure.1.1 File.1.2 Folder.1.3 Drives.2 Windows XP files and folders Sharing.2.1 Simple File Sharing.2.2 Levels of access to
MAPLOGIC CORPORATION. GIS Software Solutions. Getting Started. With MapLogic Layout Manager
 MAPLOGIC CORPORATION GIS Software Solutions Getting Started With MapLogic Layout Manager Getting Started with MapLogic Layout Manager 2011 MapLogic Corporation All Rights Reserved 330 West Canton Ave.,
To complete this activity, you will need the following files:
 CHAPTER 1 Windows XP More Skills 12 Move Data Between Windows You can open several application windows at the same time; they do not need to be files created by the same program. Having more than one window
Language Editor User Manual
 Language Editor User Manual June 2010 Contents Introduction... 3 Install the Language Editor... 4 Start using the Language Editor... 6 Editor screen... 8 Section 1: Translating Text... 9 Load Translations...
Beginner s Guide to Microsoft Excel 2002
 Beginner s Guide to Microsoft Excel 2002 Microsoft Excel lets you create spreadsheets, which allow you to make budgets, track inventories, calculate profits, and design charts and graphs. 1. Open Start
Microsoft PowerPoint 2016 Part 2: Notes, Links, & Graphics. Choosing a Design. Format Background
 Microsoft PowerPoint 2016 Part 2: Notes, Links, & Graphics Choosing a Design Open PowerPoint. Click on Blank Presentation. Click on the Design tab. Click on the design tab of your choice. In part one we
Technology Assignment: Scatter Plots
 The goal of this assignment is to create a scatter plot of a set of data. You could do this with any two columns of data, but for demonstration purposes we ll work with the data in the table below. You
Navigating In Uncharted Waters Of Microsoft Excel Charts
 1 of 8 Navigating In Uncharted Waters Of Microsoft Excel Charts Translating Excel spreadsheets is pretty easy. All you need to do is translate text in individual cells and then format the spreadsheet for
Functional Skills. Entry 3 to Level 2. IT Basics Information
 Functional Skills Skills ICT Entry 3 to Level 2 YOU DO NOT NEED TO WORK THROUGH THIS. IT IS AN PACK TO TEACH YOU THE SKILLS NEEDED TO COMPLETE THE TASKS. YOU CAN USE IT WHILST WORKING THROUGH THE TASKS,
Creating a Histogram Creating a Histogram
 Creating a Histogram Another great feature of Excel is its ability to visually display data. This Tip Sheet demonstrates how to create a histogram and provides a general overview of how to create graphs,
Excellence with Excel: Quiz Questions Module 6 Graphs and Charts
 Excellence with Excel: Quiz Questions Module 6 Graphs and Charts 1. Suppose that you have a company s annual revenue by year. How could you create a simple column chart for this data? a. Select all the
How to Rescue a Deleted File Using the Free Undelete 360 Program
 R 095/1 How to Rescue a Deleted File Using the Free Program This article shows you how to: Maximise your chances of recovering the lost file View a list of all your deleted files in the free Restore a
Top 15 Excel Tutorials
 Top 15 Excel Tutorials Follow us: TeachExcel.com Contents How to Input, Edit, and Manage Formulas and Functions in Excel... 2 How to Quickly Find Data Anywhere in Excel... 8 How to use the Vlookup Function
The Excel Project: Excel for Accountants, Business People... from the Beginning Duncan Williamson
 The Excel Project: Excel for Accountants, Business People... from the Beginning Duncan Williamson Introduction In this book you will see that we use Excel 2007 as the focal point of much of the work we
CSCU9B2 Practical 1: Introduction to HTML 5
 CSCU9B2 Practical 1: Introduction to HTML 5 Aim: To learn the basics of creating web pages with HTML5. Please register your practical attendance: Go to the GROUPS\CSCU9B2 folder in your Computer folder
Matlab for FMRI Module 1: the basics Instructor: Luis Hernandez-Garcia
 Matlab for FMRI Module 1: the basics Instructor: Luis Hernandez-Garcia The goal for this tutorial is to make sure that you understand a few key concepts related to programming, and that you know the basics
Exercise 1: Introduction to MapInfo
 Geog 578 Exercise 1: Introduction to MapInfo Page: 1/22 Geog 578: GIS Applications Exercise 1: Introduction to MapInfo Assigned on January 25 th, 2006 Due on February 1 st, 2006 Total Points: 10 0. Convention
Getting to Integris/SIS
 Getting to Integris/SIS Firstly, before installing the app, note a couple of things that might be helpful: a) Maybe an additional keyboard would suit some. b) Don t forget to close Integris the same way
How to Set up a Budget Advanced Excel Part B
 How to Set up a Budget Advanced Excel Part B A budget is probably the most important spreadsheet you can create. A good budget will keep you focused on your ultimate financial goal and help you avoid spending