Low Cost and Free Public Health Mapping Tools
|
|
|
- Ursula Francis
- 6 years ago
- Views:
Transcription
 Documentation a) QGIS is a large piece of software and only basics are covered in this document.")
1 Low Cost and Free Public Health Mapping Tools Quantum GIS - QGIS 1) Download and Install a) QGIS can be quickly and easily installed on Windows, Macs and Linux from installers found here: 2) Documentation a) QGIS is a large piece of software and only basics are covered in this document. Full documentation can be found via pdf in the shared DropBox folder or online here: b) Anita Graser has a fantastic QGIS blog with a lot of resources 3) Working with GIS Pro Data a) Since GIS Pro exports shapefiles it is a simple matter to bring them into QGIS. b) QGIS has a main tool bar with buttons for brining in different kinds of spatial data. Click the Add Vector data button. Click the Browse button and navigate to your data folder. Set the file type filter to All files or ESRI Shapefiles. Select your layer(s) and click Open. c) The other add data buttons allow you to add Raster and data from several commonly used open source spatial databases. 4) Map Navigation a) Once you have the layer loaded, take a look at the map navigation toolbar. From left to right, the tools are: 1
2 1. Pan - pan the map by dragging the mouse 2. Zoom In - zoom in by dragging the mouse or clicking 3. Zoom Out - zoom out by dragging the mouse or clicking 4. Zoom to Native Pixel Resolution 5. Zoom to Full Extents - zoom to the full extent of all layers 6. Zoom to Selection - zoom to the extent of the selected features 7. Zoom to Layer - zoom to the extent of the active layer 8. Zoom to Last Extent - zoom to the previous extent 9. Zoom to Forward Extent zoom to the next extent 10. Refresh Map - redraw the map 5) Saving a project a) Save your map document. You can either go to File Save Project or hit the Save Project button on the File toolbar. QGIS projects are saved as *.qgs files just as ArcMap documents are saved as *.mxd s. b) You can access project properties from the Settings Project Properties. This window has several tabs for setting common project properties such as: data paths (absolute or relative), units, selection color, Projection on the fly and identifiable layers etc. 2

3 6) Symbology and Layer Properties a) Right clicking on a layer gives you a context menu. Use this to open the attribute table, define the layers coordinate reference system, toggle editing, and accessing layer properties. 3
 You can adjust the default icons size and color here.")
 To create a more custom symbol click on the Change button to open the Symbol properties.")
4 b) Open the Properties of the layer. c) There are several tabs. Click on the Style tab. This gives you access to the layer symbology. d) You can adjust the default icons size and color here. You can also save styles, load styles and work with the style manager to manage styles. e) To create a more custom symbol click on the Change button to open the Symbol properties. This allows you to use different marker symbols and adjust color and size. There are several default symbol sets including simple, ellipse, font and SVG markers. 4
 The Plugins in the list by default are QGIS Core Plugins. You can also click on Menu Fetch Python Plugins. This will give you access to many more third party plugins that you can easily install.")
5 7) Using the evis Plugin for hot linking photos to points a) QGIS uses Plugins to provide extra functionality. These can be accessed via the Plugins menu Manage Plugins. b) The Plugins in the list by default are QGIS Core Plugins. You can also click on Menu Fetch Python Plugins. This will give you access to many more third party plugins that you can easily install. c) One Plugin that may be immediately applicable if you're using GIS Pro is evis. This Core plugin allows you to manage hyper-linking. So for example you could set it up to link to the photo you took in the field when you click on a feature with the evis Event ID Tool. d) This is the link to online evis documentation: 5
 Some extra buttons will be added to a tool bar.")

6 e) Go to the Plugins menu Manage Plugins and check the box next to evis. f) Some extra buttons will be added to a tool bar. g) Select your field point layer and click on the evis Event Browser. Open the Options tab. h) Next to Attribute containing path to file, select the column with the path to the jpg. Click Path is Relative and Remember this. 6

7 i) Next to Base path identify the path to your data folder where the shapefile is stored. j) Now move to the Configure External Applications tab. Click in the Extension cell and input.jpg. Click in the Application cell and insert the path to the MS PhotoViewer app that comes standard on Windows. The default path is: C:/Program Files/Windows Photo Viewer/PhotoViewer.dll. You can also choose another software package to have the image open in. 8) Working with ODK Collect & EPI Collect Data a) Both ODK Collect EPI Collect provides the data as a CSV file. b) QGIS provides several tools for adding different types of data to your map. You will use the Create a Layer from a Delimited Text File option. c) You can preview the CSV file in MS Excel to familiarize yourself with the data structure. d) Populate the Create a Layer from a Delimited Text File form as below. Browse to your CSV file, provide an output layer name, choose only Comma as the delimiter. Click OK. 7
 To save it as a permanent shapefile, right click on the layer and choose Save")

8 e) The data will show up as a temporary point layer with all the attributes. f) To save it as a permanent shapefile, right click on the layer and choose Save As from the context menu. g) Fill out the Save vector layer as... form. You'll notice that there are many options for file Format. Here I've chosen an ESRI shapefile. 8

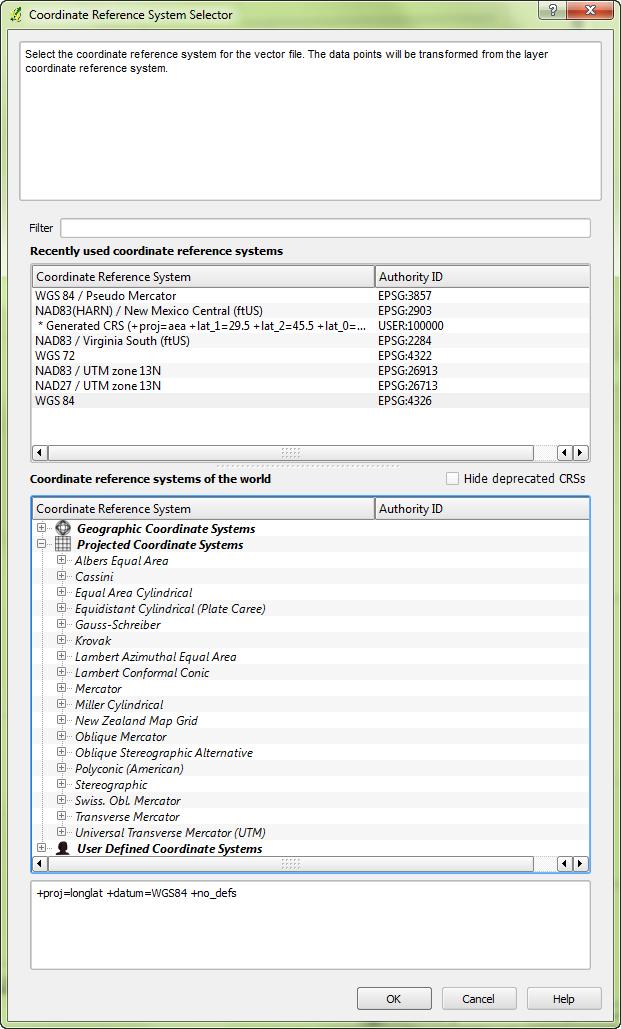
9 h) It is also possible to choose the output layers coordinate reference system here by choosing Selected CRS and clicking the Browse button. This opens the Coordinate Reference System Selector (below). 9
10 10
11 9) Joining Tables a) Here is the online link for Joins documentation: joins-tab b) To do a join you need to have an a common index in both your attribute table and the standalone table you'd like to join to it. The join will be based on these two columns. They don't have to have the same name, but they do need to have the same data in the same format (number, string etc.). c) Add the table you'd like to join to your QGIS project. The table needs to be in a comma separated values (CSV) format. If you're data is in Excel simply export the data to a CSV file in Excel. Once you have your table click on the Add vector layer button. You will need to filter by Comma Separated Value [OGR] or just choose All files to see your csv file. d) Open the layer properties for the layer whose attribute table you'd like to join data to. Click on the Joins tab. Click the button to add the table and create the join. Choose the Join layer (standalone table), the Join field and the Target field in the GIS layer. If you're not sure what fields to use open both tables again and determine which fields the join should be based on. e) The standalone table is now joined to your GIS layer within the QGIS project. To make the join permanent, right click on the GIS layer and select Save as Choose the file format (ESRI shapefile), a file name and the appropriate folder. f) Voila! 10) Merging shapefiles a) You may end up with multiple shapefiles that need to be merged. To merge shapefiles they need to have 1) the same geometry (point and point or line and line etc. ), 2) the same attribute columns and 3) the same coordinate reference system. b) All of these items should be the same since the data will have been collected via the same methods. However, it is good to keep these points in mind if the merged shapefile ends up looking incorrect. c) The QGIS merge utility can either be set up to merge all the shapefiles in a given folder or you can select the shapefiles to merge. d) Go to the Vector menu Data Management Tools Merge shapefiles to one 11
 After you've chosen your input files, click Browse to select the output folder and output shapefile name. Click Add result to map canvas to have the new layer added to your map.")
 QGIS has the same functionality for dealing with projections as other desktop GIS packages.")
12 e) You can either check Select by layers in the folder to choose individual shapefiles to merge, or leave that unchecked and just select the folder whose shapefiles are to be merged. f) After you've chosen your input files, click Browse to select the output folder and output shapefile name. Click Add result to map canvas to have the new layer added to your map. 11) Working with Projections a) If you're not familiar with coordinate systems contact Kurt Menke and he will provide you with some background information. b) QGIS has the same functionality for dealing with projections as other desktop GIS packages. You can: i) Assign a coordinate reference system (CRS) to your project and QGIS can then project data on the fly. ii) Define the CRS of a data layer if it is undefined. iii) Reproject a data layer to a new projection if need be. c) Documentation for all of this can be found here: projections.html 12
A Practical Guide to Using QGIS
 A Practical Guide to Using QGIS 1.1 INTRODUCTION Quantum GIS (QGIS) is a useful mapping software that enables the compilation and displaying of spatial data in the form of a map. Gaining experience in
QGIS Workshop Su Zhang and Laura Gleasner 11/10/2016. QGIS Workshop
 1. Introduction to Quantum GIS (QGIS) QGIS Workshop QGIS is a free and open source Geographic Information System (GIS). QGIS can help you create, edit, visualize, and publish geospatial information on
QGIS Workshop Su Zhang and Laura Gleasner 11/15/2018. QGIS Workshop
 1. Introduction to QGIS QGIS Workshop QGIS is a free and open source Geographic Information System (GIS). QGIS can help users create, edit, visualize, analyze, and publish geospatial information on various
QUANTUM GIS GUIDE FOR WASH FACILITY DATA COLLECTORS AND -MANAGERS
 COWASH Training Quantum GIS 1 QUANTUM GIS GUIDE FOR WASH FACILITY DATA COLLECTORS AND -MANAGERS Quantum GIS (QGIS) is widely used open source GIS software which usage is very similar to GIS-software market
Orchard Link Mapping Workshop (QGIS Training) Contact
 Contact") Orchard Link Mapping Workshop (QGIS Training) Contact email: info@neetmaps.co.uk for technical support, bespoke mapping or further information or visit www.neetmaps.co.uk 1 2 1: Introduction to QGIS What
Orchard Link Mapping Workshop (QGIS Training) Contact email: info@neetmaps.co.uk for technical support, bespoke mapping or further information or visit www.neetmaps.co.uk 1 2 1: Introduction to QGIS What
GGR 375 QGIS Tutorial
 GGR 375 QGIS Tutorial With text taken from: Sherman, Gary E. Shuffling Quantum GIS into the Open Source GIS Stack. Free and Open Source Software for Geospatial (FOSS4G) Conference. 2007. Available online
Introduction to QGIS: Student Workbook
 2016 Introduction to QGIS: Student Workbook Created by: MARK DE BLOIS, CEO / FOUNDER, UPANDE LIMITED WITH SUPPORT FROM THE WORLD BANK AND THE UK DEPARTMENT FOR INTERNATIONAL DEVELOPMENT (DFID) Module 3:
Introduction to QGIS
 Introduction to QGIS David Kramar, Ph.D. Minnesota State University Moorhead Department of Anthropology and Earth Science http://www.qgis.org/en/site/ Overview of Workshop What is QGIS? How do I get QGIS
MAPLOGIC CORPORATION. GIS Software Solutions. Getting Started. With MapLogic Layout Manager
 MAPLOGIC CORPORATION GIS Software Solutions Getting Started With MapLogic Layout Manager Getting Started with MapLogic Layout Manager 2011 MapLogic Corporation All Rights Reserved 330 West Canton Ave.,
Lesson 2 Installing and Using Quantum GIS (QGIS)
") Lesson 2 Installing and Using Quantum GIS (QGIS) Use file Explorer to open County QGIS portable hard drive provided. The program execute (.exe) will be at the bottom of the list. Double click on the file.
Lesson 2 Installing and Using Quantum GIS (QGIS) Use file Explorer to open County QGIS portable hard drive provided. The program execute (.exe) will be at the bottom of the list. Double click on the file.
Working with demographic grids in QGIS
 Working with demographic grids in QGIS Anna Dmowska dmowska@amu.edu.pl April 2017 1. Introduction SocScape (Social Landscape) is a research project which provides open access to high resolution (30 m)
Exercise 1: Getting to know ArcGIS
 The Scenario You are working for the California Visitor s Commission. You have been asked to prepare a map of California for several dignitaries from out of the country. Your map will need to include enough
Len Preston Chief, Labor Market Information New Jersey Department of Labor & Workforce Development
 Len Preston Chief, Labor Market Information New Jersey Department of Labor & Workforce Development Cooperative project of the State of New Jersey and the U.S. Bureau of the Census serving data users in
Explore some of the new functionality in ArcMap 10
 Explore some of the new functionality in ArcMap 10 Scenario In this exercise, imagine you are a GIS analyst working for Old Dominion University. Construction will begin shortly on renovation of the new
Introduction to using QGIS for Archaeology and History Workshop by the Empirical Reasoning Center
 Introduction to using QGIS for Archaeology and History Workshop by the Empirical Reasoning Center In this workshop, we will cover the basics of working with spatial data, as well as its main uses for archaeology.
Starting the QGIS Program. Exercise 1: Exploring QGIS
 Exercise 1: Exploring QGIS In this exercise you will learn how to open maps, manipulate layers, add spatial data, change symbols, and navigate within QGIS. You will also learn to repair broken data links.
Exercise 1: An Overview of ArcMap and ArcCatalog
 Exercise 1: An Overview of ArcMap and ArcCatalog Introduction: ArcGIS is an integrated collection of GIS software products for building a complete GIS. ArcGIS enables users to deploy GIS functionality
Introduction to QGIS: Instructor s Notes
 2016 Introduction to QGIS: Instructor s Notes Created by: MARK DE BLOIS, CEO / FOUNDER, UPANDE LIMITED WITH SUPPORT FROM THE WORLD BANK AND THE UK DEPARTMENT FOR INTERNATIONAL DEVELOPMENT (DFID) Module
PISCES Installation and Getting Started 1
 This document will walk you through the PISCES setup process and get you started accessing the suite of available tools. It will begin with what options to choose during the actual installation and the
Importing GPS points and Hyperlinking images.
 Geol 3050 GIS for Geologists Exercise 15 Exercise 15 Making a Virtual Fieldtrip: Importing GPS points and Hyperlinking images. Due: Thursday, March 22. Goal: A) Get familiar with importing GPS points and
GST 101: Introduction to Geospatial Technology Lab 2 - Spatial Data Models
 GST 101: Introduction to Geospatial Technology Lab 2 - Spatial Data Models Objective Explore and Understand Spatial Data Models Document Version: 3/3/2015 FOSS4G Lab Author: Kurt Menke, GISP Bird's Eye
Community Health Maps Lab Series
 Community Health Maps Lab Series Lab 6 Data Visualization with Carto Objective Understand how to upload and style data with Carto to create an online visualization of your data Document Version: 2017-08-28(Final)
Tutorial 1: Finding and Displaying Spatial Data Using ArcGIS
 Tutorial 1: Finding and Displaying Spatial Data Using ArcGIS This tutorial will introduce you to the following: Websites where you may browse to find geospatial information Identifying spatial data, usable
All data is in Universal Transverse Mercator (UTM) Zone 6 projection, and WGS 84 datum.
 Zone 6 projection, and WGS 84 datum.") 111 Mulford Hall, College of Natural Resources, UC Berkeley (510) 643-4539 EXPLORING MOOREA DATA WITH QUANTUM GIS In this exercise, you will be using an open-source FREE GIS software, called Quantum GIS,
111 Mulford Hall, College of Natural Resources, UC Berkeley (510) 643-4539 EXPLORING MOOREA DATA WITH QUANTUM GIS In this exercise, you will be using an open-source FREE GIS software, called Quantum GIS,
Name: Date: June 27th, 2011 GIS Boot Camps For Educators Lecture_3
 Name: Date: June 27th, 2011 GIS Boot Camps For Educators Lecture_3 Practical: Creating and Editing Shapefiles Using Straight, AutoComplete and Cut Polygon Tools Use ArcCatalog to copy data files from:
Basic Tasks in ArcGIS 10.3.x
 Basic Tasks in ArcGIS 10.3.x This guide provides instructions for performing a few basic tasks in ArcGIS 10.3.1, such as adding data to a map document, viewing and changing coordinate system information,
Working with PDF s. To open a recent file on the Start screen, double click on the file name.
 Working with PDF s Acrobat DC Start Screen (Home Tab) When Acrobat opens, the Acrobat Start screen (Home Tab) populates displaying a list of recently opened files. The search feature on the top of the
Geographical Information Systems Institute. Center for Geographic Analysis, Harvard University. LAB EXERCISE 1: Basic Mapping in ArcMap
 Harvard University Introduction to ArcMap Geographical Information Systems Institute Center for Geographic Analysis, Harvard University LAB EXERCISE 1: Basic Mapping in ArcMap Individual files (lab instructions,
EDINA Workshop: Creating a Campus Map and Displaying it in OpenLayers
 Contents Introduction... 2 What steps are involved?... 3 Before you start... 4 Create your campus map... 5 1. Load the basemap data into ArcMap... 5 2. Set up Symbology and Labels of Layers... 6 Improve
LAB 1: Introduction to ArcGIS 8
 LAB 1: Introduction to ArcGIS 8 Outline Introduction Purpose Lab Basics o About the Computers o About the software o Additional information Data ArcGIS Applications o Starting ArcGIS o o o Conclusion To
Intro to GIS (requirements: basic Windows computer skills and a flash drive)
") Introduction to GIS Intro to GIS (requirements: basic Windows computer skills and a flash drive) Part 1. What is GIS. 1. System: hardware (computers, devices), software (proprietary or free), people. 2.
Introduction to GIS Intro to GIS (requirements: basic Windows computer skills and a flash drive) Part 1. What is GIS. 1. System: hardware (computers, devices), software (proprietary or free), people. 2.
The Digital City: Warmoesstraat in 16 th Century
 The Digital City: Warmoesstraat in 16 th Century Manual: Weixuan Li, summer 2017 PART I: A data view of Warmoesstraat and its surroundings You probably have wandered in the restaurant/shop-packed Warmoesstraat
Getting Started with GIS using ArcGIS 10.6 What is GIS? and - Module 1 Creating a map document
 Getting Started with GIS using ArcGIS 10.6 What is GIS? and - Module 1 Creating a map document Marcel Fortin Map & Data Library mdl@library.utoronto.ca 2018 http://mdl.library.utoronto.ca This workshop
Map Preparation. Using QGIS
 Map Preparation Using QGIS Tutorial ID: IGET_GIS_006 This tutorial has been developed by BVIEER as part of the IGET web portal intended to provide easy access to geospatial education. This tutorial is
Budget Reports for All Users
 Budget Reports for All Users Table of Contents: How to Open the MBI - Budgeting Cost Center & Rollup Report..2 How to Open the MBI - Budget Excel Format Cost Center & Rollup Report...7 How to open a TSV
Answer the following general questions: 1. What happens when you right click on an icon on your desktop? When you left double click on an icon?
 Name: Date: June 27th, 2011 GIS Boot Camps For Educators Practical: Explore ArcGIS 10 Desktop Tools and functionality Day_1 Lecture 1 Sources: o ArcGIS Desktop help o ESRI website o Getting to Know ArcGIS
SPATIAL DESIGN NETWORK ANALYSIS sdna in QGIS
 SPATIAL DESIGN NETWORK ANALYSIS sdna in QGIS 1 Installing sdna+ as plugin for QGIS... 2 1.1 Download & Install sdna... 2 1.2 Setting up sdna in QGIS... 3 1.3 Open the sdna toolbox... 5 2 sdna in QGIS Processing
Chapter 7. A Quick Tour of ArcGIS Pro
 Chapter 7 A Quick Tour of ArcGIS Pro Skills you will learn: This tutorial is intended to get you going using ArcGIS Pro, a new desktop application that is part of ArcGIS Desktop. A separate tutorial gives
Equipping Municipalities with GIS Software
 Equipping Municipalities with GIS Software Tutorial for QGIS 2.2 Prepared by Aylo Engineering s.a.r.l. 25/05/2014 www.ayloengineering.com Overview Welcome to the wonderful world of Geographical Information
Using ArcScan for ArcGIS
 ArcGIS 9 Using ArcScan for ArcGIS Copyright 00 005 ESRI All rights reserved. Printed in the United States of America. The information contained in this document is the exclusive property of ESRI. This
HCA ArcGIS. Online Tool - How To Guide V1.0 2/15/2016 HAWAII CONSERVATION ALLIANCE AGOL
 HCA ArcGIS 2/15/2016 Online Tool - How To Guide V1.0 HAWAII CONSERVATION ALLIANCE AGOL Table of Contents What is ArcGIS Online?... 1 Getting Started... 1 Getting a Login... 1 Logging In... 2 Searching
Field Validation. Background: Initial concept: 1 st step:
 Field Validation Background: When creating complex GIS databases, it is essential that all or a significant portion of the digitized (or acquired) data should to be validated; this is done with various
QGIS Tutorials Documentation
 QGIS Tutorials Documentation Release 0.1 Nathaniel Roth November 30, 2016 Contents 1 Installation 3 1.1 Basic Installation............................................. 3 1.2 Advanced Installation..........................................
NEW SKILLS Begin to learn how to add data in QGIS. Exploration of some of the vector and raster analysis capabilities of QGIS
 Lab 3 VECTOR AND RASTER MODELING Last modified 7 May 2014 NEW SKILLS Begin to learn how to add data in QGIS. Exploration of some of the vector and raster analysis capabilities of QGIS 1. In this exercise
Building Vector Layers
 Building Vector Layers in QGIS Introduction: Spatially referenced data can be separated into two categories, raster and vector data. This week, we focus on the building of vector features. Vector shapefiles
Exercise 1-1: Using GPS track data to create a field boundary
 Exercise 1-1: Using GPS track data to create a field boundary Learning objectives: Add QGIS plugins Create a point vector file from a text file Convert GPS tracking points to a field boundary Data folder:
Quick Guide to MapWindow GIS Desktop Application
 Quick Guide to MapWindow 1 Quick Guide to MapWindow GIS Desktop Application Version 2 January 2007 Adapted by Tom Croft. This is a summary user guide for commonly used tools and capabilities and does not
QGIS LAB SERIES GST 103: Data Acquisition and Management Lab 1: Reviewing the Basics of Geospatial Data
 QGIS LAB SERIES GST 103: Data Acquisition and Management Lab 1: Reviewing the Basics of Geospatial Data Objective Explore and Understand Geospatial Data Models and File Formats Document Version: 2014-08-15
Advanced GIS Using GRASS to create SVF and LRM
 Advanced GIS Using GRASS to create SVF and LRM Table of Contents Aims...2 Outcomes...2 How to use this booklet...2 Task 1 Creating a GRASS location from QGIS...3 Task 2 Changing the GRASS Region...8 Task
Launch QGIS. Launch QGIS from. Open window Quantum GIS (Figure 1.1 below) Start All Programs Quantum GIS. QGISIcon on the desk top
 Start All Programs Quantum GIS. QGISIcon on the desk top") QGIS Launch QGIS Launch QGIS from Start All Programs Quantum GIS OR QGISIcon on the desk top Open window Quantum GIS (Figure 1.1 below) 2 Figure 1.1 3 Opening Raster For this exercise we demonstrate three
QGIS Launch QGIS Launch QGIS from Start All Programs Quantum GIS OR QGISIcon on the desk top Open window Quantum GIS (Figure 1.1 below) 2 Figure 1.1 3 Opening Raster For this exercise we demonstrate three
Server Usage & Third-Party Viewers
 Server Usage & Third-Party Viewers October 2016 HiPER LOOK Version 1.4.16.0 Copyright 2015 PIXIA Corp. All Rights Reserved. Table of Contents HiPER LOOK Server Introduction... 2 Google Earth... 2 Installation...2
Download the Latest LTR QGIS version (2.18) from the QGIS website: download.qgis.org/ >> Settings > Options > Locale
 from the QGIS website: download.qgis.org/ >> Settings > Options > Locale") Exercise 1: Introduction to QGIS Aim: To understand the basis of GIS To learn the basics of a GIS software (QGIS) INTRODUCTION Software Access Download the Latest LTR QGIS version (2.18) from the QGIS
Exercise 1: Introduction to QGIS Aim: To understand the basis of GIS To learn the basics of a GIS software (QGIS) INTRODUCTION Software Access Download the Latest LTR QGIS version (2.18) from the QGIS
Working with tables. Using Quantum GIS
 Using Quantum GIS Tutorial ID: IGET_GIS_008 This tutorial has been developed by BVIEER as part of the IGET web portal intended to provide easy access to geospatial education. This tutorial is released
Using ArcGIS 10.x Introductory Guide University of Toronto Mississauga Library Hazel McCallion Academic Learning Centre
 Using ArcGIS 10.x Introductory Guide University of Toronto Mississauga Library Hazel McCallion Academic Learning Centre FURTHER ASSISTANCE If you have questions or need assistance, please contact: Andrew
Press the Plus + key to zoom in. Press the Minus - key to zoom out. Scroll the mouse wheel away from you to zoom in; towards you to zoom out.
 Navigate Around the Map Interactive maps provide many choices for displaying information, searching for more details, and moving around the map. Most navigation uses the mouse, but at times you may also
A Basic Guide to Modeling Landscapes in Google SketchUp
 DYNASCAPE SOFTWARE INC. A Basic Guide to Modeling Landscapes in Google SketchUp A DS Sketch 3D User Guide Volume 2 This guide will take you through the steps of creating a 3D model of a landscape in Google
Using Spatial Data in a Desktop GIS; QGIS 2.8 Practical 2
 Using Spatial Data in a Desktop GIS; QGIS 2.8 Practical 2 Practical 2 Learning objectives: To work with a vector base map within a GIS and overlay point data. To practise using Ordnance Survey mapping
Chapter 6. Building Maps with ArcGIS Online
 Chapter 6 Building Maps with ArcGIS Online Summary: ArcGIS Online is an on-line mapping software that allows you to upload tables with latitude and longitude geographic coordinates to create map layers
ArcScan for ArcGIS Tutorial
 ArcGIS 9 ArcScan for ArcGIS Tutorial Copyright 00 008 ESRI All rights reserved. Printed in the United States of America. The information contained in this document is the exclusive property of ESRI. This
Office of Geographic Information Systems
 Office of Geographic Information Systems Print this Page Fall 2012 - Working With Layers in the New DCGIS By Kent Tupper The new version of DCGIS has access to all the same GIS information that our old
Software Tutorial for the Installation of Quantum GIS 1.8
 Software Tutorial for the Installation of Quantum GIS 1.8 JOU1526 - COMPUTER-ASSISTED REPORTING Algonquin College Fall Semester 2013 Professor : David McKie GIS Assistant: Matt Pulleyblank 1 Installation
The ArcMap Interface and Using Basic ArcMap Analysis Tools to Create a Map
 The ArcMap Interface and Using Basic ArcMap Analysis Tools to Create a Map *You will need a computer with ESRI ArcGIS Desktop version 9.3 or higher installed* Data Download 1. Save the zipped folder with
How to plot a species distribution on a simple map of New Zealand from an Excel file
 How to plot a species distribution on a simple map of New Zealand from an Excel file This is a very simple step by step guide created by a beginner using QGIS for a beginner using QGIS. It will help you
In order to follow this set of directions you will need the following
 How to Create Maps & Figures in ArcView 9x In order to follow this set of directions you will need the following 1) the Jenny s Louisiana GIS Instructional CD 2) a computer with ArcGIS on it (version 9.0
Banknote Mate 2018 User's Guide
 User's Guide Table of Contents Welcome to 3 Download and Install 3 Running Banknote Mate for the First Time 4 Register/Validating Program 4 Navigate Through Program 5 Home 7 Collection 7 Adding Banknotes...
Introduction to GIS & Mapping: ArcGIS Desktop
 Introduction to GIS & Mapping: ArcGIS Desktop Your task in this exercise is to determine the best place to build a mixed use facility in Hudson County, NJ. In order to revitalize the community and take
Searching and Downloading OpenStreetMap Data
 Searching and Downloading OpenStreetMap Data QGIS Tutorials and Tips Author Ujaval Gandhi http://www.spatialthoughts.com This work is licensed under a Creative Commons Attribution 4.0 International License.
MAPLOGIC CORPORATION. GIS Software Solutions. Getting Started. With MapLogic Layout Manager
 MAPLOGIC CORPORATION GIS Software Solutions Getting Started With MapLogic Layout Manager Getting Started with MapLogic Layout Manager 2008 MapLogic Corporation All Rights Reserved 330 West Canton Ave.,
Exercise 03 Creating and Editing Shapefiles Assigned Feb. 2, 2018 Due Feb. 9, 2018
 Exercise 03 Creating and Editing Shapefiles Assigned Feb. 2, 2018 Due Feb. 9, 2018 On the class website I've posted an exercise_03_data.zip file which contains a USGS 7.5' quad map of Laramie (as laramie_quad_usgs_1963.tiff)
QGIS for Geoscientists
 QGIS for Geoscientists Robin Armit, Tom Carmichael, Lachlan Grose Monash Structural Geophysics group 22 nd 26th February 2016 GIS A geographic information system (GIS) is a system designed to capture,
QGIS LAB SERIES GST 102: Spatial Analysis Lab 7: Raster Data Analysis - Density Surfaces
 QGIS LAB SERIES GST 102: Spatial Analysis Lab 7: Raster Data Analysis - Density Surfaces Objective Learn Density Analysis Methods Document Version: 2014-07-11 (Beta) Contents Introduction...2 Objective:
Introduction. Uploading and Syncing Files. Google Drive and Docs Uploading and Syncing Files. Uploading Files to Google Drive.
 Google Drive and Docs Uploading and Syncing Files Introduction Page 1 Google Drive makes it easy to store and access your files online in the cloud, allowing you to access them from any computer with an
CHAPTER 2 GEOREFERENCING AND SHAPEFILE CREATION
 CHAPTER 2 GEOREFERENCING AND SHAPEFILE CREATION Georeferencing is the process of assigning real-world coordinates to each pixel of the raster. These coordinates are obtained by doing field surveys - collecting
Accessing OGC Services To access OGC WMS and WFS open the service in the directory that you want to consume, and click on either WMS or WFS.
 Using Web Services Web Services Overview This user guide contains instructions on how to consume a range of services through a range of both web based and desktop GIS applications. Web services are a live
GEOG4017 Geographical Information Systems Lab 3 Data Collection and Integration (I)
") DEPARTMENT OF GEOGRAPHY HONG KONG BAPTIST UNIVERSITY Prof. Q. Zhou GEOG4017 Geographical Information Systems Lab 3 Data Collection and Integration (I) Objectives Before we can use GIS for any analysis
DEPARTMENT OF GEOGRAPHY HONG KONG BAPTIST UNIVERSITY Prof. Q. Zhou GEOG4017 Geographical Information Systems Lab 3 Data Collection and Integration (I) Objectives Before we can use GIS for any analysis
USING DATA DRIVEN PAGES
 USING DATA DRIVEN PAGES Mid-West ESRI Utility User s Group Conference March 26, 2014 Presented by: Hillary Bjorstrom, GIS Analyst STAR Energy Services LLC Alexandria, Minnesota EXERCISE 1 CREATING A GRID
QGIS LAB SERIES GST 102: Spatial Analysis Lab 2: Introduction to Geospatial Analysis
 QGIS LAB SERIES GST 102: Spatial Analysis Lab 2: Introduction to Geospatial Analysis Objective Understand Attribute Table Joins and Data Classification Document Version: 2014-06-16 (Beta) Contents Introduction...2
Community Health Maps Lab Series
 Community Health Maps Lab Series Lab 5 Cartography with QGIS Objective Understand how to style data and compose a map with QGIS Desktop Document Version: 2017-08-28(Final) This course is a collaborative
ADOBE DREAMWEAVER CS4 BASICS
 ADOBE DREAMWEAVER CS4 BASICS Dreamweaver CS4 2 This tutorial focuses on the basic steps involved in creating an attractive, functional website. In using this tutorial you will learn to design a site layout,
-In windows explorer navigate to your Exercise_4 folder and right-click the DEC_10_SF1_P1.csv file and choose Open With > Notepad.
 BIOL 4460/5460 and GEOL 4460 Introduction to GIS LAB 4 MAKING A THEMATIC MAP This exercise is to show you how to create a map for printing. As you have seen in the lecture, maps can have different purposes
CHAPTER 5 DIGITAL ELEVATION MODEL AND 3D VISUALIZATION
 CHAPTER 5 DIGITAL ELEVATION MODEL AND 3D VISUALIZATION A digital elevation model (DEM) is a digital model or 3D representation of a terrain's surface. A DEM can be represented as a raster (a grid of squares,
Step by Step How to Manual
 www.quintewestmaps.com Step by Step How to Manual Click on to accept the disclaimer and go to the web GIS Step by Step Web Based GIS Interface Layout of Web Based GIS Save your Favorite Map Views Link
Select the Parks within Forest Acres
 Select the Parks within Forest Acres TASKS RESULT 1. Add the county boundary, municipalities and parks (pts.) layers to your map 2. Save your map (.mxd) to your desktop Your map should look something like
WhatsUp Gold 2016 Distributed Edition
 WhatsUp Gold 2016 Distributed Edition Contents Using WhatsUp Gold Distributed Edition 1 About WhatsUp Gold Distributed Edition... 1 About Distributed Edition's reporting capabilities... 2 Installing the
The Event Visualization Tool (evis) User's Guide. For use with QGIS version 1.2.0
 User's Guide. For use with QGIS version 1.2.0") For use with QGIS version 1.2.0 1 Table of Contents 1. 2. 3. 4. 5. 6. 7. 8. About evis... 3 Conventions used in this guide... 3 Installing the evis plugin... 3 Event Browser... 4 4.1. Launch the Event
For use with QGIS version 1.2.0 1 Table of Contents 1. 2. 3. 4. 5. 6. 7. 8. About evis... 3 Conventions used in this guide... 3 Installing the evis plugin... 3 Event Browser... 4 4.1. Launch the Event
Review of File Management and Introduction to ArcGIS
 Review of File Management and Introduction to ArcGIS RNR/GEOG 417/517 Overview of Presentation Discuss the objectives of the lab exercise Introduce the class directory structure General file policies Introduce
Administrative Training Mura CMS Version 5.6
 Administrative Training Mura CMS Version 5.6 Published: March 9, 2012 Table of Contents Mura CMS Overview! 6 Dashboard!... 6 Site Manager!... 6 Drafts!... 6 Components!... 6 Categories!... 6 Content Collections:
Chrome. Browsing in Chrome. The Omnibox. Video: Browsing in Chrome. To use the Omnibox: Omnibox suggestion icons. Page 1
 Chrome Browsing in Chrome Browsing in Chrome Page 1 Chrome makes browsing the Web quick and easy. In this lesson, we'll talk about navigating to websites in Chrome. You'll also learn how use tabs, access
1. Download Federal Electoral Districts and add to map document
 1. Download Federal Electoral Districts and add to map document Federal Electoral Districts (FEDs) are the geographic areas for which one Member of Parliament is elected. It is downloaded as a shapefile
Exercise 4.1. Create New Variables in a Shapefile. GIS Techniques for Monitoring and Evaluation of HIV/AIDS and Related Programs
 GIS Techniques for Monitoring and Evaluation of HIV/AIDS and Related Programs Exercise 4.1 Create New Variables in a Shapefile *This training was developed as part of a joint effort between MEASURE Evaluation
ArcGIS Online (AGOL) Quick Start Guide Fall 2018
 Quick Start Guide Fall 2018") ArcGIS Online (AGOL) Quick Start Guide Fall 2018 ArcGIS Online (AGOL) is a web mapping tool available to UC Merced faculty, students and staff. The Spatial Analysis and Research Center (SpARC) provides
ArcGIS Online (AGOL) Quick Start Guide Fall 2018 ArcGIS Online (AGOL) is a web mapping tool available to UC Merced faculty, students and staff. The Spatial Analysis and Research Center (SpARC) provides
GIS DATA SUBMISSION USER GUIDE. Innovation and Networks Executive Agency
 Innovation and Networks Executive Agency GIS DATA SUBMISSION USER GUIDE Innovation and Networks Executive Agency (INEA) W910 Chaussée de Wavre 910 B-1049 Brussels, Belgium Tel: +32 (0)2 29 95252 Fax: +32
GIS LAB 8. Raster Data Applications Watershed Delineation
 GIS LAB 8 Raster Data Applications Watershed Delineation This lab will require you to further your familiarity with raster data structures and the Spatial Analyst. The data for this lab are drawn from
Visual Studies Exercise.Topic08 (Architectural Paleontology) Geographic Information Systems (GIS), Part I
 Geographic Information Systems (GIS), Part I") ARCH1291 Visual Studies II Week 8, Spring 2013 Assignment 7 GIS I Prof. Alihan Polat Visual Studies Exercise.Topic08 (Architectural Paleontology) Geographic Information Systems (GIS), Part I Medium: GIS
ARCH1291 Visual Studies II Week 8, Spring 2013 Assignment 7 GIS I Prof. Alihan Polat Visual Studies Exercise.Topic08 (Architectural Paleontology) Geographic Information Systems (GIS), Part I Medium: GIS
Exercise 3-1: Soil property mapping
 Exercise 3-1: Soil property mapping Mapping objectives: Create a soil analysis point layer from tabular data in QGIS Create a continuous surface soil property map using Kriging Interpolation in SAGA GIS
ArcGIS Extension User's Guide
 ArcGIS Extension 2010 - User's Guide Table of Contents OpenSpirit ArcGIS Extension 2010... 1 Installation ( ArcGIS 9.3 or 9.3.1)... 3 Prerequisites... 3 Installation Steps... 3 Installation ( ArcGIS 10)...
Measuring Area/Length of Organisms with GIS
 Measuring Area/Length of Organisms with GIS These instructions enable you to measure the length and area of microscopic organisms in ArcGIS from digital photographs. The four-step process involves: georeferencing
Introduction to basic GIS. International Federation of Red Cross and Red Crescent Societies Information Management Team. September 2017 Version 1.
 Introduction to basic GIS International Federation of Red Cross and Red Crescent Societies Information Management Team September 2017 Version 1.0 Introduction This is a basic GIS guidance document created
Lab 18c: Spatial Analysis III: Clip a raster file using a Polygon Shapefile
 Environmental GIS Prepared by Dr. Zhi Wang, CSUF EES Department Lab 18c: Spatial Analysis III: Clip a raster file using a Polygon Shapefile These instructions enable you to clip a raster layer in ArcMap
IntraMaps End User Manual
 IntraMaps End User Manual For IntraMaps Version 8 Date: 6 th July 2014 Contents Introduction... 4 What is IntraMaps?... 4 Application... 5 Main Toolbar... 6 View... 7 Original View:... 7 Pan:... 7 Zoom