AcqDemo Pay Pool Analysis Tool (PAT) User Guide
|
|
|
- Jesse Perkins
- 6 years ago
- Views:
Transcription
1 AcqDemo Pay Pool Analysis Tool (PAT) User Guide December 2014 The spreadsheet is a Microsoft Excel workbook called PAT 2014 v1.0 consisting of eighteen tabbed worksheets. The PAT was created for AcqDemo to analyze the results of the pay pool process; it provides a view across pay pools. AcqDemo Personnel Policy Boards may use this tool to analyze aggregated pay pool results. Individual pay pool managers may benefit by using the PAT to review results also as it offers an analysis that goes beyond the functions of the Compensation Management Spreadsheet (CMS). This user guide details how to use the functionalities of the PAT and describes the available reports. The seventeen tabbed worksheets are described in this document in the order in which they appear along the bottom of the workbook. Page Getting Started...2 Instructions Worksheet...4 Data Worksheet...7 Statistics Worksheet.10 Rating Statistics Worksheet.11 Distribution by Group Worksheet 12 Zone Distribution by Group Worksheet...13 Payout Statistics Worksheet Payout Charts Worksheet.15 Payout Stats by Group Worksheet...16 Payout Charts by Group Worksheet 17 Payout Charts by Wildcard Worksheet...18 Funding Statistics Worksheet..19 Funding Charts Worksheet..20 Net Draw Analysis Worksheet 21 Net Draw Charts Worksheet...22 CP-PB Counts Worksheet...23 Salary Worksheet...24 Rail Report Worksheet 25 Generating an Aggregate Report.26 Copying and Pasting into PowerPoint and Excel...27 Prepared by: SRA International, Inc Northeast Loop 410, Suite 510 San Antonio, TX The views, opinions, and findings contained in this document are those of the authors and should not be construed as an official Department of Defense position, policy, or decision unless so designated by other official documentation.

2 Getting Started The PAT workbook may be downloaded from the Pay Pool Notices section of CAS2Net located at User access to CAS2Net is authenticated by DoD s e- Authentication system upon log-in. Enable Macros The macros must be enabled each time you open the spreadsheet in order for the functions to operate correctly. When opening the spreadsheet, you will likely receive a Security Warning. Select Enable Content to enable the macros v1 Add-Ins Menu Bar The PAT has a custom tool bar that appears at the top of each worksheet. Click on the Add-ins tab on the menu to view the options for displaying, organizing and printing data. Import Import data using this button or the Import link on the Instructions worksheet. Hide Column The user may hide columns from view by selecting any cell in the columns to be hidden and then clicking on this button. Single columns are selected by clicking on any cell in 2
3 the column. Multiple columns are selected by holding down the <Ctrl> key while clicking on any cells in the columns. A range of columns is selected by clicking and dragging across any row of cells in the range of columns. The first two columns (A and B) cannot be hidden by this method. Unhide Column Clicking this button will unhide columns you have just hidden as long as you have not moved the cursor. You can also unhide a specific column or range of columns by highlighting cells in the columns on either side of the hidden column or range of columns, and then clicking this button. Unhide All Columns This button restores to view all hidden columns. Hide Row The user may hide rows from view by selecting any cell in the row or rows to be hidden and then clicking on this button. A single row is selected by clicking on any cell in the row. Multiple rows are selected by holding down the <Ctrl> key while clicking on any cells in the rows. A range of rows is selected by clicking and dragging up or down any column of cells. Unhide Row Clicking this button will unhide rows you have just hidden as long as you have not moved the cursor. You can also unhide a specific row or range of rows by highlighting cells in the rows on either side of the hidden rows or range of rows, and then clicking this button. Unhide All Rows This button restores to view all hidden rows. Clear All Filters This button clears all filters you have set, including filters on worksheets other than the one you are currently on. You cannot import data into the workbook with filters set. When you click the Import link on the Contents sheet, all filters are automatically cleared. Sort Allows the user to sort the rows in the worksheet by any combination of up to three columns. Sorts may be in either ascending or descending order. The sorts are specified using the standard Excel sort function. You must know the letters of the columns you want to sort on because the column headings cannot be included in the sort range. Main Menu This takes you to the Instructions worksheet with quick links to the worksheets. Wildcard Stats A window appears allowing you to select the Wildcard columns to be used in statistical reports. The Wildcard values are pulled from the Data tab. Customize You can reorder and rename pay pools with this button. You can also move Wildcards in the desired order. Output Charts Brings up a user form that allows output of any/all chart into Excel or PowerPoint format. Charts are exported as pictures only. Generate Aggregate Report Pay pools provide summary feedback to the workforce. This button generates a report that displays aggregate data for rail zones, OCS, delta OCS, salary increases and awards. 3
4 Instructions Worksheet The Instructions worksheet (shown below) is the first sheet in the workbook. It provides a brief description of the workbook, its purpose, and contents. The Import function to upload the data to be analyzed is initiated on this sheet. The Table of Contents lists the worksheets that are available to aid in your analysis. You may navigate to each sheet by clicking on the name in the Table of Contents list or by using the tabs at the bottom of the workbook v1 Scroll down the Instructions sheet and you ll find status information for the data contained in your workbook, including the last Wildcard analyzed and the names (office symbol and alias if assigned) of the pay pools currently loaded into the PAT. 4

5 The pay pool alias name is an option you may use if you are interested in giving your pay pools more meaningful names. Go to the Add-ins menu bar and select the Customize button. Use the Rename feature to assign an alias name. Import The PAT initially comes empty and must be populated with data by importing one or more export files from CMS spreadsheets. You may import more than one file at the same time. As a reminder, all files you want to import must be in the same folder as the PAT. Use the following steps to import data: 1. Open the PAT and enable the macros. 2. Ensure the CMS export files you want to import are in the same folder as the PAT. 3. Select the Import function on the Instructions worksheet. 4. See the available files listed in the left-hand box in the Import window. 5


6 5. Double click on the file you want to import or use the double-right facing arrow. This moves a copy of the file to the right-hand box for import. Repeat for each file you want to import. 6. Use the Move up and Move down buttons to reorder your selections. Order the pay pool files here as you would like to see them displayed in the PAT worksheets. 7. Use the radio buttons to indicate if you want the imported data to replace all existing data or if you want to append (add) the import file(s) to existing data. 8. Select the Open button to import the selected files to the PAT. 9. A pop-up box will appear letting you know the import was successful. Select Yes to save the spreadsheet. Once you have selected the files, it will take the workbook up to several minutes (depending on the size of your file) to import the data and run the many macros required to format it properly. ppnew_to_master_11_23_2014.cvs ppnew_to_master_11_23_2014.cvs ppxyz_to_master_11_20_2014.cvs 6
7 Data Worksheet The Data worksheet contains pay pool data from the CMS. There are 53 columns in the worksheet. The columns contain data such as ratings, salary increases and awards that were calculated during the pay pool process using the CMS. Columns are read-only with the exception of the Wildcard columns. E1 and E2 displays the number of pay pools and employees loaded in the PAT. Wildcard Columns There are 8 Wildcard columns spaced across the worksheet and they are open for editing. Wildcards may be used to review subsets of data to aid in your analysis. You may want to review the results by geographic regions, work teams, or some other criteria not defined by an existing column on the spreadsheet. Wildcards data that existed in the files you imported will be available in the PAT. 7
.")


8 You can change the wildcard groupings used in the PAT by selecting the Wildcard Stats button on the Add-ins menu bar (see above). Only those wildcard columns with data in them will show as available to use and the others will be grayed out. Click on the Wildcard column to be used and select Run Statistics. You ll receive a message indicating the action was successful. Note that you can also remove previously generated statistics by the Wildcard columns in this box. Remove Name and ID You may elect to keep your analysis at the summary level. If so, then names and IDs of individuals may not be required. You can permanently hide names and IDs by selecting the Remove Name and ID button. 8


9 A warning pop-up window will ask if you want to continue. Clicking Yes will permanently hide columns A, B and C from the PAT. A box will appear in the upper left-side corner of the Data worksheet to confirm the names and IDs are securely hidden. 9

10 Statistics Worksheet The Statistics worksheet provides the average rating, average delta OCS, number of employees and number of employees rated by supervisor, sub-panel manager, pay pool and Wildcard if this option was selected. 10

11 Rating Statistics Worksheet The Rating Statistics worksheet displays average OCS and average delta OCS for each career path and broadband level. The Overall column shows the combined averages for all imported pay pools and columns to the right show averages for each pay pool. 11

12 Distributions by Group Worksheet The Distributions by Group worksheet provides counts and percentages of employees by rail position for various groups. Distributions are shown by pay pool, career path, broadband, career path/band, Wildcard, and the entire population. Rail Positions A = above the upper rail B = below the lower rail C1 = above the standard pay line but below the upper rail C2 = on or below the standard pay line but above the lower rail 12
13 Zone Distribution by Group Worksheet The Zone Distribution by Group worksheet displays zone distribution charts by pay pool and wildcard. The top chart is a bar graph displaying zone distributions overall and by each pay pool loaded in the PAT. The bottom chart shows the distribution by the Wildcard groupings. Both charts have a trend line showing the average across the groupings. Rail Positions A = above the upper rail B = below the lower rail C1 = above the standard pay line but below the upper rail C2 = on or below the standard pay line but above the lower rail 13

14 Payout Statistics Worksheet The Payout Statistics worksheet provides statistics on salary increases, awards and related data across all pay pools and by each pay pool. The majority of the worksheet provides the minimum, average, median, and maximum in terms of dollar amounts and percentages for salary increases and awards. Specifically, the following data elements are provided: Analyzed Population Overall and by each individual pay pool loaded in the PAT Average OCS Average Delta OCS Alpha 1 Percent applied to delta salary to buy back the difference between employees current salaries and the target salaries for CRI Alpha 2 Percent applied to delta salary to buy back the difference between employees current salaries and the target salaries for CA Salary Increase $ - Minimum (non zero), Average, Median, Maximum Salary Increase % - Minimum (non zero), Average, Median, Maximum Flags Override CRI, Override CA, Disable Rollover, Force Rollover Control Points Number with Control Points Entered, Number Stopped at Control Point Carryover Award $ Number of Carryover Awards, Minimum (non-zero), Average, Median, Maximum Carryover Award % - Minimum (non-zero), Average, Median, Maximum CA Award $ - Minimum (non-zero), Average, Median, Maximum CA Award % - Minimum (non-zero), Average, Median, Maximum Award (Carryover + CA) Total - Minimum (non-zero), Average, Median, Maximum Award Total % - Minimum (non-zero), Average, Median, Maximum 14

15 Payout Charts Worksheet The Payout Charts worksheet displays the payout statistics provided in the Payout Statistics worksheet in chart form. The charts are bar graphs showing average percent and average dollar amount by pay pool. A trend line shows the average across pay pools. This worksheet contains the following charts: Alpha 1 Alpha 2 Average Salary Increase Average Carryover Award Average Contribution Award Average Total Award 15

16 Payout Statistics by Group Worksheet The Payout Statistics by Group worksheet provides statistics on salary increase and award, both dollar amount and percent, by various groups and Wildcard. Statistics are shown for the entire population and by pay pool, career path, broadband, career path/band, and Wildcard. 16

17 Payout Charts by Group Worksheet The Payout Charts by Group displays bar charts of the statistics ($ and %) provided by Payout Statistics by Group worksheet. A trend line shows the average across pay pools. This worksheet contains the following charts: Average Salary Increase by Career Path Average Salary Increase by Band Average Salary Increase by Career Path/Band Average Total Award by Career Path Average Total Award by Band Average Total Award by Career Path/Band Average Carryover Award by Career Path Average Carryover Award by Band Average Carryover Award by Career Path/Band 17

18 Payout Charts by Wildcard Worksheet The Payout Charts by Wildcard worksheet displays bar charts of the statistics ($ and %) for the Wildcard selected for analysis on the Payout Statistics by Group worksheet. A trend line shows the average across groups. This worksheet contains the following charts: Average Salary Increase by Wildcard Average Carryover Award by Wildcard Average Total Award by Wildcard 18

19 Funding Statistics Worksheet The Funding Statistics worksheet provides statistics on funding amounts budgeted and allocated through the pay pool process. The budget is represented in the Inputs section and the allocations are represented in the Outputs section. Data is provided across pay pools and by individual pay pool. Number of employees and total base salaries are presented at the top of the sheet. A code of 1=Yes and 0=No indicates if CA was used. Inputs include the dollar amount and percent budgeted for salary increases and awards. Outputs include the approved salary increases/awards totals and the difference between the budgeted amount and the amount allocated. This section also provides the percent of total base salary spent on salary increases and carryover and the percent of adjusted salary spent on awards. 19
 Funding CRI Expenditure carryover amount identified Award (CA) Funding Award Expenditure Alpha 1 (CRI) Alpha 2")
20 Funding Charts Worksheet The Funding Charts worksheet displays bar charts of the statistics (%) provided by the Funding Statistics worksheet. A trend line shows the average across pay pools. This worksheet contains the following charts by pay pool: Salary Increase (CRI) Funding CRI Expenditure carryover amount identified Award (CA) Funding Award Expenditure Alpha 1 (CRI) Alpha 2 (CA) 20

21 Net Draw Analysis Worksheet The Net Draw Analysis worksheet provides a summary of net draw statistics by career path/band, career path, broadband, Wildcard, and the entire population. This analysis considers the difference between the amount of an employee s payout and the dollar amount that was contributed to the pay pool fund based on the employee s base salary and the funding criteria. The formula is as follows: Net Draw % = (Received Contribution) / Base Pay If an employee receives a payout greater than the dollar amount that was contributed to the pay pool fund as a percent of their base salary, then the net draw is a positive percent. The net draw percent is a negative if the employee receives a lesser amount in a payout than what was contributed to the pay pool fund as a percent of their base salary. Example An employee earns $60,000. The pay pool is funded at 2% of total base salaries. The employee contributed $1,200 to the fund which represents 2% of her base salary. The employee received a $2,000 payout resulting in a positive net draw she received a greater payout than was her contribution to the pay pool fund. Had the employee received a $1,000 payout, her net draw would be a negative percent. Number of Employees Analyzed 21
22 Net Draw Charts Worksheet The Net Draw Charts worksheet displays bar charts of the statistics (%) provided by the Net Draw Analysis worksheet. This worksheet contains the following charts: Net Draw by Career Path/Band Net Draw by Career Path Net Draw by Band Net Draw by Wildcard The bars above the axis are groups that have contributed less in base salary dollars than they received in payouts. Groups with bars below the axis contributed more than they received in payouts. 22

23 CP-BP Counts Worksheet The CP-BP Counts worksheet displays counts by career path and broadband combinations overall and by pay pool. 23

24 Salary Worksheet The Salary worksheet provides the average salary by career path and broadband for the entire population and for each pay pool. 24
25 Rail Report Worksheet The Rail Report Worksheet displays a report of rail zones and an OCS chart that is used for the Aggregate Report generated from the Add-Ins menu bar. You may take a glance at the OCS chart and rail zone distribution on this worksheet for your information but it is recommended that you use the Generate Aggregate Report function in the Add-Ins menu bar to create the summary charts to present aggregate data. 25
26 Generating an Aggregate Report The Generate Aggregate Report button in the Add-Ins menu bar creates a report that displays aggregate data for rail zones, OCS, delta OCS, salary increases and awards. When you select this button, a PowerPoint file opens and you receive a prompt to name and save the file. The charts are imported into PowerPoint as pictures. AcqDemo Results FY14 AcqDemo Results FY14 26

27 Copying and Pasting into PowerPoint and Excel You can output charts directly from the PAT into PowerPoint presentations and into Excel. There is an Output Charts function in the Add-Ins menu bar. Using this function ensures charts placed into the applications are minus the underlying data. Copying Charts into PowerPoint To copy charts from the PAT into PowerPoint: 1. Click on the Output Charts button in the Add-Ins menu bar. This opens a selection window listing the available worksheets and charts. 2. Select the worksheet and the specific chart(s) you want to capture. 3. Under Applications Options, select the radio button for Paste into PowerPoint. 4. Select the Export Charts button. This opens a new PowerPoint file with your selected charts and a prompt to name and save the file. Charts are imported into PowerPoint as pictures. 27


28 Copying Charts into Excel To copy charts from the PAT into Excel: 1. Click on the Output Charts button in the Add-Ins menu bar. This opens a selection window listing the available worksheets and charts. 2. Select the worksheet and the specific chart(s) you want to capture. 3. Under Applications Options, select the radio button for Paste into Excel. 4. Select the Export Charts button. This opens an Excel file with your selected charts and a prompt to name and save the file. Charts are imported into Excel as pictures. 28

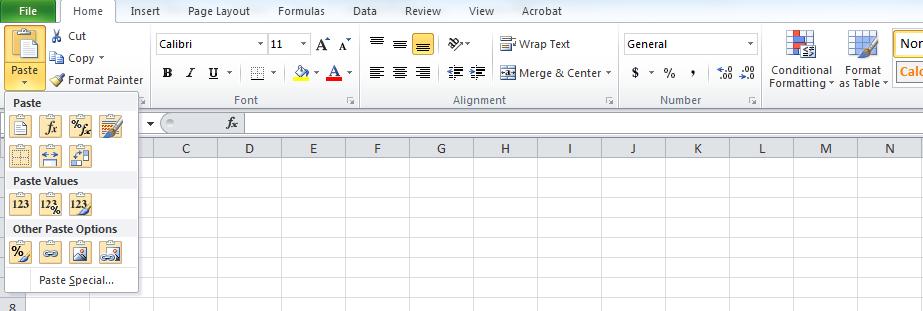
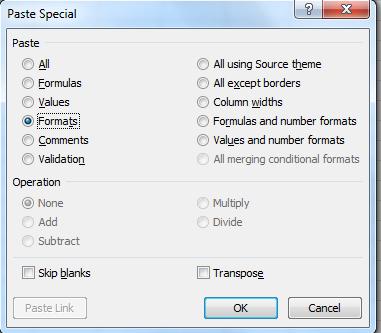
29 Copying Data from Worksheets You can copy and paste data from the PAT to another Excel file to conduct additional analysis or to create additional views. To copy selected data to a new spreadsheet: 1. Select the cells you want to copy. 2. Select Copy from the Home menu bar or right click and select Copy. 3. Open the spreadsheet you want to copy the data into. 4. Select Paste Special from the Home menu bar or right click and select Paste Special. 5. Select the Values radio button under Paste in the Paste Special window and click OK. The data will be pasted as it exists in the PAT worksheet including any hidden columns. 6. As an extra step to allow the data to look more presentable in the new location, immediately select Paste Special again and select Formats. 29
30 30
SUB-PANEL SPREADSHEET GUIDE (SUB-PANELUG)
") United States Department of Defense (DoD) Acquisition Workforce Demonstration Project (AcqDemo) Contribution-based Compensation and Appraisal System Software (CAS2Net) Developed under Contract OPM1912C0033
United States Department of Defense (DoD) Acquisition Workforce Demonstration Project (AcqDemo) Contribution-based Compensation and Appraisal System Software (CAS2Net) Developed under Contract OPM1912C0033
Compensation Workbench
 Compensation Workbench Contents Logging into Compensation Workbench... 3 Compensation Allocations Page... 4 Viewing Job History... 5 Viewing Employee Details... 6 Viewing Compensation History... 7 Entering
Working with Data in Microsoft Excel 2010
 Working with Data in Microsoft Excel 2010 This document provides instructions for using the sorting and filtering features in Microsoft Excel, as well as working with multiple worksheets in the same workbook
SPREADSHEET (Excel 2007)
") SPREADSHEET (Excel 2007) 1 U N I T 0 4 BY I F T I K H A R H U S S A I N B A B U R Spreadsheet Microsoft Office Excel 2007 (or Excel) is a computer program used to enter, analyze, and present quantitative
SPREADSHEET (Excel 2007) 1 U N I T 0 4 BY I F T I K H A R H U S S A I N B A B U R Spreadsheet Microsoft Office Excel 2007 (or Excel) is a computer program used to enter, analyze, and present quantitative
3/31/2016. Spreadsheets. Spreadsheets. Spreadsheets and Data Management. Unit 3. Can be used to automatically
 MICROSOFT EXCEL and Data Management Unit 3 Thursday March 31, 2016 Allow users to perform simple and complex sorting Allow users to perform calculations quickly Organizes and presents figures that can
Excel Tables & PivotTables
 Excel Tables & PivotTables A PivotTable is a tool that is used to summarize and reorganize data from an Excel spreadsheet. PivotTables are very useful where there is a lot of data that to analyze. PivotTables
Basic Microsoft Excel 2007
 Basic Microsoft Excel 2007 Contents Starting Excel... 2 Excel Window Properties... 2 The Ribbon... 3 Tabs... 3 Contextual Tabs... 3 Dialog Box Launchers... 4 Galleries... 5 Minimizing the Ribbon... 5 The
Using Excel to Troubleshoot EMIS Data
 Using Excel to Troubleshoot EMIS Data Overview Basic Excel techniques can be used to analyze EMIS data from Student Information Systems (SISs), from the Data Collector, and on ODE EMIS reports This session
Using Numbers, Formulas, and Functions
 UNIT FOUR: Using Numbers, Formulas, and Functions T o p i c s : Using the Sort function Create a one-input data table Hide columns Resize columns Calculate with formulas Explore functions I. Using the
Gradebook Entering, Sorting, and Filtering Student Scores March 10, 2017
 Gradebook Entering, Sorting, and Filtering Student Scores March 10, 2017 1. Entering Student Scores 2. Exclude Student from Assignment 3. Missing Assignments 4. Scores by Class 5. Sorting 6. Show Filters
Basic tasks in Excel 2013
 Basic tasks in Excel 2013 Excel is an incredibly powerful tool for getting meaning out of vast amounts of data. But it also works really well for simple calculations and tracking almost any kind of information.
WHY USE EXCEL? KEY EXCEL TERMINOLOGY
 WHY USE EXCEL? Excel allows users to organize, format, and calculate data with formulas using a spreadsheet system broken up by rows and columns. Excel allows us the ability to create templates with multiple
Quick Guide for Excel 2015 Data Management November 2015 Training:
 http://pfw.edu Quick Guide for Excel 2015 Data Management November 2015 Training: http://pfw.edu/training Excel 2016 Data Management AutoFill and Custom Lists AutoFill 1. Select the range that contains
Contents. Group 3 Excel Handouts 2010
 Contents Function Library... 2 Function Operators... 2 Order of Multiple Operators... 2 Function Library... 3 Formula Auditing... 4 Name Cells... 7 Comments... 8 Show Ink... 9 Show Ink is a colorful way
BE Share. Microsoft Office SharePoint Server 2010 Basic Training Guide
 BE Share Microsoft Office SharePoint Server 2010 Basic Training Guide Site Contributor Table of Contents Table of Contents Connecting From Home... 2 Introduction to BE Share Sites... 3 Navigating SharePoint
Microsoft Access 2007 Module 2
 Microsoft Access 007 Module http://pds.hccfl.edu/pds Microsoft Access 007: Module August 007 007 Hillsborough Community College - Professional Development and Web Services Hillsborough Community College
IP4 - Running reports
 To assist with tracking and monitoring HRIS recruitment and personnel, reports can be run from Discoverer Plus. This guide covers the following process steps: Logging in... 2 What s changed? Changed reference
Starting Excel application
 MICROSOFT EXCEL 1 2 Microsoft Excel: is a special office program used to apply mathematical operations according to reading a cell automatically, just click on it. It is called electronic tables Starting
RegressItPC installation and test instructions 1
 RegressItPC installation and test instructions 1 1. Create a new folder in which to store your RegressIt files. It is recommended that you create a new folder called RegressIt in the Documents folder,
Patricia Andrada Quick Guide Excel 2010 Data Management-July 2011 Page 1
 Patricia Andrada Quick Guide Excel 2010 Data Management-July 2011 Page 1 Excel 2010 Data Management AutoFill and Custom Lists AutoFill 1. Select the range that contains the initial value(s) of the series
Planning User Manual
 Planning 11.1.2 User Manual Budget Office May 2011 Hyperion Planning/Workspace/Reports Hyperion Planning Overview.... 3 Logging In.... 3 Setting User Preferences.... 3 Workspace Logging In..4 Navigating
Excel Tables and Pivot Tables
 A) Why use a table in the first place a. Easy to filter and sort if you only sort or filter by one item b. Automatically fills formulas down c. Can easily add a totals row d. Easy formatting with preformatted
Tips & Tricks: MS Excel
 Tips & Tricks: MS Excel 080501.2319 Table of Contents Navigation and References... 3 Layout... 3 Working with Numbers... 5 Power Features... 7 From ACS to Excel and Back... 8 Teacher Notes: Test examples
Excel 2003 Tutorial II
 This tutorial was adapted from a tutorial by see its complete version at http://www.fgcu.edu/support/office2000/excel/index.html Excel 2003 Tutorial II Charts Chart Wizard Chart toolbar Resizing a chart
Subrecipient User Training Guide
 Subrecipient User Training Guide Contents Homepage... 2 1. Subrecipient... 3 2. In Progress Notices of Fund Availability... 6 3. New Financial Activity for In Progress Notices of Fund Availability... 10
Institutional Reporting and Analysis (IRA) For help, blitz "Financial Reports", or
 For help, blitz Financial Reports, or") Institutional Reporting and Analysis (IRA) 1 Training Agenda Introduction to the IRA Reporting Tool Logging onto the system (4-5) Navigating the Dashboard (6-10) Running Reports (11-12) Working with Reports
Institutional Reporting and Analysis (IRA) 1 Training Agenda Introduction to the IRA Reporting Tool Logging onto the system (4-5) Navigating the Dashboard (6-10) Running Reports (11-12) Working with Reports
CHAPTER TWO: SPREADS HEETS WITH EXCEL 1
 CHAPTER TWO: SPREADS HEETS WITH EXCEL 1 CHAPTER 2 SPREADSHEETS WITH EXCEL TOPIC Create Pivot Tables Create and Modify Charts Sort and Filter CHAPTER TWO: SPREADS HEETS WITH EXCEL 2 CREATE AND MODIFY CHARTS
BUDGET ADJUSTMENT FORM INSTRUCTIONS (Revised May 2015)
") BUDGET ADJUSTMENT FORM INSTRUCTIONS (Revised May 2015) The Form allows users to enter budget adjustments into the accounting system. The Form can be downloaded from the Financial Services web site under
BUDGET ADJUSTMENT FORM INSTRUCTIONS (Revised May 2015) The Form allows users to enter budget adjustments into the accounting system. The Form can be downloaded from the Financial Services web site under
Excel Advanced
 Excel 2016 - Advanced LINDA MUCHOW Alexandria Technical & Community College 320-762-4539 lindac@alextech.edu Table of Contents Macros... 2 Adding the Developer Tab in Excel 2016... 2 Excel Macro Recorder...
Basic Microsoft Excel 2011
 Basic Microsoft Excel 2011 Table of Contents Starting Excel... 2 Creating a New Workbook... 3 Saving a Workbook... 3 Creating New Worksheets... 3 Renaming a Worksheet... 3 Deleting a Worksheet... 3 Selecting
Troubleshooting in Microsoft Excel 2002
 Page 1 of 8 Troubleshooting in Microsoft Excel 2002 Result: To understand how to work with the Excel software to enter data, navigate the page, and print materials. Tabs Look at the tabs at the bottom
MicroStrategy Quick Guide: Running the PI Report
 MicroStrategy Quick Guide: Running the PI Report ITS Business Intelligence Group Go to reporting.gmu.edu and click on Login to Microstrategy ACTION Enter User name and Password. Keep default selection
Microsoft Excel 2016 LEVEL 3
 TECH TUTOR ONE-ON-ONE COMPUTER HELP COMPUTER CLASSES Microsoft Excel 2016 LEVEL 3 kcls.org/techtutor Microsoft Excel 2016 Level 3 Manual Rev 11/2017 instruction@kcls.org Microsoft Excel 2016 Level 3 Welcome
IRA Basic Running Financial Reports
 IRA Basic Running Financial Reports Updated 6-7-2013 1 Training Index Part I Introduction to the IRA Reporting Tool IRA Resources (3) Logging onto the system (4) Navigating the Dashboard (5-9) Running
Tableau Tutorial Using Canadian Arms Sales Data
 Tableau Tutorial Using Canadian Arms Sales Data 1) Your data comes from Industry Canada s Trade site. 2) If you don t want to download the data yourself, use this file. You can also download it from the
Using Tables, Sparklines and Conditional Formatting. Module 5. Adobe Captivate Wednesday, May 11, 2016
 Slide 1 - Using Tables, Sparklines and Conditional Formatting Using Tables, Sparklines and Conditional Formatting Module 5 Page 1 of 27 Slide 2 - Lesson Objectives Lesson Objectives Explore the find and
Section 1 Microsoft Excel Overview
 Course Topics: I. MS Excel Overview II. Review of Pasting and Editing Formulas III. Formatting Worksheets and Cells IV. Creating Templates V. Moving and Navigating Worksheets VI. Protecting Sheets VII.
Separate Text Across Cells The Convert Text to Columns Wizard can help you to divide the text into columns separated with specific symbols.
 Chapter 7 Highlights 7.1 The Use of Formulas and Functions 7.2 Creating Charts 7.3 Using Chart Toolbar 7.4 Changing Source Data of a Chart Separate Text Across Cells The Convert Text to Columns Wizard
EXCEL 2007 TIP SHEET. Dialog Box Launcher these allow you to access additional features associated with a specific Group of buttons within a Ribbon.
 EXCEL 2007 TIP SHEET GLOSSARY AutoSum a function in Excel that adds the contents of a specified range of Cells; the AutoSum button appears on the Home ribbon as a. Dialog Box Launcher these allow you to
CalPlan. Creating a Unit Plan Navigating CalPlan Workbook 1/25/18
 CalPlan Creating a Unit Plan Workbook 1/25/18 Table of Contents Exercise 1: Log into the Workspace & Run a CalPlan Report... 3 Exercise 2: Launching CalPlan and Setting Your Entity... 10 Exercise 3: Actualized
Microsoft Excel Basics Ben Johnson
 Microsoft Excel Basics Ben Johnson Topic...page # Basics...1 Workbook and worksheets...1 Sizing columns and rows...2 Auto Fill...2 Sort...2 Formatting Cells...3 Formulas...3 Percentage Button...4 Sum function...4
Making Excel Work for Your Tribal Community
 Making Excel Work for Your Tribal Community Excel Basics: Intermediate Skills PHONE: 1-800-871-8702 EMAIL: INFO@CBC4TRIBES.ORG WEB: TRIBALINFORMATIONEXCHANGE.ORG MAKING EXCEL WORK FOR YOUR TRIBAL COMMUNITY
Downloading General Ledger Transactions to Excel
 SAN MATEO COUNTY OFFICE OF EDUCATION CECC Financial System Procedures This document provides instructions on how to download the transactions listed on an HP 3000 GLD110 report into Excel using a GLD110
Numbers Basics Website:
 Website: http://etc.usf.edu/te/ Numbers is Apple's new spreadsheet application. It is installed as part of the iwork suite, which also includes the word processing program Pages and the presentation program
Advanced Excel for EMIS Coordinators
 Advanced Excel for EMIS Coordinators Helen Mills helenmills@metasolutions.net 2015 Metropolitan Educational Technology Association Outline Macros Conditional Formatting Text to Columns Pivot Tables V-Lookup
Division of School Facilities
 Division of School Facilities Module 3 EXCEL HIDE/ FILTER/ SORT & PRINT New York City Department of Education Office of Enterprise Development and Support Applications Support Group 2011 TABLE of CONTENTS
Microsoft Excel Microsoft Excel
 Excel 101 Microsoft Excel is a spreadsheet program that can be used to organize data, perform calculations, and create charts and graphs. Spreadsheets or graphs created with Microsoft Excel can be imported
Doc. Version 1.0 Updated:
 OneStop Reporting Report Designer/Player 3.5 User Guide Doc. Version 1.0 Updated: 2012-01-02 Table of Contents Introduction... 3 Who should read this manual... 3 What s included in this manual... 3 Symbols
Introduction to Microsoft Excel
 Chapter A spreadsheet is a computer program that turns the computer into a very powerful calculator. Headings and comments can be entered along with detailed formulas. The spreadsheet screen is divided
Microsoft Excel 2013/2016 Pivot Tables
 Microsoft Excel 2013/2016 Pivot Tables Creating PivotTables PivotTables are powerful data analysis tools. They let you summarize data in various ways and instantly change the view you use. A PivotTable
Spreadsheet definition: Starting a New Excel Worksheet: Navigating Through an Excel Worksheet
 Copyright 1 99 Spreadsheet definition: A spreadsheet stores and manipulates data that lends itself to being stored in a table type format (e.g. Accounts, Science Experiments, Mathematical Trends, Statistics,
Data. Selecting Data. Sorting Data
 1 of 1 Data Selecting Data To select a large range of cells: Click on the first cell in the area you want to select Scroll down to the last cell and hold down the Shift key while you click on it. This
CSSCR Excel Intermediate 4/13/06 GH Page 1 of 23 INTERMEDIATE EXCEL
 CSSCR Excel Intermediate 4/13/06 GH Page 1 of 23 INTERMEDIATE EXCEL This document is for those who already know the basics of spreadsheets and have worked with either Excel for Windows or Excel for Macintosh.
Using Microsoft Excel
 Using Microsoft Excel Table of Contents The Excel Window... 2 The Formula Bar... 3 Workbook View Buttons... 3 Moving in a Spreadsheet... 3 Entering Data... 3 Creating and Renaming Worksheets... 4 Opening
Business Process Procedures
 Business Process Procedures 14.40 MICROSOFT EXCEL TIPS Overview These procedures document some helpful hints and tricks while using Microsoft Excel. Key Points This document will explore the following:
2. create the workbook file
 2. create the workbook file Excel documents are called workbook files. A workbook can include multiple sheets of information. Excel supports two kinds of sheets for working with data: Worksheets, which
Excel Format cells Number Percentage (.20 not 20) Special (Zip, Phone) Font
 Special (Zip, Phone) Font") Excel 2013 Shortcuts My favorites: Ctrl+C copy (C=Copy) Ctrl+X cut (x is the shape of scissors) Ctrl+V paste (v is the shape of the tip of a glue bottle) Ctrl+A - or the corner of worksheet Ctrl+Home Goes
Excel 2013 Shortcuts My favorites: Ctrl+C copy (C=Copy) Ctrl+X cut (x is the shape of scissors) Ctrl+V paste (v is the shape of the tip of a glue bottle) Ctrl+A - or the corner of worksheet Ctrl+Home Goes
Microsoft Excel > Shortcut Keys > Shortcuts
 Microsoft Excel > Shortcut Keys > Shortcuts Function Keys F1 Displays the Office Assistant or (Help > Microsoft Excel Help) F2 Edits the active cell, putting the cursor at the end* F3 Displays the (Insert
Relativity. User s Guide. Contents are the exclusive property of Municipal Software, Inc. Copyright All Rights Reserved.
 Relativity User s Guide Contents are the exclusive property of Municipal Software, Inc. Copyright 2006. All Rights Reserved. Municipal Software, Inc. 1850 W. Winchester, Ste 209 Libertyville, IL 60048
Creating and Using an Excel Table
 Creating and Using an Excel Table Overview of Excel 2007 tables In earlier Excel versions, the organization of data in tables was referred to as an Excel database or list. An Excel table is not to be confused
Excel Module 7: Managing Data Using Tables
 True / False 1. You should not have any blank columns or rows in your table. True LEARNING OBJECTIVES: ENHE.REDI.16.131 - Plan the data organization for a table 2. Field names should be similar to cell
Department of Instructional Technology & Media Services Blackboard Grade Book
 Department of Instructional Technology & Media Services Blackboard Grade Book In your control panel, go to Assessment and grade center. Creating a Test In the Assessment section of the Control Panel, click
Learning Worksheet Fundamentals
 1.1 LESSON 1 Learning Worksheet Fundamentals After completing this lesson, you will be able to: Create a workbook. Create a workbook from a template. Understand Microsoft Excel window elements. Select
INSERT SUBTOTALS Database Exercise Sort the Data Department Department Data Tab Sort and Filter Group
 INSERT SUBTOTALS Subtotals are used to summarize data in a range of data. This command offers many kinds of summary information, including counts, sums, averages, minimums, and maximums. When this feature
Personalizing CA Clarity PPM User Guide. Release
 Personalizing CA Clarity PPM User Guide Release 13.2.00 This Documentation, which includes embedded help systems and electronically distributed materials, (hereinafter referred to as the Documentation
Bureau of Economic Self Sufficiency Community Action Agency Training Guide
 Bureau of Economic Self Sufficiency Community Action Agency Training Guide Contents 1. Homepage... 2 2. Subrecipient (Account Information)... 3 3. In Progress Notices of Fund Availability (NFAs)... 5 4.
ADD AND NAME WORKSHEETS
 1 INTERMEDIATE EXCEL While its primary function is to be a number cruncher, Excel is a versatile program that is used in a variety of ways. Because it easily organizes, manages, and displays information,
Excel Template Instructions for the Glo-Brite Payroll Project (Using Excel 2010 or 2013)
") Excel Template Instructions for the Glo-Brite Payroll Project (Using Excel 2010 or 2013) T APPENDIX B he Excel template for the Payroll Project is an electronic version of the books of account and payroll
Excel Template Instructions for the Glo-Brite Payroll Project (Using Excel 2010 or 2013) T APPENDIX B he Excel template for the Payroll Project is an electronic version of the books of account and payroll
Lesson 1: Exploring Excel Return to the Excel 2007 web page
 Lesson 1: Exploring Excel 2007 Return to the Excel 2007 web page Presenting Excel 2007 Excel can be used for a wide variety of tasks: Creating and maintaining detailed budgets Tracking extensive customer
CEU Online System, The Friday Center for Continuing Education, UNC-Chapel Hill How to Obtain Participant IDs for Awarding of CEUs
 The Friday Center for Continuing Education has the responsibility of approving continuing education activities for which CEUs are recorded and maintained as a permanent record for individual participants.
Microsoft Excel 2010 Part 2: Intermediate Excel
 CALIFORNIA STATE UNIVERSITY, LOS ANGELES INFORMATION TECHNOLOGY SERVICES Microsoft Excel 2010 Part 2: Intermediate Excel Spring 2014, Version 1.0 Table of Contents Introduction...3 Working with Rows and
Human Resource Management System User Guide
 11.0 Human Resource Management System User Guide Unit 0: Introduction Unit 1: HRMS Basics Unit 2: DateTracking Unit 3: Hiring a New Employee Unit 4: Electronic Approvals Unit 5: Maintaining Existing Employees
Table of Contents ADMIN PAGES QUICK REFERENCE GUIDE
 Admin Pages brings an all new look and feel to Banner. It delivers a fresh user experience, all new tools, and significantly improved capabilities. Admin Pages replaces underlying Banner 8 INB technology
HOW TO: Use the Labor Distribution Effort Macro 1
 HOW TO: Use the Labor Distribution Effort Macro 1 The Labor Distribution Effort Macro was created to assist users with effort monitoring and effort certification activities. This macro can be used on results
MaineStreet Financials 8.4
 MaineStreet Financials 8.4 General Ledger Excel Journal Entry 1 Overview A Journal Entry is used to update the General Ledger for many types of transactions, including cash receipts, transfers of revenue
EDIT202 Spreadsheet Lab Prep Sheet
 EDIT202 Spreadsheet Lab Prep Sheet While it is clear to see how a spreadsheet may be used in a classroom to aid a teacher in marking (as your lab will clearly indicate), it should be noted that spreadsheets
Access - Introduction to Queries
 Access - Introduction to Queries Part of managing a database involves asking questions about the data. A query is an Access object that you can use to ask the question(s). The answer is contained in the
For Microsoft Office XP or Student Workbook. TECHNOeBooks Project-based Computer Curriculum ebooks.
 TECHNOConsultant For Microsoft Office XP or 2003 Student Workbook TECHNOeBooks Project-based Computer Curriculum ebooks www.bepublishing.com Copyright 1993 2010. TechnoKids Inc. in partnership with B.E.
Introduction to Microsoft Excel 2007
 Introduction to Microsoft Excel 2007 Microsoft Excel is a very powerful tool for you to use for numeric computations and analysis. Excel can also function as a simple database but that is another class.
CHAPTER 4: MICROSOFT OFFICE: EXCEL 2010
 CHAPTER 4: MICROSOFT OFFICE: EXCEL 2010 Quick Summary A workbook an Excel document that stores data contains one or more pages called a worksheet. A worksheet or spreadsheet is stored in a workbook, and
Interim Standards New Directions Workbook One EASI Tool Excel Support Document Contents:
 Interim Standards New Directions Workbook One EASI Tool Excel Support Document Contents: 1. EASI Tool Template.... 2 2. Accessing and Saving the Tool Template.... 2 3. Screen View... 3 4. Comments/Guidance
Chapter 4. Microsoft Excel
 Chapter 4 Microsoft Excel Topic Introduction Spreadsheet Basic Screen Layout Modifying a Worksheet Formatting Cells Formulas and Functions Sorting and Filling Borders and Shading Charts Introduction A
EFIS 2.0 Training Materials Child Care User
 EFIS 2.0 Training Materials Child Care User Contents Module 1 Basic Planning... 3 Module 2 Basic Planning Through Smart View... 17 Module 3 Advanced Smart View... 29 Module 4 Data Entry Validation... 40
EXCEL Using Excel for Data Query & Management. Information Technology. MS Office Excel 2007 Users Guide. IT Training & Development
 Information Technology MS Office Excel 2007 Users Guide EXCEL 2007 Using Excel for Data Query & Management IT Training & Development (818) 677-1700 Training@csun.edu TABLE OF CONTENTS Introduction... 1
Work expectations will be included in your appraisal during the Recognition Phase of the performance management process.
 Monitoring is the day-to-day activity of paying attention to how the employee s work is going. Both the supervisor and employee track progress toward meeting the work expectations that were established
Contents. Group 2 Excel Handouts 2010
 Contents Styles... 2 Conditional Formatting... 2 Create a New Rule... 4 Format as Table... 5 Create your own New Table Style... 8 Cell Styles... 9 New Cell Style... 10 Merge Styles... 10 Sparklines...
Introduction to Microsoft Excel
 Platform: Windows PC Ref no: ins100 Date: May 2007 Version: 1 Author: C.P.Houghton Introduction to Microsoft Excel Microsoft Excel is a piece of software which allows you to create professional spreadsheets
Introduction to Microsoft Access 2016
 Introduction to Microsoft Access 2016 A database is a collection of information that is related. Access allows you to manage your information in one database file. Within Access there are four major objects:
Faculty Guide to Grade Center in Blackboard 9.1
 Faculty Guide to Grade Center in Blackboard 9.1 Grade Center, formally known as Gradebook, is a central repository for assessment data, student information, and instructor notes. Although it includes items
Introduction to Excel 2013
 Introduction to Excel 2013 Copyright 2014, Software Application Training, West Chester University. A member of the Pennsylvania State Systems of Higher Education. No portion of this document may be reproduced
Technical White Paper
 Technical White Paper Via Excel (VXL) Item Templates This technical white paper is designed for Spitfire Project Management System users. In this paper, you will learn how to create Via Excel Item Templates
Excel Foundation Quick Reference (Windows PC)
") Excel Foundation Quick Reference (Windows PC) See https://staff.brighton.ac.uk/is/training/pages/excel/foundation.aspx for videos and exercises to accompany this quick reference card. Structure of a spreadsheet
Excel Foundation Quick Reference (Windows PC) See https://staff.brighton.ac.uk/is/training/pages/excel/foundation.aspx for videos and exercises to accompany this quick reference card. Structure of a spreadsheet
Simply Personnel Screen Designer
 Simply Personnel Screen Designer -Training Workbook- Screen Designer Page 1 Build 12.8 Introduction to Simply Personnel Screen Designer This document provides step-by-step guide for employee users to give
Creating an Excel resource
 Excel Mobile Excel Mobile is a Microsoft application similar to Excel, but designed to run on handhelds. This mobile version of Excel is a spreadsheet application that allows you to manipulate numbers,
University of North Carolina at Charlotte
 University of North Carolina at Charlotte Facilities Management Procedures Manual v1.0 Delivered by PMOLink, LLC December 15-16, 2009 2009 All rights reserved. No part of this publication may be reproduced
Excel 2013 Intermediate
 Excel 2013 Intermediate Quick Access Toolbar... 1 Customizing Excel... 2 Keyboard Shortcuts... 2 Navigating the Spreadsheet... 2 Status Bar... 3 Worksheets... 3 Group Column/Row Adjusments... 4 Hiding
Sales Presentation for Matt s Mega Mart. Objectives. Steps: By the end of this lesson, you will be able to:
 Sales Presentation for Matt s Mega Mart Objectives By the end of this lesson, you will be able to: Apply Theme to presentation Export Word outline to PowerPoint Create pivot charts Modify pivot charts
Lesson 1: Exploring Excel Return to the FastCourse Excel 2007 Level 1 book page
 Lesson 1: Exploring Excel 2007 Return to the FastCourse Excel 2007 Level 1 book page Lesson Objectives After studying this lesson, you will be able to: Explain ways Excel can help your productivity Launch
IRA Basic Running Financial Reports
 IRA Basic Running Financial Reports Dartmouth College maintains a data warehouse of institutional finances, student data, advancement giving and other important measures. Institutional Reporting and Analysis
6. Essential Spreadsheet Operations
 6. Essential Spreadsheet Operations 6.1 Working with Worksheets When you open a new workbook in Excel, the workbook has a designated number of worksheets in it. You can specify how many sheets each new