Delineating the Stream Network and Watersheds of the Guadalupe Basin
|
|
|
- Patrick Horton
- 6 years ago
- Views:
Transcription
1 Delineating the Stream Network and Watersheds of the Guadalupe Basin Francisco Olivera Department of Civil Engineering Texas A&M University Srikanth Koka Department of Civil Engineering Texas A&M University Ashish Agrawal Department of Civil Engineering Texas A&M University March 2004 CONTENTS Brief Overview of Delineating Watersheds and Stream Networks Goals of the Exercise Computer and Data Requirements PROCEDURE 1. Add a DLL to ArcMap project 2. Get familiar with the DEM data 3. Set up the project 4. DEM Setup 5. Provide a Mask, Burn-in streams 6. Fill sinks, flow direction grid, flow accumulation 7. Construct the Basic Stream Network 8. Add a stream to the Stream Network 9. Rain Drop Tool 10. Add Outlets 11. Delineate streams and watersheds 12. Merge sub-basins Brief Overview of Delineating Watersheds and Stream Networks One of the most important applications of Digital Elevation Models (DEMs) is watershed delineation. ARC/INFO has built-in functions for watershed delineation from DEM's; however, the ArcGIS and its Spatial Analyst extension provide tools which are more convenient to use. These tools have been further developed by Dr. Francisco Olivera and Ashish Agrawal, into a watershed characterization system currently named PrePro2004,
2 where PrePro stands for PreProcessor of GIS data for hydrologic models. Goals of the Exercise In this exercise, you will learn how to use the PrePro2004 to process a digital elevation model and to delineate watersheds and stream networks from it. Computer and Data Requirements You need the following data for this exercise: This exercise was successfully done using ArcView 8.3, using Spatial Analyst Extension. The data needed for the exercise consists of the following datasets. BullCkNHD.shp - a shapefile of the NHD (National Hydrographic Dataset) stream network of the Bull Creek basin. bullckdem - an Arc/Info Grid of digital elevation for the Bull Creek Basin region. bullmask- - an Arc/Info Grid, which will be used as mask so that only that part of the DEM is processed that contains Bull Creek Basin. DLL A dynamic library link containing the tools for watershed delineation These files should be copied and unzipped from DATA.ZIP to a working directory on your computer. PROCEDURE 1. Add a DLL to ArcMap project Open ArcMap from the Windows start menu. Before proceeding further, save the document with what ever name you want to. Once you have done this, you can now add the required tools to the document. For this exercise, the tools are distributed as a DLL (Dynamic Library Link). The name of the DLL is WSDelineation.dll. To add the DLL, click Tools/Customize. In the Customize wizard that pops up, make sure that ToolBars tab is selected and click Add from file button. Now browse down to the working directory, select WSDelineation.dll and click Open and then OK. To add the toolbar corresponding to the watershed delineation, insert a check for Prepro2004 in the Toolbars listbox of Customize wizard. You can now observe that a toolbar is added to the document by name, Prepro Get familiar with the DEM data In the map document, click the Add Data button, and then pressing on Shift key, add bullckdem, bullmask and BullCkNHD.shp from your data directory to a data frame..click on don t build pyramids and then OK.

3 Let s see the properties of the DEM. Right click on the DEM and then click on Properties. In the Layer Properties wizard, choose the Source tab to view the grid properties. As it can be seen in the wizard, the DEM has Transverse_Mercator projection, cell size is 10 m, minimum elevation is m and maximum elevation is m. 3. Set up the project Setting up of project consists of defining the directory path for the utilities to store the results. To do this, click Prepro2004/Path Setup. In the form that pops up, select a drive using Select Drive combo box, then in this drive select a folder using Browse to the Folder listbox and finally inside the selected folder create a new folder by any name, by clicking on New Folder button. After entering the name for the folder, click OK. Finally, a message box pops up showing the path of the folder you have defined, click OK.


4 4. DEM Setup This step consists of specifying the DEM and verifying that the DEM has spatial reference defined to it. To do this, click Prepro2004/Watershed Delineator. A form named Watershed Delineation Tools pops up which contains a number of tabs, each containing different functions. Until the end of the exercise, this form will be used. To specify the DEM dataset, in the Watershed Delineation Tools form, click on the button containing folder icon, which is located under the tab named DEM. A form by name Select Option- Open DEM, pops up. In this form, select Select From View option and click OK. In the Select the layer form that pops up, select bullckdem and click OK. Up to this point you have specified the DEM required, now you will verify that the DEM is projected. To do this, in the Watershed Delineation Tools form, click

5 Projection button located under DEM tab. A wizard pops up, take a note of the information provided and click OK. Please make sure that Watershed Delineation Tools form is not closed until instructed. 5. Provide a Mask, Burn-in streams What you are now going to do is specify a mask concerning the study area. When a mask is used, only that part of the DEM will be processed, which falls within the mask. To do this, in the Watershed Delineation Tools form with DEM Setup active, under Mask/Burnin tab, insert a check mark for Mask. Now click on the folder icon for Mask. A form titled, Select Option-Mask pops up, in which select Select from View option and click OK. A new form titled Select a Layer pops up, in which select bullmask and click OK. What you are now going to do is raise the land surface cells that are off the streams by an arbitrary elevation amount so that the streams delineated from the DEM exactly match those in NHD. To do this, in the Watershed Delineation Tools form with DEM Setup active, under Mask/Burnin tab, insert a check mark for Burnin. Now click on the folder icon for Burnin. A form titled, Select Option-Burnin pops up, in which select Select from View option and click OK. A new form titled Select a Layer pops up, in which select BullCkNHD and click OK.


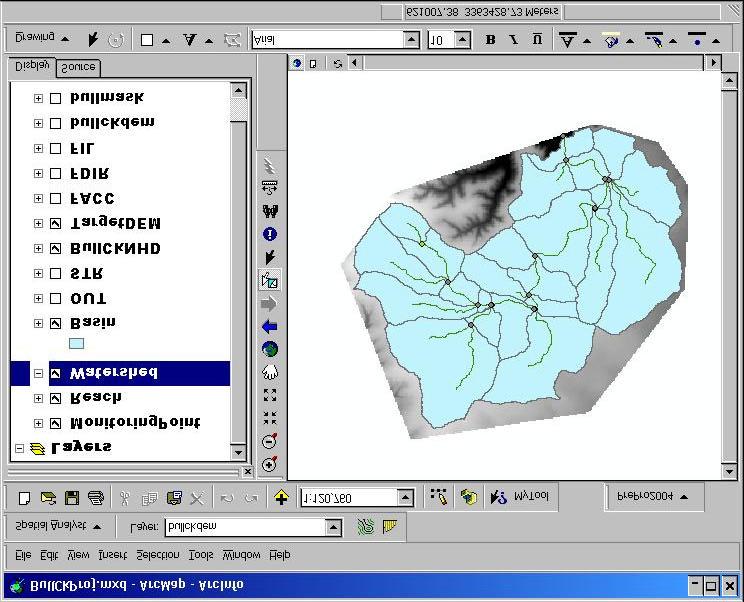
6 Normally, before you burn in the streams you have to ensure that the stream network is continuous and doesn't have gaps between each stream segment. If such gaps exist they have to be edited and closed before you burn in the streams. Likewise you have to edit out miscellaneous stream lines out in the landscape that are not connected to the stream network. In this case, NHD is a well constructed stream network and we can just go ahead and burn it in. 6. Fill sinks, flow direction grid, flow accumulation Up to this point of the exercise, your Watershed Delineator form should look something like that shown in the image below.

7 Most of the DEM data are accurate, however, aberrations do occur in the DEM which cause pits to form in the terrain. These pits need to be filled, otherwise they will cause the wrong flow direction. The Fill sinks function raises pit cell elevations so as to level the pits with the surrounding terrain. Only artificial sinks will be filled, since real sinks -- which we do not wish to remove from the DEM -- are treated differently. With the DEM grid filled, the flow direction grid can be calculated. Once flow direction grid is computed, the flow accumulation grid will be calculated. All these three functions (Fill sinks, flow direction and flow accumulation) will be applied at the same time. To do this, in the Watershed Delineation Tool form, click on FIL/FDIR/FACC button located under Mask/Burnin tab. It will take some time to execute these functions. Once it is done, a message pops up indicating the completion of the process, in which click OK to continue. Now minimize the watershed delineation tool form and try exploring the newly added layers to the Table of contents which are: TargetDEM, FACC, FDIR, FIL. To see only the Filled DEM, in the TOC, make all layers invisible except for FIL.

8 Similarly, to see only the Flow direction grid, in the TOC make all layers invisible except for FDIR..
9 Similarly, to see only the Flow accumulation grid, in the TOC make all layers invisible except for FACC. In the flow accumulation grid, keep in mind that the lighter the color of an individual grid cell, the more grid cells drain into that particular cell. Click on the Zoom In tool and zoom into a spot in the lower right corner where the two streams join in the grid network. Use the Identify tool to check individual cell values and understand how flow accumulation function counts the number of cells upstream of a particular cell. Follow a particular stream going downstream and see how the flow accumulation value increases as more drainage area is picked up. Focus on a junction and see how the flow accumulation downstream of the junction is the sum of the flow accumulations in the two upstream tributaries. See the example shown below.

.")
10 7. Construct the Basic Stream Network Before you start to construct the stream network, you have to define the cell threshold or minimum stream drainage area. In the Watershed Delineation Tools form, click on Streams tab, enter a value of as the number of cells in the text box for Threshold and click Str button. A streams grid is formed, which has a value of 1 in each cell with a flow accumulation value larger than 15000, and NODATA on all other cells. After sometime a message box appears, saying that the function was successfully executed. Also four new layers would be added to the map (Monitoring Point, Reach, OUT and STR). STR is a raster containing streams, OUT is raster containing cells that are outlets of streams being flagged, Reach is line shapefile that correspond to the streams of STR and Montoring point is a shapefile containing outlet points corresponding to the outlet cells in OUT raster.

11 Now minimize the Watershed Delineation Tool form and make only STR active by making the other three invisible in the TOC. Also make TargetDEM and BullCkNHD layers visible. To see if the streams delineated are right or wrong we will compare them with BullCkNHD streams. To do this, drag the BullCkNHD layer below the STR layer. Now zoom into any stream covered by both the layers using Zoom In tool. You should notice that the stream grid STR overlays on the top of BullCkNHD with some of the streams of BullCkNHD not being covered. This is because the cell threshold is too large to identify some of the smaller streams represented by BullCkNHD.

12 8. Add streams to the Stream Network Although you do not want to delineate all of the extra streams described by the BullCkNHD, there could be one or few streams for which you do want to delineate the associated watersheds. For example a water right location or a stream gauging station might be located on that stream, and you might want to know the drainage area of that water right location or gauging station. If the stream grid (STR) does not define these streams, you can add the streams to the STR grid using the ADD NEW STREAMS button located on the Watershed Delineation Tool wizard. First of all zoom to the portion of the map where you want to add a stream. Next, click on the ADD NEW STREAMS button, then click on any point on the map, then right click on the map and click Stop Editing. In the form that pops up, click Yes, to save changes. To add the new stream, click on the PROCESS NEW STREAMS button located on the Watershed Delineation Tool wizard, which could be one of the streams in BullCkNHD that is not defined by the stream grid STR. You can now observe that the four layers: Monitoring Point, Reach, Out and STR are replaced by new ones with same names. The new STR layer will contain previous streams plus the extra stream that you wanted.

13 9. Rain Drop Tool This tool can be used to trace the path of a rain drop upon inducing one on the terrain. The associated tool creates a graphic to show the rain drop trace path. First of make all the layers in TOC invisible except the TargetDEM layer. Then make sure that the Watershed Delineation Tool is maximized. In this form under the Streams tab, click on Rain Drop (Graphic) button and then click on the DEM where ever you want to. After you have observed the graphic created, to clear the graphics, click Refresh Map button.

14 10. Add Outlets Usually, the outlet is defined as the last cell of each stream section; however, you can also manually define an outlet. For example, if you want to find out the drainage area of a specific water right location, you can define the water right location as an outlet. For this step, you will define one water right location on the stream you just added. First of all drag the BullCkNHD layer just below the Reach layer. Then Zoom into the stream you just added until you can see the individual cells. Make the Outlet/Inlet/Reservoir tab active in the Watershed Delineation Tool form. Then insert a check for Add Outlet/Inlet/Reservoir and let the Outlet option be selected. Click on the Add button in the Watershed Delineation Tools form, and then click on a cell and then, don t forget to right click on the map, then to click Stop Editing and finally on clicking Save on the prompt. You will see new points being added to the MonitoringPoint layer. In the MonitoringPoint attribute table, see the Type field. Scroll down in the table until you see a row that has UDOutlet for Type. 11. Delineate streams and watersheds Before delineating the watersheds, you will have to select the basin outlet point from MonitoringPoint shapefile. The outlet point is the one that is most downstream on the
.")
15 stream network (see the figure below). There are two different stream networks here. So, we will discard the smaller one and take the bigger one into consideration. You will have to select the outlet of the bigger stream network. So, zoom in to the most downstream portion of the network using Zoom In tool (see the second image below). To select the outlet point, in the Watershed Delineation Tool wizard, insert a check for Include junctions for Delineation, click on Select button and finally draw a square around the outlet point to select it. Finally, click DELINEATE WATERSHED button to delineate watersheds and streams.

16 12. Merge sub-basins If you just want the drainage basins for the major streams, you can merge the subwatersheds. PrePro2004 allows you to merge two sub-basins at a time. Before you merge the sub-basins, check the number of rows of the Watershed layer. To do this, open its attribute table by right clicking on the layer and then clicking Open Attribute Table. Also open the Reach attribute table by right clicking on it and then clicking on Open Attribute Table and observe the number of streams. Right now we have one stream per sub-basin. It may so happen that some of the sub-basins may be too small, so what you do is merge them with their neighboring sub-basins. To merge two sub-basins, make sure that the Vectorization tab is selected in the Watershed Delineation Tools wizard. Insert a check in the box for MERGE SUBBASINS, minimize the Watershed Delineation Tools form, in the ArcMap document click on the Select Features tool and finally select the two sub-basins as shown in the figure below.
17 Once you have selected the features, maximize the Watershed Delineation Tools form, click on MERGE SUBBASINS. You will now see that the sub-basins you have selected are merged and the Watershed layer will now have one feature less than what was before. To see this, open its attribute table by right clicking on the layer and then clicking Open Attribute Table. Make a note of the number of features. Also open the Reach attribute table by right clicking on it and then clicking on Open Attribute Table and observe the number of streams. You can see that the number of sub-basins is one less than the number of the streams.
18
Learn how to delineate a watershed using the hydrologic modeling wizard
 v. 11.0 WMS 11.0 Tutorial Learn how to delineate a watershed using the hydrologic modeling wizard Objectives Import a digital elevation model, compute flow directions, and delineate a watershed and sub-basins
WMS 9.1 Tutorial Watershed Modeling DEM Delineation Learn how to delineate a watershed using the hydrologic modeling wizard
 v. 9.1 WMS 9.1 Tutorial Learn how to delineate a watershed using the hydrologic modeling wizard Objectives Read a digital elevation model, compute flow directions, and delineate a watershed and sub-basins
Compilation of GIS data for the Lower Brazos River basin
 Compilation of GIS data for the Lower Brazos River basin Prepared by Francisco Olivera, Ph.D., P.E., Srikanth Koka, and Lauren Walker Department of Civil Engineering October 2, 2006 Contents: Brief Overview
Stream Network and Watershed Delineation using Spatial Analyst Hydrology Tools
 Stream Network and Watershed Delineation using Spatial Analyst Hydrology Tools Prepared by Venkatesh Merwade School of Civil Engineering, Purdue University vmerwade@purdue.edu January 2018 Objective The
Learn how to delineate a watershed using the hydrologic modeling wizard
 v. 10.1 WMS 10.1 Tutorial Learn how to delineate a watershed using the hydrologic modeling wizard Objectives Import a digital elevation model, compute flow directions, and delineate a watershed and sub-basins
George Mason University Department of Civil, Environmental and Infrastructure Engineering
 George Mason University Department of Civil, Environmental and Infrastructure Engineering Dr. Celso Ferreira Prepared by Lora Baumgartner December 2015 Revised by Brian Ross July 2016 Exercise Topic: GIS
Watershed Modeling Advanced DEM Delineation
 v. 10.1 WMS 10.1 Tutorial Watershed Modeling Advanced DEM Delineation Techniques Model manmade and natural drainage features Objectives Learn to manipulate the default watershed boundaries by assigning
v Introduction to WMS WMS 11.0 Tutorial Become familiar with the WMS interface Prerequisite Tutorials None Required Components Data Map
 s v. 11.0 WMS 11.0 Tutorial Become familiar with the WMS interface Objectives Import files into WMS and change modules and display options to become familiar with the WMS interface. Prerequisite Tutorials
Delineating Watersheds from a Digital Elevation Model (DEM)
") Delineating Watersheds from a Digital Elevation Model (DEM) (Using example from the ESRI virtual campus found at http://training.esri.com/courses/natres/index.cfm?c=153) Download locations for additional
Delineating Watersheds from a Digital Elevation Model (DEM) (Using example from the ESRI virtual campus found at http://training.esri.com/courses/natres/index.cfm?c=153) Download locations for additional
WMS 10.0 Tutorial Hydraulics and Floodplain Modeling HY-8 Modeling Wizard Learn how to model a culvert using HY-8 and WMS
 v. 10.0 WMS 10.0 Tutorial Hydraulics and Floodplain Modeling HY-8 Modeling Wizard Learn how to model a culvert using HY-8 and WMS Objectives Define a conceptual schematic of the roadway, invert, and downstream
GIS LAB 8. Raster Data Applications Watershed Delineation
 GIS LAB 8 Raster Data Applications Watershed Delineation This lab will require you to further your familiarity with raster data structures and the Spatial Analyst. The data for this lab are drawn from
Watershed Modeling Orange County Hydrology Using GIS Data
 v. 9.1 WMS 9.1 Tutorial Watershed Modeling Orange County Hydrology Using GIS Data Learn how to delineate sub-basins and compute soil losses for Orange County (California) hydrologic modeling Objectives
George Mason University Department of Civil, Environmental and Infrastructure Engineering
 George Mason University Department of Civil, Environmental and Infrastructure Engineering Dr. Celso Ferreira Prepared by Lora Baumgartner December 2015 Revised by Brian Ross July 2016 Exercise Topic: Getting
BAEN 673 Biological and Agricultural Engineering Department Texas A&M University ArcSWAT / ArcGIS 10.1 Example 2
 Before you Get Started BAEN 673 Biological and Agricultural Engineering Department Texas A&M University ArcSWAT / ArcGIS 10.1 Example 2 1. Open ArcCatalog Connect to folder button on tool bar navigate
Field-Scale Watershed Analysis
 Conservation Applications of LiDAR Field-Scale Watershed Analysis A Supplemental Exercise for the Hydrologic Applications Module Andy Jenks, University of Minnesota Department of Forest Resources 2013
Working with Attribute Data and Clipping Spatial Data. Determining Land Use and Ownership Patterns associated with Streams.
 GIS LAB 3 Working with Attribute Data and Clipping Spatial Data. Determining Land Use and Ownership Patterns associated with Streams. One of the primary goals of this course is to give you some hands-on
Spatial Hydrologic Modeling HEC-HMS Distributed Parameter Modeling with the MODClark Transform
 v. 9.0 WMS 9.0 Tutorial Spatial Hydrologic Modeling HEC-HMS Distributed Parameter Modeling with the MODClark Transform Setup a basic distributed MODClark model using the WMS interface Objectives In this
Creating and Delineating a Watershed from DXF Terrain Data
 Creating and Delineating a Watershed from DXF Terrain Data 1. Start up WMS. 2. Switch to the Map Module. 3. Select DXF Import. Select the DXF file to import. 4. Notice that the DXF file imports fine into
Hydrologic Modeling using HEC-HMS
 Hydrologic Modeling using HEC-HMS CE 412/512 Spring 2017 Introduction The intent of this exercise is to introduce you to the structure and some of the functions of the HEC-Hydrologic Modeling System (HEC-HMS),
Spatial Analysis with Raster Datasets
 Spatial Analysis with Raster Datasets Francisco Olivera, Ph.D., P.E. Srikanth Koka Lauren Walker Aishwarya Vijaykumar Keri Clary Department of Civil Engineering April 21, 2014 Contents Brief Overview of
WMS 8.4 Tutorial Watershed Modeling MODRAT Interface (GISbased) Delineate a watershed and build a MODRAT model
 Delineate a watershed and build a MODRAT model") v. 8.4 WMS 8.4 Tutorial Watershed Modeling MODRAT Interface (GISbased) Delineate a watershed and build a MODRAT model Objectives Delineate a watershed from a DEM and derive many of the MODRAT input parameters
v. 8.4 WMS 8.4 Tutorial Watershed Modeling MODRAT Interface (GISbased) Delineate a watershed and build a MODRAT model Objectives Delineate a watershed from a DEM and derive many of the MODRAT input parameters
Watershed Modeling With DEMs: The Rest of the Story
 Watershed Modeling With DEMs: The Rest of the Story Lesson 7 7-1 DEM Delineation: The Rest of the Story DEM Fill for some cases when merging DEMs Delineate Basins Wizard Smoothing boundaries Representing
v Modeling Orange County Unit Hydrograph GIS Learn how to define a unit hydrograph model for Orange County (California) from GIS data
 from GIS data") v. 10.1 WMS 10.1 Tutorial Modeling Orange County Unit Hydrograph GIS Learn how to define a unit hydrograph model for Orange County (California) from GIS data Objectives This tutorial shows how to define
v. 10.1 WMS 10.1 Tutorial Modeling Orange County Unit Hydrograph GIS Learn how to define a unit hydrograph model for Orange County (California) from GIS data Objectives This tutorial shows how to define
Lab 11: Terrain Analyses
 Lab 11: Terrain Analyses What You ll Learn: Basic terrain analysis functions, including watershed, viewshed, and profile processing. There is a mix of old and new functions used in this lab. We ll explain
Objectives Divide a single watershed into multiple sub-basins, and define routing between sub-basins.
 v. 11.0 HEC-HMS WMS 11.0 Tutorial HEC-HMS Learn how to create multiple sub-basins using HEC-HMS Objectives Divide a single watershed into multiple sub-basins, and define routing between sub-basins. Prerequisite
Stream network delineation and scaling issues with high resolution data
 Stream network delineation and scaling issues with high resolution data Roman DiBiase, Arizona State University, May 1, 2008 Abstract: In this tutorial, we will go through the process of extracting a stream
Using GIS to Site Minimal Excavation Helicopter Landings
 Using GIS to Site Minimal Excavation Helicopter Landings The objective of this analysis is to develop a suitability map for aid in locating helicopter landings in mountainous terrain. The tutorial uses
Exercise 5. Height above Nearest Drainage Flood Inundation Analysis
 Exercise 5. Height above Nearest Drainage Flood Inundation Analysis GIS in Water Resources, Fall 2018 Prepared by David G Tarboton Purpose The purpose of this exercise is to learn how to calculation the
v Introduction to WMS Become familiar with the WMS interface WMS Tutorials Time minutes Prerequisite Tutorials None
 s v. 10.0 WMS 10.0 Tutorial Become familiar with the WMS interface Objectives Read files into WMS and change modules and display options to become familiar with the WMS interface. Prerequisite Tutorials
Watershed Modeling Maricopa Predictive HEC-1 Model. Watershed Modeling Maricopa County: Master Plan Creating a Predictive HEC-1 Model
 v. 10.1 WMS 10.1 Tutorial Watershed Modeling Maricopa County: Master Plan Creating a Predictive HEC-1 Model Build a watershed model to predict hydrologic reactions based on land use development in Maricopa
Lab 11: Terrain Analysis
 Lab 11: Terrain Analysis What You ll Learn: Basic terrain analysis functions, including watershed, viewshed, and profile processing. You should read chapter 11 in the GIS Fundamentals textbook before performing
Watershed Modeling HEC-HMS Interface
 v. 10.1 WMS 10.1 Tutorial Learn how to set up a basic HEC-HMS model using WMS Objectives Build a basic HEC-HMS model from scratch using a DEM, land use, and soil data. Compute the geometric and hydrologic
5. TxDOT Hydrology Extension System Operation
 5. TxDOT Hydrology Extension System Operation 5.1 System Requirement The TxDOT Hydrology Extension is an ArcView Extension written in the Avenue script used in the ArcView environment. All contents of
WMS 10.1 Tutorial GSSHA WMS Basics Watershed Delineation using DEMs and 2D Grid Generation Delineate a watershed and create a GSSHA model from a DEM
 v. 10.1 WMS 10.1 Tutorial GSSHA WMS Basics Watershed Delineation using DEMs and 2D Grid Generation Delineate a watershed and create a GSSHA model from a DEM Objectives Learn how to delineate a watershed
v. 9.1 WMS 9.1 Tutorial Watershed Modeling HEC-1 Interface Learn how to setup a basic HEC-1 model using WMS
 v. 9.1 WMS 9.1 Tutorial Learn how to setup a basic HEC-1 model using WMS Objectives Build a basic HEC-1 model from scratch using a DEM, land use, and soil data. Compute the geometric and hydrologic parameters
Lab 18c: Spatial Analysis III: Clip a raster file using a Polygon Shapefile
 Environmental GIS Prepared by Dr. Zhi Wang, CSUF EES Department Lab 18c: Spatial Analysis III: Clip a raster file using a Polygon Shapefile These instructions enable you to clip a raster layer in ArcMap
Geographic Surfaces. David Tenenbaum EEOS 383 UMass Boston
 Geographic Surfaces Up to this point, we have talked about spatial data models that operate in two dimensions How about the rd dimension? Surface the continuous variation in space of a third dimension
WMS 9.1 Tutorial GSSHA WMS Basics Watershed Delineation using DEMs and 2D Grid Generation Delineate a watershed and create a GSSHA model from a DEM
 v. 9.1 WMS 9.1 Tutorial GSSHA WMS Basics Watershed Delineation using DEMs and 2D Grid Generation Delineate a watershed and create a GSSHA model from a DEM Objectives Learn how to delineate a watershed
Exercise # 6: Using the NHDPlus Raster Data Sets Last Updated 3/28/2006
 Exercise # 6: Using the NHDPlus Raster Data Sets Last Updated 3/28/2006 The NHDPlus includes several raster (grid) data sets. Several of these are primarily used in analytical processes that are beyond
WMS 9.0 Tutorial Hydraulics and Floodplain Modeling HEC-RAS Analysis Learn how to setup a basic HEC-RAS analysis using WMS
 v. 9.0 WMS 9.0 Tutorial Hydraulics and Floodplain Modeling HEC-RAS Analysis Learn how to setup a basic HEC-RAS analysis using WMS Objectives Learn how to build cross sections, stream centerlines, and bank
Watershed Modeling Using Online Spatial Data to Create an HEC-HMS Model
 v. 10.1 WMS 10.1 Tutorial Watershed Modeling Using Online Spatial Data to Create an HEC-HMS Model Learn how to setup an HEC-HMS model using WMS online spatial data Objectives This tutorial shows how to
v. 8.4 Prerequisite Tutorials Watershed Modeling Advanced DEM Delineation Techniques Time minutes
 v. 8.4 WMS 8.4 Tutorial Modeling Orange County Rational Method GIS Learn how to define a rational method hydrologic model for Orange County (California) from GIS data Objectives This tutorial shows you
STUDENT PAGES GIS Tutorial Treasure in the Treasure State
 STUDENT PAGES GIS Tutorial Treasure in the Treasure State Copyright 2015 Bear Trust International GIS Tutorial 1 Exercise 1: Make a Hand Drawn Map of the School Yard and Playground Your teacher will provide
UNDERSTAND HOW TO SET UP AND RUN A HYDRAULIC MODEL IN HEC-RAS CREATE A FLOOD INUNDATION MAP IN ARCGIS.
 CE 412/512, Spring 2017 HW9: Introduction to HEC-RAS and Floodplain Mapping Due: end of class, print and hand in. HEC-RAS is a Hydrologic Modeling System that is designed to describe the physical properties
Storm Drain Modeling HY-12 Rational Design
 v. 10.1 WMS 10.1 Tutorial Learn how to design storm drain inlets, pipes, and other components of a storm drain system using FHWA's HY-12 storm drain analysis software and the WMS interface Objectives Define
Exercise 6 Using the NHDPlus Raster Data Sets Last Updated 3/12/2014
 Exercise 6 Using the NHDPlus Raster Data Sets Last Updated 3/12/2014 Within this document, the term NHDPlus is used when referring to NHDPlus Version 2.1 (unless otherwise noted). The NHDPlus includes
Watershed Modeling Maricopa County: Master Plan Creating a Predictive HEC-1 Model
 v. 9.0 WMS 9.0 Tutorial Watershed Modeling Maricopa County: Master Plan Creating a Predictive HEC-1 Model Build a watershed model to predict hydrologic reactions based on land use development in Maricopa
Watershed Delineation
 Watershed Delineation Using SAGA GIS Tutorial ID: IGET_SA_003 This tutorial has been developed by BVIEER as part of the IGET web portal intended to provide easy access to geospatial education. This tutorial
Import, view, edit, convert, and digitize triangulated irregular networks
 v. 10.1 WMS 10.1 Tutorial Import, view, edit, convert, and digitize triangulated irregular networks Objectives Import survey data in an XYZ format. Digitize elevation points using contour imagery. Edit
Lab 11: Terrain Analyses
 Lab 11: Terrain Analyses What You ll Learn: Basic terrain analysis functions, including watershed, viewshed, and profile processing. There is a mix of old and new functions used in this lab. We ll explain
Building Vector Layers
 Building Vector Layers in QGIS Introduction: Spatially referenced data can be separated into two categories, raster and vector data. This week, we focus on the building of vector features. Vector shapefiles
Exercise 5. Height above Nearest Drainage Flood Inundation Analysis
 Exercise 5. Height above Nearest Drainage Flood Inundation Analysis GIS in Water Resources, Fall 2016 Prepared by David G Tarboton Purpose The purpose of this exercise is to illustrate the use of TauDEM
Basics of Using LiDAR Data
 Conservation Applications of LiDAR Basics of Using LiDAR Data Exercise #2: Raster Processing 2013 Joel Nelson, University of Minnesota Department of Soil, Water, and Climate This exercise was developed
Lab 7c: Rainfall patterns and drainage density
 Lab 7c: Rainfall patterns and drainage density This is the third of a four-part handout for class the last two weeks before spring break. Due: Be done with this by class on 11/3. Task: Extract your watersheds
A Second Look at DEM s
 A Second Look at DEM s Overview Detailed topographic data is available for the U.S. from several sources and in several formats. Perhaps the most readily available and easy to use is the National Elevation
GIS Workbook #1. GIS Basics and the ArcGIS Environment. Helen Goodchild
 GIS Basics and the ArcGIS Environment Helen Goodchild Overview of Geographic Information Systems Geographical Information Systems (GIS) are used to display, manipulate and analyse spatial data (data that
J.Welhan 5/07. Watershed Delineation Procedure
 Watershed Delineation Procedure 1. Prepare the DEM: - all grids should be in the same projection; if not, then reproject (or define and project); if in UTM, all grids must be in the same zone (if not,
Spatial Analysis Exercise GIS in Water Resources Fall 2011
 Spatial Analysis Exercise GIS in Water Resources Fall 2011 Prepared by David G. Tarboton and David R. Maidment Goal The goal of this exercise is to serve as an introduction to Spatial Analysis with ArcGIS.
WMS 10.1 Tutorial Hydraulics and Floodplain Modeling HEC-RAS Analysis Learn how to setup a basic HEC-RAS analysis using WMS
 v. 10.1 WMS 10.1 Tutorial Hydraulics and Floodplain Modeling HEC-RAS Analysis Learn how to setup a basic HEC-RAS analysis using WMS Objectives Learn how to build cross sections, stream centerlines, and
v Prerequisite Tutorials GSSHA Modeling Basics Stream Flow GSSHA WMS Basics Creating Feature Objects and Mapping their Attributes to the 2D Grid
 v. 10.1 WMS 10.1 Tutorial GSSHA Modeling Basics Developing a GSSHA Model Using the Hydrologic Modeling Wizard in WMS Learn how to setup a basic GSSHA model using the hydrologic modeling wizard Objectives
v Working with Rasters SMS 12.1 Tutorial Requirements Raster Module Map Module Mesh Module Time minutes Prerequisites Overview Tutorial
 v. 12.1 SMS 12.1 Tutorial Objectives This tutorial teaches how to import a Raster, view elevations at individual points, change display options for multiple views of the data, show the 2D profile plots,
Workshop Exercises for Digital Terrain Analysis with LiDAR for Clean Water Implementation
 Workshop Exercises for Digital Terrain Analysis with LiDAR for Clean Water Implementation This manual is designed to accompany lecture and handout materials provided at a series of workshops offered in
WMS 9.1 Tutorial GSSHA Modeling Basics Stream Flow Integrate stream flow with your GSSHA overland flow model
 v. 9.1 WMS 9.1 Tutorial Integrate stream flow with your GSSHA overland flow model Objectives Learn how to add hydraulic channel routing to your GSSHA model and how to define channel properties. Learn how
WMS 9.0 Tutorial GSSHA WMS Basics Watershed Delineation using DEMs and 2D Grid Generation Delineate a watershed and create a GSSHA model from a DEM
 v. 9.0 WMS 9.0 Tutorial GSSHA WMS Basics Watershed Delineation using DEMs and 2D Grid Generation Delineate a watershed and create a GSSHA model from a DEM Objectives Learn how to delineate a watershed
Spatial Hydrologic Modeling Using NEXRAD Rainfall Data in an HEC-HMS (MODClark) Model
 Model") v. 10.0 WMS 10.0 Tutorial Spatial Hydrologic Modeling Using NEXRAD Rainfall Data in an HEC-HMS (MODClark) Model Learn how to setup a MODClark model using distributed rainfall data Objectives Read an existing
v. 10.0 WMS 10.0 Tutorial Spatial Hydrologic Modeling Using NEXRAD Rainfall Data in an HEC-HMS (MODClark) Model Learn how to setup a MODClark model using distributed rainfall data Objectives Read an existing
In this exercise we will:
 Intro to GIS Exercise #3 TOC Data frame visual hierarchy / Select by Attribute / Select by Location / Geoprocessing IUP Dept. of Geography and Regional Planning Dr. Richard Hoch Please prepare answers
16) After contour layer is chosen, on column height_field, choose Elevation, and on tag_field column, choose <None>. Click OK button.
 After contour layer is chosen, on column height_field, choose Elevation, and on tag_field column, choose <None>. Click OK button.") 16) After contour layer is chosen, on column height_field, choose Elevation, and on tag_field column, choose . Click OK button. 17) The process of TIN making will take some time. Various process
16) After contour layer is chosen, on column height_field, choose Elevation, and on tag_field column, choose . Click OK button. 17) The process of TIN making will take some time. Various process
Data Assembly, Part II. GIS Cyberinfrastructure Module Day 4
 Data Assembly, Part II GIS Cyberinfrastructure Module Day 4 Objectives Continuation of effective troubleshooting Create shapefiles for analysis with buffers, union, and dissolve functions Calculate polygon
Conservation Applications of LiDAR. Terrain Analysis. Workshop Exercises
 Conservation Applications of LiDAR Terrain Analysis Workshop Exercises 2012 These exercises are part of the Conservation Applications of LiDAR project a series of hands on workshops designed to help Minnesota
Geographical Information Systems Institute. Center for Geographic Analysis, Harvard University. LAB EXERCISE 1: Basic Mapping in ArcMap
 Harvard University Introduction to ArcMap Geographical Information Systems Institute Center for Geographic Analysis, Harvard University LAB EXERCISE 1: Basic Mapping in ArcMap Individual files (lab instructions,
Making flow direction data
 Step 4. Making flow direction data Training Module 1) The first step in hydrology analysis is making flow direction data. On Arc Toolbox window, click symbol + on Spatial Analyst Tools Hydrology, double
Build a MODRAT model by defining a hydrologic schematic
 v. 11.0 WMS 11.0 Tutorial Build a MODRAT model by defining a hydrologic schematic Objectives Learn how to define a basic MODRAT model using the hydrologic schematic tree in WMS by building a tree and defining
Questions: a User-friendly Interface to ANSWERS-2000
 Questions: a User-friendly Interface to ANSWERS-2000 Tamie L. Veith, student; Tone M. Nordberg, student; M.L. Wolfe, member; Theo Dillaha III, member Abstract: Questions is a user-friendly interface to
Exercise Lab: Where is the Himalaya eroding? Using GIS/DEM analysis to reconstruct surfaces, incision, and erosion
 Exercise Lab: Where is the Himalaya eroding? Using GIS/DEM analysis to reconstruct surfaces, incision, and erosion 1) Start ArcMap and ensure that the 3D Analyst and the Spatial Analyst are loaded and
GIS LAB 1. Basic GIS Operations with ArcGIS. Calculating Stream Lengths and Watershed Areas.
 GIS LAB 1 Basic GIS Operations with ArcGIS. Calculating Stream Lengths and Watershed Areas. ArcGIS offers some advantages for novice users. The graphical user interface is similar to many Windows packages
Map Analysis with Vector Data
 Map Analysis with Vector Data Francisco Olivera, Ph.D., P.E. Srikanth Koka Lauren Walker Aishwarya Vijaykumar Department of Civil Engineering December 5, 2011 Contents Brief Overview of Map Analysis...
Answer the following general questions: 1. What happens when you right click on an icon on your desktop? When you left double click on an icon?
 Name: Date: June 27th, 2011 GIS Boot Camps For Educators Practical: Explore ArcGIS 10 Desktop Tools and functionality Day_1 Lecture 1 Sources: o ArcGIS Desktop help o ESRI website o Getting to Know ArcGIS
Watershed Analysis Lab Heterogeneous, Gaged Watershed I (Northwest Branch)
") Watershed Analysis Lab Heterogeneous, Gaged Watershed I (Northwest Branch) The previous lab demonstrated the process of selecting quadrangles, specifying data types, delineating a watershed, and using
Watershed Analysis Lab Heterogeneous, Gaged Watershed I (Northwest Branch) The previous lab demonstrated the process of selecting quadrangles, specifying data types, delineating a watershed, and using
WMS 10.0 Tutorial Storm Drain Modeling SWMM Modeling Learn how to link a hydrologic model to the SWMM storm drain model
 v. 10.0 WMS 10.0 Tutorial Learn how to link a hydrologic model to the SWMM storm drain model Objectives Build a rational method hydrologic model and compute sub-basin flows. Import storm drain network
GSSHA WMS Basics Loading DEMs, Contour Options, Images, and Projection Systems
 v. 10.0 WMS 10.0 Tutorial GSSHA WMS Basics Loading DEMs, Contour Options, Images, and Projection Systems Learn how to work with DEMs and images and to convert between projection systems in the WMS interface
ARC HYDRO TOOLS CONFIGURATION DOCUMENT #3 GLOBAL DELINEATION WITH EDNA DATA
 ARC HYDRO TOOLS CONFIGURATION DOCUMENT #3 GLOBAL DELINEATION WITH EDNA DATA Environmental Systems Research Institute, Inc. (Esri) 380 New York Street Redlands, California 92373-8100 Phone: (909) 793-2853
Watershed Modeling With Feature Objects
 Watershed Modeling With Feature Objects Lesson 4 4-1 Objectives Apply the rules of feature object topology to create a drainage coverage 4-2 Work Flow This lesson covers the use of feature objects for
Watershed Modeling Rational Method Interface. Learn how to model urban areas using WMS' rational method interface
 v. 10.1 WMS 10.1 Tutorial Learn how to model urban areas using WMS' rational method interface Objectives Learn how to model urban areas using the Rational method, including how to compute rainfall intensity,
Channel Conditions in the Onion Creek Watershed. Integrating High Resolution Elevation Data in Flood Forecasting
 Channel Conditions in the Onion Creek Watershed Integrating High Resolution Elevation Data in Flood Forecasting Lukas Godbout GIS in Water Resources CE394K Fall 2016 Introduction Motivation Flooding is
Using HEC-RAS and HEC-GeoRAS for River Modeling Adapted by E. Maurer, using an exercise by V. Merwade, Purdue Univ.
 Introduction Using HEC-RAS and HEC-GeoRAS for River Modeling Adapted by E. Maurer, using an exercise by V. Merwade, Purdue Univ. This tutorial uses the output from HEC_GeoRAS from a prior exercise as input
Hydraulics and Floodplain Modeling Modeling with the Hydraulic Toolbox
 v. 9.1 WMS 9.1 Tutorial Hydraulics and Floodplain Modeling Modeling with the Hydraulic Toolbox Learn how to design inlet grates, detention basins, channels, and riprap using the FHWA Hydraulic Toolbox
METIER Course n februray Introduction to ArcView 3
 METIER Course n 2 Information Management in Environmental Sciences 19-23 februray 2007 Introduction to ArcView 3 tél : (33) 04 67 54 87 54 Maison de la Télédétection en Languedoc-Roussillon fax : (33)
INTRODUCTION TO GIS WORKSHOP EXERCISE
 111 Mulford Hall, College of Natural Resources, UC Berkeley (510) 643-4539 INTRODUCTION TO GIS WORKSHOP EXERCISE This exercise is a survey of some GIS and spatial analysis tools for ecological and natural
WMS 8.4 Tutorial Hydraulics and Floodplain Modeling Simplified Dam Break Learn how to run a dam break simulation and delineate its floodplain
 v. 8.4 WMS 8.4 Tutorial Hydraulics and Floodplain Modeling Simplified Dam Break Learn how to run a dam break simulation and delineate its floodplain Objectives Setup a conceptual model of stream centerlines
Objectives Import DEMs from an online database. Set the display options of an imported DEM and view and edit the DEM attributes.
 v. 10.0 WMS 10.0 Tutorial Import, view, and edit digital elevation models Objectives Import DEMs from an online database. Set the display options of an imported DEM and view and edit the DEM attributes.
GY301 Geomorphology Lab 5 Topographic Map: Final GIS Map Construction
 GY301 Geomorphology Lab 5 Topographic Map: Final GIS Map Construction Introduction This document describes how to take the data collected with the total station for the campus topographic map project and
This tutorial shows how to extract longitudinal profiles using ArcMap 10.1 and how to plot them with R, an open-source software.
 JESSE S. HILL 2013 UNC-CH This tutorial shows how to extract longitudinal profiles using ArcMap 10.1 and how to plot them with R, an open-source software. R is freely available at: cran.us.r-project.org/
Surface Analysis. Data for Surface Analysis. What are Surfaces 4/22/2010
 Surface Analysis Cornell University Data for Surface Analysis Vector Triangulated Irregular Networks (TIN) a surface layer where space is partitioned into a set of non-overlapping triangles Attribute and
Learn how to link a hydrologic model to the SWMM storm drain model
 v. 10.1 WMS 10.1 Tutorial Learn how to link a hydrologic model to the SWMM storm drain model Objectives Build a rational method hydrologic model and compute sub-basin flows. Import storm drain network
Introduction to GIS & Mapping: ArcGIS Desktop
 Introduction to GIS & Mapping: ArcGIS Desktop Your task in this exercise is to determine the best place to build a mixed use facility in Hudson County, NJ. In order to revitalize the community and take
Objectives This tutorial shows you how to define data for and run a rational method model for a watershed in Orange County.
 v. 9.0 WMS 9.0 Tutorial Modeling Orange County Rational Method GIS Learn how to define a rational method hydrologic model for Orange County (California) from GIS data Objectives This tutorial shows you
Applied Cartography and Introduction to GIS GEOG 2017 EL. Lecture-7 Chapters 13 and 14
 Applied Cartography and Introduction to GIS GEOG 2017 EL Lecture-7 Chapters 13 and 14 Data for Terrain Mapping and Analysis DEM (digital elevation model) and TIN (triangulated irregular network) are two
Lesson 8 : How to Create a Distance from a Water Layer
 Created By: Lane Carter Advisor: Paul Evangelista Date: July 2011 Software: ArcGIS 10 Lesson 8 : How to Create a Distance from a Water Layer Background This tutorial will cover the basic processes involved
Importing CDED (Canadian Digital Elevation Data) into ArcGIS 9.x
 into ArcGIS 9.x") Importing CDED (Canadian Digital Elevation Data) into ArcGIS 9.x Related Guides: Obtaining Canadian Digital Elevation Data (CDED) Importing Canadian Digital Elevation Data (CDED) into ArcView 3.x Requirements:
Importing CDED (Canadian Digital Elevation Data) into ArcGIS 9.x Related Guides: Obtaining Canadian Digital Elevation Data (CDED) Importing Canadian Digital Elevation Data (CDED) into ArcView 3.x Requirements:
Making ArcGIS Work for You. Elizabeth Cook USDA-NRCS GIS Specialist Columbia, MO
 Making ArcGIS Work for You Elizabeth Cook USDA-NRCS GIS Specialist Columbia, MO 1 Topics Using ArcMap beyond the Toolkit buttons GIS data formats Attributes and what you can do with them Calculating Acres