Setup Examples. RTPView Project Program
|
|
|
- David Dennis
- 6 years ago
- Views:
Transcription

1 Setup Examples RTPView Project Program
2 RTPView Project Program Example 2005, 2007, 2008, 2009 RTP Corporation Not for reproduction in any printed or electronic media without express written consent from RTP Corp. All information, data, graphics and statements in this document are proprietary intellectual property of RTP Corp. unless otherwise indicated and are to be considered RTP Corp. confidential. This intellectual property is made available solely for the direct use of potential or licensed RTP Corp. customers in their application of RTP Corp. products, and any other use or distribution is expressly prohibited. If you have received this publication in error, immediately delete, discard or return all copies to RTP Corp. RTP Corporation 1834 SW 2 nd Street Pompano Beach, FL Phone: (954) Fax: (954) Internet: File Name: RTPView Example.pdf Last Updated: 1/21/09 2


3 RTPView Project Program Hardware Setup No physical I/O hardware is required to perform this setup example. You are free to use either an RTP target node configured in a previous setup example, or the NetArrays built-in Simulator. NetArrays Project Open the NetArrays program My_first.dbn that was created in the Example NetArrays Project Development. If you have not previously created this program, do so now Click on File and select Open Project Select the My_first.dbn and click Open. 3


4 In the NetArrays Device menu, select Select and choose the target node you are using to run this example, or the local Simulator. In the NetArrays Device menu, select Download Project to download and run your project on the selected device. Enter rtp for Download Password and type rtp and select OK. When prompted select Yes for Do you want to overwrite? Examine the Output Window to confirm that the download was successful. This project program must remain running in the target node or Simulator while you complete the rest of this setup example. 4

5 Examine Output Window Download complete 5


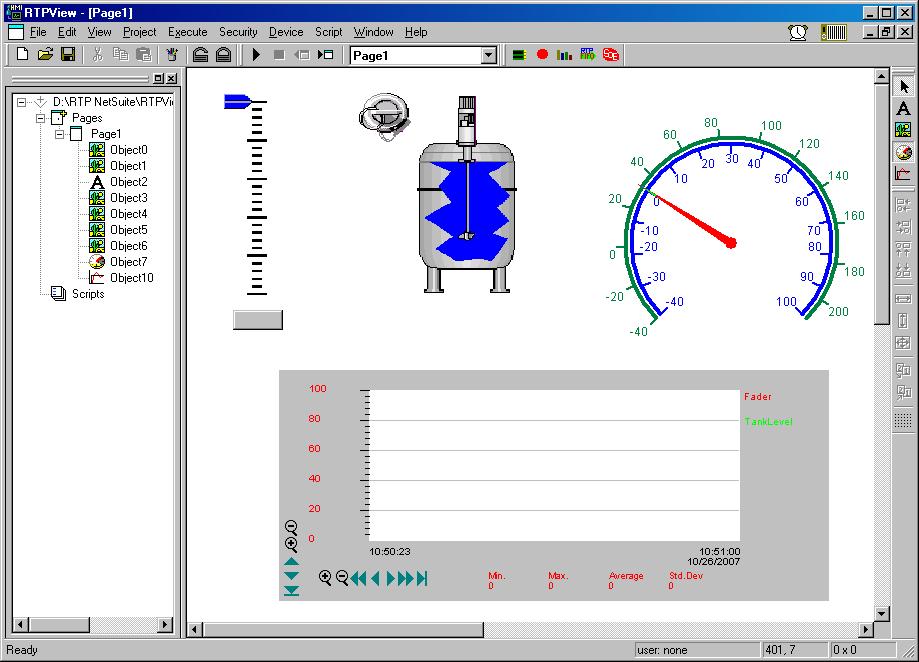
6 RTPView Project The RTPView will contain a Fader and a Key Switch that write data to the NetArrays project program, and a Tank, a Temperature Gauge, and A Trend object that read data from the NetArrays project program. In the NetArrays toolbar, click the button to launch RTPView. In RTPView, click on the (New Project) button to begin a new project. New Project Button Run Edit Box Button Picture Button Gauge Button Trend Button Group Button Object Size Position Select No to the question: Project has been modified. Save Changes? 6
 button in the Palette toolbar. Move the cursor near the upper left corner of the page and click the mouse button.")
7 Fader The Fader consists of a static Scale picture object, a Pointer picture object that drives a variable in the NetArrays project program, and an Edit Box object that reads the Fader position form a variable in the NetArrays project program. Fader Scale Click on the (Picture) button in the Palette toolbar. Move the cursor near the upper left corner of the page and click the mouse button. A dark gray rectangle will appear on the page. Right-click on the rectangle and select Object Properties from the menu. This will display the Object Properties dialog. Click on the Image tab of the Properties dialog. From the Category list, select Scales. From the list of Pictures, select Scale2(0-2-50).bmp. The picture will appear in the Preview frame. Select Scales Select Scale2(0-2-50).bmp 7
8 Click the OK button to close the Properties dialog. Select the Scale object, press and hold the Shift key, and use the arrow keys to adjust the size of the Scale to 20 x 200 pixels. Release the Shift key and use the arrow keys to position the Scale at coordinates 60, 30. It should look like the following example. Fader Pointer Click on the (Picture) button in the Palette toolbar. Move the cursor near the top of the Scale and click the mouse button. A dark gray rectangle will appear over the scale. Right-click on the rectangle and select Object Properties from the menu. In the General tab of the Properties dialog, select Read/Write as the Data property. Check the check box to the left of Repeat write while mouse button is pressed. RTPView will write the output of this object as it is being moved. Select Read/Write Check Repeat Box Click on the Image tab of the Properties dialog. From the list of categories, select Misc. From the list of Pictures, select needleblue.bmp. The picture will appear in the Preview frame. 8


9 Select Misc Select needleblue.bmp Click the OK button to close the Properties dialog. Select the Pointer object, press and hold the Shift key, and use the arrow keys to adjust the size of the Pointer to 30 x 15 pixels. Release the Shift key and use the arrow keys to position the Pointer at coordinates 36, 26. This positions the Pointer at the top of the Scale. Right-click on the Pointer object again and select Object Properties from the menu. Click on the Motion tab of the Properties dialog. Check the Enable checkbox to enable motion control for the object. Select Up as the Move property. Leave the Min Value at 0 and the Max Value at 100. Check Enable Select Up Click the OK button to close the Properties dialog. Drag the bottom anchor point of the Pointer down to just below the bottom of the Scale and release it. This determines the motion length for the object. 9

10 Stretch Pointer Down to Here Fader Output Edit Box Click on the (Edit Box) button in the Palette toolbar. Move the cursor under the bottom of the Scale and click the mouse button. A light gray rectangle will appear below the Scale. Right-click on the rectangle and select Object Properties from the menu. In the General tab of the Properties dialog, select Read as the Data property. Select Read Click on the Text tab. Press the Font button and change the Font settings to Arial, Bold, 12. Click the OK button the close the Font dialog. Click on the Color button and select Red for the text color. Click the OK button the close the Color dialog. Select Center for the Alignment and Raised for the Border type. 10


11 Select Center Select Raised for Border Select Arial, Bold, 12 Select Red for Color Click on the Format tab. Select Float as the text Format, and 0 for the number of Decimal Places. Click the OK button the close the Object Properties dialog. Select Float Change to 0 Right-click on the Edit Box object and select Data Properties from the menu. Click on the Tag column and select Fader from the list of tag names. Click the OK button to close the Data Properties dialog. The Device will automatically be set to the device with the downloaded program. 11
12 Select Fader as the Tag Resize the Edit Box to about 50 x 20 pixels and position it under the center of the fader scale. The completed Fader assembly should look like the example shown below. Resize and Position Here 12

13 Key Switch The Key Switch is a button Picture object that turns the Tank Mixer on and off. Click on the (Picture) button in the Palette toolbar. Move the cursor to the right of the Fader and click the mouse button. A dark gray rectangle will appear on the page. Right-click on the rectangle and select Object Properties from the menu. In the General tab of the Properties dialog, select Read/Write as the Data property. This object will write a Boolean value to the NetArrays project. Select Read/Write Click on the Image tab. Select Buttons as the Category. Click on the scroll down arrow just to the right of the Pictures until the 8 Slot with key turned vertical.bmp as the Picture. The bitmap of the key switch will appear in the Preview frame. Select Buttons Select 8 Slot with key turned vertical.bmp Click on the scroll down arrow just to the right of the Preview frame. The caption Image #1 will appear in the Preview frame. Select 8 Slot with key turned 13


14 horizontal.bmp as the Picture. The second bitmap of the key switch will appear in the Preview frame. Change the entry in the Value field below the Preview to 1. Click Here Enter 1 Select 8 Slot with key turned horizontal.bmp Click on the Button tab. Check the Enable checkbox to allow the picture object to function as a button. Select Toggle as the button Type. Each time the object is clicked, its output changes state. Check Enable Select Toggle Click on the OK button to close the Object Properties dialog. Select the key switch object and resize it to about 52 x 52 pixels. Move the object to coordinates 172, 25. It should look like the example shown below. Right-click on the Key switch object and select Data Properties from the menu. 14
15 Click on the Tag column and select Key from the list of tag names. Click the OK button to close the Data Properties dialog. Select Key as Tag 15


16 Tank The Tank consists of a static Tank picture image, and Cutaway fill picture, and a Mixer picture image. Tank Image Click on the (Picture) button in the Palette toolbar. Move the cursor to the right of the Key Switch and click the mouse button. A dark gray rectangle will appear on the page. Right-click on the rectangle and select Object Properties from the menu. Click on the Image tab. Select Tanks as the Category, and Tank 22.bmp as the Picture. The bitmap of the tank will appear in the Preview frame. Click the OK button to close the Object Properties dialog. Select Tanks Select Tank 22.bmp Select the Tank object, press and hold the Shift key, and use the arrow keys to adjust the size of the Tank to 100 x 155 pixels. Release the Shift key and use the arrow keys to position the Tank at coordinates 230, 70. The Tank should look like the example shown below. 16
17 Tank Cutaway Click on the button in the Palette toolbar. Move the cursor over the Tank object and click the mouse button. A dark gray rectangle will appear over the Tank. Right-click on the rectangle and select Object Properties from the menu. In the General tab of the Properties dialog, select Read as the Data property. This object will be controlled by a floating-point value from the NetArrays project. Click on the BackColor button. Select Dark Gray as the Background color. Click on the OK button to close the Color dialog. This will be the color of an empty tank cutaway. Select Read Select Dark Gray as the Background Color Click on the Image tab. Select Tank Cutaways as the Category, and Jagged cutaway 3.bmp as the Picture. The bitmap of the cutaway will appear in the Preview frame. Select Tank Cutaways Select Jagged cut-away 3.bmp Click on the Fill tab. Check the Enable checkbox. Select Up as the Fill function. Leave the Min Value and Max. Value fields at their default values (0 and 100). 17

18 Click on the Fill Color button and select Blue as the fill color. Click on the OK button to close the Color dialog. Click on the Display Value None radio button. Check Enable Select Up Select Blue for Fill Color Select None Click on the OK button to close the Object Properties dialog. Right-click on the cutaway object and select Data Properties from the menu. Click on the Tag column and select TankLevel from the list of tag names. Click the OK button to close the Data Properties dialog. Select TankLevel as the Tag Select the cutaway and resize it to about 85 x 100 pixels. Move the object so that it overlays the Tank as shown in the example below. 18

19 Resize and Position Over Tank Tank Mixer Click on the button in the Palette toolbar. Move the cursor over the Tank object and click the mouse button. A dark gray rectangle will appear over the Tank. Right-click on the rectangle and select Object Properties from the menu. In the General tab of the Properties dialog, select Read as the Data property. The image displayed will be controlled by the Waveform Generator in the NetArrays project. Select Read Click on the Image tab. Select Mixers as the Category, and Magnetic mixer 1.bmp as the Picture. The bitmap of the mixer will appear in the Preview frame. 19
20 Select Mixers Select Magnetic mixer 1.bmp Click on the scroll down arrow just to the right of the Preview frame. The caption Image #1 will appear in the Preview frame. Select Magnetic mixer 2.bmp as the Picture. The second mixer bitmap will appear in the Preview frame. Change the entry in the Value field below the Preview to 1. Click Here Enter 1 Select Magnetic mixer 2.bmp Click on the scroll down arrow again. The caption Image #2 will appear in the Preview frame. Select Magnetic mixer 3.bmp as the Picture. The third mixer bitmap will appear in the Preview frame. Change the entry in the Value field to 2. 20
21 Click Here Enter 2 Select Magnetic mixer 3.bmp Click on the scroll down arrow again. The caption Image #3 will appear in the Preview frame. Select Magnetic mixer 4.bmp as the Picture. The last mixer bitmap will appear in the Preview frame. Change the entry in the Value field to 3. Click Here Enter 3 Select Magnetic mixer 4.bmp Click on the OK button to close the Object Properties dialog. Select the mixer object and resize it to about 30 x 145 pixels. Move the object so that it appears over the Tank as shown in the following example. 21

22 Resize and Position Over Tank Right-click on the mixer object and select Data Properties from the menu. Click on the Tag column and select Mixer from the list of tag names. Click the OK button to close the Data Properties dialog. Select Mixer as Tag 22
 button in the Palette toolbar. Move the cursor to the right of the Tank and click the mouse button. The Gauge object will appear on the page.")

23 Temperature Gauge The Temperature Gauge displays both Celsius and Fahrenheit temperatures derived from the Fader output in the RTPView project. It is created from a single Gauge object. Click on the (Gauge) button in the Palette toolbar. Move the cursor to the right of the Tank and click the mouse button. The Gauge object will appear on the page. Select the Gauge object, press and hold the Shift key, and use the arrow keys to adjust the size of the Scale to 300 x 260 pixels. Resize to 300 x 260 Right-click on the Gauge and select Object Properties from the menu. In the Annulars tab of the Properties dialog, increase the # of Annulars to 2. The Annular ID and Scale ID fields should indicate 1. Click on the Color button and select Blue as the color of the first annular. Click on the OK button to close the Color dialog. Change the Angular Dimensions Start parameter to -45 degrees and the Stop parameter to 225 degrees. Leave the Radius and Width Dimensions at the default values (100 and 4). Select Blue as Color Change to 2 Change to -45 Change to

24 Change the Annular ID to 2 and the Scale ID to 2 to select the second annular. Click on the Color button and select Green as the color of the second annular. Click on the OK button to close the Color dialog. Change the Angular Dimensions Start to -45 degrees and the Stop to 225 degrees. Change the Radius Dimension to 105. Leave the Width Dimension at the default value (4). Change to 2 Select Green as Color Change to 105 Change to -45 Change to 225 Click on the Background tab of the Properties dialog. Click on the Color button and select White as the background color. Click OK to close the Color dialog. Leave the Border parameters at the default values (None). Select White as Color Click on the Digital tab of the Properties dialog. Un-check the Enable checkbox to disable the digital value display. 24

. Leave the Direction setting at Clockwise.")
25 Un-Check Enable Click on the Needle tab of the Properties dialog. Un-check the Write data checkbox. This object will be reading data. Change the Length to 110 pixels and the Width to 6 pixels. Change to 110 Un-Check Write data Change to 6 Click on the Scales tab of the Properties dialog. Increase the # of Scales to 2. The Scale ID field should indicate 1. Enter the value -40 into the Limits Minimum field. Leave the Limits Maximum field at its default value (100). Leave the Direction setting at Clockwise. Change the Start Angle to -45 degrees and the Stop Angle to 225 degrees. Leave the Horizontal and Vertical Center Positions at the default settings (150 and 150). 25

26 Enter -40 Change to 2 Enter -45 Change to 225 Change the Scale ID to 2 to select the second scale. Enter the value -40 into the Limits Minimum field. Enter the value 212 into the Limits Maximum field. Leave the Direction setting at Clockwise. Change the Start Angle to -45 degrees and the Stop Angle to 225 degrees. Leave the Horizontal and Vertical Center Positions at the default settings (150 and 150). Enter -40 Enter 212 Change to 2 Enter -45 Change to 225 Click on the Ticks tab of the Properties dialog. Increase the # of Ticks to 2. The Tick ID and Scale ID fields should indicate 1. Check the Labels checkbox. Change the label Position to -8. Click the Font button and change the Size to 9. Click OK to close the Font dialog. Click on the Color button and select Blue as the color of the Ticks. Click OK to close the Color dialog Change the Start Range to -40. Leave the Stop Range and Delta at their default values (100 and 10). Leave the Length Dimension at the default value (-10). Change the Width Dimension to 2. 26

27 Change to 2 Check Box Change to -8 Change Size to 9 Change Color to Blue Change to -40 Change to 2 Change the Tick ID to 2 and the Scale ID to 2. Check the Labels checkbox. Change the label Position to 10. Click the Font button and change the Size to 9. Click OK to close the Font dialog. Click on the Color button and select Green as the color of the Ticks. Click OK to close the Color dialog Change the Start Range to -40. Change the Stop Range to 212. Change the Delta value to 20. Change the Length Dimension to 10 and the Width Dimension to 2. Check Box Change to 2 Change to 10 Change Size to 9 Change to -40 Change to 212 Change to 20 Change Color to Green Change to 10 Change to 2 Click on the OK button to close the Object Properties dialog. The temperature gauge should look like the example shown below. Select the object and reposition it to coordinates 350, 5. 27


28 Right-click on the Temperature Gauge object and select Data Properties from the menu. Click on the Tag column and select Celsius from the list of tag names. Click the OK button to close the Data Properties dialog. Select Celsius as Tag 28

 Select Fader as Tag Select TankLevel as Tag Click on the Frame tab. Select Bumped as the Border type.")
29 Trend The Trend object will plot the output of the Fader and the Tank fill level. It consists of a single Trend object. Click on the (Trend) button in the Palette toolbar. Move the cursor below the other objects and click the mouse button. The Trend object will appear on the page. Right-click on the Trend and select Object Properties from the menu. Select Fader as the Tagname in the first row. Select TankLevel as the Tagname in the second row. Leave the Min, Max, Scale, and Offset entries at the default values. (Both of these variables range from 0 to 100.) Select Fader as Tag Select TankLevel as Tag Click on the Frame tab. Select Bumped as the Border type. Click on the Background Color button and select White. Click the OK button to close the Color dialog. Click the OK button to close the Object Properties dialog. 29


30 Select Bumped Select White as Background Color Page Properties Right-click on any empty space within the page and select Data Properties from the menu. Enter the value 100 in the Update Rate (ms) field. This will speed up the execution rate and provide smother motion of the objects. Click on the OK button to close Page Properties. Enter

, and click Save.")
31 This completes the RTPView project. Save the project by clicking on File and select Save Project as Navigate to the RTPView directory, type in a name (such as Test), and click Save. Your project should look like the example below. 31
32 32

33 Verification Now that the RTPView project is completed, we will now run the project. Click on the (Run) button in the toolbar. Click on the Fader pointer and drag it up to mid scale and release it. Observe that the Tank appears to fill to the same level and that the Temperature Gauge needle moves to mid scale. Also observe that the Trend object plots the values of both the Fader output and the level in the Tank. Click on the Key switch and the Mixer will appear to start running. Move the Fader pointer to any other position on the scale. If any of the objects do not behave as expected, stop the project and recheck the configuration of the object s properties. Congratulations! You have successfully completed and run an RTPView project program. 33
34 Including Your Own Images in RTPView The previous examples used only picture images that were supplied with RTPView. In addition to the included images, you can add any of your own bitmap images into your RTPView project. All you have to do is save your bitmap in one of the RTPView/Picture directories, or create your own category directory. However, there are some important issues to consider when you adding your own picture images. If you look through the Bitmap images in the RTP NetSuite\RTPView\Pictures directory, you will notice that all the bitmap files are about 150 pixels square or smaller. They may be stretched or compressed as required in the RTPView page. All images are assigned a Mask Color. RTPView monitors each pixel of the masked portion of the image and replaces it with the appropriate pixel from behind the image. For example, in the Tank Cutaway used in the previous example, the masked area was replaced with areas of the Tank image. Masked Area Mask Color The mask color must not be a color that is part of the displayed image. Note that the supplies bitmap files use purple as the mask color. This particular color is not part of the intended display. The default mask color assigned by RTPView is the color of the upper leftmost pixel in the bitmap. You can change the selected mask color by clicking on color in the Image Preview of the Object Properties dialog. The selected mask color is displayed in the MC box below the Preview. When creating a bitmap file, crop the image to remove as much blank background as possible. This will greatly reduce the size of the bitmap file. After cropping, change the color of the upper-left pixel in the bitmap image. For example, you could change it from white to purple as shown in the figure on the next page. The purple (or other color) pixel will then become the default mask color when the picture object is placed onto the RTPView page. Note that if the bitmap is large, it will be severely compressed in the Image Preview, and it may be difficult to select another mask color from the Preview. 34

35 When using line art drawings (for example, thin black lines on a large solid background), do not select the background as the mask color. Use another color, which is not part of the line art drawing, as the mask color. When using photographic images, make sure the mask color does not occur anywhere else in the image. This will create unintended small holes in the image. Detail of Upper Left Corner Crop Image to Reduce Size 35
Setup Examples. NetArrays Project Program Development
 Setup Examples NetArrays Project Program Development NetArrays Project Program Development Example 2005, 2007, 2008, 2009 RTP Corporation Not for reproduction in any printed or electronic media without
Setup Examples. Project Tag Database Setup Example
 Setup Examples Project Tag Database Setup Example 1 Project Tag Database Setup Example 2005-2018 RTP Corporation Not for reproduction in any printed or electronic media without express written consent
Setup Examples. Thermocouple Card Configuration
 Setup Examples Thermocouple Card Configuration Thermocouple Card Configuration Examples 2005, 2008, 2009 RTP Corporation Not for reproduction in any printed or electronic media without express written
Excel 2003 Tutorial II
 This tutorial was adapted from a tutorial by see its complete version at http://www.fgcu.edu/support/office2000/excel/index.html Excel 2003 Tutorial II Charts Chart Wizard Chart toolbar Resizing a chart
Introduction to Microsoft Office PowerPoint 2010
 Introduction to Microsoft Office PowerPoint 2010 TABLE OF CONTENTS Open PowerPoint 2010... 1 About the Editing Screen... 1 Create a Title Slide... 6 Save Your Presentation... 6 Create a New Slide... 7
Guide to WB Annotations
 Guide to WB Annotations 04 May 2016 Annotations are a powerful new feature added to Workbench v1.2.0 (Released May 2016) for placing text and symbols within wb_view tabs and windows. They enable generation
Creating Interactive PDF Forms
 Creating Interactive PDF Forms Using Adobe Acrobat X Pro for the Mac University Information Technology Services Training, Outreach, Learning Technologies and Video Production Copyright 2012 KSU Department
Introduction to the Visual Studio.NET Integrated Development Environment IDE. CSC 211 Intermediate Programming
 Introduction to the Visual Studio.NET Integrated Development Environment IDE CSC 211 Intermediate Programming Visual Studio.NET Integrated Development Environment (IDE) The Start Page(Fig. 1) Helpful links
v Annotation Tools GMS 10.4 Tutorial Use scale bars, North arrows, floating images, text boxes, lines, arrows, circles/ovals, and rectangles.
 v. 10.4 GMS 10.4 Tutorial Use scale bars, North arrows, floating images, text boxes, lines, arrows, circles/ovals, and rectangles. Objectives GMS includes a number of annotation tools that can be used
EZware Quick Start Guide
 EZware Quick Start Guide Your Industrial Control Solutions Source www.maplesystems.com For use as the following: Evaluation Tool for Prospective Users Introductory Guide for New Customers Maple Systems,
Programming in C# Project 1:
 Programming in C# Project 1: Set the text in the Form s title bar. Change the Form s background color. Place a Label control on the Form. Display text in a Label control. Place a PictureBox control on
GIMP TEXT EFFECTS. Text Effects: Outline Completed Project
 GIMP TEXT EFFECTS ADD AN OUTLINE TO TEXT Text Effects: Outline Completed Project GIMP is all about IT (Images and Text) OPEN GIMP Step 1: To begin a new GIMP project, from the Menu Bar, select File New.
Severe Weather Safety PSA
 Contents Add Text 2 Format Text 3 Add Stickers 4 Resize Stickers 8 Change the Color of the Canvas 9 Name the Project 12 Add a Page 12 Practice Adding and Formatting Text 13 Use the Paint Brush Tool 14
2 Solutions Chapter 3. Chapter 3: Practice Example 1
 1 Solutions This section includes the step by step solutions for the practice exercise for the following chapters and sections: Chapter 3 Chapter 4 Chapter 5 Chapter 11: Rainbow Springs sample test Final
Tutorials. Lesson 3 Work with Text
 In this lesson you will learn how to: Add a border and shadow to the title. Add a block of freeform text. Customize freeform text. Tutorials Display dates with symbols. Annotate a symbol using symbol text.
Section 5. Pictures. By the end of this Section you should be able to:
 Section 5 Pictures By the end of this Section you should be able to: Use the Clip Gallery Insert and Delete Pictures Import Pictures Move, Resize and Crop Pictures Add Borders and Colour Wrap Text around
Lesson 6 Adding Graphics
 Lesson 6 Adding Graphics Inserting Graphics Images Graphics files (pictures, drawings, and other images) can be inserted into documents, or into frames within documents. They can either be embedded or
CPM-200 User Guide For Lighthouse for MAX
 CPM-200 User Guide For Lighthouse for MAX Contents Page Number Opening the software 2 Altering the page size & Orientation 3-4 Inserting Text 5 Editing Text 6 Inserting Graphics 7-8 Changing the Colour
InDesign Tools Overview
 InDesign Tools Overview REFERENCE If your palettes aren t visible you can activate them by selecting: Window > Tools Transform Color Tool Box A Use the selection tool to select, move, and resize objects.
Creating 3D Text with LibreOffice
 Creating 3D Text You probably have seen examples of 3D text and perhaps wondered how it can be done. As with most computer graphics, there are a lot of programs that can do 3D modeling. However, there
TABLE OF CONTENTS TABLE OF CONTENTS... 1 INTRODUCTION... 2 USING WORD S MENUS... 3 USING WORD S TOOLBARS... 5 TASK PANE... 9
 TABLE OF CONTENTS TABLE OF CONTENTS... 1 INTRODUCTION... 2 USING WORD S MENUS... 3 DEFINITIONS... 3 WHY WOULD YOU USE THIS?... 3 STEP BY STEP... 3 USING WORD S TOOLBARS... 5 DEFINITIONS... 5 WHY WOULD
1) Merge the cells that contain the title and center the title
 Merge the cells that contain the title and center the title") Supplies: You will need a storage location to save your spreadsheet for use in Session 2. You will need the 2 handouts pertaining to Session 1 Instructions: Follow the directions below to create a budget
Supplies: You will need a storage location to save your spreadsheet for use in Session 2. You will need the 2 handouts pertaining to Session 1 Instructions: Follow the directions below to create a budget
XnView 1.9. a ZOOMERS guide. Introduction...2 Browser Mode... 5 Image View Mode...15 Printing Image Editing...28 Configuration...
 XnView 1.9 a ZOOMERS guide Introduction...2 Browser Mode... 5 Image View Mode...15 Printing... 22 Image Editing...28 Configuration... 36 Written by Chorlton Workshop for hsbp Introduction This is a guide
GIMP WEB 2.0 ICONS. GIMP is all about IT (Images and Text) OPEN GIMP
 OPEN GIMP") GIMP WEB 2.0 ICONS Web 2.0 Banners: Download E-Book WEB 2.0 ICONS: DOWNLOAD E-BOOK OPEN GIMP GIMP is all about IT (Images and Text) Step 1: To begin a new GIMP project, from the Menu Bar, select File New.
GIMP WEB 2.0 ICONS Web 2.0 Banners: Download E-Book WEB 2.0 ICONS: DOWNLOAD E-BOOK OPEN GIMP GIMP is all about IT (Images and Text) Step 1: To begin a new GIMP project, from the Menu Bar, select File New.
IGCSE ICT Section 16 Presentation Authoring
 IGCSE ICT Section 16 Presentation Authoring Mr Nicholls Cairo English School P a g e 1 Contents Importing text to create slides Page 4 Manually creating slides.. Page 5 Removing blank slides. Page 5 Changing
Designer Reference 1
 Designer Reference 1 Table of Contents USE OF THE DESIGNER...4 KEYBOARD SHORTCUTS...5 Shortcuts...5 Keyboard Hints...5 MENUS...7 File Menu...7 Edit Menu...8 Favorites Menu...9 Document Menu...10 Item Menu...12
Basic Concepts 1. Starting Powerpoint 2000 (Windows) For the Basics workshop, select Template. For this workshop, select Artsy
 For the Basics workshop, select Template. For this workshop, select Artsy") 1 Starting Powerpoint 2000 (Windows) When you create a new presentation, you re prompted to choose between: Autocontent wizard Prompts you through a series of questions about the context and content of
1 Starting Powerpoint 2000 (Windows) When you create a new presentation, you re prompted to choose between: Autocontent wizard Prompts you through a series of questions about the context and content of
FrontPage 2000 Tutorial -- Advanced
 FrontPage 2000 Tutorial -- Advanced Shared Borders Shared Borders are parts of the web page that share content with the other pages in the web. They are located at the top, bottom, left side, or right
JASCO CANVAS PROGRAM OPERATION MANUAL
 JASCO CANVAS PROGRAM OPERATION MANUAL P/N: 0302-1840A April 1999 Contents 1. What is JASCO Canvas?...1 1.1 Features...1 1.2 About this Manual...1 2. Installation...1 3. Operating Procedure - Tutorial...2
Unit 21 - Creating a Navigation Bar in Macromedia Fireworks
 Unit 21 - Creating a Navigation Bar in Macromedia Fireworks Items needed to complete the Navigation Bar: Unit 21 - House Style Unit 21 - Graphics Sketch Diagrams Document ------------------------------------------------------------------------------------------------
Using Graphics. Digital Camera. Auto Shapes
 AutoShape Using Graphics Internet The following graphic elements are available to enhance your presentation Clip Art AutoShapes Fill effects Shadow effects 3D effects Digital Camera WordArt Digital Camera
Basic Concepts 1. For this workshop, select Template
 Basic Concepts 1 When you create a new presentation, you re prompted to choose between: Autocontent wizard Prompts you through a series of questions about the context and content of your presentation not
Inserting Information into PowerPoint
 LESSON 6 6.1 Inserting Information into PowerPoint After completing this lesson, you will be able to: Change the layout of a slide. Insert a clip art image. Scale an image. Insert and format a table. Insert
ClipArt and Image Files
 ClipArt and Image Files Chapter 4 Adding pictures and graphics to our document not only breaks the monotony of text it can help convey the message quickly. Objectives In this section you will learn how
WEEK NO. 12 MICROSOFT EXCEL 2007
 WEEK NO. 12 MICROSOFT EXCEL 2007 LESSONS OVERVIEW: GOODBYE CALCULATORS, HELLO SPREADSHEET! 1. The Excel Environment 2. Starting A Workbook 3. Modifying Columns, Rows, & Cells 4. Working with Worksheets
User Manual Version 1.1 January 2015
 User Manual Version 1.1 January 2015 - 2 / 112 - V1.1 Variegator... 7 Variegator Features... 7 1. Variable elements... 7 2. Static elements... 7 3. Element Manipulation... 7 4. Document Formats... 7 5.
Excel 2016 Basics for Windows
 Excel 2016 Basics for Windows Excel 2016 Basics for Windows Training Objective To learn the tools and features to get started using Excel 2016 more efficiently and effectively. What you can expect to learn
Building a Basic Application with DT Vision Foundry
 Goal Building a Basic Application with DT Vision Foundry This tutorial demonstrates how to develop an inspection application with DT Vision Foundry machine vision software from Data Translation. You will
Solo 4.6 Release Notes
 June9, 2017 (Updated to include Solo 4.6.4 changes) Solo 4.6 Release Notes This release contains a number of new features, as well as enhancements to the user interface and overall performance. Together
Setup Examples. Thermocouple Card Configuration
 etup Examples Thermocouple Card Configuration Thermocouple Card Configuration Examples 2005, 2006 RTP Corporation Not for reproduction in any printed or electronic media without express written consent
PowerPoint Basics (Office 2000 PC Version)
") PowerPoint Basics (Office 2000 PC Version) Microsoft PowerPoint is software that allows you to create custom presentations incorporating text, color, graphics, and animation. PowerPoint (PP) is available
PowerPoint Basics (Office 2000 PC Version) Microsoft PowerPoint is software that allows you to create custom presentations incorporating text, color, graphics, and animation. PowerPoint (PP) is available
Tutorial 3 - Welcome Application
 1 Tutorial 3 - Welcome Application Introduction to Visual Programming Outline 3.1 Test-Driving the Welcome Application 3.2 Constructing the Welcome Application 3.3 Objects used in the Welcome Application
Adding Text and Images. IMCOM Enterprise Web CMS Tutorial 1 Version 2
 Adding Text and Images IMCOM Enterprise Web CMS Tutorial 1 Version 2 Contents and general instructions PAGE: 3. First steps: Open a page and a block to edit 4. Edit text / The menu bar 5. Link to sites,
Quick Guide for Photoshop CC Basics April 2016 Training:
 Photoshop CC Basics Creating a New File 1. Click File > New 2. Keep Default Photoshop Size selected in the Preset drop-down list. 3. Click OK. Showing Rulers 1. On the Menu bar, click View. 2. Click Rulers.
Chapter 11: Going All Out with FrontPage
 Chapter 11: Going All Out with FrontPage Creating a Product Page Easy Web Design project, Chapter 11 Most store sites need at least one product page. On the Notebooks Web site, the Products page is divided
Thermacam Reporter 2000 Professional Template Building Tutorial
 Introduction: This tutorial will guide you step-by-step through the process of creating a new template using Thermacam Reporter 2000 Professional. The template consists of an item page with an IR image
Microsoft Excel 2007
 Microsoft Excel 2007 1 Excel is Microsoft s Spreadsheet program. Spreadsheets are often used as a method of displaying and manipulating groups of data in an effective manner. It was originally created
13. Albums & Multi-Image Printing
 13. Albums & Multi-Image Printing The Album function is a flexible layout and printing tool that can be used in a number of ways: Two kinds of albums: At left we used automatic mode to print a collection
What is Publisher, anyway?
 What is Publisher, anyway? Microsoft Publisher designed for users who need to create and personalize publications such as marketing materials, business stationery, signage, newsletters and other items
DataViews for Windows Version 2.0
 DataViews for Windows Version 2.0 Introduction GE Fanuc DataViews Headquarters 47 Pleasant Street Northampton, MA 01060 U.S.A. Telephone:(413) 586-4144 FAX:(413) 586-3805 email:info@dvcorp.com web:www.dvcorp.com
Unit 8. Lesson 8.1. Microsoft FrontPage. Introduction. Microsoft FrontPage-1. Microsoft FrontPage
 Microsoft FrontPage Unit 8 Microsoft FrontPage Introduction Lesson 8.1 Microsoft FrontPage-1 A number of Software Packages are available in market for creating a website. Among popular software s are Dreamweaver,
Graphics. Setting Snap to Grid
 2 This chapter describes how to add static and dynamic graphics to a control panel and how to create and use custom graphics. Any visible item on a LookoutDirect control panel is a graphic. All graphics
Power Point 2000 Level 1
 Introduction Opening PowerPoint, Using the AutoContent Wizard, Window Elements, Working in the Outline and Slide Window Panes, Understanding Different Views, and Saving the Presentation. Contents Introduction
Introduction to Microsoft PowerPoint 2000
 Introduction to Microsoft PowerPoint 2000 TABLE OF CONTENTS Accessing PowerPoint 2000... 3 Starting a Presentation... 3 About the Editing Screen in Normal Screen View... 4 About Menu Displays in PowerPoint
Using Microsoft Word. Working With Objects
 Using Microsoft Word Many Word documents will require elements that were created in programs other than Word, such as the picture to the right. Nontext elements in a document are referred to as Objects
Recipes4Success. Draw and Animate a Rocket Ship. Frames 5 - Drawing Tools
 Recipes4Success You can use the drawing tools and path animation tools in Frames to create illustrated cartoons. In this Recipe, you will draw and animate a rocket ship. 2012. All Rights Reserved. This
Excel 2016 Basics for Mac
 Excel 2016 Basics for Mac Excel 2016 Basics for Mac Training Objective To learn the tools and features to get started using Excel 2016 more efficiently and effectively. What you can expect to learn from
Software Program User Manual
 2MPro Sign Software Version 2.13 3/18/2004 Page 1 2MPRO Software Program User Manual Software License Agreement This Software was Written Specifically for use on predetermined signs and is not intended
Creating and Modifying Charts
 Creating and Modifying Charts Introduction When you re ready to share data with others, a worksheet might not be the most effective way to present the information. A page full of numbers, even if formatted
Microsoft Powerpoint 2013
 Microsoft Powerpoint 2013 Lesson 4 Designing a Presentation 2014, John Wiley & Sons, Inc. Microsoft Official Academic Course, Microsoft Word 2013 1 Objectives 2014, John Wiley & Sons, Inc. Microsoft Official
Labels and Envelopes in Word 2013
 Labels and Envelopes in Word 2013 Labels... 2 Labels - A Blank Page... 2 Selecting the Label Type... 2 Creating the Label Document... 2 Labels - A Page of the Same... 3 Printing to a Specific Label on
NiceLabel Designer Standard User Guide
 NiceLabel Designer Standard User Guide English Edition Rev-1112 2012 Euro Plus d.o.o. All rights reserved. Euro Plus d.o.o. Poslovna cona A 2 SI-4208 Šenčur, Slovenia tel.: +386 4 280 50 00 fax: +386 4
HYPERSTUDIO TOOLS. THE GRAPHIC TOOL Use this tool to select graphics to edit. SPRAY PAINT CAN Scatter lots of tiny dots with this tool.
 THE BROWSE TOOL Us it to go through the stack and click on buttons THE BUTTON TOOL Use this tool to select buttons to edit.. RECTANGLE TOOL This tool lets you capture a rectangular area to copy, cut, move,
Microsoft PowerPoint 2013 Beginning
 Microsoft PowerPoint 2013 Beginning PowerPoint Presentations on the Web... 2 Starting PowerPoint... 2 Opening a Presentation... 2 File Tab... 3 Quick Access Toolbar... 3 The Ribbon... 4 Keyboard Shortcuts...
DEVELOPING DATABASE APPLICATIONS (INTERMEDIATE MICROSOFT ACCESS, X405.5)
") Technology & Information Management Instructor: Michael Kremer, Ph.D. Database Program: Microsoft Access Series DEVELOPING DATABASE APPLICATIONS (INTERMEDIATE MICROSOFT ACCESS, X405.5) Section 5 AGENDA
Technology & Information Management Instructor: Michael Kremer, Ph.D. Database Program: Microsoft Access Series DEVELOPING DATABASE APPLICATIONS (INTERMEDIATE MICROSOFT ACCESS, X405.5) Section 5 AGENDA
Exploring Microsoft Office Word 2007
 Exploring Microsoft Office Word 2007 Chapter 3: Enhancing a Document Robert Grauer, Keith Mulbery, Michelle Hulett Objectives Insert a table Format a table Sort and apply formulas to table data Convert
Start by launching Mozilla To start making a web page, go to File -> New -> Composer Page
 Creating a Web Page using Mozilla Composer- A Free Open Source Application Emily Hebard IT Lab School of Information University of Texas at Austin Spring 2003 Objectives Orient to the Mozilla Composer
Create and edit text. Create the title text First you ll create the title text for the car rental ad.
 8 Choose the Pointer tool and click the mask thumbnail in the Layers panel. The Property inspector shows that the mask was applied using its grayscale appearance. The darker pixels in the mask knock out
Recipes4Success. Animate Plant Growth. Share 4 - Animation
 Recipes4Success In this Recipe, you will create an animated science diagram of plant growth. You will learn how to add images, draw shapes, use the animation options, preview, and publish your project.
Using Inspiration 7 I. How Inspiration Looks SYMBOL PALETTE
 Using Inspiration 7 Inspiration is a graphic organizer application for grades 6 through adult providing visual thinking tools used to brainstorm, plan, organize, outline, diagram, and write. I. How Inspiration
The Mathcad Workspace 7
 For information on system requirements and how to install Mathcad on your computer, refer to Chapter 1, Welcome to Mathcad. When you start Mathcad, you ll see a window like that shown in Figure 2-1. By
Using Reports. Access 2013 Unit D. Property of Cengage Learning. Unit Objectives. Files You Will Need
 Unit D CASE Samantha Hooper, a tour developer at Quest Specialty Travel, asks you to produce some reports to help her share and analyze data. A report is an Access object that creates a professional looking
KODAK Software User s Guide. Software Version 9.0
 KODAK Create@Home Software User s Guide Software Version 9.0 Table of Contents 1 Welcome to KODAK Create@Home Software Features... 1-1 Supported File Formats... 1-1 System Requirements... 1-1 Software
ASIC-200 Version 5.0. integrated industrial control software. HMI Guide
 ASIC-200 Version 5.0 integrated industrial control software HMI Guide Revision Description Date C Name change, correct where applicable with document 4/07 HMI Guide: 139168(C) Published by: Pro-face 750
Getting Started Guide. Chapter 11 Graphics, the Gallery, and Fontwork
 Getting Started Guide Chapter 11 Graphics, the Gallery, and Fontwork Copyright This document is Copyright 2005 2008 by its contributors as listed in the section titled Authors. You may distribute it and/or
OpenStax-CNX module: m Thermometer VI * National Instruments
 OpenStax-CNX module: m12209 1 Thermometer VI * National Instruments This work is produced by OpenStax-CNX and licensed under the Creative Commons Attribution License 1.0 Exercise 1 Complete the following
On the Web sun.com/aboutsun/comm_invest STAROFFICE 8 DRAW
 STAROFFICE 8 DRAW Graphics They say a picture is worth a thousand words. Pictures are often used along with our words for good reason. They help communicate our thoughts. They give extra information that
Using Styles In Microsoft Word 2002
 INFORMATION SYSTEMS SERVICES Using Styles In Microsoft Word 2002 This document contains a series of exercises in the use of styles in the Microsoft Word 2002 word processing software. AUTHOR: Information
MS WORD INSERTING PICTURES AND SHAPES
 MS WORD INSERTING PICTURES AND SHAPES MICROSOFT WORD INSERTING PICTURES AND SHAPES Contents WORKING WITH ILLUSTRATIONS... 1 USING THE CLIP ART TASK PANE... 2 INSERTING A PICTURE FROM FILE... 4 FORMATTING
Creating a Text Frame. Create a Table and Type Text. Pointer Tool Text Tool Table Tool Word Art Tool
 Pointer Tool Text Tool Table Tool Word Art Tool Picture Tool Clipart Tool Creating a Text Frame Select the Text Tool with the Pointer Tool. Position the mouse pointer where you want one corner of the text
Creating a Website with Publisher 2016
 Creating a Website with Publisher 2016 Getting Started University Information Technology Services Learning Technologies, Training & Audiovisual Outreach Copyright 2017 KSU Division of University Information
NiceForm User Guide. English Edition. Rev Euro Plus d.o.o. & Niceware International LLC All rights reserved.
 www.nicelabel.com, info@nicelabel.com English Edition Rev-0910 2009 Euro Plus d.o.o. & Niceware International LLC All rights reserved. www.nicelabel.com Head Office Euro Plus d.o.o. Ulica Lojzeta Hrovata
GIMP ANIMATION EFFECTS
 GIMP ANIMATION EFFECTS Animation: Text Word by Word ANIMATION: TEXT WORD BY WORD GIMP is all about IT (Images and Text) BACKGROUND IMAGE Before you begin the text animation, you will download a public
XnView Image Viewer. a ZOOMERS guide
 XnView Image Viewer a ZOOMERS guide Introduction...2 Browser Mode... 5 Image View Mode...14 Printing... 22 Image Editing...26 Configuration... 34 Note that this guide is for XnView version 1.8. The current
Report Generator for DPOPWR
 Online Help Report Generator for DPOPWR Adapted from the Report Generator for DPOPWR Online Help www.tektronix.com Copyright Tektroni x. All rights reserved. Licensed software products are owned by Tektronix
Kidspiration 3 Basics Website:
 Website: http://etc.usf.edu/te/ Kidspiration is the visual learning tool for K-5 learners from the makers of Inspiration. With Kidspiration, students can build graphic organizers such as webs, concept
Stamina Software Pty Ltd. TRAINING MANUAL Viságe Reporter
 Stamina Software Pty Ltd TRAINING MANUAL Viságe Reporter Version: 2 21 st January 2009 Contents Introduction...1 Assumed Knowledge...1 Pre Planning...1 Report Designer Location...2 Report Designer Screen
MS Publisher County of Henrico Public Libraries
 MS Publisher 2013 I. About Publisher A. What is it? Publisher is a desktop publishing program that assists you in designing and producing professional documents that combine text, graphics, illustrations,
BASIC MICROSOFT POWERPOINT
 BASIC MICROSOFT POWERPOINT PART ONE PHONE: 504-838-1144 IT Training Team Jefferson Parish Library EMAIL: jpltrain@jplibrary.net In this class you will learn to: Launch, close, and interact with Microsoft
MICROSOFT WORD 2010 Quick Reference Guide
 MICROSOFT WORD 2010 Quick Reference Guide Word Processing What is Word Processing? How is Word 2010 different from previous versions? Using a computer program, such as Microsoft Word, to create and edit
KODAK Software User s Guide
 KODAK Create@Home Software User s Guide Table of Contents 1 Welcome to KODAK Create@Home Software Features... 1-1 Supported File Formats... 1-1 System Requirements... 1-1 Software Updates...1-2 Automatic
Nauticom NetEditor: A How-to Guide
 Nauticom NetEditor: A How-to Guide Table of Contents 1. Getting Started 2. The Editor Full Screen Preview Search Check Spelling Clipboard: Cut, Copy, and Paste Undo / Redo Foreground Color Background Color
Introducing Gupta Report Builder
 Business Reporting Chapter 1 Introducing Gupta Report Builder You can use Report Builder to design reports. This chapter describes: Our approach to building reports. Some of the reports you can build.
Publisher 2016 Foundation SAMPLE
 Publisher 2016 Foundation Publisher 2016 Foundation Microsoft Publisher 2016 Foundation - Page 2 2015 Cheltenham Group Pty. Ltd. All trademarks acknowledged. E&OE. No part of this document may be copied
SciGraphica. Tutorial Manual - Tutorials 1and 2 Version 0.8.0
 SciGraphica Tutorial Manual - Tutorials 1and 2 Version 0.8.0 Copyright (c) 2001 the SciGraphica documentation group Permission is granted to copy, distribute and/or modify this document under the terms
Getting Started with. Office 2008
 Getting Started with Office 2008 Copyright 2010 - Information Technology Services Kennesaw State University This document may be downloaded, printed, or copied, for educational use, without further permission
Drawing shapes and lines
 Fine F Fi i Handmade H d d Ch Chocolates l Hours Mon Sat 10am 6pm In this demonstration of Adobe Illustrator CS6, you will be introduced to new and exciting application features, like gradients on a stroke
Microsoft Publisher 2013 Foundation. Publisher 2013 Foundation SAMPLE
 Microsoft Publisher 2013 Foundation Publisher 2013 Foundation Microsoft Publisher 2013 Foundation - Page 2 2013 Cheltenham Group Pty. Ltd. All trademarks acknowledged. E&OE. No part of this document may
Page 1. Fireworks Exercise
 Page 1 Fireworks Exercise 1. Create a New Fireworks Document - File>New. For this exercise, choose 800 for width, 600 for height, resolution 72 pixels/inch, canvas color to Transparent, then choose OK.
Publisher 2016 Foundation. North American Edition SAMPLE
 Publisher 2016 Foundation Publisher 2016 Foundation North American Edition Microsoft Publisher 2016 Foundation - Page 2 2015 Cheltenham Group Pty. Ltd. All trademarks acknowledged. E&OE. No part of this