ASMC Professional Development Institute, Anaheim, CA. Teksouth Corp.
|
|
|
- Lawrence Stevens
- 6 years ago
- Views:
Transcription
1 PivotTable Power For You! A Guide to Powerful Data Analysis in Microsoft Excel ASMC Professional Development Institute, Anaheim, CA May 27, 2012 Paul Friedman, CDFM Teksouth Corp. Paul.Friedman.ctr@hq.southcom.mil
2 PivotTable Power For You! Accompanying sample data may be found at: Use this guide to help navigate the main features of Microsoft Excel PivotTable. As you become more experienced, explore additional i options available in Excel menus. The best way to learn PivotTable: Practice! 2
3 PivotTable Power For You! PivotTables work best when source data is properly organized 1. The first row needs to contain column names 2. The second and following rows contain the data to be processed 3. There cannot be any blank rows or columns within the dataset 3


4 Insert a Table I recommend storing your raw data in tables. Tables are great for organization and formatting. Changing your data and adding records is easier. Refreshing an existing PivotTable with new records is simpler. 1 To insert a table: Click anywhere in your data 1. Click the Insert tab 2. Select Table 2 4


5 Insert a table Click OK Now your data is in a table 5


6 Insert a PivotTable Click on your table 1. Select Insert tab 2. Click PivotTable Click OK 1 2 6

7 Insert a PivotTable You now have a PivotTable on a new worksheet. Do not forget to name your worksheet tab. 7


8 Click off the PivotTable. Notice the PivotTable field list and context sensitive ribbon tabs disappear. A PivotTable is an object on the workbook. Excel will only give you access to PivotTable tools when the object is selected. Click on the PivotTable. Notice the tb tabs and the field list reappear. 8


9 Adding Fields Drag and drop Employee field to Row Labels The PivotTable will display all of the records associated itd with the Employee field. 9


10 Adding Fields Drag and drop Region field to Column Labels The PivotTable now displays all of the Region field records across the Y Axis 10


11 Adding Fields Drag and drop Disbursement field to Values Numerical data is displayed as a sum be default. Notice the data is generically formatted. 11
12 Formatting Value Field Right click anywhere on the Value Data. A context sensitive menu will appear. Sect Value Field Setting 12


13 Formatting Value Field Select Number Format Click Currency and OK 13
14 Formatting Value Field You are now back to the Value Field settings menu. You can rename the Custom Name in the PivotTable so long as it does not match the field s source name. However, we do want the same name as the source for readability. The trick is to type a space after the name. 1. Click in the Custom Name input and type Disbursement. Add a space after Disbursement 2. Click OK


15 Formatting Value Field The Disbursement field is formatted as currency. Also note that Sum of Disbursements now reads Disbursement. 15


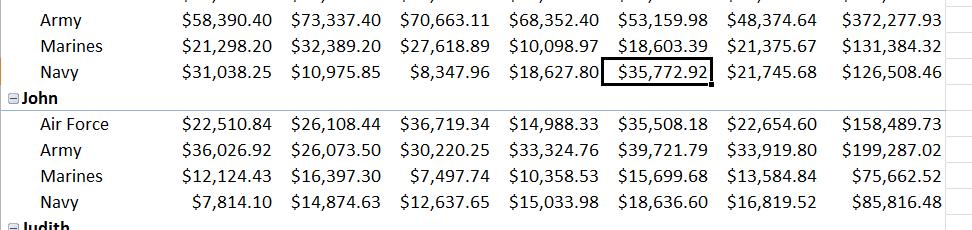
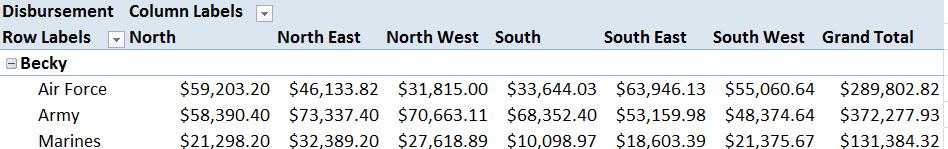
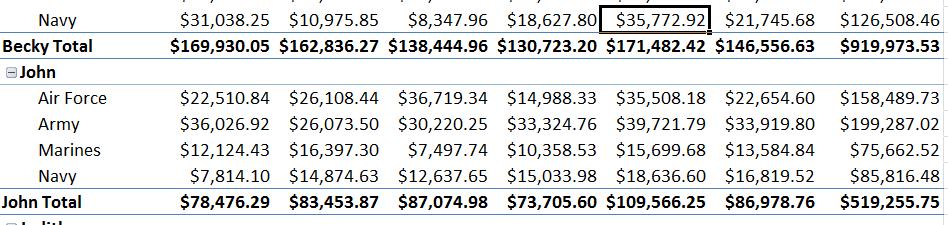
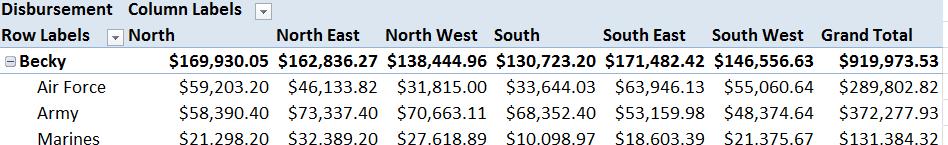
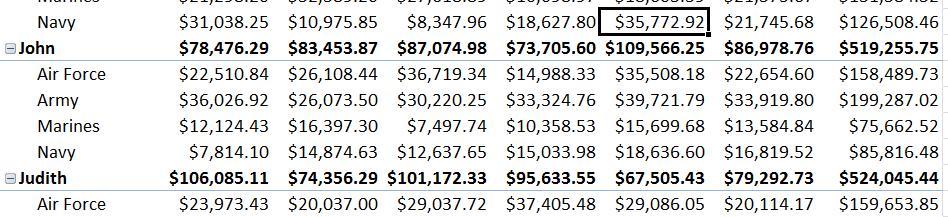
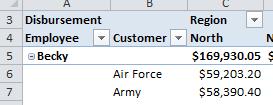
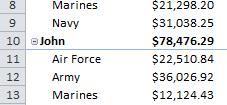
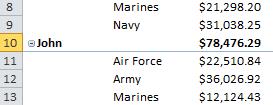
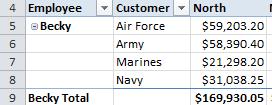
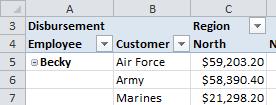
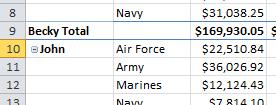
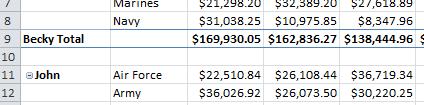
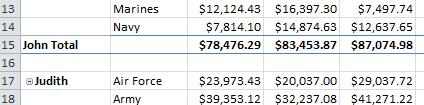
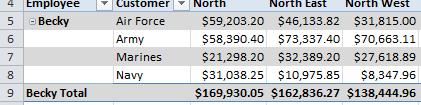
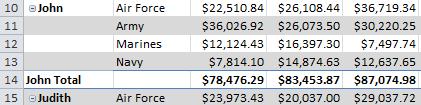
16 Adding Multiple Fields Drag and drop Customer field to Row Labels Make sure to add the field below Employee The PivotTable displays a summarization of each employee followed by a breakout of customers. 16
17 PivotTable Design tab The Design ribbon solely affects cosmetic aspects and readability of the PivotTable report. The next few slides outline the options available. 17
18 18
19 19
20 20
21 21
22 22

23 23


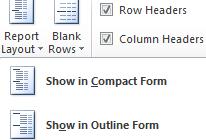
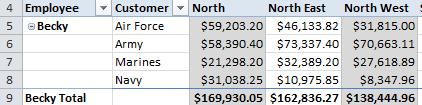
24 PivotTable Styles Click on the bottom right triangle to view all available options. The PivotTable will show you a preview as you hover over a style. You can even create your own new style! 24


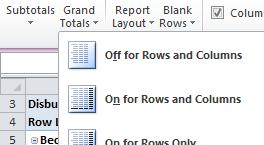
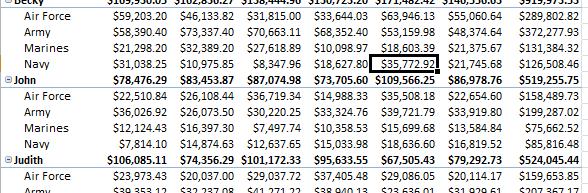
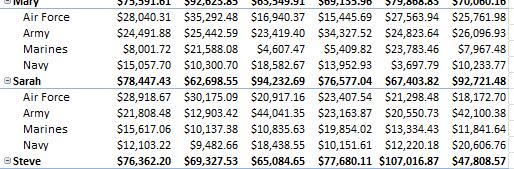
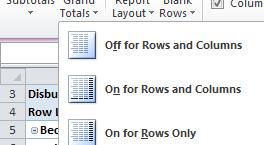
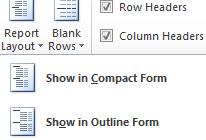
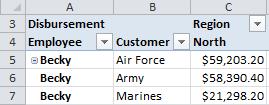
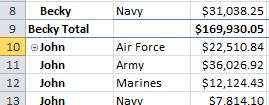
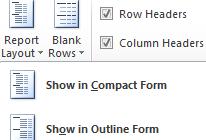
25 Returning to our PivotTable: Select Show all Subtotals at Bottom Group (slide 18) Choose Grand totals On for Rows and Columns (Slide 19) Pick Report Layout Show in Tabular Form (Slide 20) 25


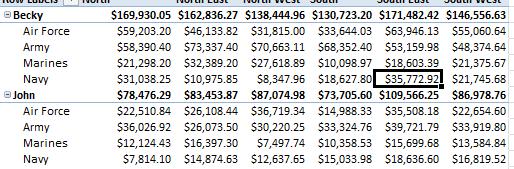
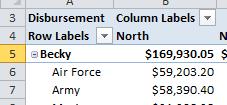
26 Removing Fields Drag and drop Customer field from Row Labels to Field List The report currently displays the sum of travel disbursement by region traveled Alternatively you can Drag and drop Customer field outside of the entire menu. 26


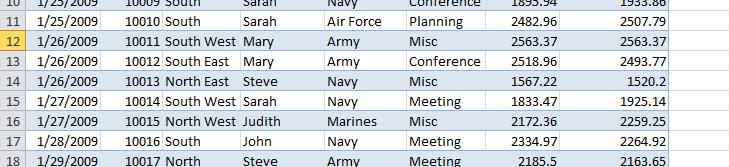
27 Drilldown Feature Curious what travel records comprise Sarah s North East total? Double click on the intersecting cell (C10) to receive more detail. 27


28 Drilldown Feature Excel will return a copy of all records that make up the selected cell on a brand new tab. You can manipulate or delete the data without affecting the PivotTable. Don t forget to name the new tab! 28


29 Report Filters Go back to the PivotTable Drag and drop Purpose field into Report Filters The Purpose field now displays just above the data 29
30 Report Filters Currently all categories in the Purpose field are included on the PivotTable as indicated by the (All) to the right of the field name. 1. Click on the triangle right of (All) 2. Click Conference 3. Select OK
31 Report Filters Instantly the report is filtered to only show conference related trips. Notice the filtering i category Conference is displayed. d The triangle is replaced by the filtering i icon. Also note there are blank cells representing no data that fits the criteria. 31
32 Report Filters To select multiple filtering criteria: 1. Click on the filter triangle 2. Check Select ect Multiple utpeitems 3. Check Conference, Meeting, and Planning 4. Select OK
33 Report Filters The report is now filtered to display Conference, Meeting, and Planning trips only. The report filter does not detail which items it has selected. This report, if printed, may lead to confusion by those who do not know the filters. 33


34 Slicers (Excel 2010 only) Excel 2010 allow users to insert slicers to better show selected filters. To insert a slicer, click a cell on the PivotTable. Select Options ribbon > Insert Slicer Check Purpose field in the slicers menu and click OK 34


35 Slicers (Excel 2010 only) A new slicer object will appear on your worksheet. This object is independent of the worksheet cells. You can drag and drop it anywhere on the worksheet. The highlighted blue categories are currently calculated on the worksheet. 35

 To")


36 Slicers (Excel 2010 only) To clear all filters click the filter Clear Filter icon. 36

")

37 Slicers (Excel 2010 only) Click on DV 37


38 Slicers (Excel 2010 only) To add multiple categories into the PivotTable, hold down the Ctrl key and click Misc Notice that the PivotTable and the report filters are updated instantly 38
 To remove e the")


39 Slicers (Excel 2010 only) To remove e the slicer, right click on the object and select Remove Purpose Your report filters are unchanged even though your slicer is gone. 39


40 Row and Column Filters and Sort You can also filter any field within the PivotTable. Each field has a triangle icon that allows you to filter as well as sort. 40
41 Show Report Filter Pages Say your boss wants to see a report by each purpose. Excel allows you to make a new PivotTable by each report filter category quickly. Be careful with this feature because a new PivotTable will be made for every filtered category (regardless if data exists for the category). Start by selecting all of the categories in the Purpose report filter. 41
42 Show Report Filter Pages Choose Options ribbon and select PivotTable Options, click Show Report Filter Pages. 42


43 Show Report Filter Pages Select OK Five new PivotTables are instantly created, named, and filtered by each category. 43
44 Adding Records and Refreshing PivotTable 1. Create a new PivotTable (Slide 6). Do not forget to name the tab! 2. Add Disbursement field to Values (Slide 9). 3. Format the Values to Currency (Slide 12). Your PivotTable should look like this: 44


45 Adding Records and Refreshing PivotTable Add a new record to your TDY Data on row Notice the record is automatically inserted into the table. 45

46 Adding Records and Refreshing PivotTable 2 1. Go back to your PivotTable 2. Select Options tab 3. Click Refresh


47 Adding Records and Refreshing PivotTable Your total Sum of Disbursement will update to include the new record. Before After 47
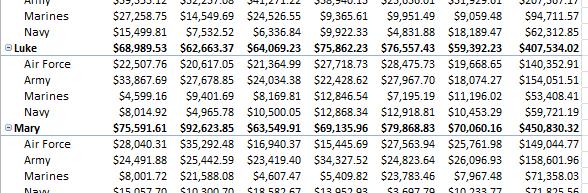
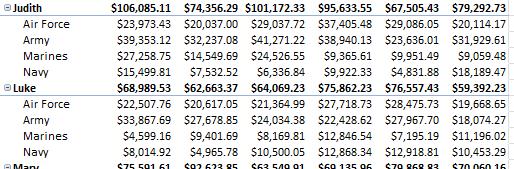
48 Calculations 1. Add Region and Purpose fields to Report Filter (Slide 9). 2. Add Customer to Column Labels. Your PivotTable should look like this: 48
49 Calculations Add Disbursement 4 more times to Values. Your PivotTable should look like this: 49

. 2.")

50 Calculations 1. Right Click cell C6 change the Value Field number format to Currency (slide 12). 2. Select Summarize Value field by Average 3. Change the Custom name to Avg Disb 4. Click OK
51 Calculations Column C currently shows the average disbursement of each trip 51
52 Calculations Repeat the steps on slide 50. Change Columns D and E Select Summarize Value field by Min for column D Select Summarize Value field by Max for column E Your PivotTable should look like this: 52
53 Calculations 1. Click on Cell F6 2. Select Options ribbon 3. Choose Summarize Values By 4. Click Count


54 Calculations You can change the name of the field by clicking on the cell and typing out your new name in the formula bar. 54


55 Show Values as Percentage Drag and drop Disbursement to Values box below Sum Disb and above Avg Disb Your PivotTable should look like this: 55
56 1. Click on Cell C8 2. Select Options ribbon 3. Choose Show Values As (Notice all the choices available!) 4. Select % of Column Total 5. Rename the field (C4) to % Sum of Disb Show Values as Percentage
57 Show Values as Percentage Your PivotTable should look like this: 57


58 PivotTable Power! Drag and drop Purpose From Report Filters to Row Labels below Customer Your PivotTable should look like this: 58
59 Grouping 1. Create a new PivotTable (Slide 6). Do not forget to name the tab! 2. Add Trip ID, Employee,andDate fields to Report Filter (Slide 9) 3. Add Region to Row Labels 4. Add Disbursement to Values 5. Format the Values to Currency (Slide 12). 59
60 Grouping Your PivotTable should ldlook klk like this: 60


61 Grouping 1. Click South East 2. Click and hold on the black line on the right side of the cell 3. Drag and drop South East between North East and North West 3 1. Click South West 2. Click and hold on the black line on the right side of the cell 3. Drag and drop South West between North West and South 61


62 1. Highlight North East and South East 2. Select Options tab from the ribbon 3. Click Group Selection Grouping


 and")
63 Grouping 1. A new field named Region2 is created 2. Click on Group1 (cell A7) and rename it East 3. Click Region2 (cell A5) and rename it Region Grp 63


64 1. Highlight North West and South West 2. Select Options tab from the ribbon 3. Click Group Selection Grouping

")


65 Grouping Click on Group2 (cell A9) and rename it West Remove Region From PivotTable 65


66 Grouping Success! Region Grp works just like any other field. Add employee to Row Labels 66


67 Date Grouping Move Region and Region Grp, fields From Row Labels to Report Filter Move Date from Report Filter to Row Labels 67


68 Date Grouping Right click Date and select Group Click Months and Years and select OK 68


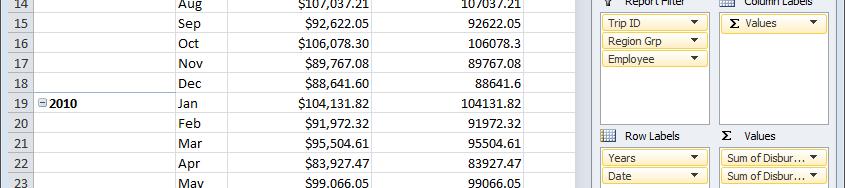
69 Date Grouping A new field called Years is made. The dates are now grouped. Move Years from Row Labels to Column Labels. 69
70 Grouping We now see how the travel expenses have changed over time. Note the blank spots from May to December 2012 because there is no data to report. 70


71 Empty Cells Right click on the PivotTable. Select PivotTable Options For empty cells show enter 0 (Zero). Click OK 71
72 Empty pycells The cells with ih no data now repot $


73 Running Totals Move Years from Column Labels to Row Labels above Date. The totals of each month are displayed. However, we also want to see running totals for each year. 73


74 Running Totals Add the field Disbursement to Values Right Click on the PivotTable under Sum of Disbursement2 Select Value Field Settings 74


75 Running Totals Click Show Value As tab Select Running Total In Choose Number Format 75


76 Running Totals Click Currency Select OK Click OK 76
77 Running Totals Click Design Ribbon Select Subtotals Choose Show All Subtotals at Bottom of Group 77
78 Running Totals Notice the end of year totals match 78

 3. Add Years, and Date to Row Labels 4.")
79 Charts 1. Create a new PivotTable (Slide 6). Do not forget to name the tab! 2. Add Trip ID, Region Grp,and Employee fields to Report Filter (Slide 9) 3. Add Years, and Date to Row Labels 4. Add Disbursement to Values 5. Format the Values to Currency (Slide 12). 79
80 Chose Your PivotTable should look like this: 80

81 Charts Click Options Ribbon Select PivotChart 81


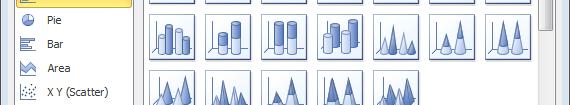
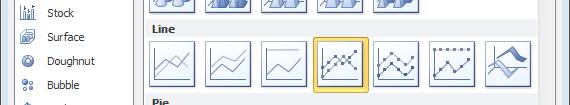
82 Charts Choose Line Click OK 82


83 Charts A Chart! Notice all of the chart context ribbon tabs. A PivotChart is formatted the same as other Excel charts. 83


84 Charts Drag and drop Date into Report Filter The PivotTable and PivotChart update together 84


85 Charts Filter 2010 out of the Row Labels. Notice the chart instantly updates. 85


86 Charts Drag and drop Employee to Column Labels The chart shows each traveler's cost throughout the years. 86
87 PivotTable Power For You! A Guide to Powerful Data Analysis in Microsoft Excel ASMC Professional Development Institute, Anaheim, CA May 27, 2012 Paul Friedman, CDFM Teksouth Corp. Paul.Friedman.ctr@hq.southcom.mil
Excel 2013 PivotTables and PivotCharts
 Excel 2013 PivotTables and PivotCharts PivotTables... 1 PivotTable Wizard... 1 Creating a PivotTable... 2 Groups... 2 Rows Group... 3 Values Group... 3 Columns Group... 4 Filters Group... 5 Field Settings...
Microsoft Excel Pivot Tables & Pivot Table Charts
 Microsoft Excel 2013 Pivot Tables & Pivot Table Charts A pivot table report allows you to analyze and summarize a million rows of data in Excel 2013 without entering a single formula. Pivot Tables let
Excel Tables & PivotTables
 Excel Tables & PivotTables A PivotTable is a tool that is used to summarize and reorganize data from an Excel spreadsheet. PivotTables are very useful where there is a lot of data that to analyze. PivotTables
New Perspectives on Microsoft Excel Module 5: Working with Excel Tables, PivotTables, and PivotCharts
 New Perspectives on Microsoft Excel 2016 Module 5: Working with Excel Tables, PivotTables, and PivotCharts Objectives, Part 1 Explore a structured range of data Freeze rows and columns Plan and create
Tutorial 5: Working with Excel Tables, PivotTables, and PivotCharts. Microsoft Excel 2013 Enhanced
 Tutorial 5: Working with Excel Tables, PivotTables, and PivotCharts Microsoft Excel 2013 Enhanced Objectives Explore a structured range of data Freeze rows and columns Plan and create an Excel table Rename
Microsoft Excel 2013/2016 Pivot Tables
 Microsoft Excel 2013/2016 Pivot Tables Creating PivotTables PivotTables are powerful data analysis tools. They let you summarize data in various ways and instantly change the view you use. A PivotTable
Excel Tables and Pivot Tables
 A) Why use a table in the first place a. Easy to filter and sort if you only sort or filter by one item b. Automatically fills formulas down c. Can easily add a totals row d. Easy formatting with preformatted
Microsoft Excel Pivot Tables & Pivot Table Charts
 Microsoft Excel 2007 Pivot Tables & Pivot Table Charts A pivot table report allows you to analyze and summarize a million rows of data in Excel 2007 without entering a single formula. Pivot Tables let
Creating a Pivot Table
 Contents Introduction... 1 Creating a Pivot Table... 1 A One-Dimensional Table... 2 A Two-Dimensional Table... 4 A Three-Dimensional Table... 5 Hiding and Showing Summary Values... 5 Adding New Data and
Pivot Tables in Excel Contents. Updated 5/19/2016
 Pivot Tables in Excel 2010 Updated 5/19/2016 Contents Setup a Pivot Table in Excel 2010... 2 General Field List Features... 4 Summing and Counting Together... 6 Grouping Date Data... 7 Grouping Non-Date
Creating Automated Dashboard Excel 2013 Contents
 Creating Automated Dashboard Excel 2013 Contents Summarize Data Using Pivot Table... 2 Constructing Report Summary... 2 Create a PivotTable from worksheet data... 2 Add fields to a PivotTable... 2 Grouping
Quick Guide for Excel 2015 Data Management November 2015 Training:
 http://pfw.edu Quick Guide for Excel 2015 Data Management November 2015 Training: http://pfw.edu/training Excel 2016 Data Management AutoFill and Custom Lists AutoFill 1. Select the range that contains
Patricia Andrada Quick Guide Excel 2010 Data Management-July 2011 Page 1
 Patricia Andrada Quick Guide Excel 2010 Data Management-July 2011 Page 1 Excel 2010 Data Management AutoFill and Custom Lists AutoFill 1. Select the range that contains the initial value(s) of the series
EXCEL ADVANCED Linda Muchow
 EXCEL ADVANCED 2016 Alexandria Technical and Community College Customized Training Technology Specialist 1601 Jefferson Street, Alexandria, MN 56308 320-762-4539 Linda Muchow lindac@alextech.edu 1 Table
Excel 2007/2010. Don t be afraid of PivotTables. Prepared by: Tina Purtee Information Technology (818)
") Information Technology MS Office 2007/10 Users Guide Excel 2007/2010 Don t be afraid of PivotTables Prepared by: Tina Purtee Information Technology (818) 677-2090 tpurtee@csun.edu [ DON T BE AFRAID OF
Information Technology MS Office 2007/10 Users Guide Excel 2007/2010 Don t be afraid of PivotTables Prepared by: Tina Purtee Information Technology (818) 677-2090 tpurtee@csun.edu [ DON T BE AFRAID OF
Chapter at a glance. Analyze. Filter. Format. Create. Analyze data dynamically by using PivotTables, page 288
 Chapter at a glance Analyze Analyze data dynamically by using PivotTables, page 288 Filter Filter, show, and hide PivotTable data, page 298 Format Format PivotTables, page 313 Create Create dynamic charts
How to insert table in Excel?
 What is Table in Excel? Tables allow you to analyze your data in Excel quickly and easily. How to insert table in Excel? To insert a table, execute the following steps. 1. Click any single cell inside
WAAT-PivotTables Accounting Seminar
 WAAT-PivotTables-08-26-2016-Accounting Seminar Table of Contents What does a PivotTable do?... 2 How to create PivotTable:... 2 Add conditions to the PivotTable:... 2 Grouping Daily Dates into Years, Quarters,
1. What is a PivotTable? What is a Cross Tab Report?
 Data Analysis & Business Intelligence Made Easy with Excel Power Tools Excel Data Analysis Basics = E-DAB Notes for Video: E-DAB-04: Summary Reports with Standard PivotTables & Slicers Objectives of Video:
Excel Advanced
 Excel 2016 - Advanced LINDA MUCHOW Alexandria Technical & Community College 320-762-4539 lindac@alextech.edu Table of Contents Macros... 2 Adding the Developer Tab in Excel 2016... 2 Excel Macro Recorder...
M i c r o s o f t E x c e l A d v a n c e d P a r t 3-4. Microsoft Excel Advanced 3-4
 Microsoft Excel 2010 Advanced 3-4 0 Absolute references There may be times when you do not want a cell reference to change when copying or filling cells. You can use an absolute reference to keep a row
Pivot Tables and Pivot Charts Activities
 PMI Online Education Pivot Tables and Pivot Charts Activities Microcomputer Applications Updated 12.16.2011 Table of Contents Objective 1: Create and Modify PivotTable Reports... 3 Organizing Data to Display
File Name: Data File Pivot Tables 3 Hrs.xlsx
 File Name: Data File Pivot Tables 3 Hrs.xlsx Lab 1: Create Simple Pivot Table to Explore the Basics 1. Select the tab labeled Raw Data Start and explore the data. 2. Position the cursor in Cell A2. 3.
2) Excel Basics 5: Power of PivotTables to Create Reports with Various Calculations & Layouts. Page 1 of 21
 Excel Basics 5: Power of PivotTables to Create Reports with Various Calculations & Layouts. Page 1 of 21") Office 2016 Excel Basics 20 Video/Class Project #32 Excel Basics 20: PivotTable Power: 14 Amazing PivotTable Reporting Tricks from Slicers to Show Values As! Goal in video # 20: Learn about how to create
Office 2016 Excel Basics 20 Video/Class Project #32 Excel Basics 20: PivotTable Power: 14 Amazing PivotTable Reporting Tricks from Slicers to Show Values As! Goal in video # 20: Learn about how to create
2. This is a cell; this cell is designated as A1.
 Queen s Learning Commons: Microsoft Excel Basics 1. These are the columns. 2. This is a cell; this cell is designated as A1. 3. Let s make a table. Click on the box you want to put text in and simply begin
Introduction to Excel 2013 Part 2
 Introduction to Excel 2013 Part 2 Open a file Select File from the Menu bar, select Open from the drop down menu, navigate to the place where the file was stored, double-left click on the file name. Modify
MS Office 2016 Excel Pivot Tables - notes
 Introduction Why You Should Use a Pivot Table: Organize your data by aggregating the rows into interesting and useful views. Calculate and sum data quickly. Great for finding typos. Create a Pivot Table
ABOUT PIVOTTABLES TABLE OF CONTENTS
 University of Southern California Academic Information Services Excel 2007 - PivotTables ABOUT PIVOTTABLES PivotTables provide an excellent means of analyzing data stored in database format by rearranging
INSERT SUBTOTALS Database Exercise Sort the Data Department Department Data Tab Sort and Filter Group
 INSERT SUBTOTALS Subtotals are used to summarize data in a range of data. This command offers many kinds of summary information, including counts, sums, averages, minimums, and maximums. When this feature
The subject of this chapter is the pivot table, the name given to a special
 Chapter 2: Generating Pivot Tables In This Chapter Understanding how to use pivot tables to summarize and analyze your data The many methods for creating pivot tables Pivoting the elements in the data
Rows area Values area
 Office 2016 Excel Basics 05 Video/Class Project #17 Excel Basics 5: Power of PivotTables to Create Reports with Various Calculations & Layouts Goal in video # 5: Learn more about how we can use PivotTables
Excel Level 1
 Excel 2016 - Level 1 Tell Me Assistant The Tell Me Assistant, which is new to all Office 2016 applications, allows users to search words, or phrases, about what they want to do in Excel. The Tell Me Assistant
Sample Chapters. To learn more about this book, visit the detail page at: go.microsoft.com/fwlink/?linkid= Copyright 2010 by Curtis Frye
 Sample Chapters Copyright 2010 by Curtis Frye All rights reserved. To learn more about this book, visit the detail page at: go.microsoft.com/fwlink/?linkid=191751 Chapter at a Glance Analyze data dynamically
Basic tasks in Excel 2013
 Basic tasks in Excel 2013 Excel is an incredibly powerful tool for getting meaning out of vast amounts of data. But it also works really well for simple calculations and tracking almost any kind of information.
course notes quick reference guide
 course notes quick reference guide Microsoft Excel 2010 Welcome to Excel 2010 Excel 2010 is the premier spreadsheet application from Microsoft. Excel 2010 makes it easier to analyze data quickly with new
1. Two types of sheets used in a workbook- chart sheets and worksheets
 Quick Check Answers Session 1.1 1. Two types of sheets used in a workbook- chart sheets and worksheets 2. Identify the active cell- The active cell is surrounded by a thick border and its cell reference
Instructions for the Monthly Trial and Final Payroll Verification
 1. You will create a pivot table from the Monthly Payroll Master worksheet. In the Monthly Payroll Master worksheet select the cell A1 and then do CTRL + A to highlight all the data in the worksheet. Then
Contents. Group 2 Excel Handouts 2010
 Contents Styles... 2 Conditional Formatting... 2 Create a New Rule... 4 Format as Table... 5 Create your own New Table Style... 8 Cell Styles... 9 New Cell Style... 10 Merge Styles... 10 Sparklines...
Microsoft Excel 2010 Training. Excel 2010 Basics
 Microsoft Excel 2010 Training Excel 2010 Basics Overview Excel is a spreadsheet, a grid made from columns and rows. It is a software program that can make number manipulation easy and somewhat painless.
Streamlined Reporting with
 Streamlined Reporting with Presentation by: Ryan Black, M.B.A. Business and Fiscal Officer Office of the Provost Wright State University, Dayton, Ohio Microsoft Excel offers one of the most powerful software
Looking good! Slicing and dicing to visualize data in Excel Dashboards Michael Winecoff UNC Charlotte J. Murrey Atkins Library
 Looking good! Slicing and dicing to visualize data in Excel Dashboards Michael Winecoff UNC Charlotte J. Murrey Atkins Library http://goo.gl/asn5xt Objective To take spreadsheet data and present it visually
EXCEL 2010 TIPS & TRICKS
 EXCEL 2010 TIPS & TRICKS Training and Reference Guide Starlight Education Table of Contents Move to the End of a Row or Column of Data... 1 Select Cells Without Scrolling... 1 Select Non-Adjacent Ranges...
MICROSOFT Excel 2010 Advanced Self-Study
 MICROSOFT Excel 2010 Advanced Self-Study COPYRIGHT This manual is copyrighted: S&G Training Limited. This manual may not be copied, photocopied or reproduced in whole or in part without the written permission
PivotTables & Charts for Health
 PivotTables & Charts for Health Data Inputs PivotTables Pivot Charts Global Strategic Information UCSF Global Health Sciences Version Malaria 1.0 1 Table of Contents 1.1. Introduction... 3 1.1.1. Software
PivotTables. Mastering Microsoft Excel
 Mastering Microsoft Excel PivotTables SkillPath a division of the Graceland College Center for Professional Development and Lifelong Learning, Inc. All rights reserved, including the right to reproduce
NUMERICAL COMPUTING For Finance Using Excel. Sorting and Displaying Data
 NUMERICAL COMPUTING For Finance Using Excel Sorting and Displaying Data Outline 1 Sorting data Excel Sort tool (sort data in ascending or descending order) Simple filter (by ROW, COLUMN, apply a custom
Data Should Not be a Four Letter Word Microsoft Excel QUICK TOUR
 Toolbar Tour AutoSum + more functions Chart Wizard Currency, Percent, Comma Style Increase-Decrease Decimal Name Box Chart Wizard QUICK TOUR Name Box AutoSum Numeric Style Chart Wizard Formula Bar Active
Pivot Tables, Lookup Tables and Scenarios
 Introduction Format and manipulate data using pivot tables. Using a grading sheet as and example you will be shown how to set up and use lookup tables and scenarios. Contents Introduction Contents Pivot
USING MICROSOFT EXCEL 2016 Guided Project 4-3
 Guided Project 4-3 Clemenson Imaging analyzes expense reports from field representatives as well as patient and image data. To complete the worksheets, you format data as a table and build an advanced
Microsoft Excel 2010 Step-by-Step Exercises PivotTables and PivotCharts: Exercise 1
 Microsoft Excel 2010 Step-by-Step Exercises PivotTables and PivotCharts: Exercise 1 In this exercise you will learn how to: Create a new PivotTable Add fields to a PivotTable Format and rename PivotTable
THE POWER OF PIVOT TABLES
 THE POWER OF PIVOT TABLES To fully understand the power of a PivotTable, one must first consider what is a PivotTable and what makes them powerful? Following are the main properties that define a Pivot
Gloucester County Library System. Excel 2010
 Gloucester County Library System Excel 2010 Introduction What is Excel? Microsoft Excel is an electronic spreadsheet program. It is capable of performing many different types of calculations and can organize
Candy is Dandy Project (Project #12)
") Candy is Dandy Project (Project #12) You have been hired to conduct some market research about M&M's. First, you had your team purchase 4 large bags and the results are given for the contents of those
Candy is Dandy Project (Project #12) You have been hired to conduct some market research about M&M's. First, you had your team purchase 4 large bags and the results are given for the contents of those
Excel Tutorial 5: Working with Excel Tables, PivotTables, and PivotCharts. 6. You can use a table s sizing handle to add columns or rows to a table.
 Excel Tutorial 5: Working with Excel Tables, PivotTables, and PivotCharts TRUE/FALSE 1. The header row must be row 1. ANS: F PTS: 1 REF: EX 234 2. If you freeze the top row in a worksheet and press Ctrl+Home,
Microsoft Excel: More Tips, Tricks & Techniques. Excel 2010 & Excel Cutting Edge Chapter of IAAP
 Microsoft Excel: More Tips, Tricks & Techniques Excel 2010 & Excel 2007 Cutting Edge Chapter of IAAP Dawn Bjork Buzbee, MCT The Software Pro Microsoft Certified Trainer Bonus Resources Follow-up Q&A, additional
Pivot Table Project. Objectives. By the end of this lesson, you will be able to:
 Pivot Table Project Objectives By the end of this lesson, you will be able to: Set up a Worksheet Enter Labels and Values Use Sum and IF functions Format and align cells Change column width Use AutoFill
Using Tables, Sparklines and Conditional Formatting. Module 5. Adobe Captivate Wednesday, May 11, 2016
 Slide 1 - Using Tables, Sparklines and Conditional Formatting Using Tables, Sparklines and Conditional Formatting Module 5 Page 1 of 27 Slide 2 - Lesson Objectives Lesson Objectives Explore the find and
European Computer Driving Licence. Advanced Spreadsheet Software BCS ITQ Level 3. Syllabus Version 2.0
 ECDL Advanced European Computer Driving Licence Advanced Spreadsheet Software BCS ITQ Level 3 Using Microsoft Excel 2010 Syllabus Version 2.0 This training, which has been approved by BCS, The Chartered
How to Excel - Part 2
 Table of Contents Exercise 1: Protecting cells and sheets... 3 Task 1 Protecting sheet... 3 Task 2 Protecting workbook... 3 Task 3 Unprotect workbook and sheet... 3 Task 4 Protecting cells... 4 Protecting
Advanced Excel Charts : Tables : Pivots
 Advanced Excel Charts : Tables : Pivots Protecting Your Tables/Cells Protecting your cells/tables is a good idea if multiple people have access to your computer or if you want others to be able to look
Mathematical Operators for Excel
 EXCEL ADVANCED 1 Mathematical Operators for Excel < > = >=
ADVANCED INQUIRIES IN ALBEDO: PART 2 EXCEL DATA PROCESSING INSTRUCTIONS
 ADVANCED INQUIRIES IN ALBEDO: PART 2 EXCEL DATA PROCESSING INSTRUCTIONS Once you have downloaded a MODIS subset, there are a few steps you must take before you begin analyzing the data. Directions for
Microsoft Office Excel 2010: Intermediate (R2) Course Overview. Course Outline
 Course Overview. Course Outline") Microsoft Office Excel 2010: Intermediate (R2) Course Overview This course builds on the skills and concepts taught in Excel 2010: Basic, First Look Edition. Students will learn how to use multiple worksheets
Microsoft Office Excel 2010: Intermediate (R2) Course Overview This course builds on the skills and concepts taught in Excel 2010: Basic, First Look Edition. Students will learn how to use multiple worksheets
How to Create Excel Dashboard used in Solutions Conference By Matt Mason
 How to Create Excel Dashboard used in Solutions Conference 2017 By Matt Mason The following is a step by step procedure to create the Dashboard presented by Matt Mason in the Excel Tips and Tricks session
Excel 2016: Part 2 Functions/Formulas/Charts
 Excel 2016: Part 2 Functions/Formulas/Charts Updated: March 2018 Copy cost: $1.30 Getting Started This class requires a basic understanding of Microsoft Excel skills. Please take our introductory class,
Office 2016 Excel Basics 25 Video/Class Project #37 Excel Basics 25: Power Query (Get & Transform Data) to Convert Bad Data into Proper Data Set
 to Convert Bad Data into Proper Data Set") Office 2016 Excel Basics 25 Video/Class Project #37 Excel Basics 25: Power Query (Get & Transform Data) to Convert Bad Data into Proper Data Set Goal in video # 25: Learn about how to use the Get & Transform
Office 2016 Excel Basics 25 Video/Class Project #37 Excel Basics 25: Power Query (Get & Transform Data) to Convert Bad Data into Proper Data Set Goal in video # 25: Learn about how to use the Get & Transform
GO! with Microsoft Excel 2016 Comprehensive
 GO! with Microsoft Excel 2016 Comprehensive First Edition Chapter 7 Creating PivotTables and PivotCharts Learning Objectives Create a PivotTable Report Use Slicers and Search Filters Modify a PivotTable
Excel 2007 New Features Table of Contents
 Table of Contents Excel 2007 New Interface... 1 Quick Access Toolbar... 1 Minimizing the Ribbon... 1 The Office Button... 2 Format as Table Filters and Sorting... 2 Table Tools... 4 Filtering Data... 4
Module 4 : Spreadsheets
 Module 4 : Spreadsheets What is a spreadsheet program? A spreadsheet program allows you to store, organise and analyse information. Applications of spreadsheets focus on generating numeric information
Market Insight Excelsior 2 Module Training Manual v2.0
 Market Insight Excelsior 2 Module Training Manual v2.0 Excelsior 2 Module Manual Version: 2.0 Software Release: Data Set: 2016 Q4 Training (US) Excel Version: Office 365 D&B Market Insight is powered by
2013 ADVANCED MANUAL
 2013 ADVANCED MANUAL C B C H O U S E 2 4 C A N N I N G S T R E E T E D I N B U R G H E H 3 8 E G 0 1 3 1 2 7 2 2 7 9 0 W W W. I T R A I N S C O T L A N D. C O. U K I N F O @ I T R A I N S C O T L A N D.
Excel Foundation Quick Reference (Windows PC)
") Excel Foundation Quick Reference (Windows PC) See https://staff.brighton.ac.uk/is/training/pages/excel/foundation.aspx for videos and exercises to accompany this quick reference card. Structure of a spreadsheet
Excel Foundation Quick Reference (Windows PC) See https://staff.brighton.ac.uk/is/training/pages/excel/foundation.aspx for videos and exercises to accompany this quick reference card. Structure of a spreadsheet
4Functions & Formulas
 The Original Quick Reference Guides Microsoft Excel 2010 Excel is a spreadsheet program that enables you to perform simple or complex calculations using a broad range of statistical and mathematical tools,
Formulas, LookUp Tables and PivotTables Prepared for Aero Controlex
 Basic Topics: Formulas, LookUp Tables and PivotTables Prepared for Aero Controlex Review ribbon terminology such as tabs, groups and commands Navigate a worksheet, workbook, and multiple workbooks Prepare
COMP1000 / Spreadsheets Week 2 Review
 / Spreadsheets Week 2 Review Plot chart Column chart/bar chart/pie chart Customize chart Chart style/labels/titles Add trendline Create table Create table/apply different style/print table Sort/filter
3/31/2016. Spreadsheets. Spreadsheets. Spreadsheets and Data Management. Unit 3. Can be used to automatically
 MICROSOFT EXCEL and Data Management Unit 3 Thursday March 31, 2016 Allow users to perform simple and complex sorting Allow users to perform calculations quickly Organizes and presents figures that can
Copyright & License Notes 3 Introduction 13 Chapter 1 - Excel Basics 14. Chapter 2 - Working with Data 32
 TABLE OF CONTENTS Copyright & License Notes 3 Introduction 13 Chapter 1 - Excel Basics 14 Creating an Excel Workbook 14 Examining the Excel Environment 15 Opening an Existing Workbook 19 Navigating a Worksheet
Table of Contents. Tip 1: Page setup 3. Tip 2: Printing different ranges in a spreadsheet 5. Tip 3: Ensuring that a long formula is displayed 6
 Table of Contents Tip 1: Page setup 3 Tip 2: Printing different ranges in a spreadsheet 5 Tip 3: Ensuring that a long formula is displayed 6 Tip 4: Displaying two worksheets at the same time 7 Tip 5: How
Rockefeller College MPA Excel Workshop: Clinton Impeachment Data Example
 Rockefeller College MPA Excel Workshop: Clinton Impeachment Data Example This exercise is a follow-up to the MPA admissions example used in the Excel Workshop. This document contains detailed solutions
Les s on Objectives. Student Files Us ed. Student Files Crea ted
 Lesson 10 - Pivot Tables 103 Lesson 10 P ivot T ables Les s on Topics Creating a Pivot Table Exercise: Creating a Balance Summary Formatting a Pivot Table Creating a Calculated Field Les s on Objectives
LEIAG-Excel Workshop
 Random Sample Excel has a simple formula we can utilize to obtain a random sample (cases, citations, city, etc.) At the Sheriff s Department, we are able to run a case management report that generates
Making Excel Work for Your Tribal Community
 Making Excel Work for Your Tribal Community Excel Basics: Intermediate Skills PHONE: 1-800-871-8702 EMAIL: INFO@CBC4TRIBES.ORG WEB: TRIBALINFORMATIONEXCHANGE.ORG MAKING EXCEL WORK FOR YOUR TRIBAL COMMUNITY
Excel 2010 Charts and Graphs
 Excel 2010 Charts and Graphs In older versions of Excel the chart engine looked tired and old. Little had changed in 15 years in charting. The popular chart wizard has been replaced in Excel 2010 by a
DESCRIPTION 1 TO DEFINE A NAME 2. USING RANGE NAMES 2 Functions 4 THE IF FUNCTION 4 THE VLOOKUP FUNCTION 5 THE HLOOKUP FUNCTION 6
 Table of contents The use of range names 1 DESCRIPTION 1 TO DEFINE A NAME 2 USING RANGE NAMES 2 Functions 4 THE IF FUNCTION 4 THE VLOOKUP FUNCTION 5 THE HLOOKUP FUNCTION 6 THE ROUND FUNCTION 7 THE SUMIF
Tips & Tricks: MS Excel
 Tips & Tricks: MS Excel 080501.2319 Table of Contents Navigation and References... 3 Layout... 3 Working with Numbers... 5 Power Features... 7 From ACS to Excel and Back... 8 Teacher Notes: Test examples
Microsoft Excel Basics Ben Johnson
 Microsoft Excel Basics Ben Johnson Topic...page # Basics...1 Workbook and worksheets...1 Sizing columns and rows...2 Auto Fill...2 Sort...2 Formatting Cells...3 Formulas...3 Percentage Button...4 Sum function...4
Teach yourself... PivotTables and PivotCharts. with. Microsoft Excel Easy to follow Step-by-step instructions Written in plain English
 Easy Way Teach yourself... PivotTables and PivotCharts with Microsoft Excel 2013 Easy to follow Step-by-step instructions Written in plain English A Cheryl Price Publication Easy Way PivotTables and PivotCharts
MS Excel Advanced Level
 MS Excel Advanced Level Trainer : Etech Global Solution Contents Conditional Formatting... 1 Remove Duplicates... 4 Sorting... 5 Filtering... 6 Charts Column... 7 Charts Line... 10 Charts Bar... 10 Charts
Excel 2007 Pivot Table Sort Column Headings
 Excel 2007 Pivot Table Sort Column Headings Pivot table is not used for sorting and filtering, it is used for summarizing and reporting. labels and col5 to values, as shown in the figure above (col1, col2
GCSE CCEA GCSE EXCEL 2010 USER GUIDE. Business and Communication Systems
 GCSE CCEA GCSE EXCEL 2010 USER GUIDE Business and Communication Systems For first teaching from September 2017 Contents Page Define the purpose and uses of a spreadsheet... 3 Define a column, row, and
Index. C calculated fields, vs. calculated items, 56 correcting results in, 67 creating, 61 count of unique items, 66
 Index symbols % Difference From custom calculation, 49, 65 % of Column custom calculation, 53 % Of custom calculation, 48 % of Row custom calculation, 52 % of Total custom calculation, 54 < less than symbol,
How Commercial Off-the-Shelf (COTS) Business Intelligence (BI) Tools Can Improve Financial Management Analysis
 Business Intelligence (BI) Tools Can Improve Financial Management Analysis") How Commercial Off-the-Shelf (COTS) Business Intelligence (BI) Tools Can Improve Financial Management Analysis Carolyn L. North, CPA, CGFM, CDFM/A, PMP R. Ross Hosse, CDFM Purpose of Business Intelligence
How Commercial Off-the-Shelf (COTS) Business Intelligence (BI) Tools Can Improve Financial Management Analysis Carolyn L. North, CPA, CGFM, CDFM/A, PMP R. Ross Hosse, CDFM Purpose of Business Intelligence
Excel Intermediate. Click in the name column of our Range of Data. (Do not highlight the column) Click on the Data Tab in the Ribbon
 Click on the Data Tab in the Ribbon") Custom Sorting and Subtotaling Excel Intermediate Excel allows us to sort data whether it is alphabetic or numeric. Simply clicking within a column or row of data will begin the process. Click in the name
Custom Sorting and Subtotaling Excel Intermediate Excel allows us to sort data whether it is alphabetic or numeric. Simply clicking within a column or row of data will begin the process. Click in the name
DOING MORE WITH EXCEL: MICROSOFT OFFICE 2013
 DOING MORE WITH EXCEL: MICROSOFT OFFICE 2013 GETTING STARTED PAGE 02 Prerequisites What You Will Learn MORE TASKS IN MICROSOFT EXCEL PAGE 03 Cutting, Copying, and Pasting Data Basic Formulas Filling Data
COURSE CONTENT EXCEL BASIC ONE DAY
 COURSE CONTENT EXCEL BASIC ONE DAY SOME OF THE BENEFITS OF USING A SPREADSHEET STARTING EXCEL GETTING YOURSELF ORIENTATED WITH THE EXCEL SCREEN THE OFFICE BUTTON/FILE TAB THE TITLE BAR THE RIBBONS GROUPS
PHLI Instruction (734) Introduction. Lists.
 Introduction. Lists.") INTERMEDIATE EXCEL Introduction Microsoft Excel has many purposes. In addition to being an excellent data manger, Excel provides the means to perform complex analysis and evaluation of data. This brief
INTERMEDIATE EXCEL Introduction Microsoft Excel has many purposes. In addition to being an excellent data manger, Excel provides the means to perform complex analysis and evaluation of data. This brief
Microsoft Office Excel 2013
 Microsoft Office Excel 2013 PivotTables and PivotCharts University Information Technology Services Training, Outreach, Learning Technologies and Video Production Copyright 2014 KSU Department of University
KNACK TRAINING. MICROSOFT OFFICE: TIPS & TRICKS FOR EFFICIENCY
 KNACK TRAINING http://knacktraining.com http://youtube.com/neilmalek MICROSOFT OFFICE: TIPS & TRICKS FOR EFFICIENCY 2 TABLE OF CONTENTS MICROSOFT WORD MOUSE & KEYBOARD TRICKS NAVIGATION 4 SELECTION 7 FORMATTING
Microsoft Excel 2010 Part 2: Intermediate Excel
 CALIFORNIA STATE UNIVERSITY, LOS ANGELES INFORMATION TECHNOLOGY SERVICES Microsoft Excel 2010 Part 2: Intermediate Excel Spring 2014, Version 1.0 Table of Contents Introduction...3 Working with Rows and
Objective: Class Activities
 Objective: A Pivot Table is way to present information in a report format. The idea is that you can click drop down lists and change the data that is being displayed. Students will learn how to group data