INFocus Basic Table Reporting
|
|
|
- Arnold Manning
- 5 years ago
- Views:
Transcription

1 INFocus Basic Table Reporting About This Document This document provides basic information about the INFocus tool, with specific examples of steps required to create reports. The user should log in to InformationNOW and then select Reports INFocus prior to beginning the steps on the sample reports discussed in this document. Reports may be very specific and the samples below showcase different functions within INFocus to aid the user in defining reports. Sample 1: Tabular Student Listing Report Objective To create a table report, listing students by school, grade level and name. Steps On the main INFocus screen, select Add Report. Select Tabular Report with Header and click OK. Quick Reference Guide Chalkable_ INFocus Basic Table Reporting 1
2 The Select or Modify Data Source screen will display. On the Add/Remove tab, select the Student data object. While selecting and modifying the data source, the report builder may preview the selected data by clicking on the Preview Select Data button. When finished previewing the data, it is best to choose the Close button. If Select and Continue is selected, look for the Modify Data Source button on the bottom left of screen to return to selecting or modifying the data source. Click OK to save the Data Source. On the Table Columns tab, select the fields (Columns) that will be displayed on the report. For this example, select the following Student.School Student.Grade Level Student.Name Student.Birth Date Student.Ethnicity Student.Gender NOTE: when only one view is selected, the view name does not appear in the window (for example, Student.School will be displayed as School. When multiple views are selected, the view name is always prepended to the field name. Quick Reference Guide Chalkable_ INFocus Basic Table Reporting 2


3 The columns may be added one at a time by double-clicking on the column name in the Available Columns area. Columns may also be added by highlighting one or more columns in the Available Columns and then clicking on the right arrow. This moves the field/column(s) into the Assigned Columns area. The order in which the columns appear on the table may be set by clicking one or more columns and then clicking the up and down arrows. Users are advised to save the report often while in the process of defining it. To do this, click the Save icon or select the File Save menu option. Quick Reference Guide Chalkable_ INFocus Basic Table Reporting 3
4 The first time Save is selected, the following dialog is shown. The user may enter a report name, optional report description, optional report expiration date and folder in which to save the report. The Report Expiration option allows the report builder to enter a date where the report is no longer valid. The report will not be deleted; the end users will simply be unable to view the report. The Destination Folder Type allows the members of groups with Maintain INFOCUS rights to store reports either in the personal folder for their use only or in the Shared folder for all users. On the Column Configuration tab, the user may change header descriptions, set columns as sortable and choose other options. Change the Header descriptions (as desired) o o Grade Level to GL Birth Date to DOB Check the all Sortable option and then remove from Birth Date. At this time, save the report. Quick Reference Guide Chalkable_ INFocus Basic Table Reporting 4


5 The column order may be changed on this tab as well. Select a field by clicking the box to the left of the field name, then use the up and down arrow controls on the right of the screen to move the field either up or down in sequence order. The Sortable option on this screen allows the user to change the order of the data after the report has been generated. The user will click on the column header to change the sorting. To preview the report, click on the magnifying glass icon at the top of screen or under the File tab at the top of the report builder screen. It is recommended that users preview the report as often as possible to see how the changed options affect the report. Quick Reference Guide Chalkable_ INFocus Basic Table Reporting 5


6 Notice that some students appear to have duplicate records (records for the same school and grade level). This anomaly may be caused by several data elements, such as a student having multiple enrollment records within the same academic session or dual enrollments. Currently this report is not restricted by filters such as Only enrolled students or Only the current academic session. The user may eliminate these extra records by adding filter controls to the report. To add filters to the report, from the report definition screen, select Modify Data Source (this step may also be done initially when selecting the data source). Select the Filter tab. Quick Reference Guide Chalkable_ INFocus Basic Table Reporting 6
7 Click Add a Parameter and choose Academic Session as a column. Select Equal to as the operator and enter a Specific Value of Click OK to save. This will automatically filter the report for only those students who are in the school year. Quick Reference Guide Chalkable_ INFocus Basic Table Reporting 7
8 Click Add a Parameter again. Select the column Enrollment Status with the operator of Equal to. Click the magnifying glass next to the blank field to view available statuses. Select Enrolled and click OK to the right of the values box. Click OK to save the second filter parameter. Note: The filter for Enrolled status is not necessary if the Enrolled Student view is selected instead of the Student view in the initial steps of this report. Quick Reference Guide Chalkable_ INFocus Basic Table Reporting 8

9 The filter screen should appear again, with the defined parameters showing. Click OK to save. Save the report definition. Preview the report. Notice the 'duplicates are no longer in the report. This completes the basic Student Listing report instructions. Quick Reference Guide Chalkable_ INFocus Basic Table Reporting 9
10 Optional Settings Many optional settings are available for repots, such as report titles, record counts, sorting capabilities, etc. Table Settings tab The Table Settings tab allows the user to define a report title, add record counts, and control the number of items on each screen. For this report, add the following table settings: Title: Student Table Listing Show Record Count: Check this option. Include Row Number: Check this option. Rows Per Page: 25 Quick Reference Guide Chalkable_ INFocus Basic Table Reporting 10


11 Preview the report. Notice the changes (if desired, save the report again to store the changes (title, row number, record count, and 25 rows per page). Header Information tab The Header Information tab allows the user to define whether or not a date and time appear on the report. they are selected by default to show. If desired, they can be de-selected. Quick Reference Guide Chalkable_ INFocus Basic Table Reporting 11
. Set each item to Ascending order. o Student.School o Student.Grade Level o Student.")
12 Default Sort Order To define a default sort order, select Modify Data Source (this step may be done as the user initially selects the data source in the initial steps. Select the Sort tab and click Add A Column. Add the following columns (selecting Add A Column for each). Set each item to Ascending order. o Student.School o Student.Grade Level o Student.Name Quick Reference Guide Chalkable_ INFocus Basic Table Reporting 12
.")
13 This will sort the data by school first, then by grade level and finally by student name. The Sort tab controls the default date which will initially appear on the report. When the report is generated, the end user has no control of this unless the definition allows for columns to be Sortable (as defined on the Column Configuration tab). Click OK to save the sort definition. Preview the report. If the defined sort is desired, save the report. Quick Reference Guide Chalkable_ INFocus Basic Table Reporting 13


 Click OK then preview the change.")
14 Settings Menu The Settings menu allows for paging controls and a style to be associated with the report definition. Click the Style icon. o Choose any style desired (the one in the sample below is Professional.) Click OK then preview the change. Quick Reference Guide Chalkable_ INFocus Basic Table Reporting 14
 and")
15 The Settings Paging icon will allow the report builder to change the size and orientation of the printed paper. For this particular report, the current settings are adequate. Sample 2: Tabular Student Listing Report - Advanced Objective To create a simple Student Listing report (as demonstrated in "Sample 1: Tabular Student Listing Report" in the preceding section) and update the report with some advanced settings. This includes the ability to copy reports, add calculated columns and update filter parameters with ask parameters. Steps to Copy an Existing Report On the main INFocus screen, scroll through reports (if necessary) so that the one that was created in Sample 1 shows in the list. Hover the mouse over the Action control arrow to the right of the last modified date and time. Select Copy. Quick Reference Guide Chalkable_ INFocus Basic Table Reporting 15
 and change the description, expiration date and destination folder as needed. Select Save.")
16 The Copy Report dialog is shown. Set a new report name (default is Copy of XXX where XXX is the original name of the report being copied) and change the description, expiration date and destination folder as needed. Select Save. Both the original and the copy should appear in the reports list (if the copy was stored in a different destination folder it will not appear on the same list). Quick Reference Guide Chalkable_ INFocus Basic Table Reporting 16
17 Steps to Edit an Existing Report Adding Ask Parameters on Filter Controls On the INFocus reports list screen, scroll through the reports if necessary to locate the one that was created in Sample 1 that was just copied (in this example, Student Listing Advanced ). Hover over the Action control and click Modify. The Report Definition screen is displayed. To edit or add a filter parameter, select Modify Data Source and then click the Filter tab. Quick Reference Guide Chalkable_ INFocus Basic Table Reporting 17

18 To edit the existing filter for Enrollment status, click the Edit action icon. Select Ask in Report and enter a Caption. The caption shown below will prompt the user running the report to choose the status of student to view. Select OK to save the filter details, and then select OK to save the modify data source parameters. Preview the report and the Ask Parameter will display prior to the report generating. Since the Control Type was left at Text, the user will type the status in the box. To allow users to select multiple statuses (or to simply select a single status off a displayed list without being required to type it in), the control will need to be changed to another type. Go to Modify Data Source and select the Filter tab. Select the Edit icon on the enrollment status filter. Quick Reference Guide Chalkable_ INFocus Basic Table Reporting 18
19 Note: The steps to take below depends upon whether users should be allowed to select one item only or whether multiple items from the list may be selected. To select a single item, set the Control Type to List (single select). An All option is also available, which will allow users to select all items in the list. Quick Reference Guide Chalkable_ INFocus Basic Table Reporting 19

20 To select multiple items, set the operator to In list. If editing an existing parameter, it will be necessary to set the default value again, since these values are automatically cleared. Click OK to save the filter parameter. If you are editing an existing parameter, a warning message is shown. If your edit is correct, select OK. If not, select Cancel and your changes will not be saved. Select OK to save the Select or Modify Data Source parameters. Select to Preview the report. The screen shot below is for the in list option and allows the user to multi-select (using the CTRL key and the mouse) enrollment status if desired. If the user selects RUN, the report will generate and the parameters will remain on the screen. Quick Reference Guide Chalkable_ INFocus Basic Table Reporting 20

21 If the user selects RUN and Hide Parameters, the report will generate and the parameters will not remain on the screen. Save the changes to the report, if desired. Steps to Edit an Existing Report and Add a Calculated Field Calculated fields can aid in a variety of situations and have many uses. This example will allow the user to change how the name is displayed on the Student Listing Advanced report. Currently, the student field Name is being used in our report. This field is in Last Name, First Name Middle Name format. In this example, we will change the name to Last Name, First Name (with no middle names). Currently on our report, we see two students near the beginning of the report with middle names showing. On the INFocus reports list screen, scroll through the reports (if necessary) to locate the one that was created in Sample 1 and which was recently copied (in this example, Student Listing Advanced) and hover over the Action control. Select Modify. The Report Definition screen will be displayed. Quick Reference Guide Chalkable_ INFocus Basic Table Reporting 21
22 Select Modify Data Source and then click the Calculated Columns tab. Click New. Enter a name for the new field : LastFirst Select Concatenate from the Text drop-list. The following screen will appear: o o Select within the field String1, then select the field LastName from the list of available fields. Select within the field String1, then select the field FirstName from the list of available fields. Quick Reference Guide Chalkable_ INFocus Basic Table Reporting 22

23 Click OK. The screen should appear as shown below. Select Test to view the data. Notice the Last Name and First Name are together Close the preview window. Quick Reference Guide Chalkable_ INFocus Basic Table Reporting 23
Comma(,)Space( ) Single Quote( )Plus Sign(+)) ( «Student».«Last Name» +', ' +«Student».")
24 The concatenate function is very literal. So, to add a comma and space between the Last Name and First Name in the definition: o Place cursor after the +. o Type the following:, + (Single Quote( )Comma(,)Space( ) Single Quote( )Plus Sign(+)) ( «Student».«Last Name» +', ' +«Student».«First Name» ) Click Test to verify that the edits provide the desired results. Click Save. Quick Reference Guide Chalkable_ INFocus Basic Table Reporting 24
25 After the save, the field should show in the list of available fields. Select OK to save the select of modify data source screen. NOTE: Calculated columns added in this location are limited to this report only and are not available for use by other reports. To add the new calculated field to the report, select the Table Columns tab. Calculated fields will show in the list at the end of the list. Quick Reference Guide Chalkable_ INFocus Basic Table Reporting 25
.")
26 Select the calculated field and move to the Assigned Column area. Adjust the location of the field (using the UP/Down arrows as needed). Remove the Student.Name field if it is no longer needed. Save the report and preview the report. The new calculated field is used instead of the name field (no middle names are showing). Quick Reference Guide Chalkable_ INFocus Basic Table Reporting 26

27 NOTE: if a calculated field is defined, but not added as a column on the report layout or used somehow in the report definition, the field definition will not be saved. Quick Reference Guide Chalkable_ INFocus Basic Table Reporting 27
28 Sample 3: Add Grouping and Exports to the Report Objectives This example will add group breaks, export capabilities, and column configuration to the report. Steps to add grouping: On the INFocus reports list screen, scroll through (if necessary) your reports so that the one that was created in sample 1 that was just copied (in this example, Student Listing Advanced and hover over the ACTION control. Select Modify. The Report Definition screen is displayed. Quick Reference Guide Chalkable_ INFocus Basic Table Reporting 28
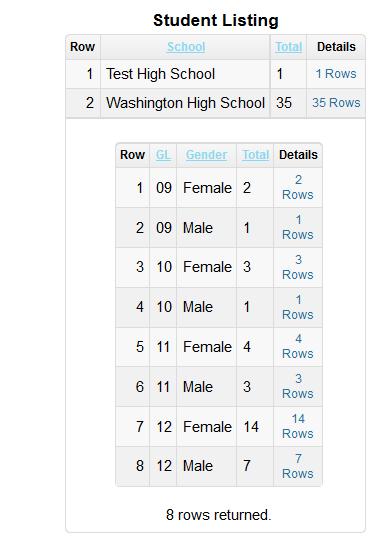
29 Select the Grouping tab. Two options are available: Grouped Flat Table and Grouped Drill Down. The definitions are the same for both and once defined can easily be changed from one type to another. For the initial example, Select Group Flat Table, then Add Grouping Layer. To add the first layer based on the Students school, select Student.School from the list of available columns and move to the grouped columns area. Quick Reference Guide Chalkable_ INFocus Basic Table Reporting 29

30 Select OK to save the grouping, then select Preview to see the results. It adds a break row on the school. Break row on School Quick Reference Guide Chalkable_ INFocus Basic Table Reporting 30

31 To add a 2 nd grouping layer on Student grade level and gender (multiple items on same break line), select to add another grouping layer. Select the Student.gradelevel and Student.gender and move to the grouped columns area. Select OK to save. Preview the report to see the results. A secondary group break on grade level and gender is added to the output. Quick Reference Guide Chalkable_ INFocus Basic Table Reporting 31
, select to EDIT the group parameter to add the")

32 To add an aggregate for a grouping (such as a count of records), select to EDIT the group parameter to add the aggregate. Select to add an Aggregate column. Quick Reference Guide Chalkable_ INFocus Basic Table Reporting 32
33 The following screen is displayed. Set the aggregate function and Label as desired. Select OK to save. Select the EDIT icon on the Grade Level/Gender group and add an aggregate column. Quick Reference Guide Chalkable_ INFocus Basic Table Reporting 33

34 Select OK to save. Preview the report to see the aggregate results. Aggregate on Grade Level/Gender Quick Reference Guide Chalkable_ INFocus Basic Table Reporting 34

35 Aggregate on Grade Level/Gender To change the grouping from a Flat-Table to Drill Down from the Grouping tab, select the Grouped Drill Down selection. Select the EDIT icon to see how the system has updated the details on the grouped column. Quick Reference Guide Chalkable_ INFocus Basic Table Reporting 35
36 NOTE: Click on Show All Attributes if the screen does not look similar to the above screen shot. Additional options that can be helpful can also be set, such as column headers (instead of the word details in the screen shot below) and suffix (instead of the work rows in the screen shot below. You can also give the user an option to expand or collapse all drill downs. Preview the report to see the difference between a Drill Down report and a Flat Table report. The hyperlink under the Details column can be selected to drill down into the data. Quick Reference Guide Chalkable_ INFocus Basic Table Reporting 36

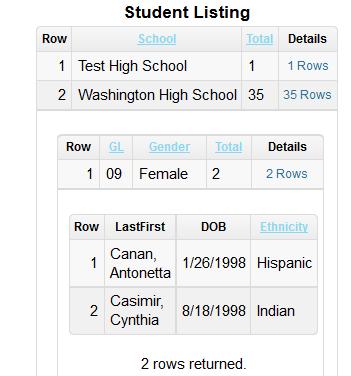
37 Quick Reference Guide Chalkable_ INFocus Basic Table Reporting 37
38 Steps to add export capabilities: On the INFocus reports list screen, scroll through (if necessary) your reports so that the one that was created in sample 1 that was just copied (in this example, Student Listing Advanced and hover over the ACTION control. Select Modify. The Report Definition screen is displayed. Select from the INSERT menu, Exports. The Export tab will appear. Quick Reference Guide Chalkable_ INFocus Basic Table Reporting 38

39 The following options are available: Searchable report opens a new browser window and displays the entire report on one page. Allows the browser FIND option to be used easily without have to scroll page by page. Printable paging opens a new browser window formatted for printing, avoiding the "cutoff" scenario that commonly occurs when printing web pages. Export to Excel opens a new browser window, displaying the report in Microsoft Excel (spreadsheet) format. Export to Word downloads the report into a Microsoft Word document. A temporary name is given to the file, with the Word file extension (.doc). Export to PDF opens the report in the current browser window as a PDF document viewable with Adobe Reader. Export to CSV opens a new browser window and displays the report in comma separated values within a spreadsheet (comma delimited text file). Export to XML opens a new browser window and displays all the data presented in the report in XML (Extensible Markup Language) format. Send report by (select format) opens a form where the can be composed and recipients specified. It attaches the report in the format selected. Select the desired formats. The icons for each format will be displayed at the bottom of the screen after the report has generated. Steps to add column configuration: On the INFocus reports list screen, scroll through (if necessary) your reports so that the one that was created in sample 1 that was just copied (in this example, Student Listing Advanced and hover over the ACTION control. Select Modify. The Report Definition screen is displayed. Quick Reference Guide Chalkable_ INFocus Basic Table Reporting 39
40 Select the tab Column Configuration. Typical changes to the configuration include column alignment, heads, and width. The table columns may be too narrow by default. Modify the width to increase column width to make the table easier to read or to eliminate word wrapping. The values are in pixels will require trial and error before becoming comfortable on setting up the report. The alignment for text within each column can be set to Left, Right or Center Quick Reference Guide Chalkable_ INFocus Basic Table Reporting 40
11/07 11/08/ /5/2012 Software Technology, Inc. Thomas Murphy
 0 Alabama INFOCUS Webinar 11/07 11/08/2012 11/5/2012 Software Technology, Inc. Thomas Murphy 0 Alabama INFOCUS Webinar OBJECTIVES: Tabular Report Introduce customers to the basics of building reports with
INFocus Absence List. Objectives. Creating new report. Select a Template
 INFocus Absence List About This Document The purpose of this document is to provide the required steps to create to create a report that lists all students with selected daily absence codes. Objectives
INFOCUS Bus List with Medical Condition. 11/29/2012 Software Technology, Inc. Thomas Murphy
 0 INFOCUS Bus List with Medical Condition 11/29/2012 Software Technology, Inc. Thomas Murphy 0 INFOCUS Bus List with Medical Condition OBJECTIVES: A student listing for each AM Bus of students that have
eschoolplus+ Cognos Query Studio Training Guide Version 2.4
 + Training Guide Version 2.4 May 2015 Arkansas Public School Computer Network This page was intentionally left blank Page 2 of 68 Table of Contents... 5 Accessing... 5 Working in Query Studio... 8 Query
Query Studio Training Guide Cognos 8 February 2010 DRAFT. Arkansas Public School Computer Network 101 East Capitol, Suite 101 Little Rock, AR 72201
 Query Studio Training Guide Cognos 8 February 2010 DRAFT Arkansas Public School Computer Network 101 East Capitol, Suite 101 Little Rock, AR 72201 2 Table of Contents Accessing Cognos Query Studio... 5
Test Information and Distribution Engine
 SC-Alt Test Information and Distribution Engine User Guide 2018 2019 Published January 14, 2019 Prepared by the American Institutes for Research Descriptions of the operation of the Test Information Distribution
Learn about the Display options Complete Review Questions and Activities Complete Training Survey
 Intended Audience: Staff members who will be using the AdHoc reporting tools to query the Campus database. Description: To learn filter and report design capabilities available in Campus. Time: 3 hours
I. Overview... 2 A. Users and User Roles... 2 B. System Information... 2 C. Help Menu... 3 D. Changing Your Password... 3 E. Logging In... 3 F.
 I. Overview... 2 A. Users and User Roles... 2 B. System Information... 2 C. Help Menu... 3 D. Changing Your Password... 3 E. Logging In... 3 F. Logging Off... 4 G. Navigation Bar... 4 II. Search Menu...
Table of Contents COURSE OVERVIEW... 5
 Table of Contents COURSE OVERVIEW... 5 DISCUSSION... 5 THE NEW DATABASE FORMAT... 5 COURSE TOPICS... 6 CONVENTIONS USED IN THIS MANUAL... 7 Tip Open a File... 7 LESSON 1: THE NEW INTERFACE... 8 LESSON
MicroStrategy Analytics Desktop
 MicroStrategy Analytics Desktop Quick Start Guide MicroStrategy Analytics Desktop is designed to enable business professionals like you to explore data, simply and without needing direct support from IT.
Welcome to Cole On-line Help system!
 Welcome to Cole On-line Help system! Cole Online is an Internet based information directory that allows fast and efficient access to demographic information about residences and businesses. You can search
Veco User Guides. Grids, Views, and Grid Reports
 Veco User Guides Grids, Views, and Grid Reports Introduction A Grid is defined as being a list of data records presented to the user. A grid is shown generally when an option is selected from the Tree
Asset Arena InvestOne
 Asset Arena InvestOne 1 21 AD HOC REPORTING 21.1 OVERVIEW Ad Hoc reporting supports a range of functionality from quick querying of data to more advanced features: publishing reports with complex features
eschoolplus+ General Information Training Guide Version 2.4
 eschoolplus+ General Information Training Guide Version 2.4 August 2013 Arkansas Public School Computer Network This page is intentionally left blank 8/23/2013 Page 2 of 29 Table of Contents eschoolplus
User Guide. Web Intelligence Rich Client. Business Objects 4.1
 User Guide Web Intelligence Rich Client Business Objects 4.1 2 P a g e Web Intelligence 4.1 User Guide Web Intelligence 4.1 User Guide Contents Getting Started in Web Intelligence 4.1... 5 Log into EDDIE...
Working with PDF s. To open a recent file on the Start screen, double click on the file name.
 Working with PDF s Acrobat DC Start Screen (Home Tab) When Acrobat opens, the Acrobat Start screen (Home Tab) populates displaying a list of recently opened files. The search feature on the top of the
PowerSchool Handbook Federal Survey Form Report
 Handbook Federal Survey Form Report Version 2.1 August 22, 2018 Copyright 2018, San Diego Unified School District. All rights reserved. This document may be reproduced internally by San Diego Unified School
Objective 1: Familiarize yourself with basic database terms and definitions. Objective 2: Familiarize yourself with the Access environment.
 Beginning Access 2007 Objective 1: Familiarize yourself with basic database terms and definitions. What is a Database? A Database is simply defined as a collection of related groups of information. Things
Center for Faculty Development and Support Making Documents Accessible
 Center for Faculty Development and Support Making Documents Accessible in Word 2007 Tutorial CONTENTS Create a New Document and Set Up a Document Map... 3 Apply Styles... 4 Modify Styles... 5 Use Table
Using Excel to Troubleshoot EMIS Data
 Using Excel to Troubleshoot EMIS Data Overview Basic Excel techniques can be used to analyze EMIS data from Student Information Systems (SISs), from the Data Collector, and on ODE EMIS reports This session
In this document, you will learn how to take a Microsoft Word Document and make it accessible and available as a PDF.
 Accessibility Creating Accessible PDFs using Microsoft Word What is PDF Accessibility? Accessibility is a general term used to describe the degree to which a product, device, service, or environment is
MicroStrategy Desktop
 MicroStrategy Desktop Quick Start Guide MicroStrategy Desktop is designed to enable business professionals like you to explore data, simply and without needing direct support from IT. 1 Import data from
DEPARTMENT OF EDUCATION. Schedules
 DEPARTMENT OF EDUCATION EDUCATOR CERTIFICATION Contents Revision History... 2 Revision History Chart... 2 1. How do I get started?... 3 2. Selecting a Schedule?... 5 3. Viewing the selected results...
BusinessObjects Frequently Asked Questions
 BusinessObjects Frequently Asked Questions Contents Is there a quick way of printing together several reports from the same document?... 2 Is there a way of controlling the text wrap of a cell?... 2 How
MICROSOFT OFFICE. Courseware: Exam: Sample Only EXCEL 2016 CORE. Certification Guide
 MICROSOFT OFFICE Courseware: 3263 2 Exam: 77 727 EXCEL 2016 CORE Certification Guide Microsoft Office Specialist 2016 Series Microsoft Excel 2016 Core Certification Guide Lesson 1: Introducing Excel Lesson
Creating Reports in Access 2007 Table of Contents GUIDE TO DESIGNING REPORTS... 3 DECIDE HOW TO LAY OUT YOUR REPORT... 3 MAKE A SKETCH OF YOUR
 Creating Reports in Access 2007 Table of Contents GUIDE TO DESIGNING REPORTS... 3 DECIDE HOW TO LAY OUT YOUR REPORT... 3 MAKE A SKETCH OF YOUR REPORT... 3 DECIDE WHICH DATA TO PUT IN EACH REPORT SECTION...
IRA Basic Running Financial Reports
 IRA Basic Running Financial Reports Updated 6-7-2013 1 Training Index Part I Introduction to the IRA Reporting Tool IRA Resources (3) Logging onto the system (4) Navigating the Dashboard (5-9) Running
Microsoft Excel 2010
 Microsoft Excel 2010 omar 2013-2014 First Semester 1. Exploring and Setting Up Your Excel Environment Microsoft Excel 2010 2013-2014 The Ribbon contains multiple tabs, each with several groups of commands.
MicroStrategy reporting uses a browser-independent web interface that includes features like:
 INTRODUCTION TO BUSINESS INTELLIGENCE Business Intelligence (BI) uses methodologies, processes, architectures, and technologies that transform raw data into meaningful and useful information used to enable
Using Reports and Graphs
 Using Reports and Graphs Information in this section explains how to generate and use PCS Axis reports and graphs. The information is intended for PCS Axis users with SysAdmin, User, and Read Only user
IRA Basic Running Financial Reports
 IRA Basic Running Financial Reports Dartmouth College maintains a data warehouse of institutional finances, student data, advancement giving and other important measures. Institutional Reporting and Analysis
Instructional Improvement System (IIS) Dashboard District User Guide Statewide Longitudinal Data System (SLDS)
 Dashboard District User Guide Statewide Longitudinal Data System (SLDS)") Instructional Improvement System (IIS) Dashboard District User Guide Statewide Longitudinal Data System (SLDS) June 10, 2014 Page 1 of 36 IIS Dashboard District User Guide 2 Contents Project Overview...
Instructional Improvement System (IIS) Dashboard District User Guide Statewide Longitudinal Data System (SLDS) June 10, 2014 Page 1 of 36 IIS Dashboard District User Guide 2 Contents Project Overview...
Version 1.6. UDW+ Quick Start Guide to Functionality. Program Services Office & Decision Support Group
 Version 1.6 UDW+ Quick Start Guide to Functionality Program Services Office & Decision Support Group Table of Contents Access... 2 Log in/system Requirements... 2 Data Refresh... 2 00. FAME Chartfield
Test Information and Distribution Engine
 Test Information and Distribution Engine User Guide 2017-2018 Published March 28, 2018 Prepared by the American Institutes for Research Descriptions of the operation of the Test Information Distribution
Reporter Tutorial: Intermediate
 Reporter Tutorial: Intermediate Refer to the following sections for guidance on using these features of the Reporter: Lesson 1 Data Relationships in Reports Lesson 2 Create Tutorial Training Report Lesson
Working with Mailbox Manager
 Working with Mailbox Manager A user guide for Mailbox Manager supporting the Message Storage Server component of the Avaya S3400 Message Server Mailbox Manager Version 5.0 February 2003 Copyright 2003
PowerSchool Handbook Federal Survey Card Report
 Handbook Federal Survey Card Report Version 1.0 August 9, 2017 Copyright 2017, San Diego Unified School District. All rights reserved. This document may be reproduced internally by San Diego Unified School
Excel Select a template category in the Office.com Templates section. 5. Click the Download button.
 Microsoft QUICK Excel 2010 Source Getting Started The Excel Window u v w z Creating a New Blank Workbook 2. Select New in the left pane. 3. Select the Blank workbook template in the Available Templates
POS Designer Utility
 POS Designer Utility POS Designer Utility 01/15/2015 User Reference Manual Copyright 2012-2015 by Celerant Technology Corp. All rights reserved worldwide. This manual, as well as the software described
RONA e-billing User Guide
 RONA e-billing Contractor Self-Service Portal User Guide RONA e-billing User Guide 2015-03-10 Table of Contents Welcome to RONA e-billing What is RONA e-billing?... i RONA e-billing system requirements...
Successmaker Student and Teacher Imports
 Successmaker 2011 Student and Teacher Imports First Get teacher names to Import Go to: http://dev1.escambia.k12.fl.usescambia Click on List All the Records in the Employee Database Group Choose Instructional
How to Download Data from MiSiS
 How to Download Data from MiSiS Note: This guide provides instructions for using Excel 2007. If you have a newer system, please see the Excel 2010 guide. Downloading data from MiSiS is useful for: Mail
Advanced Excel for EMIS Coordinators
 Advanced Excel for EMIS Coordinators Helen Mills helenmills@metasolutions.net 2015 Metropolitan Educational Technology Association Outline Macros Conditional Formatting Text to Columns Pivot Tables V-Lookup
2015 Arkansas Department of Education Data & Reporting Conference. Cognos Query Studio
 2015 Arkansas Department of Education Data & Reporting Conference Cognos Query Studio SMS Workshop August 7, 2015 Arkansas Public School Computer Network CREATING REPORTS USED TO GENERATE DATA FILES 1.
Microsoft Word 2010 Intermediate
 Microsoft Word 2010 Intermediate Agenda 1. Welcome, Introduction, Sign-in 2. Presentation 3. a. Advanced Formatting i. Review: Use Select All to change alignment, font style, spacing ii. Headers and Footers
Status Bar: Right click on the Status Bar to add or remove features.
 Excel 2013 Quick Start Guide The Excel Window File Tab: Click to access actions like Print, Save As, etc. Also to set Excel options. Ribbon: Logically organizes actions onto Tabs, Groups, and Buttons to
GRADING ASSIGNMENTS. You can access assignments that have been submitted by students and need grading from the:
 GRADING ASSIGNMENTS When you create an assignment, a column is added automatically to the Grade Center. An assignment that has been submitted, but not graded, is indicated with an exclamation mark ( )
STUDENT PERFORMANCE INDICATORS (SPI)
") Table of Contents System Overview... 1 Log in to the Employee Portal... 2 Accessing the Student Performance Indicators (SPI) Application... 4 SPI Toolbar and Other Functions... 6 Teacher Schedule... 7
Table of Contents System Overview... 1 Log in to the Employee Portal... 2 Accessing the Student Performance Indicators (SPI) Application... 4 SPI Toolbar and Other Functions... 6 Teacher Schedule... 7
Excel 2007 New Features Table of Contents
 Table of Contents Excel 2007 New Interface... 1 Quick Access Toolbar... 1 Minimizing the Ribbon... 1 The Office Button... 2 Format as Table Filters and Sorting... 2 Table Tools... 4 Filtering Data... 4
Service Minder Plus Features/Helpful Hints
 Service Minder Plus Features/Helpful Hints This manual covers helpful hints and use of features. Note: These items will be addressed during the training sessions. This document is meant to be used as an
Expedient User Manual Getting Started
 Volume 1 Expedient User Manual Getting Started Gavin Millman & Associates Pty Ltd 281 Buckley Street Essendon VIC 3040 Phone 03 9331 3944 Web www.expedientsoftware.com.au Table of Contents Logging In...
Business Process Procedures
 Business Process Procedures 14.40 MICROSOFT EXCEL TIPS Overview These procedures document some helpful hints and tricks while using Microsoft Excel. Key Points This document will explore the following:
Getting Started with Access
 MS Access Chapter 2 Getting Started with Access Course Guide 2 Getting Started with Access The Ribbon The strip across the top of the program window that contains groups of commands is a component of the
Searching for Images in v10
 Searching for Images in v10 Following are the steps to search for images in Docfinity version 10. Searching for Images: Log into Docfinity on www.controller.psu.edu/docfinity Open Searching Workspace in
Importing from Blackboard Learn Grade Center Data to Banner 9 User Learning Scenarios
 Importing from Blackboard Learn Grade Center Data to Banner 9 User Learning Scenarios Step 1: Make sure Final Grade Column Displays Letter Grade Ensure your final grade column in Grade Center has letter
Interfacing with MS Office Conference 2017
 Conference 2017 Session Description: This session will detail procedures for importing/exporting data between AeriesSIS Web Version/AeriesSIS Client Version and other software packages, such as word processing
SmartView. User Guide - Analysis. Version 2.0
 SmartView User Guide - Analysis Version 2.0 Table of Contents Page i Table of Contents Table Of Contents I Introduction 1 Dashboard Layouts 2 Dashboard Mode 2 Story Mode 3 Dashboard Controls 4 Dashboards
Student Browse. Filter Options Creating a Filter Quick Filter
 Student Browse Student Browse Locating a Student Student Information Browse Views Chart Options Export Options Printer Friendly Display Processing List Option Filter Options Creating a Filter Quick Filter
Printing Batch Unofficial Transcripts
 Printing Batch Unofficial Transcripts On occasion, you may need to print unofficial transcripts for several students at one time. The Batch Transcripts process allows you to upload a text file containing
Blackbaud StudentInformationSystem. NetSolutions Guide
 Blackbaud StudentInformationSystem NetSolutions Guide 102411 2011 Blackbaud, Inc. This publication, or any part thereof, may not be reproduced or transmitted in any form or by any means, electronic, or
Microsoft Access 2007 Module 2
 Microsoft Access 007 Module http://pds.hccfl.edu/pds Microsoft Access 007: Module August 007 007 Hillsborough Community College - Professional Development and Web Services Hillsborough Community College
Senior Systems, Inc. June 2006
 Senior Academic Products Release Bulletin Inside Exports p. 2 Query System p. 7 It is our pleasure to introduce you to the new Export function in REGISTRAR, SCHEDULING, PLACEMENT, and DEAN S OFFICE, and
Tennessee Society Sons of the American Revolution On-Line Application Log Database
 1) On the TNSSAR website (www.tnssar.org) click on "Site Links" in the menu. Then click on "Restricted Access" to go to the State & Chapter Officer Entry page (http://www.tnssar.org/archives/memberenter.html
Importing Career Standards Benchmark Scores
 Importing Career Standards Benchmark Scores The Career Standards Benchmark assessments that are reported on the PIMS Student Fact Template for Career Standards Benchmarks can be imported en masse using
Introduction to Qualtrics Research Suite Wednesday, September 19, 2012
 Logging in to Qualtrics Introduction to Qualtrics Research Suite Wednesday, September 19, 2012 1. Open a browser and go to http://www.qualtrics.com 2. If you have a Qualtrics account, use it to login.
Intellix Payments Reference Guide
 Intellix Payments Reference Guide Table of Contents Overview 3 Accessing Payment Functionality 3 About this Guide and Additional Training 3 Using List Functionality in Intellix Payments 4 Overview 4 Standard
Linking Program Review Data to Reports
 Linking Program Review Data to Reports 1. Accessing & Using the Program Review Data Warehouse 2. Creating Hyperlinks in your Report 3. Exporting Colleague Data as Excel Spreadsheets Open your internet
Funasset Limited Foundry House Foundry Road Taunton Somerset TA1 1JJ. Tel: +44 (0) Fax: +44 (0) mailmarkup.com funasset.
 Fax: +44 (0) mailmarkup.com funasset.") Funasset Limited Foundry House Foundry Road Taunton Somerset TA1 1JJ Tel: +44 (0)1823 365864 Fax: +44 (0)1823 277266 mailmarkup.com funasset.com Copyright 2012 Funasset Limited. All rights reserved. Products
Funasset Limited Foundry House Foundry Road Taunton Somerset TA1 1JJ Tel: +44 (0)1823 365864 Fax: +44 (0)1823 277266 mailmarkup.com funasset.com Copyright 2012 Funasset Limited. All rights reserved. Products
You will need the unique URL for your site and your username and password to login to Data- Director.
 Getting Started Step 1: Login to the DataDirector website: You will need the unique URL for your site and your username and password to login to Data- Director. You may change your password after you login.
ScholarOne Abstracts. Review Administrator Guide
 ScholarOne Abstracts Review Administrator Guide 17-October-2018 Clarivate Analytics ScholarOne Abstracts Review Administrator Guide Page i TABLE OF CONTENTS Select an item in the table of contents to go
HOW TO USE THE EXPORT FEATURE IN LCL
 HOW TO USE THE EXPORT FEATURE IN LCL In LCL go to the Go To menu and select Export. Select the items that you would like to have exported to the file. To select them you will click the item in the left
Table of Contents. 1 P a g e
 Table of Contents User Manual... 2 Florida s PK-20 Education Information Portal... 2 Navigating the Portal... 2 Tabs... 3 Accessible Site... 3 Helpful Resources... 4 State Level Tab... 4 District Level
Step 1: Prepare the worksheet data in Excel for the mail merge You can FT Menu Prompt # 1 R for Report.
 Creating Address Labels from Microsoft Word Mail Merge If you want to send a mass mailing to an address list that you maintain in a Microsoft Office Excel worksheet, you can use a Microsoft Office Word
Steps: 1. Log in to the Dmitri application through the following website URL, as appropriate:
 Dmitri Suite Getting Started Logging In and Logging Out Logging In Use the following steps to log in to the Dmitri application. Steps: 1. Log in to the Dmitri application through the following website
My Query Builder Function
 My Query Builder Function The My Query Builder function is used to build custom SQL queries for reporting information out of the TEAMS system. Query results can be exported to a comma-separated value file,
INTRODUCTION... 1 UNDERSTANDING CELLS... 2 CELL CONTENT... 4
 Introduction to Microsoft Excel 2016 INTRODUCTION... 1 The Excel 2016 Environment... 1 Worksheet Views... 2 UNDERSTANDING CELLS... 2 Select a Cell Range... 3 CELL CONTENT... 4 Enter and Edit Data... 4
Introduction to Microsoft Access 2016
 Introduction to Microsoft Access 2016 A database is a collection of information that is related. Access allows you to manage your information in one database file. Within Access there are four major objects:
Word 2016 Advanced. North American Edition SAMPLE
 Word 2016 Advanced Word 2016 Advanced North American Edition WORD 2016 ADVANCED Page 2 2015 Cheltenham Group Pty. Ltd. All trademarks acknowledged. E&OE. No part of this document may be copied without
Faculty Guide to Grade Center in Blackboard 9.1
 Faculty Guide to Grade Center in Blackboard 9.1 Grade Center, formally known as Gradebook, is a central repository for assessment data, student information, and instructor notes. Although it includes items
Access the Student Information Analytics System Powered OBIEE :
 Overview: The SIA - Schedule of Classes (Printable) dashboard allows registrars offices and curriculum management staff at the schools to extract data from the my.harvard schedule of classes in a highly
Table of Contents COURSE OBJECTIVES... 2 LESSON 1: ADVISING SELF SERVICE... 4 NOTE: NOTIFY BUTTON LESSON 2: STUDENT ADVISOR...
 Table of Contents COURSE OBJECTIVES... 2 LESSON 1: ADVISING SELF SERVICE... 4 DISCUSSION... 4 INTRODUCTION TO THE ADVISING SELF SERVICE... 5 STUDENT CENTER TAB... 8 GENERAL INFO TAB... 19 TRANSFER CREDIT
User Manual. TEKScore
 User Manual TEKScore This document was created to help schools utilize the web-based applications offered by DMAC Solutions. Click on the sections below or scroll to the next page to see step-by-step instructions.
User Guide. Version Exago Inc. All rights reserved.
 User Guide Version 2016.2 2016 Exago Inc. All rights reserved. Exago Reporting is a registered trademark of Exago, Inc. Windows is a registered trademark of Microsoft Corporation in the United States and
Adding and Editing Chapter and Adviser Information Logging in for the first time (Existing chapters)... 2
... 2") Chapter Advisers CONTENTS Adding and Editing Chapter and Adviser Information... 2 Logging in for the first time (Existing chapters)... 2 How to edit a chapter s information:... 2 How to view all chapter
Chapter Advisers CONTENTS Adding and Editing Chapter and Adviser Information... 2 Logging in for the first time (Existing chapters)... 2 How to edit a chapter s information:... 2 How to view all chapter
User Manual: Manager
 Learning Management System ( LMS ) User Manual: Manager V NLFMG-03092017-1 Disclaimer and Warranty Information Limits of Liability / Disclaimer of Warranty The information contained within this manual
Using the Export Function in ChildWare 2.0
 P a g e 1 Using the Export Function in ChildWare 2.0 There are times when you may need to print out information from ChildWare 2.0 for your agency, parents or funding sources. The easiest way to do this
Pepkor webcom Quick Reference Guide. Version Date: 2013/12 Version Number: 1.3
 Pepkor webcom Quick Reference Guide Version Date: 2013/12 Version Number: 1.3 Table of Contents 1 INTRODUCTION... 4 2 LOGGING IN... 4 3 NAVIGATE INSIDE WEBCOM... 5 3.1 MAIN SECTION 5 3.1.1 Home... 5 3.1.2
Test Information and Distribution Engine
 Montana Comprehensive Assessment System Test Information and Distribution Engine User Guide 2018-2019 Published January 10, 2019 Prepared by the American Institutes for Research and Measured Progress Descriptions
OBIEE. Oracle Business Intelligence Enterprise Edition. Rensselaer Business Intelligence Finance Author Training
 OBIEE Oracle Business Intelligence Enterprise Edition Rensselaer Business Intelligence Finance Author Training TABLE OF CONTENTS INTRODUCTION... 1 USER INTERFACE... 1 HOW TO LAUNCH OBIEE... 1 TERMINOLOGY...
Order Status and Results. Web Application
 Order Status and Results Web Application User Manual March 2018 Table of Contents Introduction... 4 General Information... 5 ARUP Client List... 5 Filter... 5 Show Entries... 6 Sort Table Lists... 6 Navigation...
MS Word 2013 Accessibility Fundamentals
 MS Word 2013 Accessibility Fundamentals Adapted with permission from ACCESSIBILITY FUNDAMENTALS FOR MICROSOFT OFFICE 2013, New Horizons Computer Learning Centers, 2014 INTRODUCTION Accessibility is the
Super User EPIC Reference Guide
 Super User EPIC Reference Guide Electronic Provider Interactive Claims Online SHARS Billing http://www.tsbs.cc/ Username/Login name: Password: 1 LAST REVISED: 8/19/2014 11:35 AM Table of Contents TSBS
How to Create Custom Name Badge Inserts with a Mail Merge in Microsoft Word 2007
 Many people know that you can use the Mail Merge feature in Microsoft Word 2007 to easily create mailing labels, but did you know you can use it to quickly create custom name badge inserts? Here, you will
Astra Scheduling Grids
 Astra Scheduling Grids To access the grids, click on the Scheduling Grids option from the Calendars tab. A default grid will be displayed as defined by the calendar permission within your role. Choosing
ITaP Confluence Guide. Instructions for Getting Started with Confluence a Purdue
 ITaP Confluence Guide Instructions for Getting Started with Confluence a Purdue This instruction set was developed by ITaP for instructor and student use. For comments, suggestions, correction, etc. please
WEST TEXAS A&M UNIVERSITY
 WEST TEXAS A&M UNIVERSITY Instructional Technology Services WTClass Training Manual Grade Center July 2014 WTClass Blackboard 9.1 For technical support call (806) 651-4357 Support website: http://angel.wtamu.edu/online
FirmSite Control. Tutorial
 FirmSite Control Tutorial 1 Last Updated June 26, 2007 by Melinda France Contents A. Logging on to the Administrative Control Center... 3 Using the Editor Overview:... 3 Inserting an Image... 7 Inserting
IBM DB2 Web Query for IBM i. Version 2 Release 2
 IBM DB2 Web Query for IBM i Version 2 Release 2 Active Technologies, EDA, EDA/SQL, FIDEL, FOCUS, Information Builders, the Information Builders logo, iway, iway Software, Parlay, PC/FOCUS, RStat, Table
Instructions for Formatting MLA Style Papers in Microsoft Word 2010
 Instructions for Formatting MLA Style Papers in Microsoft Word 2010 To begin a Microsoft Word 2010 project, click on the Start bar in the lower left corner of the screen. Select All Programs and then find
Introduction to Microsoft Office 2007
 Introduction to Microsoft Office 2007 What s New follows: TABS Tabs denote general activity area. There are 7 basic tabs that run across the top. They include: Home, Insert, Page Layout, Review, and View