Using SAS to Analyze CYP-C Data: Introduction to Procedures. Overview
|
|
|
- Erika Watts
- 5 years ago
- Views:
Transcription
1 Using SAS to Analyze CYP-C Data: Introduction to Procedures CYP-C Research Champion Webinar July 14, 2017 Jason D. Pole, PhD Overview SAS overview revisited Introduction to SAS Procedures PROC FREQ PROC PRINT PROC MEANS PROC UNIVARIATE PROC SORT PROC CONTENTS 1
2 SAS Overview - Revisited For our purposes only two major things you can do in SAS DATA step - Manipulate the data in some way Reading in Data Creating and Redefining Variables Sub-Setting Data Working with Dates Working with Formats Procedure step Analyze the data Produce frequency tables Estimate a regression model PROC FREQ 2
3 SAS PROC FREQ Allows you to get a n-way cross-tabulation of data Basic statistical tests are available PROC FREQ <options>; BY <variable list>; TABLES <requests> / <options>; PROC FREQ DATA = T7; TABLES QAIPPE GENDER; 3

4 PROC FREQ DATA = T7; TABLES QAIPPE / MISSING; PROC FREQ DATA = T7; BY GENDER; TABLES QAIPPE / MISSING; 4
5 PROC FREQ DATA = T7; TABLES QAIPPE * GENDER / MISSING; PROC FREQ DATA = T7; TABLES QAIPPE * GENDER / LIST MISSING; 5

6 PROC FREQ DATA = T7; TABLES QAIPPE * GENDER / CHISQ; PROC FREQ DATA = T7; TABLES DUMALL * GENDER / CMH; 6
7 PROC FREQ DATA = T7; TABLES DUMALL * GENDER * QAIPPE / LIST MISSING; PROC PRINT 7
8 SAS PROC PRINT Allows you to print out data from a dataset while controlling various aspects like sub-groups Prints observations based on order in current dataset (modify this by using PROC SORT procedure before the PROC PRINT) PROC PRINT <options>; BY <variable list>; VAR <requests> / <options>; PROC PRINT DATA = T7; VAR GENDER QAIPPE DX_DATE; 8
9 PROC PRINT DATA = T7; WHERE DUMALL = 1; VAR GENDER QAIPPE DX_DATE; PROC PRINT DATA = T7; WHERE DUMALL = 1; BY GENDER; VAR QAIPPE DX_DATE; 9
10 PROC MEANS SAS PROC MEANS Allows you to summarize data and compute descriptive statistics across variables and within groups Can calculate mean, measures of variation, median, ranges, extreme values and perform t-tests PROC MEANS <options> <statistic-keywords>; BY <variable list>; CLASS <variable list> / <options>; FREQ <variable>; ID <variable list>; OUTPUT < options> ; VAR <variable list>; 10
11 PROC MEANS DATA = T7; VAR TIMEDEATH; PROC MEANS DATA = T7; BY GENDER; VAR TIMEDEATH; 11
12 PROC MEANS DATA = T7; CLASS GENDER; VAR TIMEDEATH; PROC MEANS DATA = T7 NMISS N MEAN STD STDERR CLM MIN MAX MAXDEC=2; CLASS GENDER; VAR TIMEDEATH; 12
13 PROC MEANS DATA = T7 NMISS N MEAN STD STDERR CLM MIN MAX MAXDEC=2 MISSING; CLASS GENDER; VAR TIMEDEATH; PROC MEANS DATA = T7 NMISS N MEAN STD STDERR CLM MIN MAX MAXDEC=2 MISSING NOPRINT; CLASS GENDER; VAR TIMEDEATH; OUTPUT OUT=T7_TTD_MEAN NMISS=NMISS_TTD N=N_TTD MEAN=MEAN_TTD; PROC PRINT DATA = T7_TTD_MEAN; 13
14 PROC UNIVARIATE SAS PROC UNIVARIATE Allows you to examine the distribution of data and assess normality and identify outliers Can create many plots and run various statistical tests PROC UNIVARIATE <options> ; BY <variable list> ; CLASS <variable list> / <options> ; ID <variable list> ; VAR <variable list> ; 14
15 PROC UNIVARIATE DATA = T7; VAR DX_AGE; 15
16 PROC UNIVARIATE DATA = T7; ID CYPCID; VAR DX_AGE; 16
17 PROC UNIVARIATE DATA = T7 PLOT; ID CYPCID; VAR DX_AGE; PROC UNIVARIATE DATA = T7 PLOT; CLASS GENDER; ID CYPCID; VAR DX_AGE; 17
18 PROC SORT SAS PROC SORT Allows you to rearrange or sort the observations in a dataset by character or numeric variables A sorted dataset is required for any BY group processing You can make many modifications to a dataset using this procedure which can often speed up your code PROC SORT <options> ; BY <variable list> ; KEY <variable list> / <options> ; 18

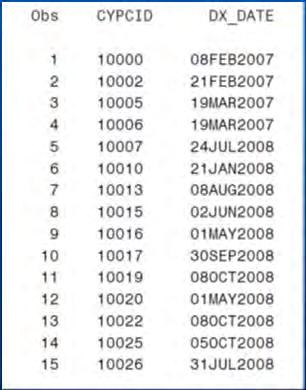
19 PROC PRINT DATA = T7 (OBS=15); VAR CYPCID DX_DATE; PROC SORT DATA = T7; BY CYPCID; PROC PRINT DATA = T7 (OBS=15); VAR CYPCID DX_DATE; PROC SORT DATA = T7; BY GENDER CYPCID DX_DATE; PROC PRINT DATA = T7 (OBS=15); VAR GENDER CYPCID DX_DATE; 19
20 PROC SORT DATA = T7; BY CYPCID GENDER DX_DATE; PROC PRINT DATA = T7 (OBS=15); VAR GENDER CYPCID DX_DATE; PROC SORT DATA = T7; BY DESCENDING GENDER CYPCID DESCENDING DX_DATE; PROC PRINT DATA = T7 (OBS=15); VAR GENDER CYPCID DX_DATE; 20
21 PROC SORT DATA = T7 OUT = T8 (KEEP=CYPCID DX_DATE); BY DESCENDING GENDER CYPCID DESCENDING DX_DATE; PROC SORT DATA = T7 OUT = T8 (RENAME=(CYPCID=ID)); BY DESCENDING GENDER CYPCID DESCENDING DX_DATE; PROC CONTENTS 21
22 SAS PROC CONTENTS Allows you to obtain information about datasets in your library PROC CONTENTS <options> ; PROC CONTENTS DATA = T7; 22
23 PROC CONTENTS DATA = T7 ORDER = VARNUM; Topics Covered SAS overview revisited SAS Procedures PROC FREQ PROC PRINT PROC MEANS PROC UNIVARIATE PROC SORT PROC CONTENTS 23
24 24
22S:166. Checking Values of Numeric Variables
 22S:1 Computing in Statistics Lecture 24 Nov. 2, 2016 1 Checking Values of Numeric Variables range checks when you know what the range of possible values is for a given quantitative variable internal consistency
EXAMPLE 2: INTRODUCTION TO SAS AND SOME NOTES ON HOUSEKEEPING PART II - MATCHING DATA FROM RESPONDENTS AT 2 WAVES INTO WIDE FORMAT
 EXAMPLE 2: PART I - INTRODUCTION TO SAS AND SOME NOTES ON HOUSEKEEPING PART II - MATCHING DATA FROM RESPONDENTS AT 2 WAVES INTO WIDE FORMAT USING THESE WORKSHEETS For each of the worksheets you have a
SAS Programs SAS Lecture 4 Procedures. Aidan McDermott, April 18, Outline. Internal SAS formats. SAS Formats
 SAS Programs SAS Lecture 4 Procedures Aidan McDermott, April 18, 2006 A SAS program is in an imperative language consisting of statements. Each statement ends in a semi-colon. Programs consist of (at least)
Basic Concepts #6: Introduction to Report Writing
 Basic Concepts #6: Introduction to Report Writing Using By-line, PROC Report, PROC Means, PROC Freq JC Wang By-Group Processing By-group processing in a procedure step, a BY line identifies each group
A SAS Macro for Producing Benchmarks for Interpreting School Effect Sizes
 A SAS Macro for Producing Benchmarks for Interpreting School Effect Sizes Brian E. Lawton Curriculum Research & Development Group University of Hawaii at Manoa Honolulu, HI December 2012 Copyright 2012
STAT:5400 Computing in Statistics
 STAT:5400 Computing in Statistics Introduction to SAS Lecture 18 Oct 12, 2015 Kate Cowles 374 SH, 335-0727 kate-cowles@uiowaedu SAS SAS is the statistical software package most commonly used in business,
DSCI 325: Handout 10 Summarizing Numerical and Categorical Data in SAS Spring 2017
 DSCI 325: Handout 10 Summarizing Numerical and Categorical Data in SAS Spring 2017 USING PROC MEANS The routine PROC MEANS can be used to obtain limited summaries for numerical variables (e.g., the mean,
STAT 503 Fall Introduction to SAS
 Getting Started Introduction to SAS 1) Download all of the files, sas programs (.sas) and data files (.dat) into one of your directories. I would suggest using your H: drive if you are using a computer
EXST SAS Lab Lab #6: More DATA STEP tasks
 EXST SAS Lab Lab #6: More DATA STEP tasks Objectives 1. Working from an current folder 2. Naming the HTML output data file 3. Dealing with multiple observations on an input line 4. Creating two SAS work
SAS Example A10. Output Delivery System (ODS) Sample Data Set sales.txt. Examples of currently available ODS destinations: Mervyn Marasinghe
 Sample Data Set sales.txt. Examples of currently available ODS destinations: Mervyn Marasinghe") SAS Example A10 data sales infile U:\Documents\...\sales.txt input Region : $8. State $2. +1 Month monyy5. Headcnt Revenue Expenses format Month monyy5. Revenue dollar12.2 proc sort by Region State Month
SAS Example A10 data sales infile U:\Documents\...\sales.txt input Region : $8. State $2. +1 Month monyy5. Headcnt Revenue Expenses format Month monyy5. Revenue dollar12.2 proc sort by Region State Month
SAS is the most widely installed analytical tool on mainframes. I don t know the situation for midrange and PCs. My Focus for SAS Tools Here
 Explore, Analyze, and Summarize Your Data with SAS Software: Selecting the Best Power Tool from a Rich Portfolio PhD SAS is the most widely installed analytical tool on mainframes. I don t know the situation
Reading data in SAS and Descriptive Statistics
 P8130 Recitation 1: Reading data in SAS and Descriptive Statistics Zilan Chai Sep. 18 th /20 th 2017 Outline Intro to SAS (windows, basic rules) Getting Data into SAS Descriptive Statistics SAS Windows
Statements with the Same Function in Multiple Procedures
 67 CHAPTER 3 Statements with the Same Function in Multiple Procedures Overview 67 Statements 68 BY 68 FREQ 70 QUIT 72 WEIGHT 73 WHERE 77 Overview Several statements are available and have the same function
An Introduction to SAS University Edition
 An Introduction to SAS University Edition Ron Cody From An Introduction to SAS University Edition. Full book available for purchase here. Contents List of Programs... xi About This Book... xvii About the
/********************************************/ /* Evaluating the PS distribution!!! */ /********************************************/
 SUPPLEMENTAL MATERIAL: Example SAS code /* This code demonstrates estimating a propensity score, calculating weights, */ /* evaluating the distribution of the propensity score by treatment group, and */
5b. Descriptive Statistics - Part II
 5b. Descriptive Statistics - Part II In this lab we ll cover how you can calculate descriptive statistics that we discussed in class. We also learn how to summarize large multi-level databases efficiently,
Processing SAS Data Sets
 Statistical Data Analysis 1 Processing SAS Data Sets Namhyoung Kim Dept. of Applied Statistics Gachon University nhkim@gachon.ac.kr 1 Using OUT Dataset OUTPUT Statement OUTPUT
Paper DB2 table. For a simple read of a table, SQL and DATA step operate with similar efficiency.
 Paper 76-28 Comparative Efficiency of SQL and Base Code When Reading from Database Tables and Existing Data Sets Steven Feder, Federal Reserve Board, Washington, D.C. ABSTRACT In this paper we compare
Introduction to SAS Procedures SAS Basics III. Susan J. Slaughter, Avocet Solutions
 Introduction to SAS Procedures SAS Basics III Susan J. Slaughter, Avocet Solutions DATA versus PROC steps Two basic parts of SAS programs DATA step PROC step Begin with DATA statement Begin with PROC statement
Level I: Getting comfortable with my data in SAS. Descriptive Statistics
 Level I: Getting comfortable with my data in SAS. Descriptive Statistics Quick Review of reading Data into SAS Preparing Data 1. Variable names in the first row make sure they are appropriate for the statistical
A Side of Hash for You To Dig Into
 A Side of Hash for You To Dig Into Shan Ali Rasul, Indigo Books & Music Inc, Toronto, Ontario, Canada. ABSTRACT Within the realm of Customer Relationship Management (CRM) there is always a need for segmenting
Introduction to SAS Procedures SAS Basics III. Susan J. Slaughter, Avocet Solutions
 Introduction to SAS Procedures SAS Basics III Susan J. Slaughter, Avocet Solutions SAS Essentials Section for people new to SAS Core presentations 1. How SAS Thinks 2. Introduction to DATA Step Programming
BY S NOTSORTED OPTION Karuna Samudral, Octagon Research Solutions, Inc., Wayne, PA Gregory M. Giddings, Centocor R&D Inc.
 ABSTRACT BY S NOTSORTED OPTION Karuna Samudral, Octagon Research Solutions, Inc., Wayne, PA Gregory M. Giddings, Centocor R&D Inc., Malvern, PA What if the usual sort and usual group processing would eliminate
SAS Training Spring 2006
 SAS Training Spring 2006 Coxe/Maner/Aiken Introduction to SAS: This is what SAS looks like when you first open it: There is a Log window on top; this will let you know what SAS is doing and if SAS encountered
Exam Questions A00-281
 Exam Questions A00-281 SAS Certified Clinical Trials Programmer Using SAS 9 Accelerated Version https://www.2passeasy.com/dumps/a00-281/ 1.Given the following data at WORK DEMO: Which SAS program prints
The Essential Meaning of PROC MEANS: A Beginner's Guide to Summarizing Data Using SAS Software
 The Essential Meaning of PROC MEANS: A Beginner's Guide to Summarizing Data Using SAS Software Andrew H. Karp Sierra Information Services, Inc. Sonoma, California USA Gary M. McQuown Data and Analytic
SAS seminar. The little SAS book Chapters 3 & 4. April 15, Åsa Klint. By LD Delwiche and SJ Slaughter. 3.1 Creating and Redefining variables
 SAS seminar April 15, 2003 Åsa Klint The little SAS book Chapters 3 & 4 By LD Delwiche and SJ Slaughter Data step - read and modify data - create a new dataset - performs actions on rows Proc step - use
Learning SAS by Example
 Learning SAS by Example A Programmer's Guide Second Edition.sas Ron Cody The correct bibliographic citation for this manual is as follows: Cody, Ron. 2018. Learning SAS by Example: A Programmer's Guide,
Introducing a Colorful Proc Tabulate Ben Cochran, The Bedford Group, Raleigh, NC
 Paper S1-09-2013 Introducing a Colorful Proc Tabulate Ben Cochran, The Bedford Group, Raleigh, NC ABSTRACT Several years ago, one of my clients was in the business of selling reports to hospitals. He used
Centering and Interactions: The Training Data
 Centering and Interactions: The Training Data A random sample of 150 technical support workers were first given a test of their technical skill and knowledge, and then randomly assigned to one of three
Writing Reports with the
 Writing Reports with the SAS System s TABULATE Procedure or Big Money Proc Tabulate Ben Cochran The Bedford Group bencochran@nc.rr.com Writing Reports with the SAS System s TABULATE Procedure Copyright
Applied Regression Modeling: A Business Approach
 i Applied Regression Modeling: A Business Approach Computer software help: SAS code SAS (originally Statistical Analysis Software) is a commercial statistical software package based on a powerful programming
It s Proc Tabulate Jim, but not as we know it!
 Paper SS02 It s Proc Tabulate Jim, but not as we know it! Robert Walls, PPD, Bellshill, UK ABSTRACT PROC TABULATE has received a very bad press in the last few years. Most SAS Users have come to look on
THE UNIVERSITY OF BRITISH COLUMBIA FORESTRY 430 and 533. Time: 50 minutes 40 Marks FRST Marks FRST 533 (extra questions)
") THE UNIVERSITY OF BRITISH COLUMBIA FORESTRY 430 and 533 MIDTERM EXAMINATION: October 14, 2005 Instructor: Val LeMay Time: 50 minutes 40 Marks FRST 430 50 Marks FRST 533 (extra questions) This examination
THE UNIVERSITY OF BRITISH COLUMBIA FORESTRY 430 and 533 MIDTERM EXAMINATION: October 14, 2005 Instructor: Val LeMay Time: 50 minutes 40 Marks FRST 430 50 Marks FRST 533 (extra questions) This examination
ssh tap sas913 sas
 Fall 2010, STAT 430 SAS Examples SAS9 ===================== ssh abc@glue.umd.edu tap sas913 sas https://www.statlab.umd.edu/sasdoc/sashtml/onldoc.htm a. Reading external files using INFILE and INPUT (Ch
Base and Advance SAS
 Base and Advance SAS BASE SAS INTRODUCTION An Overview of the SAS System SAS Tasks Output produced by the SAS System SAS Tools (SAS Program - Data step and Proc step) A sample SAS program Exploring SAS
Reading a Column into a Row to Count N-levels, Calculate Cardinality Ratio and Create Frequency and Summary Output In One Step
 Paper RF-04-2015 Reading a Column into a Row to Count N-levels, Calculate Cardinality Ratio and Create Frequency and Summary Output In One Step Ronald J. Fehd, Stakana Analytics Abstract Description :
Chapters 18, 19, 20 Solutions. Page 1 of 14. Demographics from COLLEGE Data Set
 18.2 proc tabulate data=learn.college format=7.; class schoolsize gender scholarship; table schoolsize ALL, gender scholarship ALL; n = ' '; Demographics from COLLEGE Data Set ƒƒƒƒƒƒƒƒƒƒƒƒƒƒƒƒƒƒƒƒƒ ƒƒƒƒƒƒƒƒƒƒƒƒƒƒƒ
STAT 7000: Experimental Statistics I
 STAT 7000: Experimental Statistics I 2. A Short SAS Tutorial Peng Zeng Department of Mathematics and Statistics Auburn University Fall 2009 Peng Zeng (Auburn University) STAT 7000 Lecture Notes Fall 2009
1. Basic Steps for Data Analysis Data Editor. 2.4.To create a new SPSS file
 1 SPSS Guide 2009 Content 1. Basic Steps for Data Analysis. 3 2. Data Editor. 2.4.To create a new SPSS file 3 4 3. Data Analysis/ Frequencies. 5 4. Recoding the variable into classes.. 5 5. Data Analysis/
BUSINESS ANALYTICS. 96 HOURS Practical Learning. DexLab Certified. Training Module. Gurgaon (Head Office)
") SAS (Base & Advanced) Analytics & Predictive Modeling Tableau BI 96 HOURS Practical Learning WEEKDAY & WEEKEND BATCHES CLASSROOM & LIVE ONLINE DexLab Certified BUSINESS ANALYTICS Training Module Gurgaon
SAS (Base & Advanced) Analytics & Predictive Modeling Tableau BI 96 HOURS Practical Learning WEEKDAY & WEEKEND BATCHES CLASSROOM & LIVE ONLINE DexLab Certified BUSINESS ANALYTICS Training Module Gurgaon
CSC 328/428 Summer Session I 2002 Data Analysis for the Experimenter FINAL EXAM
 options pagesize=53 linesize=76 pageno=1 nodate; proc format; value $stcktyp "1"="Growth" "2"="Combined" "3"="Income"; data invstmnt; input stcktyp $ perform; label stkctyp="type of Stock" perform="overall
Ditch the Data Memo: Using Macro Variables and Outer Union Corresponding in PROC SQL to Create Data Set Summary Tables Andrea Shane MDRC, Oakland, CA
 ABSTRACT Ditch the Data Memo: Using Macro Variables and Outer Union Corresponding in PROC SQL to Create Data Set Summary Tables Andrea Shane MDRC, Oakland, CA Data set documentation is essential to good
Contents of SAS Programming Techniques
 Contents of SAS Programming Techniques Chapter 1 About SAS 1.1 Introduction 1.1.1 SAS modules 1.1.2 SAS module classification 1.1.3 SAS features 1.1.4 Three levels of SAS techniques 1.1.5 Chapter goal
STA 570 Spring Lecture 5 Tuesday, Feb 1
 STA 570 Spring 2011 Lecture 5 Tuesday, Feb 1 Descriptive Statistics Summarizing Univariate Data o Standard Deviation, Empirical Rule, IQR o Boxplots Summarizing Bivariate Data o Contingency Tables o Row
Epidemiology Principles of Biostatistics Chapter 3. Introduction to SAS. John Koval
 Epidemiology 9509 Principles of Biostatistics Chapter 3 John Koval Department of Epidemiology and Biostatistics University of Western Ontario What we will do today We will learn to use use SAS to 1. read
Laboratory Topics 1 & 2
 PLS205 Lab 1 January 12, 2012 Laboratory Topics 1 & 2 Welcome, introduction, logistics, and organizational matters Introduction to SAS Writing and running programs; saving results; checking for errors
Please login. Take a seat Login with your HawkID Locate SAS 9.3. Raise your hand if you need assistance. Start / All Programs / SAS / SAS 9.
 Please login Take a seat Login with your HawkID Locate SAS 9.3 Start / All Programs / SAS / SAS 9.3 (64 bit) Raise your hand if you need assistance Introduction to SAS Procedures Sarah Bell Overview Review
PROC MEANS for Disaggregating Statistics in SAS : One Input Data Set and One Output Data Set with Everything You Need
 ABSTRACT Paper PO 133 PROC MEANS for Disaggregating Statistics in SAS : One Input Data Set and One Output Data Set with Everything You Need Imelda C. Go, South Carolina Department of Education, Columbia,
Creating Macro Calls using Proc Freq
 Creating Macro Calls using Proc Freq, Educational Testing Service, Princeton, NJ ABSTRACT Imagine you were asked to get a series of statistics/tables for each country in the world. You have the data, but
EXST3201 Mousefeed01 Page 1
 EXST3201 Mousefeed01 Page 1 3 /* 4 Examine differences among the following 6 treatments 5 N/N85 fed normally before weaning and 85 kcal/wk after 6 N/R40 fed normally before weaning and 40 kcal/wk after
Outline. Topic 16 - Other Remedies. Ridge Regression. Ridge Regression. Ridge Regression. Robust Regression. Regression Trees. Piecewise Linear Model
 Topic 16 - Other Remedies Ridge Regression Robust Regression Regression Trees Outline - Fall 2013 Piecewise Linear Model Bootstrapping Topic 16 2 Ridge Regression Modification of least squares that addresses
Christopher Toppe, Ph.D. Computer Sciences Corporation
 An Introduction to PROC TABULATE: A Hands-On Workshop Christopher Toppe, Ph.D. Computer Sciences Corporation Abstract The Tabulate procedure is, along with PROC REPORT, one of the most powerful and difficult
SAS Online Training: Course contents: Agenda:
 SAS Online Training: Course contents: Agenda: (1) Base SAS (6) Clinical SAS Online Training with Real time Projects (2) Advance SAS (7) Financial SAS Training Real time Projects (3) SQL (8) CV preparation
22S:172. Duplicates. may need to check for either duplicate ID codes or duplicate observations duplicate observations should just be eliminated
 22S:172 1 2 Duplicates Data Cleaning involving duplicate IDs and duplicate records may need to check for either duplicate ID codes or duplicate observations duplicate observations should just be eliminated
Introductory SAS example
 Introductory SAS example STAT:5201 1 Introduction SAS is a command-driven statistical package; you enter statements in SAS s language, submit them to SAS, and get output. A fairly friendly user interface
EXAMPLE 3: MATCHING DATA FROM RESPONDENTS AT 2 OR MORE WAVES (LONG FORMAT)
") EXAMPLE 3: MATCHING DATA FROM RESPONDENTS AT 2 OR MORE WAVES (LONG FORMAT) DESCRIPTION: This example shows how to combine the data on respondents from the first two waves of Understanding Society into
EXAMPLE 3: MATCHING DATA FROM RESPONDENTS AT 2 OR MORE WAVES (LONG FORMAT) DESCRIPTION: This example shows how to combine the data on respondents from the first two waves of Understanding Society into
Analysis of variance and regression. November 13, 2007
 Analysis of variance and regression November 13, 2007 SAS language The SAS environments Reading in, data-step Summary statistics Subsetting data More on reading in, missing values Combination of data sets
Analysis of variance and regression. November 13, 2007
 Analysis of variance and regression November 13, 2007 SAS language The SAS environments Reading in, data-step Summary statistics Subsetting data More on reading in, missing values Combination of data sets
ABSTRACT INTRODUCTION PROBLEM: TOO MUCH INFORMATION? math nrt scr. ID School Grade Gender Ethnicity read nrt scr
 ABSTRACT A strategy for understanding your data: Binary Flags and PROC MEANS Glen Masuda, SRI International, Menlo Park, CA Tejaswini Tiruke, SRI International, Menlo Park, CA Many times projects have
Understanding and Applying Multilabel Formats
 Understanding and Applying Multilabel Formats Presented By: Andrew H. Karp RTSUG Jan. 14, 2004 Sierra Information Services, Inc. 19229 Sonoma Highway #264 Sonoma, California 95476 USA 707 996 7380 SierraInfo
Ten tips for efficient SAS code
 Ten tips for efficient SAS code Host Caroline Scottow Presenter Peter Hobart Managing the webinar In Listen Mode Control bar opened with the white arrow in the orange box Efficiency Overview Optimisation
Bar Charts and Frequency Distributions
 Bar Charts and Frequency Distributions Use to display the distribution of categorical (nominal or ordinal) variables. For the continuous (numeric) variables, see the page Histograms, Descriptive Stats
Seminar Series: CTSI Presents
 Biostatistics, Epidemiology & Research Design (BERD) Howard Cabral, PhD, MPH Christine Chaisson, MPH Seminar Series: CTSI Presents November 20, 2014 Demystifying SAS Macros BUSPH Data Coordinating Center
Introductory Guide to SAS:
 Introductory Guide to SAS: For UVM Statistics Students By Richard Single Contents 1 Introduction and Preliminaries 2 2 Reading in Data: The DATA Step 2 2.1 The DATA Statement............................................
PLS205 Lab 1 January 9, Laboratory Topics 1 & 2
 PLS205 Lab 1 January 9, 2014 Laboratory Topics 1 & 2 Welcome, introduction, logistics, and organizational matters Introduction to SAS Writing and running programs saving results checking for errors Different
SAS 9 Programming Enhancements Marje Fecht, Prowerk Consulting Ltd Mississauga, Ontario, Canada
 SAS 9 Programming Enhancements Marje Fecht, Prowerk Consulting Ltd Mississauga, Ontario, Canada ABSTRACT Performance improvements are the well-publicized enhancement to SAS 9, but what else has changed
Intermediate SAS: Statistics
 Intermediate SAS: Statistics OIT TSS 293-4444 oithelp@mail.wvu.edu oit.wvu.edu/training/classmat/sas/ Table of Contents Procedures... 2 Two-sample t-test:... 2 Paired differences t-test:... 2 Chi Square
Introduction to Stata Toy Program #1 Basic Descriptives
 Introduction to Stata 2018-19 Toy Program #1 Basic Descriptives Summary The goal of this toy program is to get you in and out of a Stata session and, along the way, produce some descriptive statistics.
Stat 302 Statistical Software and Its Applications SAS: Data I/O
 Stat 302 Statistical Software and Its Applications SAS: Data I/O Yen-Chi Chen Department of Statistics, University of Washington Autumn 2016 1 / 33 Getting Data Files Get the following data sets from the
Data Quality Review for Missing Values and Outliers
 Paper number: PH03 Data Quality Review for Missing Values and Outliers Ying Guo, i3, Indianapolis, IN Bradford J. Danner, i3, Lincoln, NE ABSTRACT Before performing any analysis on a dataset, it is often
Paper S Data Presentation 101: An Analyst s Perspective
 Paper S1-12-2013 Data Presentation 101: An Analyst s Perspective Deanna Chyn, University of Michigan, Ann Arbor, MI Anca Tilea, University of Michigan, Ann Arbor, MI ABSTRACT You are done with the tedious
Want to Do a Better Job? - Select Appropriate Statistical Analysis in Healthcare Research
 Want to Do a Better Job? - Select Appropriate Statistical Analysis in Healthcare Research Liping Huang, Center for Home Care Policy and Research, Visiting Nurse Service of New York, NY, NY ABSTRACT The
From An Introduction to SAS University Edition. Full book available for purchase here.
 From An Introduction to SAS University Edition. Full book available for purchase here. Contents List of Programs... xi About This Book... xvii About the Author... xxi Acknowledgments... xxiii Part 1: Getting
Introduction to PROC SQL
 Introduction to PROC SQL Steven First, Systems Seminar Consultants, Madison, WI ABSTRACT PROC SQL is a powerful Base SAS Procedure that combines the functionality of DATA and PROC steps into a single step.
WHERE YOUR MIND REALLY IS
 WHERE YOUR MIND REALLY IS MANY YEARS OF CODING What I ve learned (or still need to ) July 15, 2016 DART-SUG INTRO INTRO INTRO Specifications are flexible A FEW TRUISMS A FEW TRUISMS There are N! ways to
Format-o-matic: Using Formats To Merge Data From Multiple Sources
 SESUG Paper 134-2017 Format-o-matic: Using Formats To Merge Data From Multiple Sources Marcus Maher, Ipsos Public Affairs; Joe Matise, NORC at the University of Chicago ABSTRACT User-defined formats are
SAS Instructions Entering the data and plotting survival curves
 SAS Instructions Entering the data and plotting survival curves Entering the data The first part of most SAS programs consists in creating a dataset. This is done through the DATA statement. You can either
CH5: CORR & SIMPLE LINEAR REFRESSION =======================================
 STAT 430 SAS Examples SAS5 ===================== ssh xyz@glue.umd.edu, tap sas913 (old sas82), sas https://www.statlab.umd.edu/sasdoc/sashtml/onldoc.htm CH5: CORR & SIMPLE LINEAR REFRESSION =======================================
Christopher Louden University of Texas Health Science Center at San Antonio
 Christopher Louden University of Texas Health Science Center at San Antonio Overview of Macro Language Report Writing The REPORT procedure The Output Delivery System (ODS) Macro Examples Utility Macros
Cleaning Duplicate Observations on a Chessboard of Missing Values Mayrita Vitvitska, ClinOps, LLC, San Francisco, CA
 Cleaning Duplicate Observations on a Chessboard of Missing Values Mayrita Vitvitska, ClinOps, LLC, San Francisco, CA ABSTRACT Removing duplicate observations from a data set is not as easy as it might
A Brief Tour of SAS. The SAS Desktop
 A Brief Tour of SAS SAS is one of the most versatile and comprehensive statistical software packages available today, with data management, analysis, and graphical capabilities. It is great at working
Lab 1: Introduction to Data
 1 Lab 1: Introduction to Data Some define Statistics as the field that focuses on turning information into knowledge. The first step in that process is to summarize and describe the raw information the
Correcting for natural time lag bias in non-participants in pre-post intervention evaluation studies
 Correcting for natural time lag bias in non-participants in pre-post intervention evaluation studies Gandhi R Bhattarai PhD, OptumInsight, Rocky Hill, CT ABSTRACT Measuring the change in outcomes between
Introduction to SAS. I. Understanding the basics In this section, we introduce a few basic but very helpful commands.
 Center for Teaching, Research and Learning Research Support Group American University, Washington, D.C. Hurst Hall 203 rsg@american.edu (202) 885-3862 Introduction to SAS Workshop Objective This workshop
Data Management - 50%
 Exam 1: SAS Big Data Preparation, Statistics, and Visual Exploration Data Management - 50% Navigate within the Data Management Studio Interface Register a new QKB Create and connect to a repository Define
Lab 3 (80 pts.) - Assessing the Normality of Data Objectives: Creating and Interpreting Normal Quantile Plots
 - Assessing the Normality of Data Objectives: Creating and Interpreting Normal Quantile Plots") STAT 350 (Spring 2015) Lab 3: SAS Solutions 1 Lab 3 (80 pts.) - Assessing the Normality of Data Objectives: Creating and Interpreting Normal Quantile Plots Note: The data sets are not included in the solutions;
STAT 350 (Spring 2015) Lab 3: SAS Solutions 1 Lab 3 (80 pts.) - Assessing the Normality of Data Objectives: Creating and Interpreting Normal Quantile Plots Note: The data sets are not included in the solutions;
options nofmterr; ods html close; *STOPS WRITING TO THE CURRENT RESULTS VIEWER;
 options nofmterr; ods html close; *STOPS WRITING TO THE CURRENT RESULTS VIEWER; ods html; *OPENS A NEW RESULTS VIEWER; /********************************************************** The directory in the libname
STA9750 Lecture I OUTLINE 1. WELCOME TO 9750!
 STA9750 Lecture I OUTLINE 1. Welcome to STA9750! a. Blackboard b. Tentative syllabus c. Remote access to SAS 2. Introduction to reading data with SAS a. Manual input b. Reading from a text file c. Import
Compute Blocks in Report
 Compute Blocks in Report Compute Blocks Though it is always possible to compute new variables inside a data step, PROC REPORT allows for similar computations to be done internally as well. Computations
SAS CURRICULUM. BASE SAS Introduction
 SAS CURRICULUM BASE SAS Introduction Data Warehousing Concepts What is a Data Warehouse? What is a Data Mart? What is the difference between Relational Databases and the Data in Data Warehouse (OLTP versus
The MEANS/SUMMARY Procedure: Getting Started and Doing More
 The MEANS/SUMMARY Procedure: Getting Started and Doing More Arthur L. Carpenter California Occidental Consultants ABSTRACT The MEANS/SUMMARY procedure is a workhorse for most data analysts. It is used
Topic (3) SUMMARIZING DATA - TABLES AND GRAPHICS
 SUMMARIZING DATA - TABLES AND GRAPHICS") Topic (3) SUMMARIZING DATA - TABLES AND GRAPHICS 3- Topic (3) SUMMARIZING DATA - TABLES AND GRAPHICS A) Frequency Distributions For Samples Defn: A FREQUENCY DISTRIBUTION is a tabular or graphical display
Topic (3) SUMMARIZING DATA - TABLES AND GRAPHICS 3- Topic (3) SUMMARIZING DATA - TABLES AND GRAPHICS A) Frequency Distributions For Samples Defn: A FREQUENCY DISTRIBUTION is a tabular or graphical display
Introduction to Stata - Session 2
 Introduction to Stata - Session 2 Siv-Elisabeth Skjelbred ECON 3150/4150, UiO January 26, 2016 1 / 29 Before we start Download auto.dta, auto.csv from course home page and save to your stata course folder.
Stat 302 Statistical Software and Its Applications SAS: Data I/O & Descriptive Statistics
 Stat 302 Statistical Software and Its Applications SAS: Data I/O & Descriptive Statistics Fritz Scholz Department of Statistics, University of Washington Winter Quarter 2015 February 19, 2015 2 Getting
WEB MATERIAL. eappendix 1: SAS code for simulation
 WEB MATERIAL eappendix 1: SAS code for simulation /* Create datasets with variable # of groups & variable # of individuals in a group */ %MACRO create_simulated_dataset(ngroups=, groupsize=); data simulation_parms;
Going Beyond Proc Tabulate Jim Edgington, LabOne, Inc., Lenexa, KS Carole Lindblade, LabOne, Inc., Lenexa, KS
 Going Beyond Proc Tabulate Jim Edgington, LabOne, Inc., Lenexa, KS Carole Lindblade, LabOne, Inc., Lenexa, KS ABSTRACT PROC Tabulate is one of the most powerful and versatile of the SAS reporting tools.
The Essential Meaning of PROC MEANS: A Beginner's Guide to Summ~rizing Data Using SAS Software
 The Essential Meaning of PROC MEANS: A Beginner's Guide to Summ~rizing Data Using SAS Software Andrew H. Karp Sierra Information Services, Inc. Sonoma, California USA Introduction Learning how to use PROC
I Launching and Exiting Stata. Stata will ask you if you would like to check for updates. Update now or later, your choice.
 I Launching and Exiting Stata 1. Launching Stata Stata can be launched in either of two ways: 1) in the stata program, click on the stata application; or 2) double click on the short cut that you have
Chapter 6: Modifying and Combining Data Sets
 Chapter 6: Modifying and Combining Data Sets The SET statement is a powerful statement in the DATA step. Its main use is to read in a previously created SAS data set which can be modified and saved as