NRF Ellipsometer SOP Revision /19/15 Page 1 of 14. Ellipsometer SOP
|
|
|
- Kerrie Lloyd
- 5 years ago
- Views:
Transcription
1 Page 1 of 14 Ellipsometer SOP The J. A. Woollam M88 is a spectroscopic ellipsometer used to measure film thickness and optical constants of transparent/semi-transparent thin films. It uses a Xenon arc lamp source and measures spectroscopic data over 88 discrete wavelengths from nm. The tool also offers variable angle of incidence and a spot size adjustment aperture (spot size from ~2cm to 5mm). Safety Buddy System the Buddy System is not needed for after-hours usage of this equipment 1.0 Pre-Operation 1.1 Log in to TUMI system Note: For the best accuracy, let the lamp warm up for 30 minutes. Start the lamp prior to your TUMI login so you won t be charged for warmup time. 2.0 Restrictions 2.1 None

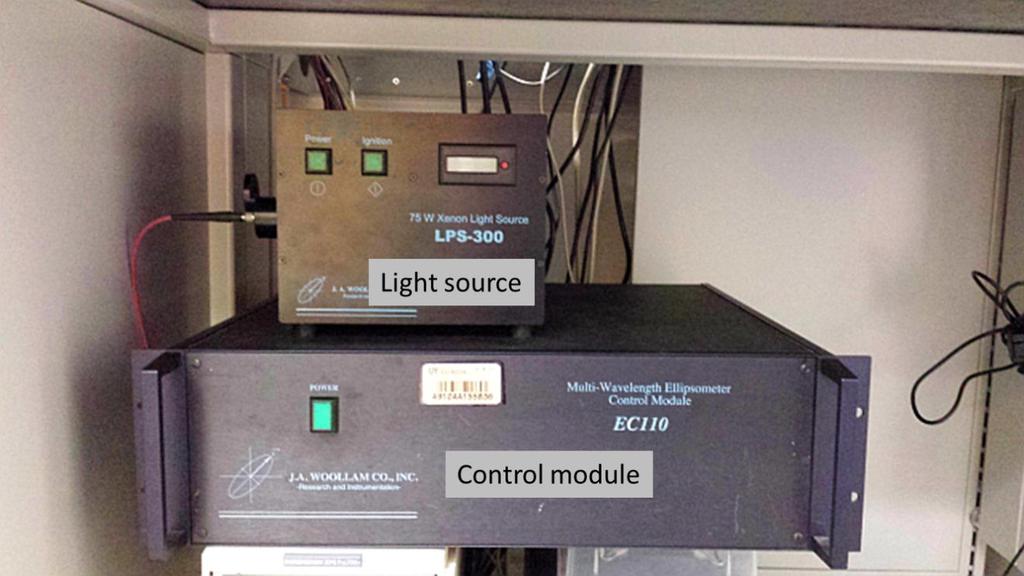
2 Page 2 of 14 Ellipsometer Components


3 Page 3 of 14 Operation 3.0 Startup 3.1 Turn on power to the light source LPS-300 and ignite lamp. Note: For the best accuracy, let the lamp warm up for 30 minutes. Start the lamp prior to your TUMI login so you won t be charged for warmup time. 3.2 Turn on EC110 control module. 3.3 Click the WVASE32 icon to start the software. 3.4 There are six different windows (Model, Hardware, Generated Data, Experimental Data, Fit, and Graph) that can be active and you will need to utilize most of them. The menu bar options will be different depending on which window is active. 3.5 Frist, select the Hardware window and then click on Initialize in the menu bar. 3.6 Enter a user name when prompted. 4.0 Calibration 4.1 Place the silicon calibration wafer on the stage. 4.2 Click on Acquire data Align sample from the menu bar Adjust the stage tilt knobs until the red crosshairs are centered as shown below Press the escape (Esc) button to exit 4.3 Click on Acquire data Calibrate system from the menu bar Select Normal and ensure that the angle of incidence is 75 and click OK.


4 Page 4 of It will ask to verify that the angle micrometer is at 35mm (75 ). Look at the angle adjustment knob (shown in the component overview) to verify The resulting graph shape should be similar to the one below. Contact NRF staff if it fails the calibration. 5.0 Sample Scanning 5.1 When complete, remove the silicon standard and place your sample to be measured on the stage. 5.2 Again, click on Acquire data Align sample from the menu bar Center the red crosshair by using the knobs on the stage as before. Always align a sample when moving or replacing it. Notes: 1) The entire light beam must be within the sample. For small samples, close the iris until the beam is contained within the extents of the sample.


 5.")
5 Page 5 of 14 2) For very thick samples, you may need to adjust the height by using the height control knob so that the beam falls on the surface. 5.3 Click on Acquire data Spectroscopic scan from the menu bar and a new window will appear Most measurements can be taken at a fixed angle of 75, and all of the default settings shown above. Note: For difficult samples and when fitting optical constants, multiple angles may be needed. For multi-angle measurements, set starting angle in first box, final angle in second box and the degree increments in the third box. You will need to adjust the angle micrometer when prompted. Note: Support the polarizer or detector arm when changing angles. Failure to do so can result in damage to the micrometer Ensure all 88 wavelengths are selected and click OK 5.4 The scan is extremely fast and the graph will now be populated with the experimental data (Psi and Delta) 5.5 It may be beneficial to turn off the double axes because the data can get very difficult to analyze as shown in the graph on the left. Single axis (right graph) will make model fitting much easier.
 6.1 Select the Model window 6.")

6 Page 6 of To turn off double axes, select the Graph window. Click on Style 2D and then remove the check mark for double Y-axis 6.0 Modelling And Fitting Thickness (single layer, tabulated model) 6.1 Select the Model window 6.2 You will need to build a model that represents your sample by the layers that are present. Think of it as looking at your sample in cross-section. Build your model by selecting Add layer in the menu bar. The window that opens will contain some commonly used materials. More materials are located in the subfolders and organized by material type. Note: Most material files are tabulated lists of index of refraction/extinction
 and your film may not match a specific material file, or your material may not be in the database.")
. 6.2.1.")
7 Page 7 of 14 coefficient (n&k) vs wavelength. However, n&k can vary with film deposition conditions (or post processing) and your film may not match a specific material file, or your material may not be in the database. In this case, you will need to use a function based model. This will be explained in following section The following assumes you are using tabulated models. Start with the substrate first and select it from the materials in the list (Silicon shown as an example) If the substrate is non-transparent, then the thickness does not matter (although some materials may become transparent near the IR or UV regions consult with staff if unsure). Definitely, if it is transparent in the visible then you will need to know the thickness of your substrate Select Add layer for the next material (SiO2 shown for example). Enter your initial guess for the thickness now and check the Fit box 6.3 Select the Generated Data window. Do not check the n&k boxes! 6.4 Click on Generate data in the menu bar. This will populate the graph
8 Page 8 of 14 with the modeled data and will be shown in red. In the example below, the model (red) does not fit the experimental data (green) very well. This indicates that the thickness guess is off. 6.5 Select the Model window and click on the film layer. Adjust the thickness up/down. 6.6 Select the Generated Data window again, and click on Generate data. Observe if the two data sets begin to converge or not. Repeat until the two sets are closely fit 6.7 Select the Fit window. 6.8 Click on Normal Fit in the menu bar. This will automatically adjust any parameters that you have selected to fit. In this case, it only adjusted thickness. The data should now overlap if the material file constants are close to your film Check that the measurement makes sense and that the MSE is small. 7.0 Modelling And Fitting Thickness And Optical Constants (single, transparent layer, Cauchy model) 7.1 When fitting optical constants, it is highly recommended to take


9 Page 9 of 14 measurements at multiple angles. 7.2 The Cauchy model is the most commonly used approach to determine the thickness and index of transparent materials. It is an inverse power series that contains only even terms and creates the dispersion model for the index of refraction only. 7.3 Select the Model window and load a substrate material, the same as above. 7.4 Again, select Add layer and load the Cauchy.mat file. Specify a value for the A term that roughly matches the expected index value and acts as an offset value. The B and C terms add curvature. Also specify the expected thickness. 7.5 Select the Generated Data window, and click on Generate data. Observe the graph and adjust thickness Generate data until the model and experimental data are close. 7.6 In the Model window, click on the Cauchy layer again. This time, check the fit boxes for thickness, A, and B. 7.7 Select Fit Normal fit and the two curves should converge. 7.8 Observe MSE, then open the Cauchy layer again and check the fit box for the C term and type a small positive number in the box. 7.9 Select Fit Normal fit and see if the MSE changes significantly To observe optical constants, open the Cauchy layer, then click on the optical constants button and you will see something similar to the
10 Page 10 of 14 graph below. Verify normal dispersion! See pages of the manual for interpreting if the index is valid. 8.0 Modelling And Fitting Thickness And Optical Constants (single, partially absorbing layer, Cauchy model) 8.1 When fitting optical constants, it is highly recommended to take measurements at multiple angles. 8.2 For partially absorbing materials, you will need to divide the analysis into two parts Start with the transparent region where the Cauchy model is valid and determine thickness and index Then fix the thickness and fit n & k over then entire range using point by point fitting. 8.3 Select the Model window and load a substrate material, the same as above. 8.4 Again, select Add layer and load the Cauchy.mat file. Specify a value for the A term that roughly matches the expected index value. Also specify the expected thickness. 8.5 Select the Generated Data window, and click on Generate data. Observe the graph and adjust thickness Generate data until the model and experimental data are close. 8.6 In the Model window, click on the Cauchy layer again. This time, check the fit boxes for thickness, A, and B. 8.7 Select Fit Normal fit and the two curves should converge in the transparent region. Shown below is a data of a photoresist at three


11 Page 11 of 14 different angles. The data from the transparent region matches the model, but it does not match in the absorbing region. 8.8 To focus on the transparent region only, select the Experimental Data window, the click on Range Select. Input the wavelength range the corresponds to the transparent region of your film 8.9 Select the Generated Data window, and click on Generate data. The graph will now update with the range that you specified.
 and it should be a much better fit since the model is now only using the data in the transparent region, and is not being influenced")

12 Page 12 of Select Fit Normal fit (with thickness, A, B, maybe C to be fit) and it should be a much better fit since the model is now only using the data in the transparent region, and is not being influenced by absorption We now need to fit n & k over the entire range. Select Experimental Data Range Select. Now click the All Data button Select the Generated Data window, and click on Generate data. The graph will now update with all of the data again In the Model window, click on the Cauchy layer again. Now deselect all of the thickness and Cauchy parameters, and select the n & k boxes Select Fit Pt. by Pt. fit and you will get another window. The only adjustment you need to make is the starting position. You need to start the fitting process where the model overlays the experimental data. In the example, that was at the longest wavelength. Click OK and it will ask again if you want to change the starting conditions, click No.
13 Page 13 of It will now adjust n & k at every wavelength and the fit should be very good, as shown in the example below. Note: A good fit does not mean it is a valid result. This method can result in physically impossible values for n & k if your model is not valid, or is missing something. Verification is difficult and requires the use of a consistency check. See pages for details on using the Kramers- Kronig layer (KK.mat) To view the optical constants, open the Cauchy model layer and click on optical constants. To save the constants, click the copy to clipboard button. Open Notepad and paste, then save as a text file. This can be opened in Excel or other graphing software.
14 Page 14 of Saving And Removing Data 9.1 The experimental data can be saved as just the raw data, or can include the model as well. 9.2 To save just the experimental data, select Experimental Data File Save Exp. File Make a folder in the User Data folder and type a file name to save it. 9.3 To save the entire session (all windows and model info), click on Global located in the upper right corner, and select Save Current Environment Again, make a folder in the User Data folder and type a file name to save it. 9.4 To remove data from the computer, you need to save it to the floppy disk that is provided Remove the disk from the main computer and place it in the floppy drive of the offline computer The data can now be saved to a USB drive. The USB port is located at the bottom of the offline computer. 9.5 If you would only like to save the graph as a picture, simply right click on the graph and select copy to clipboard. You can now open Paint and paste it and save just the picture Shut Down 10.1 Exit the WVASE software 10.2 Turn off the controller module 10.3 Turn off the lamp power supply 10.4 Log off the TUMI
Spectroscopic Ellipsometer --- J. A. Woollam alpha-se
 Spectroscopic Ellipsometer --- J. A. Woollam alpha-se Introduction Figure 1: J. A. Woollam alpha-se spectroscopic ellipsometer An ellipsometer measures the change in polarization as light reflects or transmits
Standard Operating Manual
 Standard Operating Manual J.A. Woolam M-2000V Spectroscopic Ellipsometer Version 1.0 Page 1 of 13 Contents 1. Picture and Location 2. Process Capabilities 2.1 Cleanliness Standard 2.2 Features 2.3 Sample
5.2.2 Pins on the alignment detector are fragile. Use caution when inserting and removing the detector. Report any broken pins to staff.
 Title: Woollam Vase Approved by: Process Engineer / / / / Equipment Engineer 1 SCOPE The purpose of this document is to detail the use of the Woollam VASE. All users are expected to have read and understood
Woollam M2000 Operation Manual
 Woollam M2000 Operation Manual The Woollam M2000 is a spectroscopic ellipsometer used to characterize optically transparent films. The system has the Near IR upgrade that covers 700 wavelengths from 193nm
Operation Manual of J.A. Woollam Ellipsometer
 Operation Manual of J.A. Woollam Ellipsometer 1) Press both the Lamp power and lamp Ignition buttons to turn them on (The buttons are located on the front panel of the bottom control box). 2) Put your
Flexus 2320 SOP Revision 1 01/25/16 Page 1 of 7. Flexus 2320 SOP
 Page 1 of 7 Flexus 2320 SOP The Flexus 2320 determines wafer curvature by measuring the angle of deflection of a laser beam off the surface 6, 4, 3 and 2 diameter substrates. Film stress is determined
2.2. Facilities Requirements
 2.2. Facilities Requirements Facilities requirements for the alpha-se system are listed in Table 2-1 and the system dimensions are given in Figure 2-1. As shown in Figure 2-2, the preferred clear work
Session 1B Transparent Materials
 Session 1B Transparent Materials Andrew Martin UPenn, February 2014 2014 J.A. Woollam Co., Inc. www.jawoollam.com 1 Overview Transparent substrates & films Cauchy equation Common complexities Evaluating,
Standard Operating Procedure FS-1 Film Sense Ellipsometer (spectroscopic)
") Standard Operating Procedure FS-1 Film Sense Ellipsometer (spectroscopic) The Film Sense FS-1 is a spectroscopic ellipsometer dedicated to advanced and rapid characterization of thin film structures for
Standard Operating Procedure FS-1 Film Sense Ellipsometer (spectroscopic) The Film Sense FS-1 is a spectroscopic ellipsometer dedicated to advanced and rapid characterization of thin film structures for
R I T. Title: Rudolf Ellipsometer Auto-EL IV. Semiconductor & Microsystems Fabrication Laboratory Revision: C Rev Date:12/07/17 1 SCOPE
 Title: Rudolf Ellipsometer Auto-EL IV Fabrication Laboratory Revision: C Rev Date:12/07/17 Approved by: Process Engineer / / / / Equipment Engineer 1 SCOPE The purpose of this document is to detail the
FILMETRICS F20 STANDARD OPERATION PROCEDURE
 Arizona State University NanoFab FILMETRICS F20 STANDARD OPERATION PROCEDURE Rev C Table of Contents Contents Table of Contents...1 1. Purpose / Scope...2 2. Reference Documents...2 3. Equipment / Supplies
1A: Introduction to WVASE Data Analysis
 2014 J.A. Woollam Co., Inc. www.jawoollam.com 1 1A: Introduction to WVASE Data Analysis Nina Hong U Penn, February 2014 Session Outline 1. Introduction to Ellipsometry. 2. Classification of Samples. Transparent
Instruction manual for T3DS calculator software. Analyzer for terahertz spectra and imaging data. Release 2.4
 Instruction manual for T3DS calculator software Release 2.4 T3DS calculator v2.4 16/02/2018 www.batop.de1 Table of contents 0. Preliminary remarks...3 1. Analyzing material properties...4 1.1 Loading data...4
NANOSPEC 4150 STANDARD OPERATING PROCEDURES
 NANOSPEC 4150 STANDARD OPERATING PROCEDURES Version: 1.0 JAN 2016 UNIVERSITY OF TEXAS AT ARLINGTON Nanotechnology Research Center TABLE OF CONTENTS 1.0 INTRODUCTION.. 3 2.0 HARDWARE....... 3 3.0 OPERATING
T-Solar Overview. * Patent-pending
 T-Solar T-Solar Overview The T-Solar system combines our best photovoltaic measurement technology into a system designed specifically for measuring textured samples. Based on the established M-2000 rotating
Crystal Quality Analysis Group
 Crystal Quality Analysis Group Contents Contents 1. Overview...1 2. Measurement principles...3 2.1 Considerations related to orientation and diffraction conditions... 3 2.2 Rocking curve measurement...
Panalytical MRD X-Ray Diffraction SOP
 Panalytical MRD X-Ray Diffraction SOP Table of Contents 1.0 Safety 2.0 Training 3.0 Sample Preparation 4.0 Pre-Operation 5.0 Sample Height Adjustment 6.0 Running Programs 7.0 Sample Unloading 8.0 Post-Operation
Experiment 6. Snell s Law. Use Snell s Law to determine the index of refraction of Lucite.
 Experiment 6 Snell s Law 6.1 Objectives Use Snell s Law to determine the index of refraction of Lucite. Observe total internal reflection and calculate the critical angle. Explain the basis of how optical
New software features of the 7010 Particle Size. Analyzer Danielle Chamberlin May May 5, Page 1
 New software features of the 7010 Particle Size May 5, 2009 Analyzer 2.0.0 Danielle Chamberlin May 5 2009 Page 1 Introduction to the new 7010 software Instrument operation New look and feel easy to operate
Standard Operating Procedure for the Horiba FluroMax-4
 Standard Operating Procedure for the Horiba FluroMax-4 Adapted from Horiba Operations Manual Created by Michael Delcau, Modified by Brian Lamp The Fluoromax is capable of making a variety of measurements.
DESIGNER S NOTEBOOK Proximity Detection and Link Budget By Tom Dunn July 2011
 INTELLIGENT OPTO SENSOR Number 38 DESIGNER S NOTEBOOK Proximity Detection and Link Budget By Tom Dunn July 2011 Overview TAOS proximity sensors operate by flashing an infrared (IR) light towards a surface
Reflectivity Calculation Program
 Reflectivity Calculation Program This optional program allows calculation of the reflectivity spectrum at any incidence angle from the wavelength distribution of the sample n and k values. Additionally,
Filmetrics F40 UV Thin Film Measurement System Standard Operating Procedure
 Filmetrics F40 UV Thin Film Measurement System Standard Operating Procedure NYU Tandon School of Engineering Nanofabrication Facility Contents 1 Startup 2 Baseline and reference check 2.1 Baseline setting
Optical Topography Measurement of Patterned Wafers
 Optical Topography Measurement of Patterned Wafers Xavier Colonna de Lega and Peter de Groot Zygo Corporation, Laurel Brook Road, Middlefield CT 6455, USA xcolonna@zygo.com Abstract. We model the measurement
Equipment Standard Operating Procedure Kimberly Appel
 Date Created: June 26, 2004 Date Modified: The Flexus 2320 Equipment Standard Operating Procedure Kimberly Appel 1. Purpose 1.1. The Flexus Thin Film Stress Measuring Apparatus (TFSMA) measures the changes
` EVG 620 MASK ALIGNMENT SYSTEM Bay 1 STANDARD OPERATING PROCEDURE
 ` EVG 620 MASK ALIGNMENT SYSTEM Bay 1 STANDARD OPERATING PROCEDURE Version: 1.0 April-2016 UNIVERSITY OF TEXAS AT ARLINGTON Nanofabrication Research Center (NRC) TABLE OF CONTENTS 1. Introduction...2 1.1
SE800 Short Manual SENTECH Instruments GmbH
 SE800 Spectroscopic Ellipsometry Documentation SE800 Page 2 of 16 Documentation SE800 SE 800 Page 3 of 16 Documentation SE800 Document Information: Authors: Date: File: Version: 2/5/2004 3:24:34 PM SE800_ShortManual.doc
D&S Technical Note 09-2 D&S A Proposed Correction to Reflectance Measurements of Profiled Surfaces. Introduction
 Devices & Services Company 10290 Monroe Drive, Suite 202 - Dallas, Texas 75229 USA - Tel. 214-902-8337 - Fax 214-902-8303 Web: www.devicesandservices.com Email: sales@devicesandservices.com D&S Technical
NRF Filmetrics F40 SOP Revision /02/12 Page 1 of 5. Filmetrics F40 SOP
 Page 1 of 5 Filmetrics F40 SOP The F40 is a reflectometer used to measure the thickness and optical constants of thin, transparent/semi-transparent films. By fitting it to a microscope the tool can have
CompleteEASE Data Analysis Manual
 Version 3.65 CompleteEASE Data Analysis Manual By J. A. Woollam Co., Inc. June 15, 2008 Copyright 2004-2008 J. A. Woollam Co., Inc. All Rights Reserved. J. A. Woollam Co., Inc. 645 M Street, Suite 102
3. Using TFCompanion. 3.1 Filmstack. Introduction Layer types and properties
 3. Using TFCompanion. 3.1 Filmstack. Introduction. Filmstack is an optical model of the sample that is measured - it consists of a substrate, collection of layers and an ambient. There is no limitation
Laboratory 6: Light and the Laser
 Laboratory 6: Light and the Laser WARNING NEVER LOOK DIRECTLY AT LASER LIGHT Index of Refraction: Snell's Law 1. Read the section on physical optics in some introductory physics text. 2. Set the semicircular
University of Minnesota Nano Fabrication Center Standard Operating Procedure
 Equipment Name: Film-Sense Coral Name: film-sense Revision Number: 1 Model: FS-1 Revisionist: T. Whipple Location: Bay 1 Date: 5/16/2017 1 Description The Film Sense FS-1 Multi-Wavelength Ellipsometer
Product Specifications
 Product Specifications The ksa RateRat Pro is a turnkey, real-time, in-situ optical reflectance probe designed for deposition monitoring of semi-absorbent thin films. The RateRat Pro measures deposition
Model FP-6500 Spectrofluorometer Instruction Manual. FP-6500 for Windows
 Model FP-6500 Spectrofluorometer Instruction Manual FP-6500 for Windows P/N: 0302-9999 April 2000 Contents Safety Considerations...i Regulatory Statements... iii Preface... iv Installation Conditions...v
University of Minnesota Nano Fabrication Center Standard Operating Procedure
 Equipment Name: University of Minnesota Nano Fabrication Center Coral Name: hs-scope Revision Number: 1.5 Model: HS200A Revisionist: M. Fisher Location: Bay 1 Date: 9/12/2013 1 Description The Hyphenated
Atomic Force Microscope
 Atomic Force Microscope Preparation Before our first appointment to use the microscope, please watch the video tutorials at https://www.afmworkshop.com/atomic-force-microscope-animated-tutorials/. The
Chapter 36. Image Formation
 Chapter 36 Image Formation Apr 22, 2012 Light from distant things We learn about a distant thing from the light it generates or redirects. The lenses in our eyes create images of objects our brains can
SemiconSoft, Inc. Optical Metrology Company. MProbe: Measurement Guide Thin-films measurement using Reflectance or/and Transmittance spectroscopy
 MProbe: Measurement Guide Thin-films measurement using Reflectance or/and Transmittance spectroscopy It is easy to be a measurement expert with MProbe The Purpose This document describes the measurement
Axometrics, Inc. 103 Quality Circle, Suite 215 Huntsville, AL Phone: (256) Fax: (256)
 Fax: (256)") Axometrics, Inc. 103 Quality Circle, Suite 215 Huntsville, AL 35806 Phone: (256) 704-3332 Fax: (256) 704-6002 E-Mail: info@axometrics.com Website: http://www.axometrics.com EllipsoView TM USER S MANUAL
Axometrics, Inc. 103 Quality Circle, Suite 215 Huntsville, AL 35806 Phone: (256) 704-3332 Fax: (256) 704-6002 E-Mail: info@axometrics.com Website: http://www.axometrics.com EllipsoView TM USER S MANUAL
Physics 214 Midterm Fall 2003 Form A
 1. A ray of light is incident at the center of the flat circular surface of a hemispherical glass object as shown in the figure. The refracted ray A. emerges from the glass bent at an angle θ 2 with respect
MICHELSON S INTERFEROMETER
 MICHELSON S INTERFEROMETER Objectives: 1. Alignment of Michelson s Interferometer using He-Ne laser to observe concentric circular fringes 2. Measurement of the wavelength of He-Ne Laser and Na lamp using
Operating Procedure PerkinElmer LAMBDA 750
 Operating Procedure PerkinElmer LAMBDA 750 1. Before switching ON the UV/VIS system, first switch on the AC (Air Conditioner) unit. 2. Switch ON the power supply for the system 3. Switch ON the lamp of
Operating Procedure for Horiba Raman Microscope
 Operating Procedure for Horiba Raman Microscope SAFETY Be aware of Laser radiation at all times! Do not remove the covers of the instrument. Components are supplied with 110V electric source. Do not touch
Spectrophotometric Methods of Refractive Indices Measurement
 Application Note Glass, ceramics, optics Spectrophotometric Methods of Refractive Indices Measurement Measuring the refractive index of single crystal optical materials using two methods Authors N.S. Kozlova
Perkin-Elmer Lambda 3B Spectrophotometer
 Written by Mark Csele Written by Jeff Brown Operation Turn on the Lambda 3B and the Computer Remove all samples from the sample chamber. Turn on the lamp for the range being investigated using the switches
2/26/2016. Chapter 23 Ray Optics. Chapter 23 Preview. Chapter 23 Preview
 Chapter 23 Ray Optics Chapter Goal: To understand and apply the ray model of light. Slide 23-2 Chapter 23 Preview Slide 23-3 Chapter 23 Preview Slide 23-4 1 Chapter 23 Preview Slide 23-5 Chapter 23 Preview
Instruction Manual of Modelling of Trap Detectors Using Matlab
 Aalto University School of Electrical Engineering Metrology Research Institute Mikko Puranen Tuomas Poikonen Timo Dönsberg Petri Kärhä Instruction Manual of Modelling of Trap Detectors Using Matlab Version
Specification of Thin Film Thickness Measuring Equipment
 of Thin Film Thickness Measuring Equipment A. Application: Major application is for solar cell thin film thickness measurement for films such as CIGS, CdS, ITO, ZnO etc. deposited on substrates such as
Figure 1 - Refraction
 Geometrical optics Introduction Refraction When light crosses the interface between two media having different refractive indices (e.g. between water and air) a light ray will appear to change its direction
LIGHT SCATTERING THEORY
 LIGHT SCATTERING THEORY Laser Diffraction (Static Light Scattering) When a Light beam Strikes a Particle Some of the light is: Diffracted Reflected Refracted Absorbed and Reradiated Reflected Refracted
Panalytical XPert Powder X-Ray Diffraction SOP
 Revision 1 2/06/2018 Panalytical XPert Powder SOP Page 1 of 11 Panalytical XPert Powder X-Ray Diffraction SOP NOTE: Latest revisions are in Blue. Table of Contents 1.0 Safety 2.0 Training 3.0 Sample Preparation
Jasco FP-6500 Spectrofluorimeter Updated November 14, 2017
 Jasco FP-6500 Spectrofluorimeter Updated November 14, 2017 Instrument instructions can be found at: http://academic.bowdoin.edu/chemistry/resources/instructions.shtml If you have any problems with the
Polarizers. Laser Polarizers Broadband Polarizing Beamsplitting Cubes 78 Narrowband Polarizing Beamsplitting Cubes 79
 Prisms Introduction to Right Angle Prisms 72 Quality Right Angle Prisms 73 Laboratory Quality Right Angle Prisms 73 Equilateral Prisms 74 Wedge Prisms 75 Anamorphic Prism Pair 75 Penta Prisms 76 Dove Prisms
Agilent Cary Universal Measurement Spectrophotometer (UMS)
") Agilent Cary Universal Measurement Spectrophotometer (UMS) See what you ve been missing Date: 13 th May 2013 TRAVIS BURT UV-VIS-NIR PRODUCT MANAGER AGILENT TECHNOLOGIES 1 Agenda Introducing the Cary 7000
Agilent Cary Universal Measurement Spectrophotometer (UMS) See what you ve been missing Date: 13 th May 2013 TRAVIS BURT UV-VIS-NIR PRODUCT MANAGER AGILENT TECHNOLOGIES 1 Agenda Introducing the Cary 7000
StickFont Editor v1.01 User Manual. Copyright 2012 NCPlot Software LLC
 StickFont Editor v1.01 User Manual Copyright 2012 NCPlot Software LLC StickFont Editor Manual Table of Contents Welcome... 1 Registering StickFont Editor... 3 Getting Started... 5 Getting Started...
WDM Phasar User s Guide
 WDM Phasar User s Guide Phased Array WDM Device Design Software Version 2.0 for Windows WDM_Phasar User s Guide Phased Array WDM Device Design Software Copyright Opti wave Systems Inc. All rights reserved.
Contents. - i - Ver.:2
 Contents 1 Accessories of D-Point 2... 2 2 Connecting Projector to PC... 4 3 Pen Action... 4 4 Driver Installation... 5 5 Configuration Setting... 8 6 D-Point 2 Pull-up Menu... 12 7 DT02 Multi-touch Interactive
Oxford DSiE Revision /25/17 Page 1 of 9. Oxford DSiE SOP
 Page 1 of 9 Oxford DSiE SOP The PlasmaPro 100 is a Inductively coupled plasma device (ICP) configured to provide effective high aspect ratio etching of 4 inch silicon wafers, and pieces when a carrier
ElliCalc Manual Version
 ElliCalc Manual Version 3.5.23 8.2.2011 CONTENTS CONTENTS... 1 1 Introduction... 3 1.1 Measurement setup... 4 1.2 Measurement signal... 4 1.3 Physical principle... 5 2 Installation... 6 3 Product support...
Engineered Diffusers Intensity vs Irradiance
 Engineered Diffusers Intensity vs Irradiance Engineered Diffusers are specified by their divergence angle and intensity profile. The divergence angle usually is given as the width of the intensity distribution
Chapter 26 Geometrical Optics
 Chapter 26 Geometrical Optics 1 Overview of Chapter 26 The Reflection of Light Forming Images with a Plane Mirror Spherical Mirrors Ray Tracing and the Mirror Equation The Refraction of Light Ray Tracing
Physics 210 Medical Physics Midterm Exam Fall 2012 October 12, 2012
 Physics 210 Medical Physics Midterm Exam Fall 2012 October 12, 2012 Name Problem 1 /32 Problem 2 /32 Problem 3 /24 Total /88 I affirm that I have carried out my academic endeavors with full academic honesty.
Characterization of stratified media using high-resolution thin film measurement techniques
 Characterization of stratified media using high-resolution thin film measurement techniques Alberto Aguerri Sensofar-Tech, S.L. Crt. N150 Km14.5 IPCT Mòdul TR-20, 08227 Terrassa (Barcelona), Spain E-mail:
PHYSICS 116 POLARIZATION AND LIGHT MEASUREMENTS
 Name Date Lab Time Lab TA PHYSICS 116 POLARIZATION AND LIGHT MEASUREMENTS I. POLARIZATION Natural unpolarized light is made up of waves vibrating in all directions. When a beam of unpolarized light is
Monte Carlo simulation for adaptive optics
 Monte Carlo simulation for adaptive optics R. Valicu 1, P. Böni 1,3, J. Stahn 2, U. Filges 2, T. Panzner 2, Y. Bodenthin 2, M. Schneider 2,3, C.Schanzer 3 1 Physik-Department E21, James-Franck-Strasse,
JEOL CarryScope SEM Revision /07/17 Page 1 of 7. JEOL CarryScope SEM
 Page 1 of 7 JEOL CarryScope SEM The JEOL CarryScope is a compact and portable SEM that utilizes a standard tungsten filament. It is to be used for inspecting and measuring samples processed in the NRF
QUANTAX EDS SYSTEM SOP
 QUANTAX EDS SYSTEM SOP December 2017 Energy-Dispersive X-Ray Spectroscopy (EDS, EDX, EDXS or XEDS), is an analytical technique used for the elemental analysis or chemical characterization of a sample.
Chemistry Instrumental Analysis Lecture 6. Chem 4631
 Chemistry 4631 Instrumental Analysis Lecture 6 UV to IR Components of Optical Basic components of spectroscopic instruments: stable source of radiant energy transparent container to hold sample device
Aaron C. Kratzer Tate Research Group Department of Physics, Oregon State University. 11 th June, Abstract
 Measurement and Modeling of Zinc Sulfide Thin Films using Ellipsometry and Reflection Spectroscopy: A Comparison of Optical Characterization Techniques Aaron C. Kratzer Tate Research Group Department of
EBL (Elionix EBeam Lithography System) CAD Procedure
 CAD Procedure") EBL (Elionix EBeam Lithography System) CAD Procedure Authors: Nigel Carroll & Akshara Verma Date: 12 April 2016 Version: 1.0 To create a pattern within a single field 1. Open CAD software 2. Click on Settting
EBL (Elionix EBeam Lithography System) CAD Procedure Authors: Nigel Carroll & Akshara Verma Date: 12 April 2016 Version: 1.0 To create a pattern within a single field 1. Open CAD software 2. Click on Settting
ACCURATE TEXTURE MEASUREMENTS ON THIN FILMS USING A POWDER X-RAY DIFFRACTOMETER
 ACCURATE TEXTURE MEASUREMENTS ON THIN FILMS USING A POWDER X-RAY DIFFRACTOMETER MARK D. VAUDIN NIST, Gaithersburg, MD, USA. Abstract A fast and accurate method that uses a conventional powder x-ray diffractometer
Hitachi U-2001 UV/Vis Spectrometer Updated November 14, 2017
 Hitachi U-2001 UV/Vis Spectrometer Updated November 14, 2017 Instrument instructions can be found at: http://academic.bowdoin.edu/chemistry/resources/instructions.shtml If you have any problems with the
Cary Fiber Optic Probes
 Cary Fiber Optic Probes Fiber Optic Probes Use With Cary 50/60 Wavelength range 200-1100 nm Cary 100/300 Cary 50/60/100/300 Cary 4000/5000/6000i Fiber optic dip probe stainless steel body only Requires
index of refraction-light speed
 AP Physics Study Guide Chapters 22, 23, 24 Reflection, Refraction and Interference Name Write each of the equations specified below, include units for all quantities. Law of Reflection Lens-Mirror Equation
Heidelberg Pattern Generator SOP
 Heidelberg Pattern Generator SOP Page 1 of 15 Heidelberg Pattern Generator SOP 1. Scope 1.1 This document provides the operating procedures for the Heidelberg Pattern Generator with Version 3.12.5 software.
When light strikes an object there are different ways it can be affected. Light can be
 When light strikes an object there are different ways it can be affected. Light can be transmitted, reflected, refracted, and absorbed, It depends on the type of matter that it strikes. For example light
Physics 101, Lab 1: LINEAR KINEMATICS PREDICTION SHEET
 Physics 101, Lab 1: LINEAR KINEMATICS PREDICTION SHEET After reading through the Introduction, Purpose and Principles sections of the lab manual (and skimming through the procedures), answer the following
Chapter 24. Wave Optics. Wave Optics. The wave nature of light is needed to explain various phenomena
 Chapter 24 Wave Optics Wave Optics The wave nature of light is needed to explain various phenomena Interference Diffraction Polarization The particle nature of light was the basis for ray (geometric) optics
ABM's High Resolution Mask Aligner Features:
 ABM's High Resolution Mask Aligner is a very versatile instrument with interchangeable light sources which allow Near-UV (405-365 nm) as well as Mid- and Deep-UV (254 nm, 220 nm) exposures in proximity
Optics: Laser Light Show Student Advanced Version
 Optics: Laser Light Show Student Advanced Version In this lab, you will explore the behavior of light. You will observe reflection and refraction of a laser beam in jello, and use a diffraction pattern
Activity P34: Polarization - Verify Malus Law (Light Sensor)
") Activity P34: Polarization - Verify Malus Law (Light Sensor) Concept DataStudio ScienceWorkshop (Mac) ScienceWorkshop (Win) Polarization P34 Malus Law.DS (See end of activity) (See end of activity) Equipment
Activity P34: Polarization - Verify Malus Law (Light Sensor) Concept DataStudio ScienceWorkshop (Mac) ScienceWorkshop (Win) Polarization P34 Malus Law.DS (See end of activity) (See end of activity) Equipment
Visible-frequency dielectric metasurfaces for multi-wavelength achromatic and highly-dispersive holograms
 Supporting Materials Visible-frequency dielectric metasurfaces for multi-wavelength achromatic and highly-dispersive holograms Bo Wang,, Fengliang Dong,, Qi-Tong Li, Dong Yang, Chengwei Sun, Jianjun Chen,,
Phys 1020, Day 18: Questions? Cameras, Blmfld Reminders: Next Up: digital cameras finish Optics Note Final Project proposals next week!
 Lights. Action. Phys 1020, Day 18: Questions? Cameras, Blmfld 15.1 Reminders: Next Up: digital cameras finish Optics Note Final Project proposals next week! 1 What have we learned in this section: 1) Lasers
Physics 5B PRACTICE FINAL EXAM B Winter 2009
 Physics 5B PRACTICE FINAL EXAM B Winter 2009 INSTRUCTIONS: This is a closed book exam. You may consult four (two-sided) 8 1/2" 11" sheets of paper of personal notes. However, you may not collaborate and/or
Mu lt i s p e c t r a l
 Viewing Angle Analyser Revolutionary system for full spectral and polarization measurement in the entire viewing angle EZContrastMS80 & EZContrastMS88 ADVANCED LIGHT ANALYSIS by Field iris Fourier plane
Mirror Example Consider a concave mirror radius -10 cm then = = Now consider a 1 cm candle s = 15 cm from the vertex Where is the image.
 Mirror Example Consider a concave mirror radius -10 cm then r 10 f = = = 5 cm 2 2 Now consider a 1 cm candle s = 15 cm from the vertex Where is the image 1 s 2 1 = = r s 1 1 2 + = = s s r 1 1 = 0.13333
OCEAN OPTICS Chem 2000 Spectrophotometer
 OCEAN OPTICS Chem 2000 Spectrophotometer prepared for: Department of Chemistry and Biochemistry New Mexico State University Las Cruces, NM 88003 last updated May 2003 R.. Cowley TABLE OF CONTENTS I. Introduction...2
Pre-Lab Quiz / PHYS 224 Dispersion and Prism
 Pre-Lab Quiz / PHYS 224 Dispersion and Prism Name Lab Section 1. What do we investigate in this lab? 2. Describe Snell s Law and draw a diagram. 3. As shown in Figure 4, the specific angle of the prism
Zahner 12/2011. Light Spectra Display and Analysis
 Zahner 12/2011 Light Spectra Display and Analysis Light Spectra Analysis -2-1. Introduction 3 2. Light Spectra Analysis Graphic Software 4 2.1. Startup...4 2.2. Export Functions...6 2.2.1. Export ASCII
Grazing Angle 2 Theta Phase Analysis
 Page 1 of 7 Grazing Angle 2 Theta Phase Analysis 1. Log into the User Log System on the SMIF web site Hardware Setup X-Ray Tube The line focus configuration of the x-ray tube is used. This is the default
Southern African Large Telescope. PFIS Distortion and Alignment Model
 Southern African Large Telescope PFIS Distortion and Alignment Model Kenneth Nordsieck University of Wisconsin Document Number: SALT-3120AS0023 Revision 2.0 31 May 2006 Change History Rev Date Description
LEXT 3D Measuring LASER Microscope
 LEXT 3D Measuring LASER Microscope Warning: This instrument may only be operated by those who have been trained by AAF staff and have read and signed the AAF laboratory policies. A) STARTUP 1. Computer
Precise & Affordable
 Water Analysis Instruments Thermo Scientific Orion AquaMate and AQUAfast Product Brochure Reliable water analysis Precise & Affordable A complete line of Spectrophotometers, Colorimeters and Turbidity
Physics 1202: Lecture 18 Today s Agenda
 Physics 1202: Lecture 18 Today s Agenda Announcements: Team problems today Team 10: Alisha Kumar, Adam Saxton, Alanna Forsberg Team 11: Riley Burns, Deanne Edwards, Shauna Bolton Team 12: Kervell Baird,
Experiment 8 Wave Optics
 Physics 263 Experiment 8 Wave Optics In this laboratory, we will perform two experiments on wave optics. 1 Double Slit Interference In two-slit interference, light falls on an opaque screen with two closely
Collect and Reduce Intensity Data -- APEX
 Collect and Reduce Intensity Data -- APEX General Steps in Collecting Intensity Data Note that the steps outlined below are generally followed when using all modern automated diffractometers, regardless
Dispersion (23.5) Neil Alberding (SFU Physics) Physics 121: Optics, Electricity & Magnetism Spring / 17
 Neil Alberding (SFU Physics) Physics 121: Optics, Electricity & Magnetism Spring / 17") Neil Alberding (SFU Physics) Physics 121: Optics, Electricity & Magnetism Spring 2010 1 / 17 Dispersion (23.5) The speed of light in a material depends on its wavelength White light is a mixture of wavelengths
Neil Alberding (SFU Physics) Physics 121: Optics, Electricity & Magnetism Spring 2010 1 / 17 Dispersion (23.5) The speed of light in a material depends on its wavelength White light is a mixture of wavelengths
Nanoparticle Optics: Light Scattering Size Determination of Polystryene Nanospheres by Light Scattering and Mie Theory
 Nanoparticle Optics: Light Scattering Size Determination of Polystryene Nanospheres by Light Scattering and Mie Theory OUTLINE OF THE PROCEDURE A) Observe Rayleigh scattering from silica nanoparticles.
Lecture 16 (Total Internal Reflection and Dispersion) Physics Spring 2018 Douglas Fields
 Physics Spring 2018 Douglas Fields") Lecture 16 (Total Internal Reflection and Dispersion) Physics 262-01 Spring 2018 Douglas Fields Reading Quiz In order to have total internal reflection, the index of refraction of the material with the
Lecture 16 (Total Internal Reflection and Dispersion) Physics 262-01 Spring 2018 Douglas Fields Reading Quiz In order to have total internal reflection, the index of refraction of the material with the