Contents. Group 2 Excel Handouts 2010
|
|
|
- Jacob Heath
- 5 years ago
- Views:
Transcription
1 Contents Styles... 2 Conditional Formatting... 2 Create a New Rule... 4 Format as Table... 5 Create your own New Table Style... 8 Cell Styles... 9 New Cell Style Merge Styles Sparklines Insert Sparklines Sparkline Tools Contextual Menu Options


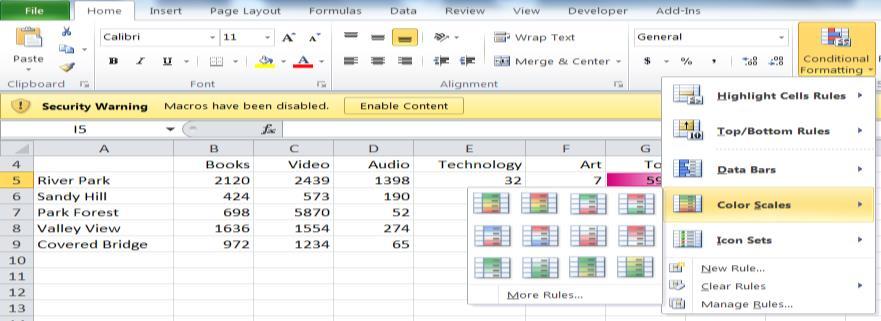
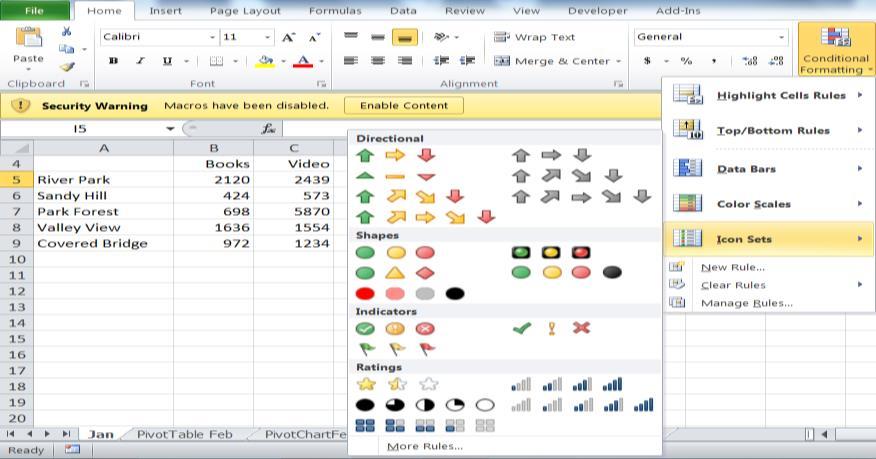
2 Styles Conditional Formatting Cells must be selected(highlighted) to perform tasks 1. Point to Highlighted Cells Rules 2. Select cells to be analyzed 3. Click on the Conditional Formatting menu arrow in the Styles group on the Home tab 4. Choose Greater Than option 5. Type 2000 in dialog box 6. Choose Light Red with Dark Red Text option from menu 7. Click OK 8. Click away from selected cells to see all the highlighted cells 2


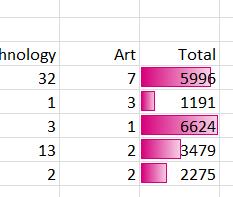
3 Click on the Pink Gradient Fill Option 3


4 Create a New Rule Clear Rules options allow you to clear rules from Selected Cells, Entire Sheet, This Table and This PivotTable Conditional Formatting Rules Manager: Show formatting rules for a rule in the drop down list Create a New Rule, Edit Rule, Delete Rule, Move Rules Up & Down In the List of rules for This Worksheet you will see the Rule applied, Format, Applies to cell designations and Stop if True check box When editing is finished click on Apply to save then Ok to close Click on Close if you don t make changes or the red x in upper right corner 4


5 Format as Table 1. Select the Table 2. Click on the Format as Table menu in the Styles group on the Home tab 3. Click on a prefered style 4. In the Format As Table dialog box click in the box to My table has headers a. If you do not have headers selected do not click in this box 5. Click OK 6. Style will be added with New column headers to Sort your data 5


6 1. Click on Sort Menu arrow in the Total Column 2. Point to Sort by Color 3. Click on the Custom Sort 6


7 1. Selected level can be deleted by clicking on the Delete Level button 2. When you add a level the Move Up and Down arrows are activated 3. Delete added levels 4. Options button box 5. Click OK in the Sort Dialog box Table Before Sorting Selected Table Table After Sorting-all data is sorted whether the whole table is selected or specially selected cells. To remove the sort.filter menus, select the cells, right click on a selected cell, click on Table option, click on Convert to Range option. 7


8 Create your own New Table Style 1. Name your Table Style 2. Choose Table Element to design 3. Click on the Format Button 1. Choose options from the Font, Border and Fill styles 2. You can see your style develop in the Preview box in the Format Cells dialog box (and in the New table Quick Style box) 3. Click ok to save 4. If you want to keep this as a default style for this document click in the box in front of Set as default table quick style for this document 5. Click OK to save 8


9 Cell Styles 1. Select cell(s) 2. Click on Cell Styles menu arrow in the Styles group on the Home tab 3. Point to a style to change the selected cell(s) a. You can hover over styles to view style the on the worksheet if your table is visible 4. Click on your preferred style 9


10 New Cell Style Click on New Cell Style at the bottom of the Cell Styles menu 1. Choose options by removing or adding check marks 2. Type new Style Name in text box 3. Click Format button to open the Format Cells dialog box 4. Choose options from any or all of the tabs at the top of the Format Cells dialog box 5. Click on OK to save and close the Format cells dialog box 6. Click on OK in the Style box to Save Merge Custom Cell Styles If you have other workbooks open you can Merge the cells styles to your current workbook. 1. Click on Merge Styles at bottom of Cell Styles menu 2. You must have the workbook open to see it listed and to copy its cell styles into current workbook. 3. Click on the workbook you want to merge styles 4. Click OK 10

 the Create Sparklines dialog bo")
11 Sparklines Sparklines are mini charts inserted into a single cell for quick viewing of data analysis. Step 2 Step 1 Insert Sparklines 1. Click in the cell you want the Sparkline. a. It will automatically insert the cell reference in the Location Range box. b. If you don t do this first you can select the cell in the Create Sparklines dialog box. c. Click in the Choose where you want the Sparklines to be placed box and select the cell. 2. In the Sparklines group on the Insert Tab, click on the style of Sparkline you want: a. Line b. Column c. Win/Loss 3. Create Sparklines dialog box will open. Step 3 Maximize/Minimize Buttons 4. Select the cell group you want displayed in the Sparkline chart. a. As you drag across the cells (in columns or rows) the Create Sparklines dialog box will minimize. b. When you release the mouse it will open all the way. c. You can minimize the dialog box by clicking on the maximize/minimize button to the right of the data range box. d. You can hold the Ctrl key and select non-contiguous cells for your sparkline. 5. Click OK to see the Sparkline in the selected cell. 11


12 6. You can click the bottom right corner of the first Sparkline cell and drag to fill the remaining sparklines same as copying a formula. You will need to see the + cursor to fill in the sparkline formula. Step 4 a Step 4 Step 5 Step 6 Sparkline Tools Contextual Menu Options 7. When you change figures in the cells containing numbers and enter, the sparkline will automatically update. 8. You can change the type of sparkline, show various aspects, change the color theme and high point color, clear sparklines and choose axis options. 12
Starting Excel application
 MICROSOFT EXCEL 1 2 Microsoft Excel: is a special office program used to apply mathematical operations according to reading a cell automatically, just click on it. It is called electronic tables Starting
Excel Main Screen. Fundamental Concepts. General Keyboard Shortcuts Open a workbook Create New Save Preview and Print Close a Workbook
 Excel 2016 Main Screen Fundamental Concepts General Keyboard Shortcuts Open a workbook Create New Save Preview and Print Close a Ctrl + O Ctrl + N Ctrl + S Ctrl + P Ctrl + W Help Run Spell Check Calculate
Microsoft Excel Chapter 1. Creating a Worksheet and a Chart
 Microsoft Excel 2013 Chapter 1 Creating a Worksheet and a Chart Objectives Describe the Excel worksheet Enter text and numbers Use the Sum button to sum a range of cells Enter a simple function Copy the
Using Tables, Sparklines and Conditional Formatting. Module 5. Adobe Captivate Wednesday, May 11, 2016
 Slide 1 - Using Tables, Sparklines and Conditional Formatting Using Tables, Sparklines and Conditional Formatting Module 5 Page 1 of 27 Slide 2 - Lesson Objectives Lesson Objectives Explore the find and
Candy is Dandy Project (Project #12)
") Candy is Dandy Project (Project #12) You have been hired to conduct some market research about M&M's. First, you had your team purchase 4 large bags and the results are given for the contents of those
Candy is Dandy Project (Project #12) You have been hired to conduct some market research about M&M's. First, you had your team purchase 4 large bags and the results are given for the contents of those
4. In the Change Chart Type dialog box, click the type of chart to which you want to change. 5. Click the chart style. 6. Click OK.
 PROCEDURES LESSON 21: BUILDING BASIC CHARTS Creating a Chart 1 Select the range of data you want to chart 2 Click the INSERT tab Charts Group 3 Click the desired chart category button 4 In the gallery,
ADD A 3-D PIE CHART TO THE WORKBOOK
 ADD A 3-D PIE CHART TO THE WORKBOOK A pie chart is an easy way to show the relationship of items to the whole. In this exercise, you will be creating a Pie Chart that will show the relationship between
Chapter 4. Microsoft Excel
 Chapter 4 Microsoft Excel Topic Introduction Spreadsheet Basic Screen Layout Modifying a Worksheet Formatting Cells Formulas and Functions Sorting and Filling Borders and Shading Charts Introduction A
Introduction to Microsoft Excel 2010 Quick Reference Sheet
 Spreadsheet What is a spreadsheet? How is Excel 2010 different from previous versions? A grid of rows and columns that help to organize, summarize and calculate data. Microsoft Excel 2010 is built on the
Microsoft Excel Chapter 1. Creating a Worksheet and an Embedded Chart
 Microsoft Excel 2010 Chapter 1 Creating a Worksheet and an Embedded Chart Objectives Describe the Excel worksheet Enter text and numbers Use the Sum button to sum a range of cells Copy the contents of
MICROSOFT EXCEL BIS 202. Lesson 1. Prepared By: Amna Alshurooqi Hajar Alshurooqi
 MICROSOFT EXCEL Prepared By: Amna Alshurooqi Hajar Alshurooqi Lesson 1 BIS 202 1. INTRODUCTION Microsoft Excel is a spreadsheet application used to perform financial calculations, statistical analysis,
Microsoft Excel 2010
 Microsoft Excel 2010 omar 2013-2014 First Semester 1. Exploring and Setting Up Your Excel Environment Microsoft Excel 2010 2013-2014 The Ribbon contains multiple tabs, each with several groups of commands.
Excel 2013 Intermediate
 Instructor s Excel 2013 Tutorial 2 - Charts Excel 2013 Intermediate 103-124 Unit 2 - Charts Quick Links Chart Concepts Page EX197 EX199 EX200 Selecting Source Data Pages EX198 EX234 EX237 Creating a Chart
Open Excel by following the directions listed below: Click on Start, select Programs, and the click on Microsoft Excel.
 Candy is Dandy Grading Rubric You have been hired to conduct some market research about M&M's. First, you had your team purchase 4 large bags and the results are given for the contents of those bags. You
This book is about using Microsoft Excel to
 Introducing Data Analysis with Excel This book is about using Microsoft Excel to analyze your data. Microsoft Excel is an electronic worksheet you can use to perform mathematical, financial, and statistical
Microsoft Excel Chapter 2. Formulas, Functions, and Formatting
 Microsoft Excel 2010 Chapter 2 Formulas, Functions, and Formatting Objectives Enter formulas using the keyboard Enter formulas using Point mode Apply the AVERAGE, MAX, and MIN functions Verify a formula
Scientific Graphing in Excel 2013
 Scientific Graphing in Excel 2013 When you start Excel, you will see the screen below. Various parts of the display are labelled in red, with arrows, to define the terms used in the remainder of this overview.
Mission Statement The Monroe County Library System enriches the equality of life for all residents of the
 Mission Statement The Monroe County Library System enriches the equality of life for all residents of the county by providing free access to informational, education and recreational resources. Contents
Introduction to Excel 2013
 Introduction to Excel 2013 Copyright 2014, Software Application Training, West Chester University. A member of the Pennsylvania State Systems of Higher Education. No portion of this document may be reproduced
PivotTables & Charts for Health
 PivotTables & Charts for Health Data Inputs PivotTables Pivot Charts Global Strategic Information UCSF Global Health Sciences Version Malaria 1.0 1 Table of Contents 1.1. Introduction... 3 1.1.1. Software
SPREADSHEET (Excel 2007)
") SPREADSHEET (Excel 2007) 1 U N I T 0 4 BY I F T I K H A R H U S S A I N B A B U R Spreadsheet Microsoft Office Excel 2007 (or Excel) is a computer program used to enter, analyze, and present quantitative
SPREADSHEET (Excel 2007) 1 U N I T 0 4 BY I F T I K H A R H U S S A I N B A B U R Spreadsheet Microsoft Office Excel 2007 (or Excel) is a computer program used to enter, analyze, and present quantitative
Excel 2013 Charts and Graphs
 Excel 2013 Charts and Graphs Copyright 2016 Faculty and Staff Training, West Chester University. A member of the Pennsylvania State System of Higher Education. No portion of this document may be reproduced
ACCT 133 Excel Schmidt Excel 2007 to 2010 Conversion
 ACCT 133 Excel Schmidt Excel 2007 to 2010 Conversion Note: Use this handout in connection with the handout on the parts of the Excel 2010 worksheet. This will allow you to look at the various portions
Creating Automated Dashboard Excel 2013 Contents
 Creating Automated Dashboard Excel 2013 Contents Summarize Data Using Pivot Table... 2 Constructing Report Summary... 2 Create a PivotTable from worksheet data... 2 Add fields to a PivotTable... 2 Grouping
Preview from Notesale.co.uk Page 2 of 61
 Modify a table Applying styles to tables; banding rows and columns; inserting total rows; removing styles from tables Filter and sort a table Filtering records; sorting data on multiple columns; changing
Microsoft Office Excel 2007: Basic. Course Overview. Course Length: 1 Day. Course Overview
 Microsoft Office Excel 2007: Basic Course Length: 1 Day Course Overview This course teaches the basic functions and features of Excel 2007. After an introduction to spreadsheet terminology and Excel's
Formatting Values. 1. Click the cell(s) with the value(s) to format.
 with the value(s) to format.") Formatting Values Applying number formatting changes how values are displayed it doesn t change the actual information. Excel is often smart enough to apply some number formatting automatically. For example,
Formatting Values Applying number formatting changes how values are displayed it doesn t change the actual information. Excel is often smart enough to apply some number formatting automatically. For example,
Basics of Spreadsheet
 106 :: Data Entry Operations 6 Basics of Spreadsheet 6.1 INTRODUCTION A spreadsheet is a large sheet having data and information arranged in rows and columns. As you know, Excel is one of the most widely
Microsoft How to Series
 Microsoft How to Series Getting Started with EXCEL 2007 A B C D E F Tabs Introduction to the Excel 2007 Interface The Excel 2007 Interface is comprised of several elements, with four main parts: Office
Excel Contents. MS Excel /3/2011 JSD#2-Neptune Page 1
 Excel 2013 Contents Contents... 1 Opening Start Screen... 2 Formatting cells... 2 Modifying information in a cell... 2 Autofil... 3 Merge and Center Headings and Merge Cells... 3 Auto Calculation... 3
Changing Worksheet Views
 PROCEDURES LESSON 1: TOURING EXCEL Starting Excel 1 Click the Start button 2 Click All Programs 3 Click the Microsoft Office folder icon 4 Click Microsoft Excel 2010 Naming and Saving (Ctrl+S) a Workbook
Excel Tables and Pivot Tables
 A) Why use a table in the first place a. Easy to filter and sort if you only sort or filter by one item b. Automatically fills formulas down c. Can easily add a totals row d. Easy formatting with preformatted
SUM, AVERAGE, MEDIAN, MIN,
 Lab 3 Activity Name Demonstration Notes Objective 12: Use the SUM, AVERAGE, MEDIAN, MIN, and MAX Functions 5.25 Using the SUM and AVERAGE Functions 5.26 Using the MEDIAN Function Start Excel. Open goaio_1e_08c_script_data.xlsx.
Status Bar: Right click on the Status Bar to add or remove features.
 Excel 2013 Quick Start Guide The Excel Window File Tab: Click to access actions like Print, Save As, etc. Also to set Excel options. Ribbon: Logically organizes actions onto Tabs, Groups, and Buttons to
Gloucester County Library System. Excel 2010
 Gloucester County Library System Excel 2010 Introduction What is Excel? Microsoft Excel is an electronic spreadsheet program. It is capable of performing many different types of calculations and can organize
Introduction. Inserting and Modifying Tables. Word 2010 Working with Tables. To Insert a Blank Table: Page 1
 Word 2010 Working with Tables Introduction Page 1 A table is a grid of cells arranged in rows and columns. Tables can be customized and are useful for various tasks such as presenting text information
Excel Select a template category in the Office.com Templates section. 5. Click the Download button.
 Microsoft QUICK Excel 2010 Source Getting Started The Excel Window u v w z Creating a New Blank Workbook 2. Select New in the left pane. 3. Select the Blank workbook template in the Available Templates
The HOME Tab: Cut Copy Vertical Alignments
 The HOME Tab: Cut Copy Vertical Alignments Text Direction Wrap Text Paste Format Painter Borders Cell Color Text Color Horizontal Alignments Merge and Center Highlighting a cell, a column, a row, or the
Formatting Spreadsheets in Microsoft Excel
 Formatting Spreadsheets in Microsoft Excel This document provides information regarding the formatting options available in Microsoft Excel 2010. Overview of Excel Microsoft Excel 2010 is a powerful tool
EXCEL 2010 PROCEDURES
 EXCEL 2010 PROCEDURES Starting Excel 1 Click the Start 2 Click All Programs 3 Click the Microsoft Office folder icon 4 Click Microsoft Excel 2010 Naming and Saving (Ctrl+S) a Workbook 1 Click File 2 Click
2. This is a cell; this cell is designated as A1.
 Queen s Learning Commons: Microsoft Excel Basics 1. These are the columns. 2. This is a cell; this cell is designated as A1. 3. Let s make a table. Click on the box you want to put text in and simply begin
USING MICROSOFT EXCEL 2016 Guided Project 4-3
 Guided Project 4-3 Clemenson Imaging analyzes expense reports from field representatives as well as patient and image data. To complete the worksheets, you format data as a table and build an advanced
Microsoft Excel Microsoft Excel
 Excel 101 Microsoft Excel is a spreadsheet program that can be used to organize data, perform calculations, and create charts and graphs. Spreadsheets or graphs created with Microsoft Excel can be imported
Microsoft Excel: More Tips, Tricks & Techniques. Excel 2010 & Excel Cutting Edge Chapter of IAAP
 Microsoft Excel: More Tips, Tricks & Techniques Excel 2010 & Excel 2007 Cutting Edge Chapter of IAAP Dawn Bjork Buzbee, MCT The Software Pro Microsoft Certified Trainer Bonus Resources Follow-up Q&A, additional
Day : Date : Objects : Open MS Excel program * Open Excel application. Select : start. Choose: programs. Choose : Microsoft Office.
 Day : Date : Objects : Open MS Excel program * Open Excel application. Select : start Choose: programs Choose : Microsoft Office Select: Excel *The interface of Excel program - Menu bar. - Standard bar.
Presenter: Susan Campbell Wild Rose School Division
 Presenter: Susan Campbell Wild Rose School Division What is Excel? An electronic spreadsheet program and a powerful tool for analyzing and presenting information: Spreadsheet Used for entering and analyzing
Microsoft Excel 2007 Creating a XY Scatter Chart
 Microsoft Excel 2007 Creating a XY Scatter Chart Introduction This document will walk you through the process of creating a XY Scatter Chart using Microsoft Excel 2007 and using the available Excel features
1. Position your mouse over the column line in the column heading so that the white cross becomes a double arrow.
 Excel 2010 Modifying Columns, Rows, and Cells Introduction Page 1 When you open a new, blank workbook, the cells are set to a default size.you do have the ability to modify cells, and to insert and delete
Troubleshooting in Microsoft Excel 2002
 Page 1 of 8 Troubleshooting in Microsoft Excel 2002 Result: To understand how to work with the Excel software to enter data, navigate the page, and print materials. Tabs Look at the tabs at the bottom
Explore commands on the ribbon Each ribbon tab has groups, and each group has a set of related commands.
 Quick Start Guide Microsoft Excel 2013 looks different from previous versions, so we created this guide to help you minimize the learning curve. Add commands to the Quick Access Toolbar Keep favorite commands
2013 INTERMEDIATE MANUAL
 C B C H O U S E 2 4 C A N N I N G S T R E E T E D I N B U R G H E H 3 8 E G 0 1 3 1 2 7 2 2 7 9 0 W W W. I T R A I N S C O T L A N D. C O. U K I N F O @ I T R A I N S C O T L A N D. C O. U K CONTENTS CHAPTER
Training for ICDL Spreadsheets Spreadsheets 261
 261 Module Goals 1 Introduction 2 What is a Spreadsheet? 2 Section 1 Using the Application 3 1.1. Working with 3 1.2. Enhancing Productivity 11 Section 2 Cells 15 2.1. Inserting and Selecting Data 15 2.2.
PART ONE 1. LAYOUT. A file in Excel is called a Workbook. Each Workbook is made up of Worksheets (usually three but more can be added).
.") PART ONE 1. LAYOUT A file in Excel is called a Workbook. Each Workbook is made up of Worksheets (usually three but more can be added). The work area is where the data and formulae are entered. The active
PART ONE 1. LAYOUT A file in Excel is called a Workbook. Each Workbook is made up of Worksheets (usually three but more can be added). The work area is where the data and formulae are entered. The active
Microsoft Excel 2010 Basic
 Microsoft Excel 2010 Basic Introduction to MS Excel 2010 Microsoft Excel 2010 is a spreadsheet software in the new Microsoft 2010 Office Suite. Excel allows you to store, manipulate and analyze data in
Lesson 1: Creating a Worksheet and a Chart Microsoft Excel 2016 IN THIS CHAPTER, YOU WILL LEARN HOW TO
 Lesson 1: Creating a Worksheet and a Chart Microsoft Excel 2016 IN THIS CHAPTER, YOU WILL LEARN HOW TO Describe the Excel worksheet Enter text and numbers Use the Sum button to sum a range of cells Enter
Creating a Worksheet and an Embedded Chart in Excel 2007
 Objectives: Start and quit Excel Describe the Excel worksheet Enter text and numbers Use the Sum button to sum a range of cells Copy the contents of a cell to a range of cells using the fill handle Save
Excel Boot Camp PIONEER TRAINING, INC.
 Excel Boot Camp Dates and Times: Cost: $250 1/22, 2-4 PM 1/29, 2-4 PM 2/5, 2-4 PM 2/12, 2-4 PM Please register online or call our office. (413) 387-1040 This consists of four-part class is aimed at students
Beginning Excel. Revised 4/19/16
 Beginning Excel Objectives: The Learner will: Become familiar with terminology used in Microsoft Excel Create a simple workbook Write a simple formula Formatting Cells Adding Columns Borders Table of Contents:
Quick Reference Summary
 Microsoft Excel 2010 Quick Reference Summary Microsoft Excel 2010 Quick Reference Summary 3-D Chart, Rotate EX 462 3-D Rotation button (Chart Tools Layout tab Background, change rotation (Format Chart
Excel 2010 Charts - Intermediate Excel 2010 Series The University of Akron. Table of Contents COURSE OVERVIEW... 2
 Table of Contents COURSE OVERVIEW... 2 DISCUSSION... 2 COURSE OBJECTIVES... 2 COURSE TOPICS... 2 LESSON 1: MODIFY CHART ELEMENTS... 3 DISCUSSION... 3 FORMAT A CHART ELEMENT... 4 WORK WITH DATA SERIES...
Microsoft Excel Chapter 3. What-If Analysis, Charting, and Working with Large Worksheets
 Microsoft Excel 2010 Chapter 3 What-If Analysis, Charting, and Working with Large Worksheets Objectives Rotate text in a cell Create a series of month names Copy, paste, insert, and delete cells Format
MICROSOFT EXCEL Working with Charts
 MICROSOFT EXCEL 2010 Working with Charts Introduction to charts WORKING WITH CHARTS Charts basically represent your data graphically. The data here refers to numbers. In Excel, you have various types of
WEEK NO. 12 MICROSOFT EXCEL 2007
 WEEK NO. 12 MICROSOFT EXCEL 2007 LESSONS OVERVIEW: GOODBYE CALCULATORS, HELLO SPREADSHEET! 1. The Excel Environment 2. Starting A Workbook 3. Modifying Columns, Rows, & Cells 4. Working with Worksheets
course notes quick reference guide
 course notes quick reference guide Microsoft Excel 2010 Welcome to Excel 2010 Excel 2010 is the premier spreadsheet application from Microsoft. Excel 2010 makes it easier to analyze data quickly with new
EXCEL 2007 TIP SHEET. Dialog Box Launcher these allow you to access additional features associated with a specific Group of buttons within a Ribbon.
 EXCEL 2007 TIP SHEET GLOSSARY AutoSum a function in Excel that adds the contents of a specified range of Cells; the AutoSum button appears on the Home ribbon as a. Dialog Box Launcher these allow you to
Exploring Microsoft Office Excel 2007
 Exploring Microsoft Office Excel 2007 Chapter 1: Introduction to Excel What Can I Do with a Spreadsheet Objectives Define worksheets and workbooks Use spreadsheets across disciplines Plan for good workbook
Excel: Introduction. Microsoft Office 2007.XLSX
 Excel: Introduction Microsoft Office 2007.XLSX 1 TEMPLATES Click on the OFFICE button NEW A list of templates appear (pre-created workbooks that can be reused and include formulas and formatting ) 2 KEYBOARD
Customizing the Excel 2013 program window. Getting started with Excel 2013
 Customizing the Excel 2013 program window 1 2 Getting started with Excel 2013 Working with data and Excel tables Creating workbooks Modifying workbooks Modifying worksheets Merging and unmerging cells
Scientific Graphing in Excel 2007
 Scientific Graphing in Excel 2007 When you start Excel, you will see the screen below. Various parts of the display are labelled in red, with arrows, to define the terms used in the remainder of this overview.
Creating a Spreadsheet by Using Excel
 The Excel window...40 Viewing worksheets...41 Entering data...41 Change the cell data format...42 Select cells...42 Move or copy cells...43 Delete or clear cells...43 Enter a series...44 Find or replace
Microsoft Excel 2013: Excel Basics June 2014
 Microsoft Excel 2013: Excel Basics June 2014 Description Excel is a powerful spreadsheet program. Please note that in this class we will use Excel 2010 or 2013. Learn how to create spreadsheets, enter
Microsoft Office Excel 2010: Basic. Course Overview. Course Length: 1 Day. Course Overview
 Microsoft Office Excel 2010: Basic Course Length: 1 Day Course Overview This course teaches the basic functions and features of Excel 2010. After an introduction to spreadsheet terminology and Excel's
2013 FOUNDATION MANUAL
 2013 FOUNDATION MANUAL C B C H O U S E 2 4 C A N N I N G S T R E E T E D I N B U R G H E H 3 8 E G 0 1 3 1 2 7 2 2 7 9 0 W W W. I T R A I N S C O T L A N D. C O. U K I N F O @ I T R A I N S C O T L A N
Changing Worksheet Views
 PROCEDURES LESSON 1: TOURING EXCEL Starting Excel From the Windows Start screen, click the Excel 2013 program tile 1 Right-click a blank area of the Windows Start screen 2 Click the All Apps button 3 Click
Introduction to Microsoft Excel 2010
 Introduction to Microsoft Excel 2010 This class is designed to cover the following basics: What you can do with Excel Excel Ribbon Moving and selecting cells Formatting cells Adding Worksheets, Rows and
Ms excel. The Microsoft Office Button. The Quick Access Toolbar
 Ms excel MS Excel is electronic spreadsheet software. In This software we can do any type of Calculation & inserting any table, data and making chart and graphs etc. the File of excel is called workbook.
Excel Tables & PivotTables
 Excel Tables & PivotTables A PivotTable is a tool that is used to summarize and reorganize data from an Excel spreadsheet. PivotTables are very useful where there is a lot of data that to analyze. PivotTables
Introduction to Charts
 Microsoft Excel 2013: Part 6 Introduction to Charts, Naming Cells, Create Drop-down lists, Track Changes, & Finalizing Your Workbook Introduction to Charts Charts allow you to illustrate your workbook
Excel: Creating Charts and Graphs
 Excel: Creating Charts and Graphs Charts for Excel 2013 1 Charts for Excel 2013 2 Background Information This short workshop is designed to provide an overview for creating and formatting charts and sparklines
Introduction to Excel 2013 Part 2
 Introduction to Excel 2013 Part 2 Open a file Select File from the Menu bar, select Open from the drop down menu, navigate to the place where the file was stored, double-left click on the file name. Modify
Tutorial 5: Working with Excel Tables, PivotTables, and PivotCharts. Microsoft Excel 2013 Enhanced
 Tutorial 5: Working with Excel Tables, PivotTables, and PivotCharts Microsoft Excel 2013 Enhanced Objectives Explore a structured range of data Freeze rows and columns Plan and create an Excel table Rename
Excel 2007 New Features Table of Contents
 Table of Contents Excel 2007 New Interface... 1 Quick Access Toolbar... 1 Minimizing the Ribbon... 1 The Office Button... 2 Format as Table Filters and Sorting... 2 Table Tools... 4 Filtering Data... 4
Microsoft Excel Chapter 3. Working with Large Worksheets, Charting, and What-If Analysis
 Microsoft Excel 2013 Chapter 3 Working with Large Worksheets, Charting, and What-If Analysis Objectives Rotate text in a cell Create a series of month names Copy, paste, insert, and delete cells Format
Excel 2013 Intermediate
 Excel 2013 Intermediate Quick Access Toolbar... 1 Customizing Excel... 2 Keyboard Shortcuts... 2 Navigating the Spreadsheet... 2 Status Bar... 3 Worksheets... 3 Group Column/Row Adjusments... 4 Hiding
Contents. Group 3 Excel Handouts 2010
 Contents Function Library... 2 Function Operators... 2 Order of Multiple Operators... 2 Function Library... 3 Formula Auditing... 4 Name Cells... 7 Comments... 8 Show Ink... 9 Show Ink is a colorful way
Excel. More Skills 11 Insert and Edit Comments. To complete this workbook, you will need the following file: You will save your workbook as: CHAPTER 2
 CHAPTER 2 Excel More Skills 11 Insert and Edit Comments A comment is a note that is attached to a cell, separate from other cell content. Comments can describe how a complex formula works or provide feedback
EXCEL ADVANCED Linda Muchow
 EXCEL ADVANCED 2016 Alexandria Technical and Community College Customized Training Technology Specialist 1601 Jefferson Street, Alexandria, MN 56308 320-762-4539 Linda Muchow lindac@alextech.edu 1 Table
Week 5 Creating a Calendar. About Tables. Making a Calendar From a Table Template. Week 5 Word 2010
 Week 5 Creating a Calendar About Tables Tables are a good way to organize information. They can consist of only a few cells, or many cells that cover several pages. You can arrange boxes or cells vertically
Contents. Introduction 15. How to use this course 18. Session One: Basic Skills 21. Session Two: Doing Useful Work with Excel 65
 Contents Introduction 15 Downloading the sample files... 15 Problem resolution... 15 The Excel version and locale that were used to write this book... 15 Typographical Conventions Used in This Book...
Basic tasks in Excel 2013
 Basic tasks in Excel 2013 Excel is an incredibly powerful tool for getting meaning out of vast amounts of data. But it also works really well for simple calculations and tracking almost any kind of information.
EXCEL 2007 GETTING STARTED
 EXCEL 2007 GETTING STARTED TODAY S DESTINATION Quick Access Toolbar Customize it! Office Button Click Excel Options BREAK DOWN OF TABS & RIBBON Tab Name Contains Information relating to Contains the following
Microsoft Excel 2010 Tutorial
 1 Microsoft Excel 2010 Tutorial Excel is a spreadsheet program in the Microsoft Office system. You can use Excel to create and format workbooks (a collection of spreadsheets) in order to analyze data and
Excel Basics. TJ McKeon
 Excel Basics TJ McKeon What is Excel? Electronic Spreadsheet in a rows and columns layout Can contain alphabetical and numerical data (text, dates, times, numbers) Allows for easy calculations and mathematical
Gloucester County Library System EXCEL 2007
 Gloucester County Library System EXCEL 2007 Introduction What is Excel? Microsoft E x c e l is an electronic s preadsheet program. I t is capable o f performing many diff e r e n t t y p e s o f c a l
TABLE OF CONTENTS. i Excel 2016 Basic
 i TABLE OF CONTENTS TABLE OF CONTENTS I PREFACE VII 1 INTRODUCING EXCEL 1 1.1 Starting Excel 1 Starting Excel using the Start button in Windows 1 1.2 Screen components 2 Tooltips 3 Title bar 4 Window buttons
Quick Reference Guide 8 Excel 2013 for Windows Keyboard Shortcut Keys
 Quick Reference Guide 8 Excel 2013 for Windows Keyboard Shortcut Keys Control Shortcut s Ctrl + PgDn Ctrl + PgUp Ctrl + Shift + & Ctrl + Shift_ Ctrl + Shift + ~ Ctrl + Shift + $ Ctrl + Shift + % Ctrl +
Introduction to Microsoft Excel
 Create it Introduction to Microsoft Excel It's the beginning of the year (or you just got your new computer) and you want to create an electronic grade book to keep track of student achievement and do
How to use Excel Spreadsheets for Graphing
 How to use Excel Spreadsheets for Graphing 1. Click on the Excel Program on the Desktop 2. You will notice that a screen similar to the above screen comes up. A spreadsheet is divided into Columns (A,
Excel Advanced
 Excel 2016 - Advanced LINDA MUCHOW Alexandria Technical & Community College 320-762-4539 lindac@alextech.edu Table of Contents Macros... 2 Adding the Developer Tab in Excel 2016... 2 Excel Macro Recorder...
Microsoft Excel Chapter 3. Working with Large Worksheets, Charting, and What-If Analysis
 Microsoft Excel 2013 Chapter 3 Working with Large Worksheets, Charting, and What-If Analysis Objectives Rotate text in a cell Create a series of month names Copy, paste, insert, and delete cells Format