Scottish Improvement Skills
|
|
|
- Noah Fowler
- 5 years ago
- Views:
Transcription

 and one for the vertical axis (your measure), and give each column")

1 Scottish Improvement Skills Creating a run chart on MS Excel 2007 Create and save a new Excel worksheet. Some of the details of steps given below may vary slightly depending on how Excel has been used on your computer previously, but the general sequence and things to look out for will be the same. Section 1: Creating a run chart with a median based on all data First you need to enter all your data and create your median. Step 1 Enter your data on the worksheet in two columns, one for the horizontal axis (usually time) and one for the vertical axis (your measure), and give each column a heading. In this example, the measure is weight, and data is collected once a week. You would normally label the weeks with a specific date; here they are numbered in sequence from the beginning of data collection. Remember to include two or three more items in the time column, so this continues into the future, for which no data has been collected yet. In the next column write the heading Median.


2 Step 2 Click on the cell below Median Type = Click on the drop down functions menu to the left. Select: More Functions Step 3 Scroll down the list of functions Select: MEDIAN Click: OK


3 Step 4 In the Function Arguments dialogue box, find the Number 1 field. Type in the cell reference for the first data item, then colon, then the cell reference for the last data item. Click: OK Step 5 In the median column, in the next cell down, type = Click on the cell above. Enter.


4 Step 6 Click on the same cell as in Step 5 Hover over the bottom right corner of the cell until you have a + sign Drag this down to the bottom of your last data item. Now you have all the data you need, and can start to create your chart. a b c Step 7 Select all the data in the measure and median columns, including the empty cells for your future dates. a. Select the Insert tab to bring up the chart options. b. Select the Line button on the Insert toolbar. c. Select the line with markers button.

5 Step 8 You now have the basic chart. Now you need to make the chart more informative and easy to interpret. On the Design toolbar, select the first chart layout. Step 9 Select Series 1 so that a box appears around both Series 1 and Series 2. Then select Delete.

6 Step 10 Select Chart title and type in the title of your chart. Step 11 Select Axis title and type in your measure. c b a d Step 12 a. Select the Layout tab to bring up layout options. b. Select the Axis titles button on the Layout toolbar. c. Select Primary Horizontal Axis Title. d. Select Title Below Axis. e. When axis title appears below the chart, select it and type in the time intervals or other appropriate label.


7 Step 13 Right click on the median line to bring up a dialogue box. Select Format data series. Step 14 Select: Marker options. Select: None. Select: Close.


8 Step 15 Right click on the measure line to bring up a dialogue box. Select Format data series. Step 16 Select: Line Color. Select: Solid line Change Color to Black.


9 Step 17 Select: Marker Fill Select: Solid fill Change Color to Black. Step 18 Select: Marker Line Color Select: No line. Select: Close.
10 Step 19 Click on horizontal gridlines so that circles appear at each end. Select Delete. Step 20 If you add annotations within the chart they will be included when you copy and paste the chart to another document. Select one data point. Right click. Select Add Data Label. This brings up the data value.
 Step 22 Click anywhere on the spreadsheet outside the chart. Your run chart is now ready to use.")
11 (b) Step 21 (a) Double click the data value to edit and write in your annotation. Select the label and drag it to a suitable location. (b) Use Insert/Shapes to add arrows. These will not be copied with the rest of the chart. (a) Step 22 Click anywhere on the spreadsheet outside the chart. Your run chart is now ready to use. Right click anywhere on the chart to do further formatting e.g. plot area or data series. Right click near the edge of the chart to copy it, and paste into a Word document or PowerPoint slide.


12 Section 2: Creating a run chart with a baseline and extended median Follow the same steps as above, with these differences. Step 4: Baseline median Decide which data points you want to include in your baseline median. In the Function Arguments dialogue box, find the Number 1 field. Type in the cell reference for the first data item, then colon, then the cell reference for the last data item that was part of your baseline. In this example, baseline data was collected for the first 10 weeks, so look for the data next to Week 10. Click: OK Baseline period Step 5: As above Step 6 Drag the + down only as far as the final baseline data point.


13 Step 4: Extended median In the next column, start with the last data point in the baseline data period. Use the same cell references as for the baseline median. Step 5: As above Step 6 Drag the + down to the final data point. Step 7 Select all three columns of data for your chart, including empty cells for future dates.
14 Step 8 and beyond Your median line is in two parts, with different colours, so you can format them differently. Keep the baseline median solid, and make the extended median dotted. Compare the run chart below with the final run chart at Step 22 above. Here, applying standard run chart rules provides you with useful information sooner.


15 Section 3: Phasing - creating a new median From the run chart with extended median above, we can see that a shift could be identified from Week 17. This shift includes the data points at weeks 11, 12, 14, 15, 16, and 17. So at that point, you may decide to create a new median starting from Week 11. Median 1 Steps 1 6 As for baseline median above. Drag the bottom corner of the cell only to the bottom of the final data item before the shift began. Median 2 Steps 2, 3, and 4 Start the new median in the Median 2 column, the cell below the final baseline data point. In the Function Arguments box, type in the cell references starting with the data point where the shift began.

16 Median 2 Step 5: As above Step 6 Drag the bottom corner of the cell to the bottom of your last data item. Then continue with the rest of the steps to complete the run chart. The second median helps to highlight that over this period Vanessa has achieved a change in weight from 150lb to 145lb. However, in this example there are not yet enough data points to apply the run chart rules to the second phase.


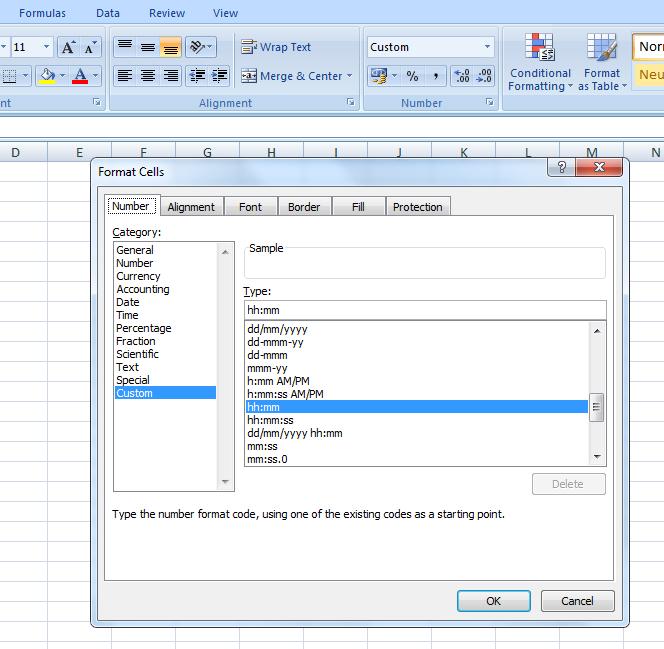
17 Section 4: Labelling the horizontal axis with dates For many measures, you will need to label the horizontal axis with dates or times. Start by entering the data in your spreadsheet, using the dates you want on your horizontal axis. Then create your median data, as above. At Step 7 above, include the dates column in your selection. If Excel doesn t seem to want to accept the date format that you enter, you may need to revise the format to create a pattern that Excel will recognise. On the Formatting tool bar, select Number, then choose the category and type that you need.
18
Technology Assignment: Scatter Plots
 The goal of this assignment is to create a scatter plot of a set of data. You could do this with any two columns of data, but for demonstration purposes we ll work with the data in the table below. You
Introduction to Microsoft Excel
 Chapter A spreadsheet is a computer program that turns the computer into a very powerful calculator. Headings and comments can be entered along with detailed formulas. The spreadsheet screen is divided
Open a new Excel workbook and look for the Standard Toolbar.
 This activity shows how to use a spreadsheet to draw line graphs. Open a new Excel workbook and look for the Standard Toolbar. If it is not there, left click on View then Toolbars, then Standard to make
4) Study the section of a worksheet in the image below. What is the cell address of the cell containing the word "Qtr3"?
 Study the section of a worksheet in the image below. What is the cell address of the cell containing the word Qtr3?") Choose The Correct Answer: 1) Study the highlighted cells in the image below and identify which of the following represents the correct cell address for these cells: a) The cell reference for the selected
Choose The Correct Answer: 1) Study the highlighted cells in the image below and identify which of the following represents the correct cell address for these cells: a) The cell reference for the selected
Launch old style dialogue boxes from the dialogue box launchers at the bottom of the ribbon.
 Ribbon Overview Ribbon Overview Launch old style dialogue boxes from the dialogue box launchers at the bottom of the ribbon. Add buttons to Quick Access Toolbar either by right clicking or via the Customise
Microsoft Excel 2007 Lesson 7: Charts and Comments
 Microsoft Excel 2007 Lesson 7: Charts and Comments Open Example.xlsx if it is not already open. Click on the Example 3 tab to see the worksheet for this lesson. This is essentially the same worksheet that
Excel 2013 Part 2. 2) Creating Different Charts
 Creating Different Charts") Excel 2013 Part 2 1) Create a Chart (review) Open Budget.xlsx from Documents folder. Then highlight the range from C5 to L8. Click on the Insert Tab on the Ribbon. From the Charts click on the dialogue
Excel 2013 Part 2 1) Create a Chart (review) Open Budget.xlsx from Documents folder. Then highlight the range from C5 to L8. Click on the Insert Tab on the Ribbon. From the Charts click on the dialogue
Dealing with Data in Excel 2013/2016
 Dealing with Data in Excel 2013/2016 Excel provides the ability to do computations and graphing of data. Here we provide the basics and some advanced capabilities available in Excel that are useful for
Graphing Single Subject Research Data. AAC Colloquium October 18 th, 2017
 Graphing Single Subject Research Data AAC Colloquium October 18 th, 2017 Set up the spreadsheet Input the data Graph Harry s data Click and hold, then drag to select Harry s data Just for the top graph
Statistics with a Hemacytometer
 Statistics with a Hemacytometer Overview This exercise incorporates several different statistical analyses. Data gathered from cell counts with a hemacytometer is used to explore frequency distributions
Charting 1. There are several ways to access the charting function There are three autolayouts which include a chart.
 Charting 1 PowerPoint has an internal charting function. It can create charts from data in most of the common chart types. The biggest advantage is that the data is stored internally in the PowerPoint
Using Charts in a Presentation 6
 Using Charts in a Presentation 6 LESSON SKILL MATRIX Skill Exam Objective Objective Number Building Charts Create a chart. Import a chart. Modifying the Chart Type and Data Change the Chart Type. 3.2.3
PivotTables & Charts for Health
 PivotTables & Charts for Health Data Inputs PivotTables Pivot Charts Global Strategic Information UCSF Global Health Sciences Version Malaria 1.0 1 Table of Contents 1.1. Introduction... 3 1.1.1. Software
Separate Text Across Cells The Convert Text to Columns Wizard can help you to divide the text into columns separated with specific symbols.
 Chapter 7 Highlights 7.1 The Use of Formulas and Functions 7.2 Creating Charts 7.3 Using Chart Toolbar 7.4 Changing Source Data of a Chart Separate Text Across Cells The Convert Text to Columns Wizard
Models for Nurses: Quadratic Model ( ) Linear Model Dx ( ) x Models for Doctors:
 Linear Model Dx ( ) x Models for Doctors:") The goal of this technology assignment is to graph several formulas in Excel. This assignment assumes that you using Excel 2007. The formula you will graph is a rational function formed from two polynomials,
The goal of this technology assignment is to graph several formulas in Excel. This assignment assumes that you using Excel 2007. The formula you will graph is a rational function formed from two polynomials,
Tricking it Out: Tricks to personalize and customize your graphs.
 Tricking it Out: Tricks to personalize and customize your graphs. Graphing templates may be used online without downloading them onto your own computer. However, if you would like to use the templates
COMPUTER TECHNOLOGY SPREADSHEETS BASIC TERMINOLOGY. A workbook is the file Excel creates to store your data.
 SPREADSHEETS BASIC TERMINOLOGY A Spreadsheet is a grid of rows and columns containing numbers, text, and formulas. A workbook is the file Excel creates to store your data. A worksheet is an individual
BioFuel Graphing instructions using Microsoft Excel 2003 (Microsoft Excel 2007 instructions start on page mei-7)
") BioFuel Graphing instructions using Microsoft Excel 2003 (Microsoft Excel 2007 instructions start on page mei-7) Graph as a XY Scatter Chart, add titles for chart and axes, remove gridlines. A. Select
BioFuel Graphing instructions using Microsoft Excel 2003 (Microsoft Excel 2007 instructions start on page mei-7) Graph as a XY Scatter Chart, add titles for chart and axes, remove gridlines. A. Select
Spreadsheet Concepts: Creating Charts in Microsoft Excel
 Spreadsheet Concepts: Creating Charts in Microsoft Excel lab 6 Objectives: Upon successful completion of Lab 6, you will be able to Create a simple chart on a separate chart sheet and embed it in the worksheet
San Francisco State University
 San Francisco State University Michael Bar Instructions for Excel 1. Plotting analytical function. 2 Suppose that you need to plot the graph of a function f ( x) = x on the interval [ 5,5]. Step 1: make
Microsoft Excel Using Excel in the Science Classroom
 Microsoft Excel Using Excel in the Science Classroom OBJECTIVE Students will take data and use an Excel spreadsheet to manipulate the information. This will include creating graphs, manipulating data,
Introduction to Microsoft Office PowerPoint 2010
 Introduction to Microsoft Office PowerPoint 2010 TABLE OF CONTENTS Open PowerPoint 2010... 1 About the Editing Screen... 1 Create a Title Slide... 6 Save Your Presentation... 6 Create a New Slide... 7
This activity will show you how to use Excel to draw cumulative frequency graphs. Earnings ( x/hour) 0 < x < x
 0 < x < x") Pay rates for men and women - Excel 2007 activity This activity will show you how to use Excel to draw cumulative frequency graphs. Information sheet The table gives the results from a survey about hourly
Pay rates for men and women - Excel 2007 activity This activity will show you how to use Excel to draw cumulative frequency graphs. Information sheet The table gives the results from a survey about hourly
Charts in Excel 2003
 Charts in Excel 2003 Contents Introduction Charts in Excel 2003...1 Part 1: Generating a Basic Chart...1 Part 2: Adding Another Data Series...3 Part 3: Other Handy Options...5 Introduction Charts in Excel
Laboratory 1. Part 1: Introduction to Spreadsheets
 Laboratory 1 Part 1: Introduction to Spreadsheets By the end of this laboratory session you should be familiar with: Navigating around a worksheet. Naming sheets and cells. Formatting. The use of formulae.
Getting Started with. Office 2008
 Getting Started with Office 2008 Copyright 2010 - Information Technology Services Kennesaw State University This document may be downloaded, printed, or copied, for educational use, without further permission
Excel 2010 Charts and Graphs
 Excel 2010 Charts and Graphs In older versions of Excel the chart engine looked tired and old. Little had changed in 15 years in charting. The popular chart wizard has been replaced in Excel 2010 by a
Saratoga Springs City School District/Office of Continuing Education Introduction to Microsoft Excel 04 Charts. 1. Chart Types and Dimensions
 1949 1954 1959 1964 1969 1974 1979 1984 1989 1994 1999 2004 Saratoga Springs City School District/Office of Continuing Education Introduction to Microsoft Excel 04 Charts 1. Chart Types and Dimensions
Spreadsheet and Graphing Exercise Biology 210 Introduction to Research
 1 Spreadsheet and Graphing Exercise Biology 210 Introduction to Research There are many good spreadsheet programs for analyzing data. In this class we will use MS Excel. Below are a series of examples
Excel. Spreadsheet functions
 Excel Spreadsheet functions Objectives Week 1 By the end of this session you will be able to :- Move around workbooks and worksheets Insert and delete rows and columns Calculate with the Auto Sum function
How to Make a Line Graph with Phase Lines in Excel 2007
 How to Make a Line Graph with Phase Lines in Excel 2007 Performance Aid Purpose The purpose of this document is to provide you with instructions to reference as you create a line graph in Excel 2007. It
Years after US Student to Teacher Ratio
 The goal of this assignment is to create a scatter plot of a set of data. You could do this with any two columns of data, but for demonstration purposes we ll work with the data in the table below. The
Introduction. A cell can contain any of the following:
 Introduction A spreadsheet is a table consisting of Rows and Columns. Where a row and a column meet, the box is called a Cell. Each cell has an address consisting of the column name followed by the row
GCSE CCEA GCSE EXCEL 2010 USER GUIDE. Business and Communication Systems
 GCSE CCEA GCSE EXCEL 2010 USER GUIDE Business and Communication Systems For first teaching from September 2017 Contents Page Define the purpose and uses of a spreadsheet... 3 Define a column, row, and
Pre-Lab Excel Problem
 Pre-Lab Excel Problem Read and follow the instructions carefully! Below you are given a problem which you are to solve using Excel. If you have not used the Excel spreadsheet a limited tutorial is given
Excel Contents. MS Excel /3/2011 JSD#2-Neptune Page 1
 Excel 2013 Contents Contents... 1 Opening Start Screen... 2 Formatting cells... 2 Modifying information in a cell... 2 Autofil... 3 Merge and Center Headings and Merge Cells... 3 Auto Calculation... 3
HPOG RoundTable: How to Manipulate PAGES Data with Excel
 HPOG RoundTable: How to Manipulate PAGES Data with Excel This document describes how to create a basic table shell, populate it, and generate a chart in Excel 2016. Other versions of Excel will have corresponding
The HOME Tab: Cut Copy Vertical Alignments
 The HOME Tab: Cut Copy Vertical Alignments Text Direction Wrap Text Paste Format Painter Borders Cell Color Text Color Horizontal Alignments Merge and Center Highlighting a cell, a column, a row, or the
Module 4 : Spreadsheets
 Module 4 : Spreadsheets What is a spreadsheet program? A spreadsheet program allows you to store, organise and analyse information. Applications of spreadsheets focus on generating numeric information
Excel R Tips. is used for multiplication. + is used for addition. is used for subtraction. / is used for division
 Excel R Tips EXCEL TIP 1: INPUTTING FORMULAS To input a formula in Excel, click on the cell you want to place your formula in, and begin your formula with an equals sign (=). There are several functions
Using Microsoft Excel
 About Excel Using Microsoft Excel What is a Spreadsheet? Microsoft Excel is a program that s used for creating spreadsheets. So what is a spreadsheet? Before personal computers were common, spreadsheet
The Basics of PowerPoint
 MaryBeth Rajczewski The Basics of PowerPoint Microsoft PowerPoint is the premiere presentation software. It enables you to create professional presentations in a short amount of time. Presentations using
SAMLab Tip Sheet #4 Creating a Histogram
 Creating a Histogram Another great feature of Excel is its ability to visually display data. This Tip Sheet demonstrates how to create a histogram and provides a general overview of how to create graphs,
Excel: Creating Charts and Graphs
 Excel: Creating Charts and Graphs Charts for Excel 2013 1 Charts for Excel 2013 2 Background Information This short workshop is designed to provide an overview for creating and formatting charts and sparklines
Microsoft Excel Microsoft Excel
 Excel 101 Microsoft Excel is a spreadsheet program that can be used to organize data, perform calculations, and create charts and graphs. Spreadsheets or graphs created with Microsoft Excel can be imported
Creating Charts in Office 2007 Table of Contents
 Table of Contents Microsoft Charts... 1 Inserting a Chart in Excel... 1 Tip Shortcut Key to Create a Default Chart in Excel... 2 Activating Your Chart... 2 Resizing an Embedded Chart... 2 Moving a Chart...
Creating and Modifying Charts
 Creating and Modifying Charts Introduction When you re ready to share data with others, a worksheet might not be the most effective way to present the information. A page full of numbers, even if formatted
Charting Progress with a Spreadsheet
 Charting Progress - 1 Charting Progress with a Spreadsheet We shall use Microsoft Excel to demonstrate how to chart using a spreadsheet. Other spreadsheet programs (e.g., Quattro Pro, Lotus) are similarly
Chemistry Excel. Microsoft 2007
 Chemistry Excel Microsoft 2007 This workshop is designed to show you several functionalities of Microsoft Excel 2007 and particularly how it applies to your chemistry course. In this workshop, you will
INSERT SUBTOTALS Database Exercise Sort the Data Department Department Data Tab Sort and Filter Group
 INSERT SUBTOTALS Subtotals are used to summarize data in a range of data. This command offers many kinds of summary information, including counts, sums, averages, minimums, and maximums. When this feature
Chemistry 30 Tips for Creating Graphs using Microsoft Excel
 Chemistry 30 Tips for Creating Graphs using Microsoft Excel Graphing is an important skill to learn in the science classroom. Students should be encouraged to use spreadsheet programs to create graphs.
Excel Spreadsheets and Graphs
 Excel Spreadsheets and Graphs Spreadsheets are useful for making tables and graphs and for doing repeated calculations on a set of data. A blank spreadsheet consists of a number of cells (just blank spaces
Introduction to the workbook and spreadsheet
 Excel Tutorial To make the most of this tutorial I suggest you follow through it while sitting in front of a computer with Microsoft Excel running. This will allow you to try things out as you follow along.
Troubleshooting in Microsoft Excel 2002
 Page 1 of 8 Troubleshooting in Microsoft Excel 2002 Result: To understand how to work with the Excel software to enter data, navigate the page, and print materials. Tabs Look at the tabs at the bottom
NUMERICAL COMPUTING For Finance Using Excel. Sorting and Displaying Data
 NUMERICAL COMPUTING For Finance Using Excel Sorting and Displaying Data Outline 1 Sorting data Excel Sort tool (sort data in ascending or descending order) Simple filter (by ROW, COLUMN, apply a custom
Three-Dimensional (Surface) Plots
 Plots") Three-Dimensional (Surface) Plots Creating a Data Array 3-Dimensional plots (surface plots) are often useful for visualizing the behavior of functions and identifying important mathematical/physical features
Three-Dimensional (Surface) Plots Creating a Data Array 3-Dimensional plots (surface plots) are often useful for visualizing the behavior of functions and identifying important mathematical/physical features
Excel 2013 Intermediate
 Excel 2013 Intermediate Quick Access Toolbar... 1 Customizing Excel... 2 Keyboard Shortcuts... 2 Navigating the Spreadsheet... 2 Status Bar... 3 Worksheets... 3 Group Column/Row Adjusments... 4 Hiding
Activity: page 1/10 Introduction to Excel. Getting Started
 Activity: page 1/10 Introduction to Excel Excel is a computer spreadsheet program. Spreadsheets are convenient to use for entering and analyzing data. Although Excel has many capabilities for analyzing
Basic Microsoft Excel Skills
 Basic Microsoft Excel Skills Note : This tutorial is based upon Microsoft Excel 2000. If you are using MSExcel 1997 or 2002, there may be some operations which look slightly different (e.g. graphs), but
1. Click in cell A2, and then drag to cell D5 to select the data in those four rows and columns.
 Training Chart work EXERCISE 1: CREATE A CHART 1. Click in cell A2, and then drag to cell D5 to select the data in those four rows and columns. 2. On the ribbon, click the Insert tab. In the Charts group,
Understand and plan a chart Create a chart Move and resize charts and chart objects Apply chart layouts and styles
 Working with Charts Objectives Understand and plan a chart Create a chart Move and resize charts and chart objects Apply chart layouts and styles 2 Objectives Customize chart elements Enhance a chart Create
Introduction to Excel Workshop
 Introduction to Excel Workshop Empirical Reasoning Center September 9, 2016 1 Important Terminology 1. Rows are identified by numbers. 2. Columns are identified by letters. 3. Cells are identified by the
Scientific Graphing in Excel 2013
 Scientific Graphing in Excel 2013 When you start Excel, you will see the screen below. Various parts of the display are labelled in red, with arrows, to define the terms used in the remainder of this overview.
Chapter 3: Rate Laws Excel Tutorial on Fitting logarithmic data
 Chapter 3: Rate Laws Excel Tutorial on Fitting logarithmic data The following table shows the raw data which you need to fit to an appropriate equation k (s -1 ) T (K) 0.00043 312.5 0.00103 318.47 0.0018
Rockefeller College MPA Excel Workshop: Clinton Impeachment Data Example
 Rockefeller College MPA Excel Workshop: Clinton Impeachment Data Example This exercise is a follow-up to the MPA admissions example used in the Excel Workshop. This document contains detailed solutions
Introduction to CS graphs and plots in Excel Jacek Wiślicki, Laurent Babout,
 MS Excel 2010 offers a large set of graphs and plots for data visualization. For those who are familiar with older version of Excel, the layout is completely different. The following exercises demonstrate
Total Number of Students in US (millions)
") The goal of this technology assignment is to graph a formula on your calculator and in Excel. This assignment assumes that you have a TI 84 or similar calculator and are using Excel 2007. The formula you
The goal of this technology assignment is to graph a formula on your calculator and in Excel. This assignment assumes that you have a TI 84 or similar calculator and are using Excel 2007. The formula you
Microsoft Excel 2010 Tutorial
 1 Microsoft Excel 2010 Tutorial Excel is a spreadsheet program in the Microsoft Office system. You can use Excel to create and format workbooks (a collection of spreadsheets) in order to analyze data and
The first thing we ll need is some numbers. I m going to use the set of times and drug concentration levels in a patient s bloodstream given below.
 Graphing in Excel featuring Excel 2007 1 A spreadsheet can be a powerful tool for analyzing and graphing data, but it works completely differently from the graphing calculator that you re used to. If you
Microsoft Office Excel
 Microsoft Office 2007 - Excel Help Click on the Microsoft Office Excel Help button in the top right corner. Type the desired word in the search box and then press the Enter key. Choose the desired topic
Microsoft Excel 2013: Part 3 More on Formatting Cells And Worksheet Basics. To apply number formatting:
 Microsoft Excel 2013: Part 3 More on Formatting Cells And Worksheet Basics Formatting text and numbers In Excel, you can apply specific formatting for text and numbers instead of displaying all cell content
Excel 2016 Intermediate for Windows
 1 Excel 2016 Intermediate for Windows Excel Intermediate Training Objective To learn the tools and features of Excel 2016, and gain vital skills to use Excel more efficiently and effectively. What you
EXCEL 2007 TIP SHEET. Dialog Box Launcher these allow you to access additional features associated with a specific Group of buttons within a Ribbon.
 EXCEL 2007 TIP SHEET GLOSSARY AutoSum a function in Excel that adds the contents of a specified range of Cells; the AutoSum button appears on the Home ribbon as a. Dialog Box Launcher these allow you to
MICROSOFT EXCEL TUTORIAL HANDOUT
 MICROSOFT EXCEL TUTIAL HANDOUT Opening Microsoft Excel 1. Click on the START button. 2. Click on PROGRAMS. 3. Click on MICROSOFT EXCEL. The Excel Screen Formula Bar Minimize Buttons Restore Buttons Close
FlowJo Software Lecture Outline:
 FlowJo Software Lecture Outline: Workspace Basics: 3 major components 1) The Ribbons (toolbar) The availability of buttons here can be customized. *One of the best assets of FlowJo is the help feature*
Making Tables and Graphs with Excel. The Basics
 Making Tables and Graphs with Excel The Basics Where do my IV and DV go? Just like you would create a data table on paper, your IV goes in the leftmost column and your DV goes to the right of the IV Enter
MICROSOFT EXCEL Working with Charts
 MICROSOFT EXCEL 2010 Working with Charts Introduction to charts WORKING WITH CHARTS Charts basically represent your data graphically. The data here refers to numbers. In Excel, you have various types of
Creating a Basic Chart in Excel 2007
 Creating a Basic Chart in Excel 2007 A chart is a pictorial representation of the data you enter in a worksheet. Often, a chart can be a more descriptive way of representing your data. As a result, those
Budget Exercise for Intermediate Excel
 Budget Exercise for Intermediate Excel Follow the directions below to create a 12 month budget exercise. Read through each individual direction before performing it, like you are following recipe instructions.
Key Terms. Differentiation Extended Time Four square
 Subject: Computer Applications Grade: 9th Mr. Holmes Unit Lesson Layer Duration MS Excel Enhancing a Worksheet Applied (do) 10/1/12 10/11/12 Essential Questions What do you think about, prove, apply, what
Agenda. Spreadsheet Applications. Spreadsheet Terminology A workbook consists of multiple worksheets. By default, a workbook has 3 worksheets.
 Agenda Unit 1 Assessment Review Progress Reports Intro to Excel Learn parts of an Excel spreadsheet How to Plan a spreadsheet Create a spreadsheet Analyze data Create an embedded chart in spreadsheet In
2. This is a cell; this cell is designated as A1.
 Queen s Learning Commons: Microsoft Excel Basics 1. These are the columns. 2. This is a cell; this cell is designated as A1. 3. Let s make a table. Click on the box you want to put text in and simply begin
Appendix C. Vernier Tutorial
 C-1. Vernier Tutorial Introduction: In this lab course, you will collect, analyze and interpret data. The purpose of this tutorial is to teach you how to use the Vernier System to collect and transfer
Word Overview Page 3 Tables Page 5 Labels Page 9 Mail Merge Page 12. Excel Overview Page 19 Charts Page 22
 Overview Page 3 Tables Page 5 Labels Page 9 Mail Merge Page 12 Excel Overview Page 19 Charts Page 22 PowerPoint Overview Page 26 Inserting Pictures and Sounds Page 30 Animation and Transitions Page 32
2. create the workbook file
 2. create the workbook file Excel documents are called workbook files. A workbook can include multiple sheets of information. Excel supports two kinds of sheets for working with data: Worksheets, which
Using Tables, Sparklines and Conditional Formatting. Module 5. Adobe Captivate Wednesday, May 11, 2016
 Slide 1 - Using Tables, Sparklines and Conditional Formatting Using Tables, Sparklines and Conditional Formatting Module 5 Page 1 of 27 Slide 2 - Lesson Objectives Lesson Objectives Explore the find and
Microsoft Excel Lab: Data Analysis
 1 Microsoft Excel Lab: The purpose of this lab is to prepare the student to use Excel as a tool for analyzing data taken in other courses. The example used here comes from a Freshman physics lab with measurements
Making and Editing a Table in Microsoft Word 2007
 Making and Editing a Table in Microsoft Word 2007 Table of Contents Introduction... 2 Creating a Table... 2 1. Finding the "Table" button... 2 2. Methods for making a table... 3 Editing Table Dimensions...
Microsoft Excel 2007
 Microsoft Excel 2007 1 Excel is Microsoft s Spreadsheet program. Spreadsheets are often used as a method of displaying and manipulating groups of data in an effective manner. It was originally created
Review Ch. 15 Spreadsheet and Worksheet Basics. 2010, 2006 South-Western, Cengage Learning
 Review Ch. 15 Spreadsheet and Worksheet Basics 2010, 2006 South-Western, Cengage Learning Excel Worksheet Slide 2 Move Around a Worksheet Use the mouse and scroll bars Use and (or TAB) Use PAGE UP and
1. AUTO CORRECT. To auto correct a text in MS Word the text manipulation includes following step.
 1. AUTO CORRECT - To auto correct a text in MS Word the text manipulation includes following step. - STEP 1: Click on office button STEP 2:- Select the word option button in the list. STEP 3:- In the word
To learn more about the Milestones window choose: Help Help Topics Select the Index tab and type in the feature. For Example toolbox.
 To learn more about the Milestones window choose: Help Help Topics Select the Index tab and type in the feature. For Example toolbox. 1 of 12 CHOOSE THE DATES TAB TO: 1. Set the schedule s Date Range.
Excel 2013 Charts and Graphs
 Excel 2013 Charts and Graphs Copyright 2016 Faculty and Staff Training, West Chester University. A member of the Pennsylvania State System of Higher Education. No portion of this document may be reproduced
Data Management Project Using Software to Carry Out Data Analysis Tasks
 Data Management Project Using Software to Carry Out Data Analysis Tasks This activity involves two parts: Part A deals with finding values for: Mean, Median, Mode, Range, Standard Deviation, Max and Min
SUM - This says to add together cells F28 through F35. Notice that it will show your result is
 COUNTA - The COUNTA function will examine a set of cells and tell you how many cells are not empty. In this example, Excel analyzed 19 cells and found that only 18 were not empty. COUNTBLANK - The COUNTBLANK
Excel 2010-Part. Two
 Jefferson Parish Library Computer Training Team Excel 2010-Part Two August 2011 Symbols Used in Formulas Add Subtract Divide Multiply + - / * When working with formulas in Excel you will use basic keyboard
Excel Core Certification
 Microsoft Office Specialist 2010 Microsoft Excel Core Certification 2010 Lesson 6: Working with Charts Lesson Objectives This lesson introduces you to working with charts. You will look at how to create
Microsoft Excel 2002 M O D U L E 2
 THE COMPLETE Excel 2002 M O D U L E 2 CompleteVISUAL TM Step-by-step Series Computer Training Manual www.computertrainingmanual.com Copyright Notice Copyright 2002 EBook Publishing. All rights reserved.
course notes quick reference guide
 course notes quick reference guide Microsoft Excel 2010 Welcome to Excel 2010 Excel 2010 is the premier spreadsheet application from Microsoft. Excel 2010 makes it easier to analyze data quickly with new
Survey of Math: Excel Spreadsheet Guide (for Excel 2016) Page 1 of 9
 Page 1 of 9") Survey of Math: Excel Spreadsheet Guide (for Excel 2016) Page 1 of 9 Contents 1 Introduction to Using Excel Spreadsheets 2 1.1 A Serious Note About Data Security.................................... 2 1.2
Survey of Math: Excel Spreadsheet Guide (for Excel 2016) Page 1 of 9 Contents 1 Introduction to Using Excel Spreadsheets 2 1.1 A Serious Note About Data Security.................................... 2 1.2