Comodo Korugan Software Version 1.10
|
|
|
- Meredith Poole
- 6 years ago
- Views:
Transcription
1 rat Comodo Korugan Software Version 1.10 Unified Threat Management Administrator Guide Guide Version Comodo Security Solutions 1255 Broad Street Clifton, NJ 07013
2 Table of Contents 1 Introduction to Comodo Korugan Installing Korugan and logging-in to the Administrative Console The Main Interface Network Configuration The Dashboard Viewing and Modifying System Status and General Configuration Managing Administrative Accounts Adding and Managing Administrators Managing Administrative Roles Central Management Accessing the Web Console Configuring SSH Access Configuring GUI Settings High Availability Viewing and Updating Firmware Version Creating and Scheduling Backup of UTM State Manually Creating a Backup Scheduling Backup Operations Encrypting Backup Archives Exporting a backup Importing a Backup Archive from a Local Computer Rolling Back the Appliance to a Previous Time Point Resetting the Appliance to Factory Defaults Shutting Down the UTM Appliance Viewing UTM Appliance Status System Status Network Status System Usage Summaries Network Traffic Network Connections SSLVPN Connections Network Configuration - Advanced Settings Configuring Interface Devices, Uplinks and VLANs Adding and Managing Gateway Uplink Devices Creating VLANs Adding and Managing Hosts Routes Adding and Managing Static Routes Adding and Managing Policy Routing Rules Configuring UTM Services and Protection Settings DHCP Server
3 8.2 Dynamic DNS Advanced Threat Protection Managing ATP Profiles Threat Intelligence Endpoint Management Comodo Antivirus Time Server Content Flow Check System Configuring Intrusion Prevention System Managing IPS Rulesets Managing Application Identification Rulesets Configuring Wireless Hotspot Configuring Captive Portal Service Customizing the Login Page Adding and Managing Permanent Users Traffic Monitoring Quality of Service Internet Content Adaptation Protocol Managing Firewall Configuration Firewall Objects Managing Firewall Address Objects Managing Firewall Object Groups Managing Firewall Schedules Active Directory Integration Source Network Address Translation Configuring Virtual IP for Destination Network Address Translation Configuring System Access Configuring Firewall Policy Rules Managing Firewall Policy Rules Managing VPN Firewall Rules Configuring Proxy Services HTTP/HTTPS Proxy Server Configuring URL and Content Filtering HTTPS Proxy Managing HTTPS Exceptions SMTP Proxy Configuring General SMTP Proxy Settings Configuring SMTP Proxy Whitelists and Blackists Managing Incoming Domains Mail Routing Configuring Advanced SMTP Proxy Settings Configuring Virtual Private Network Settings SSL VPN Server
4 Configuring General SSL VPN Server Settings Managing SSL VPN Client Accounts Configuring Advanced SSL VPN Server Settings SSLVPN Client IPsec Configuration L2TP Server Configuration IPsec / L2TP Users Configuration Viewing Logs Realtime Logs Configuring Log Settings Using Korugan Log Collector Appendix: Comodo Korugan - Appliance Specifications Appendix: Minimum Requirements for Software Installations About Comodo
5 1 Introduction to Comodo Korugan Comodo Korugan is a unified threat management appliance which provides comprehensive security for enterprise networks by combining multiple, best of breed, security technologies in a single, rack-mounted device. Korugan simplifies the overall management of network security by delivering a single interface through which administrators can control firewall policy, antivirus, intrusion prevention, gateway antispam, website filtering, traffic monitoring, VPN, DNS and proxy servers. Korugan also features highly configurable notifications, in-depth reporting and an informative dashboard which offers a panoramic overview of all major security settings and network events. Key benefits: Fully integrated security - All Korugan modules are designed to work in complete harmony with each other, avoiding interoperability issues and without leaving gaps in your protection Fast setup and configuration - Simply connect the Korugan device to your network and use a single interface to configure your entire network's security Slash costs - Korugan costs a fraction of the purchase price of individual systems, consumes less power and means enterprises no longer need to pay for multiple service and support contracts Reduced technical requirements - With just one product to learn, technical personnel are released from the need to manage multiple systems and become more productive, effective and efficient Key features: Policy driven enterprise firewall Gateway antivirus 5
6 Gateway antispam Advanced Threat Protection Intrusion prevention system Website/URL filtering Application control VPN and hotspot configuration Load balancing and traffic shaping Traffic monitoring and quality of service controls SSL and SSH inspection DNS and DHCP configuration Web, mail and FTP proxy Full active directory integration Role Based Administrative Control for Administrators Central Management High Availability This guide is intended to take you through the installation, configuration and use of the following models of Comodo Korugan. Korugan 65 Korugan 90 For a detailed specifications, refer to the section Appendix: Comodo Korugan - Appliance Specifications. Environmental Pre-requisites for Secure Operation: To ensure secure operations, please ensure you deploy Korugan in an acceptable environment: Korugan administrators, should be properly trained in security operations and should fully understand how to configure the product. Passwords and authentication secrets should be adequately protected from unauthorized access. Please ensure no other products, appliances or services are running which could conflict with Korugan. Korugan UTM device and related peripheral units should be located in a physically protected area. Physical access to Korugan should be provided only to required and authorized administrator(s). If the remote logging feature is to be used, it is recommended you run syslog server in protected zones. Guide Structure Introduction to Comodo Korugan The Main Interface Network Configuration The Dashboard Viewing and Modifying System Status and General Configuration Viewing UTM Appliance Status Network Configuration - Advanced Settings Configuring UTM Services and Protection Settings Managing Firewall Configuration Configuring Proxy Services 6

7 Configuring Virtual Private Network Settings Viewing Logs Appendix: Comodo Korugan - Appliance Specifications Appendix: Minimum requirements for software installations 1.1 Installing Korugan and logging-in to the Administrative Console Appliance Software Versions Initial Configuration Connecting the appliance to your network Security Tip : Korugan UTM should not be deployed in environments with excessively hot or cold temperatures or high humidity. Ensure air control systems are in place to extract dust and gas which can be hazardous to hardware and operational security. Pre-requisites - Korugan should be connected to a grounded power supply. Administrators should ensure the appliance is protected from risk of electrostatic discharge (ESD) 1. Connect port 1 to your computer and assign an IP address in the same subnet with / Connect to the Korugan management console from any internet browser by entering in the browser address bar. The login screen will be displayed. 3. Login with the default username 'admin' and password 'comodo' Note : All Valid attempts of authentication are logged by Korugan UTM. Logged items include date, time, originating IP, attempted user name and output of the attempt. 4. Korugan has multiple programmable interfaces (ports 4-9) that can be connected to networks like Wi-Fi, LAN, WAN, DMZ. These and configured through the network configuration tab, where you will enter the respective IP addresses and port numbers. 1 - Port to connect Korugan to the computer from which you will manage the appliance. 2 Connection state indicators: Yellow Database connection 7
8 White Internet connection Green Power supply 3 USB ports for connecting to other devices like printers or other network devices. 4-9 Ports for connecting other physical networking devices (gateway, switches etc) to Korugan. Software versions Korugan is also available as software which can be installed on a PC: Korugan Lite ( - Free, feature limited version of Korugan which can be installed on any PC Korugan VM ( - Fully featured version of Korugan in VM format To run one of the software versions, please ensure your PC meets the following minimum requirements: 1 x Intel or equivalent CPU 2 GB RAM 4 GB Storage 4 x 1 GbE NIC Initial Configuration After first login, Korugan requires that you change the default password. Please choose a strong password that contains a mix of upper and lower case letters, numbers and special characters. We also recommend regularly changing your password as best security practice. After successfully logging-in to the console, start configuring related ports for your network. 1. To setup network settings, click on 'Network' > 'Interfaces' in the menu on the left. You will find that port 1 is already configured with the default configuration, IP : and Subnet mask :

9 2. For your INTERNET connection please use any port other than your LAN port (port 1) with your WAN IP and subnet configuration. Refer to the section Network Configuration for more details. 3. For your DMZ connection please use any port other than INTERNET and LAN ports with necessary IP and subnet information. You can find an example configuration below. 9
10 4. After configuring INTERNET and DMZ interfaces, you just have to configure your LAN interface so that it will include your own LAN subnet ip and mask. 5. After configuring the Interfaces, you have to allow any traffic from LAN zone to INTERNET zone so that you will be able to reach internet sources before applying any complex or specific firewall policies. The Firewall Policies can be configured from Policy Firewall interface, To access the Policy Firewall interface, click Firewall > Firewall from the left hand side navigation and select the 'Policy Firewall' tab. More details on creating Policy Firewall rules are available in the section Managing Policy Firewall Rules of this guide. 10
11 2 The Main Interface The Korugan dashboard is the administrative nerve center of the appliance, providing administrators with visibility and control over all services and settings. The dashboard contains 'must know' statistics about network traffic, service status and uplinks and serves as a launchpad from which administrators can access other settings in the interface. Korugan modules are displayed in the strip along the left of the interface. Clicking the arrow at top-left will expand the strip into a full menu. The following table is a quick overview of the modules: 11

12 System - Enables administrators to view and configure general settings such as notifications, passwords, SSH, user-interface settings and to shut down the system. Status - Enables administrators to view appliance status data such as system status, network status and SSL VPN connections Network - Enables administrators to configure general and advanced network settings including hosts, routing, uplinks and VLANs. Services - Enables administrators to configure various UTM services like DHCP server, advanced threat protection, content flow check, intrusion prevention, traffic monitoring and more. Firewall - Enables administrators to configure the firewall and apply rules for controlling inbound and outbound traffic to/from the network. Proxy - Enables administrators to configure the proxy servers for various services like HTTP/HTTPS proxy services, URL filtering, Anti-Spam and so on. VPN - Enables administrators to configure the SSLVPN server, SSLVPN client, IPsec-based VPN tunnels and L2TP connections. Logs - Enables administrators to view logs for system events, firewall, antivirus, intrusion detection and other important areas. You can also configure syslog servers for remote logging. 12

13 Click any module to reveal a sub-menu containing further options: The user-friendly graphical user interface of the administrative console provides easy access to the information and configuration screens of all the modules in the UTM, with the LHS Navigation design. 13

14 The Left Navigation Menu - The left hand navigation displays Korugan modules as tabs. Clicking on a module opens sub-tabs to open different configuration screens of the selected module. The Main Configuration Area - The main configuration area displays information pertinent to the tab selected on the left. The main configuration area indicates different network zones with different colors: RED - Untrusted external network zone, such as a WAN, through which the local network connects to internet. This network zone cannot be managed by the UTM but administrators can grant or limit access to this network zone. GREEN - The local network zone to which the workstations are connected, such as the LAN. This zone is prevented from direct access by the RED zone. The administration console of the UTM can be accessed from any of the workstation connected to the local network. ORANGE - The demilitarized zone (DMZ) that hosts the servers. The servers can directly connect to the internet and provide services like SMTP/POP, SVN and HTTP and so on. BLUE - The WiFi zone used by wireless clients. All wireless clients are confined to this zone, prohibiting access to Orange or Green zones, as they are less secure and are allowed to directly connect to Internet. The Title Bar Controls - The title bar contains controls for: Logout - The administrator can logout of the Korugan Administrative console Help - Opens the online help page of Comodo Korugan corresponding to the currently open configuration screen. The Online help guide for Comodo Korugan is available at All areas of UTM have their own dedicated pages in the help guide. Version and Copyright Information - Version number and copyright information of the UTM firmware is displayed at the bottom left of the interface. 14
15 3 Network Configuration Depending on the model, the UTM appliance has six or four physical ports for connecting the interface devices of different network zones like Local Area Network (LAN), Demilitarized Zone (DMZ), WiFi router, uplink devices for connecting to external network like Internet and so on. You can connect different interface devices to the physical ports in desired order. Once you have connected the interface devices and logged-in to the management interface, you need to complete an initial network configuration to successfully deploy the appliance to the network. Korugan has a built-in wizard which assists you to do this. The Network Setup Wizard can be accessed by clicking Network > Interfaces from the left hand side navigation. 15

16 The Network Configuration screen has two panes: Interface Configuration - Displays a table showing the interface devices connected to the physical ports of the appliance with their configuration and connection statuses and allows you to add and manage the network zone interfaces. Refer to the following section Interface Configuration for more details. Additional Gateway Uplinks - Displays a table showing the nodes among your internal network zones configured as gateway devices for the UTM appliance to connect to Internet and allows you to add and manage gateway devices. Refer to the section Adding and Managing Gateway Uplink Devices for more details. 16
17 Interface Configuration The Interface Configuration table shows the interface devices connected to and configured for the physical ports, with their status and other details. You can add new interface connections and enable/disable existing connections from this interface. Interface Configuration Table - Column Descriptions Column Header Interface Name Description Name of the Korugan port. The font color indicates the type of network zone to which the port is connected. Red - External networks, like WAN, for Internet connection Yellow - DMZ zone Green - Local Area Network to which workstations are connected Blue - Wi-Fi network Status Link status of the interface device. The status can be one of the following: Green Tick - Link is active Red Cross - The link is not active Question Mark - No information about the link from the device driver Zone Type The network zone type of the interface. The network zone can be one of the following: Internet LAN Wi-Fi DMZ Hover the mouse cursor over the question mark beside zone name to view a tool-tip showing the type of network zone interface (Static or Dynamic) IP The IP address of the interface device connected to the port. Netmask The netmask of the network zone connected through the interface MAC Address The Media Access Control (MAC) address of the interface Actions Displays control buttons for editing and deleting the port entries - Opens connection settings and allows you to edit the parameters of the interface. - Disconnects the interface and clears the port. - Indicates whether the port is enabled or disabled. The checkbox also allows the administrator to switch the port between enabled and disabled states. The following sections provide detailed explanations on configuring the network zone interfaces: Configuring untrusted external network zones like WAN for connecting to the Internet Configuring trusted internal network zones like LAN Configuring the DMZ interface Configuring the Wi-Fi interface Configuring untrusted external network zones like WAN for connecting to the Internet 17

18 The setup for external networks involves choosing the physical port to which the interface device for main uplink is connected and then configuring network parameters and preferences. Tip: You can add more uplinks for fail-over and load sharing to different ports at a later time from the 'Network' > 'Interfaces' > 'Network Configuration' screen using the same procedure. Also you can add nodes among your internal network and connected to Internet as gateway uplink devices to the appliance through the same interface. Refer to the section Adding and Managing Gateway Uplink Devices for more details. To configure the external network zone Click on the edit icon in the row of the port to which the interface device for connecting to external network/internet is plugged-in. The pane for configuring the interface device will open, with the row of the selected port highlighted. Zone - Select 'Internet' from the drop-down. The configuration options for external network interface devices will appear: 18

19 Type - Choose the interface type through which the appliance is connected to the Internet. The available options are: ETHERNET STATIC - The external network interface is in a LAN and has a fixed IP address and netmask. An example is a router in which the UTM Appliance is assigned a fixed IP address. ETHERNET DHCP - The external network interface receives its network configuration through dynamic host control protocol (DHCP) from a local server, router, or modem. PPPoE - The external interface is connected to an ADSL modem through an Ethernet cable. Select this option only if the modem uses the Point-to-Point Protocol over Ethernet (PPPoE) protocol to connect to the service provider. The following sections explain configuration parameters for each interface type: ETHERNET STATIC ETHERNET DHCP PPPoE 19

20 ETHERNET STATIC Configure the following for the external network zone Device Settings Device - The port to which the interface device is connected. The port is pre-selected. IP Address - Enter the IP address of the interface device Netmask - Choose the network mask containing the possible masks from the drop-down (e.g. / ) Add additional addresses - If additional IP address(es)/netmask(s) are to be added to the interface, select the 'Add additional addresses' checkbox and enter the additional IP address(es)/netmask(s) of different subnets one by one per line. Default gateway - Enter the IP address of the default gateway through which the appliance connects to Internet in the 'Default Gateway' text box DNS Settings - Enter the IP addresses/hostnames of the primary and secondary DNS servers to be used in the respective fields. Uplink Settings Uplink is Enabled - The uplink will be activated immediately after the creation of it. Deselect this checkbox if you don't want to enable the uplink device at this time. You can enable the uplink at a later time in two ways: Select the checkbox in the 'Actions' column of the 'Interface Configuration' interface. Refer to 20
21 the description of the Interface Configuration screen for more details Select the 'Active' checkbox beside the uplink in the Uplinks box from the Dashboard. Refer to the portion explaining the Uplinks box in the 'Dashboard' chapter for more details. Start uplink on boot - The uplink will start automatically on every restart of the UTM appliance. Deselect this checkbox if you want to manually start the uplink only when required. Uplink is managed - The uplink will be managed by Korugan and its details will be displayed in the Dashboard. Deselect this option if you do not want the uplink details to be displayed in the Dashboard. You can switch the uplink to managed state at any time by selecting the 'Managed' checkbox beside the uplink in the Dashboard. Refer to the section explaining the Uplinks box in the 'Dashboard' chapter for more details. Backup Profile - Select this checkbox if you want to specify an alternative uplink connection to be activated in the event this uplink fails and choose the alternative uplink device from the drop-down. Additional Link check hosts - The uplink reconnects automatically after a time period set by your ISP, in the event of a connection failure. If you want the appliance to check whether the uplink has connected successfully, you can try to ping known hosts in an external network. Enabling this option will reveal a text field where you should enter a list of one or more perpetually reachable IP addresses or hostnames. One of the hosts could be your ISP's DNS server or gateway. Advanced Settings: The Advanced Settings pane allows you to specify the MAC address and the Maximum Transmission Unit (MTU) of the data packets for the interface device. These settings are optional. If you need to specify custom values for these fields, click on the '+' sign beside 'Advanced Settings' to expand the 'Advanced Settings' pane. Use custom MAC address - The appliance has the capability to automatically detect the MAC address of the device connected to the port specified and populates the same in the MAC address column. If you need to specify a different MAC address to override and replace the default MAC address of the external interface, select the ' Use custom MAC address' checkbox and enter the MAC address in the text box that appears below the checkbox. Reconnection timeout - Specify the maximum time period (in seconds) that the uplink should attempt to reconnect in the event of a connection failure. The reconnection timeout period depends on the ISP configuration. If you are unsure, leave this field blank. MTU - Enter the Maximum Transmission Unit (MTU) of the data packets that can be sent over the network. Click 'Save'. A confirmation dialog will be displayed. Click OK. The appliance will restart for your settings to take effect. Network configuration activities like date, time, type of event, subject id, component name and the event outcome are logged. Tip: You can edit the network configuration e.g. for changing selected parameters like hostname or the network range of a zone, at any time depending on changes in your network. Click Network > Interface, click the 'Edit icon' in the 'Internet' row of the table, make the changes and save the changes. 21

22 ETHERNET DHCP Configure the following for the external network zone with Ethernet DHCP interface Device Settings Device - The port to which the interface device is connected. The port is pre-selected. DNS Settings - Select whether the DNS servers are to be automatically or manually assigned. If the latter, select the 'Use Custom DNS Settings' checkbox and enter the IP addresses/hostnames of the primary and secondary DNS servers to be used. Uplink Settings Uplink is Enabled - The uplink will be activated immediately after the creation of it. Deselect this checkbox if you don't want to enable the uplink device at this time. You can enable the uplink at a later time in two ways: Select the checkbox in the 'Actions' column of the 'Interface Configuration' interface. Refer to the description of the Interface Configuration screen for more details Select the 'Active' checkbox beside the uplink in the Uplinks box from the Dashboard. Refer to the portion explaining the Uplinks box in the 'Dashboard' chapter for more details. Start uplink on boot - The uplink will start automatically on every restart of the UTM appliance. Deselect this checkbox if you want to manually start the uplink only when required. Uplink is managed - The uplink will be managed by Korugan and its details will be displayed in the 22
23 Dashboard. Deselect this option if you do not want the uplink details to be displayed in the Dashboard. You can switch the uplink to managed state at any time by selecting the 'Managed' checkbox beside the uplink in the Dashboard. Refer to the section explaining the Uplinks box in the 'Dashboard' chapter for more details. Backup Profile - Select this checkbox if you want to specify an alternative uplink connection to be activated in the event this uplink fails and choose the alternative uplink device from the drop-down. Additional Link check hosts - The uplink reconnects automatically after a time period set by your ISP, in the event of a connection failure. If you want the appliance to check whether the uplink has connected successfully, you can try to ping known hosts in an external network. Enabling this option will reveal a text field where you should enter a list of one or more perpetually reachable IP addresses or hostnames. One of the hosts could be your ISP's DNS server or gateway. Advanced Settings: The Advanced Settings pane allows you to specify the MAC address and the Maximum Transmission Unit (MTU) of the data packets for the interface device. These settings are optional. If you need to specify custom values for these fields, click on the '+' sign beside 'Advanced Settings' to expand the 'Advanced Settings' pane. Use custom MAC address - By default, the appliance automatically detects the MAC address of the device connected to the specified port and populates the MAC address column with this information. If you need to specify a different MAC address (and replace the default MAC address of the external interface), select the ' Use custom MAC address' checkbox and enter the MAC address in the text box that appears below the checkbox. Reconnection timeout - Specify the maximum time period (in seconds) that the uplink should attempt to reconnect in the event of a connection failure. The reconnection timeout period depends on the ISP configuration. If you are unsure, leave this field blank. MTU - Enter the Maximum Transmission Unit (MTU) of the data packets that can be sent over the network. Click 'Save'. Network configuration activities like date, time, type of event, subject id, component name and the event outcome are logged. Tip: You can edit the network configuration e.g. for changing selected parameters like hostname or the network range of a zone, at any time depending on changes in your network. Click Network > Interface, click the 'Edit icon' in the 'Internet' row of the table, make the changes and save the changes. PPPoE Configure the following for external network zones with PPPoP interface 23
/netmask(s) are to be added to the interface, select the 'Add additional addresses' checkbox and enter the additional IP address(es)/netmask(s)")
24 Device Settings Device - The port to which the interface device is connected. The port is pre-selected. Add additional addresses - If additional IP address(es)/netmask(s) are to be added to the interface, select the 'Add additional addresses' checkbox and enter the additional IP address(es)/netmask(s) of different subnets one by one per line. Username - Enter the login username for Internet connection as provided by your Internet Service Provider (ISP) Password - Enter the login password as provided by your ISP for Internet connection 24
25 Authentication Method - Enter the method of authentication used by your ISP for your device to connect to Internet from the drop-down. The options available are: Password Authentication Protocol (PAP); Challenge Handshake Authentication Protocol (CHAP); or both. If you are not sure about the authentication method, choose PAP or CHAP (Default). DNS Settings - Select whether the DNS servers are to be automatically assigned or manually assigned. If the later, select the Use 'Custom DNS Settings' checkbox and enter the IP addresses/hostnames of the primary and secondary DNS servers to be used. Uplink Settings Uplink is Enabled - The uplink will be activated immediately after the creation of it. Deselect this checkbox if you don't want to enable the uplink device at this time. You can enable the uplink at a later time in two ways: Select the checkbox in the 'Actions' column of the 'Interface Configuration' interface. Refer to the description of the Interface Configuration screen for more details. Select the 'Active' checkbox beside the uplink in the Uplinks box from the Dashboard. Refer to the portion explaining the Uplinks box in the 'Dashboard' chapter for more details. Start uplink on boot - The uplink will start automatically on every restart of the UTM appliance. Deselect this checkbox if you want to manually start the uplink only when required. Uplink is managed - The uplink will be managed by Korugan and its details will be displayed in the Dashboard. Deselect this option if you do not want the uplink details to be displayed in the Dashboard. You can switch the uplink to managed state at any time by selecting the 'Managed' checkbox beside the uplink in the Dashboard. Refer to the section explaining the Uplinks box in the 'Dashboard' chapter for more details. Backup Profile - Select this checkbox if you want to specify an alternative uplink connection to be activated in the event this uplink fails and choose the alternative uplink device from the drop-down. Additional Link check hosts - The uplink reconnects automatically after a time period set by your ISP, in the event of a connection failure. If you want the appliance to check whether the uplink has connected successfully, you can try to ping known hosts in an external network. Enabling this option will reveal a text field where you should enter a list of one or more perpetually reachable IP addresses or hostnames. One of the hosts could be your ISP's DNS server or gateway. Advanced Settings: The Advanced Settings pane allows you to specify the MAC address and the Maximum Transmission Unit (MTU) of the data packets for the interface device. These settings are optional. If you need to specify custom values for these fields, click on the '+' sign beside 'Advanced Settings' to expand the 'Advanced Settings' pane. Use custom MAC address - The appliance has the capability to automatically detect the MAC address of the device connected to the port specified and populates the same in the MAC address column. If you need to specify a different MAC address to override and replace the default MAC address of the external interface, select the ' Use custom MAC address' checkbox and enter the MAC address in the text box that appears below the checkbox. Concentrator name - Enter the identifier of the remote access concentrator setup by your service provider (Optional, usually not needed). Service Name - Enter the name of your ISP (Optional, usually not needed). Reconnection timeout - Specify the maximum time period (in seconds) that the uplink should attempt to reconnect in the event of a connection failure. The reconnection timeout period depends on the ISP configuration. If you are unsure, leave this field blank. MTU - Enter the Maximum Transmission Unit (MTU) of the data packets that can be sent over the network. Click 'Save'. Network configuration activities like date, time, type of event, subject id, component name and the event outcome are logged. 25

26 Tip: You can edit the network configuration e.g. for changing selected parameters like hostname or the network range of a zone, at any time depending on changes in your network. Click Network > Interface, click the 'Edit icon' in the 'Internet' row of the table, make the changes and save the changes. Configuring the trusted internal network zone like LAN The setup for internal network zone involves choosing the physical port to which the interface device for LAN is connected and then configuring network parameters and preferences for the same. To configure the internal network zone Click on the edit icon zone is plugged-in. in the row of the port to which the interface device for connecting to the LAN Zone - Select 'LAN' from the drop-down. The configuration options for the internal network interface device will appear: Device - The port to which the interface device is connected. The port is pre-selected. IP Address - Enter the IP address of the interface device, as pre-configured in the network Netmask - Choose the network mask containing the possible masks from the drop-down (e.g. / ) Add additional addresses - If additional IP address(es)/netmask(s) are to be added to the interface, 26
27 select the 'Add additional addresses' checkbox and enter the additional IP address(es)/netmask(s) of different subnets one by one. Hostname and Domainname - Enter the host name of your network server and the domain name of your network in the respective text fields Click 'Save'. A confirmation dialog will be displayed. Click OK. The appliance will restart for your settings to take effect. Network configuration activities like date, time, type of event, subject id, component name and the event outcome are logged. Tip: You can edit the network configuration e.g. for changing selected parameters like hostname or the network range of a zone, at any time depending on changes in your network. Click Network > Interface, click the 'Edit icon' in the 'LAN' row of the table, make the changes and save the changes. Configuring the DMZ interface The setup for the DMZ zone involves choosing the physical port to which the interface device for DMZ is connected and then configuring network parameters and preferences for the same. To configure the DMZ network zone Click on the edit icon zone is plugged-in. in the row of the port to which the interface device for connecting to the DMZ 27

28 Zone - Select 'DMZ' from the drop-down. The configuration options for the DMZ network interface device will appear: Device - The port to which the interface device is connected. The port is pre-selected. IP Address - Enter the IP address of the interface device, as pre-configured in the network Netmask - Choose the network mask containing the possible masks from the drop-down (e.g. / ) Add additional addresses - If additional IP address(es)/netmask(s) are to be added to the interface, select the 'Add additional addresses' checkbox and enter the additional IP address(es)/netmask(s) of different subnets one by one. Hostname and Domainname - Enter the host name of your network server and the domain name of your network in the respective text fields Click 'Save'. A confirmation dialog will be displayed. 28
29 Click OK. The appliance will restart for your settings to take effect. Network configuration activities like date, time, type of event, subject id, component name and the event outcome are logged. Tip: You can edit the network configuration e.g. for changing selected parameters like hostname or the network range of a zone, at any time depending on changes in your network. Click Network > Interface, click the 'Edit icon' in the 'DMZ' row of the table, make the changes and save the changes. Configuring the Wi-Fi interface The setup for the WiFi zone involves choosing the physical port to which the interface device for Wi-Fi is connected and then configuring network parameters and preferences for the same. To configure the Wi-Fi network zone Click on the edit icon zone is plugged-in. in the row of the port to which the interface device for connecting to the Wi-Fi 29

30 Zone - Select 'Wi-Fi' from the drop-down. The configuration options for the Wi-Fi network interface device will appear: Device - The port to which the interface device is connected. The port is pre-selected. IP Address - Enter the IP address of the interface device, as pre-configured in the network Netmask - Choose the network mask containing the possible masks from the drop-down (e.g. / ) Add additional addresses - If additional IP address(es)/netmask(s) are to be added to the interface, select the 'Add additional addresses' checkbox and enter the additional IP address(es)/netmask(s) of different subnets one by one. Hostname and Domainname - Enter the host name of your network server and the domain name of your network in the respective text fields Click 'Save'. A confirmation dialog will be displayed. 30
31 Click OK. The appliance will restart for your settings to take effect. Network configuration activities like date, time, type of event, subject id, component name and the event outcome are logged. Tip: You can edit the network configuration e.g. for changing selected parameters like hostname or the network range of a zone, at any time depending on changes in your network. Click Network > Interface, click the 'Edit icon' in the 'Wi-Fi' row of the table, make the changes and save the changes. 4 The Dashboard The Comodo Korugan Dashboard provides at-a-glance statistical summary of the current running status, health and usage status of the UTM in tiles layout. The Dashboard is displayed by default whenever you login to the administrative interface. To switch to Dashboard from a different configuration screen, select 'System' > 'Dashboard' from the left hand side navigation. The dashboard displays the front panel of the device model and five tiles to provide details on current hardware resource usage, system information, currently running services, network information and uplink status, using respective plug-ins added to the UTM. The device model panel indicates the connection status of the uplink, DMZ, LAN and WiFi network zone interface devices. Each tile can be expanded or collapsed by clicking the down arrow at the top left of it. 31
32 The tiles can be positioned as per the desired lay out by just dragging and dropping them to the desired position. The plugins can be configured for enabling/disabling them and to set the update interval of the information by clicking the Show Settings link at the top left of the interface. For more details on configuring the tiles, refer to the section Configuring the Dashboard Hardware Information The Hardware information tile shows the hardware resource usage statistics of the UTM appliance. CPU x: The usage of the CPU resources. In a multi-processor appliance, the load on each CPU is indicated separately, with the suffix 'x' denoting the CPU number. Memory - The usage of the system memory in the UTM appliance. Main disk - Usage of the root partition of the hard disk in the UTM appliance. The disk usage should not exceed 95%. Boot disk - Usage of the boot partition of the hard disk in the UTM appliance. The disk usage should not exceed 95%. Temp - Usage of disk space in /tmp partition, allotted for temporary files in the UTM appliance. The Temp space usage should not exceed 95%. Log - Usage of disk space allotted for log files in the UTM appliance. The log space usage should not exceed 95%. The log files are available at /var/logs. If the log space usage exceeds the threshold, the administrator can move the log files to a different storage device and free the disk space. Cache - Usage of disk space for cache memory in the UTM appliance. Tmp - Usage of disk space by.tmp files created in the appliance. System Information The System Information tile shows the host name and the network domain to which the UTM appliance is connected in its title bar. The tile displays the general information about the appliance connected. Appliance - Indicates the type of the appliance Device ID - The identification number of the appliance Version - The version number of the UTM firmware installed on the device Contract - Indicates whether the license of the firmware is valid. Clicking the circled arrow refreshes the information. Contract Valid Until - Expiry date of the license Uptime - Indicates the period for which the appliance is Up since the last reboot Services The Services tile shows the On/Off status and statistics of the services like Intrusion Detection, mail filters currently loaded to the appliance. Clicking on the Live Log in the title bar opens the Realtime logs screen. Clicking on the service name expands the pane below it showing the detailed statistics. The services displayed are: Attacks Logged - Shows the number of attacks logged by the UTM SMTP Proxy - Shows the statics of mails in queue, total mails received, clean mails and infected mails that were rejected HTTP/HTTPS Proxy - Shows the statics of cache hits and misses Network Interfaces The network interfaces tile shows statistics of the network interface devices connected to the UTM appliance and realtime updated graphical charts of incoming and outgoing traffic through these devices. 32
33 The table in the upper half of the tile displays realtime statics of each network device. Network Interfaces - Column Descriptions Column Header Device Description The name of the network interface device. The font color in which the name is displayed indicates the network zone to which the device belongs: Red - External network like WAN, for Internet connection Yellow - DMZ zone Green - Local network to which workstations are connected, like LAN Blue - Wi-Fi network Type The connection type of the device Link Link status of the device Status Running status of the device In/Out Incoming/Outgoing traffic through the device The lower half of the tile displays realtime graphical charts of the incoming and outgoing traffic through the devices selected from the list in the upper half. The administrator can select the devices to monitor the traffic through them by selecting the checkboxes beside the device names and deselect the others in the upper half. The lines are displayed in colors depending on the network zone to which the device belongs and the legend is shown at the top right of each graph. For more information on managing the network interface devices, refer to the section Network Configuration. Uplinks The Uplinks area displays a table of uplinks defined in the UTM appliance through which the appliance connects to Internet. The table shows the connection status and running status of each uplink and allows the administrator to enable or disable them. For more details on managing uplinks, refer to the section Managing Uplinks and VLANS. Uplinks - Column Descriptions Column Header Description Name The name of the uplinks defined in UTM. IP Address IP Address of the uplink Status Running status of the uplink. The status coulmn can have one of the following values: Stopped or Inactive - The uplink is not connected to UTM appliance Connecting - The uplink is connecting to the appliance, but connection is not yet complete Connected or UP - The connection has been established and operational. Disconnecting - The uplink is closing the connection Failure - The connection could not be completed Failure, reconnecting - The connection could not be completed, but the appliance is attempting to reconnect again. Dead link- The uplink is connected, but the defined hosts could not be reached. The uplink is not operational. Uptime The period for which the uplink is Up since the last reboot 33

34 Active Indicates whether the uplink is active. The administrator can switch the uplink between enabled and disabled states by selecting/deselecting this checkbox Managed Indicates whether the uplink is managed by UTM or manually managed. The administrator can switch the management states by selecting or deselecting the checkbox. In Managed mode, the uplink will be continuously monitored and reconnected whenever there is a loss in connection. During testing or maintenance, the uplink can be switched to manual mode. Clicking the circled arrow refreshes the information. Configuring the Dashboard Korugan uses dashboard plug-ins to fetch the statistical information from different components of the UTM and displays them as tiles in the dashboard. The plug-ins gather the updated information periodically at specified intervals. The administrator can configure the interval at which the statistical information from each component is fetched and enable/disable the plug-ins, and hence the corresponding tile, from the Dashboard settings pane. To open the Dashboard Settings pane Click 'Show Settings' link at the top left of the Dashboard. A table with a list of plug-ins used, their descriptions and the current configuration will be displayed. Dashboard Settings - Column Descriptions Column Header Description Name The name of the plugin Description A short description of the plug-in. Indicates the component of the UTM for which the plug-in fetches the information. Interval Enables the administrator to set the time interval at which the plug-in should refresh the information and show in the corresponding tile, be selecting the interval from the dropdown. Enabled The checkboxes enable the administrator to enable or disable the plug-in. Only the tiles corresponding to enabled plug-ins are displayed in the dashboard. If a tile needs to be hidden, the corresponding plug-in can be simply disabled. Set the refresh intervals and enabled/disabled states of the plug-ins as desired 34

35 Click 'Save' for your changes to take effect To close the settings pane, click 'Hide Settings' link at the top left. 5 Viewing and Modifying System Status and General Configuration The System interface acts as a high level management interface for the UTM appliance. The administrator can configure new networks, manage peer administrators, notifications, Secure Shell (SSH) access, GUI settings, can be schedule the periodical backup of the appliance state performed from the System interface and more. If needed, the administrator can shutdown the appliance only from the System interface, for management purposes. The System interface is displayed by default, whenever he administrator logs-in to the UTM admin console. To return to the System interface from a different interface, click the System tab from the left hand side navigation. The submenu containing options to access to different configuration screens under the system menu will open. The 'System' module contains the following screens for viewing and managing the general configuration of the UTM. The screens can be accessed by clicking the following options from the sub-menu under 'System'. Dashboard - Displays an at-a-glance statistical summary of the current running status, health and usage status of the UTM component. Refer to the section The Dashboard for more details. Administrators - Allows administrators to create role based administrative profiles with different privileges and enroll administrators for different roles. Refer to the section Managing Administrative Accounts for more details. Central Management - Allows administrators to manage multiple Korugan devices from a single interface. 35
36 Web Console - Opens a terminal window for administrative tasks. Refer to the section Accessing the Web Console for more details. SSH Access - Allows administrators to configure remote Secure Shell (SSH) access to the internal network by enabling tunneling of various services. Refer to the section Configuring SSH Access for more details. GUI Settings - Enables the administrator to select the interface language in which the administrative console. Refer to the section Configuring the GUI settings for more details. High Availability - Allows administrators to configure Active-Passive failover servers to ensure continuity of operations Firmware - Enables the administrator to view the version number of Korugan firmware and update the firmware, if updates are available. Refer to the section Viewing and Updating Firmware Version for more details. Backup - Enables the administrator to create a backup of the current state of the UTM appliance and to schedule periodical backups. In case of any abnormality or untoward incidents, the backups can be imported and applied to the device for restoring the device. Refer to the section Creating and Scheduling Backup of UTM state for more details. Shutdown - Enables the administrator to shut-down and power-off the UTM appliance, if required. Refer to the section Shutting Down the UTM appliance for more details. 5.1 Managing Administrative Accounts The global administrator can add and manage fellow administrators with different privilege levels for configuring and managing different modules of the UTM appliance. The fellow administrators will have access to different areas of the interface depending on the role assigned to them. Administrator activities are logged as part of access control. Logged items include date, time, type of event, subject id, component name and the event outcome. The 'Administrators' interface under the 'System' tab allows the global administrator to create administrative roles with different privileges and assign them to other administrators as required for the organization. To configure the administrators and roles Click 'System' > 'Administrators' from the left hand side navigation. 36
37 The interface contains two tabs: Administrators - Enables the global administrator to create and manage fellow administrator accounts. Refer to the section Adding and Managing Administrators for more details. Admin Profiles - Enables the global administrator to create and manage administrative roles with different privileges for assigning to fellow administrators. Refer to the section Managing Administrative Roles for more details Adding and Managing Administrators The Administrators interface displays the list of administrators that were added to the appliance and allows the global administrator to create new administrators and manage existing administrators. Comodo Korugan ships with a default global administrative account with the username 'admin', password 'comodo' and with the 'super admin' role. The account cannot be deleted, but can be edited to change the username and password, as at least one super admin account must be active on the appliance. Tip : Please choose strong passwords at least 8 characters long and which contains a mixture of uppercase and lowercase letters, numbers and special characters. Tip: We advise most operations should be carried out using created accounts rather than the default, built-in account. This will allow you to manage authorizations more efficiently. To open the 'Administrators' interface Click 'System' > 'Administrators' from the left hand side navigation. Click the 'Administrators' tab 37

38 Administrators List Table - Column Descriptions Column Description Name The first/given name of the administrator Surname The last name of the administrator Username The username for the administrator to login to the Korugan administrative console The address of the administrator Profile The administrative role assigned to the administrator. The administrator will have access to different interfaces of the console depending on the role assigned. Actions Displays control buttons for editing/removing the administrator. - Edits the administrator - Removes the administrator The following sections provide detailed guidance on: Adding a new administrator Editing an existing administrator Removing an administrator Tip: It is recommended to first create the administrative role(s) before adding administrators. All the created administrative roles will be available for assigning to the administrator added from a drop-down. Refer to the next section Managing Administrative Roles for more details on adding roles. To add a new administrator account Click the 'Add an Admin' link from the top left of the 'Administrator List' interface. The interface for adding a new administrator will appear. 38

39 Enter the details of the new administrator as given below: Admin Name (username): Enter the username for the new administrator to login Name: Enter the first name of the administrator Surname: Enter the last name of the administrator Enter the address of the administrator Password: Enter the password for the administrator to login and re-enter the same for conformation in the 'Retype Password' field Profile: The drop-down will display a list of administrative roles you created from the 'Admin Profiles' interface. Choose the role to be assigned to the administrator from the drop-down. Click 'Add'. The administrator will be added to the appliance and can login to the administrative interface. The global administrator needs to communicate the login credentials to the new administrator through any out-ofband communication like to enable the new administrator to login. To edit an administrator Click the 'Edit' button in the row of the administrator to be edited. The interface for editing the details, changing the username and password and /or changing the role of the administrator will appear. 39

40 The Edit interface is similar to 'Add Administrator' interface. Edit the details as required and click 'Update'. Refer to the section above for more details For changing the password, it is essential to enter the existing password in the 'current password' field. To remove an administrator Click the 'Delete' button removed immediately. in the row of the administrator to be removed. The administrator account will be Managing Administrative Roles The 'Admin Profiles' interface displays a list of administrative roles with different privileges for accessing the configuration modules of the UTM appliance. The global administrator can create and manage new roles with granular configuration of modules and options accessible and configurable by each admin profile. Comodo Korugan ships with a default administrative role 'super admin' for the global administrator. The profile cannot be edited and deleted, as at least one super admin account must be active on the appliance. To open the 'Admin Profiles' interface Click 'System' > 'Administrators' from the left hand side navigation. Click the 'Admin Profiles' tab 40

41 Admin Profiles Table - Column Descriptions Column Description Profile Name The name of the administrative role for identification Comments A short description of the role as entered during its creation Actions Displays control buttons for editing/removing the admin profile. - Edits the profile - Removes the profile Note: Role management activities like adding, editing and removing profiles are logged. Items logged are, date, time, type of event, subject id, component name and output of the event. Role management is a part of access control. The following sections provide detailed guidance on: Adding a new admin profile Editing an admin profile Removing an admin profile To add an admin profile Click the 'Add a Profile' link from the top left of the 'Admin Profiles' interface. The interface for adding a new profile will appear. 41
 for all modules.")
42 Enter the details of the new admin role as given below: Profile Name: Enter a name to identify the profile role Comment: Enter a short description of the new role Access Right Control: Select the modules accessible and options configurable by the administrators assigned with the new role. The default is 'None' (no access) for all modules. To provide full access to all modules, select the 'Read-Write' checkbox. Use the radio buttons underneath the checkbox to enable this privilege on a per-module basis. To provide read-only access to all modules, select 'Read-Only' checkbox. Use the radio buttons underneath the checkbox to enable this privilege on a per-module basis. To block access to all modules, select the 'None' checkbox. Use the radio buttons underneath the checkbox to block access on a per-module basis. You can expand each module by clicking the arrow next to the module label. This allows you to define even more granular access rights: 42


43 Click 'Add' to save the new role The new role will be available for selection while adding a new administrator or editing an existing administrator. To edit an admin profile Click the 'Edit' button in the row of the admin profile to be edited. The interface for editing the details and changing the privileges will appear. 43

44 The Edit interface is similar to 'Add Admin Profile' interface. Edit the details as required and click 'Update' for your changes to take effect. Refer to the section above for more details To remove an admin profile Remove the profile from the administrators to whom it was applied from the Administrators interface by editing the administrator. Refer to the explanation of editing an administrator in the section Adding and Managing Administrators for more details. Click the 'Delete' button in the row of the admin profile from the Admin Profiles interface. The role will be 44
45 removed immediately. 5.2 Central Management Korugan Central Manager allows administrators to manage multiple Korugan devices from a single interface. This section allows you to register your Korugan appliance with Korugan Central Manager. Once registered, you can use the Central Manager interface to monitor Korugan features such as firewall policy, antivirus, intrusion prevention, gateway anti-spam, website filtering, traffic monitoring, VPN, DNS and proxy servers. Prerequisite Please ensure you have downloaded and set up Korugan Central Manager before enabling the service. Please contact your Comodo account manager if you do not yet have this software. Register your appliance with Korugan Central Manager: Click 'System' > 'Central Management' Toggle the 'Enable CM Client Service' to 'On'. 45
46 Enter IP the address of Korugan Central Manager in the 'Server IP' field. Create a pre-shared key. The key should be a string of characters defined by the admin arbitrarily. Choose a key at least 8 characters long and containing a mixture of uppercase and lowercase letters, numbers and special characters. You will need to enter this key in the Korugan Central Manager interface to authenticate your appliance. Type your organization name and optionally add any comments in the 'Description' field. Click 'Connect'. Next, go to the Korugan Central Manager interface. You should see your Korugan appliance attempting to connect. Enter the pre-shared key you created earlier. After successful authentication, Korugan CM will monitor the activities of your Korugan appliance. 5.3 Accessing the Web Console Comodo Korugan provides the convenience of executing the administrative tasks through the command line interface (CLI). The global administrator or the administrator that has the Shell access can access the CLI and execute the commands for managing and configuring the UTM. Note: Misuse of the web console could risk the security of your operations. Access to the console should be provided with caution because it allows access to information and assets inaccessible via Korugan's GUI interfaces. To access the CLI Click 'System' > 'Web Console' tab from the left hand side navigation 46

47 A command line interface, resembling a Linux Terminal window, will open inside the browser window. The CLI connects with the provides the UTM and indicates the connection status at the bottom left. The administrator can enter the commands for management and configuration of the UTM. The CLI also provides a virtual keyboard for secure input of the configuration data to the console. To use the virtual keyboard Click the Enable virtual keyboard link at the bottom right. 47

48 A keyboard will be displayed beneath the console for entering the commands To disconnect the CLI console Type 'Exit' and press Enter. The console will be disconnected from the UTM and the status at the bottom left will change to 'Disconnected'. Tip: You can temporarily disable the input to the console from your physical keyboard by clicking the Disable input link at the bottom left. To re-enable the input, simply click the Enable input link at the same spot. This will not apply to the virtual keyboard. 5.4 Configuring SSH Access The SSH access interface allows the administrator to enable remote SSH access to the UTM appliance and thereby to enable access from clients in external network to the clients connected to local network and running any service that can be tunneled through SSH, like Telnet. Note: SSH access grants access to important information and configuration data which are inaccessible via Korugan's GUI interfaces. Administrators should provide SSH access and authorization with caution. To access the SSH access interface, Click 'System' > 'SSH access' from the left hand side navigation. 48

49 Secure Shell Access Settings: Enable Secure Shell Access - Allows you to enable/disable the SSH access. Support SSH protocol version 1 - Select this option only if you are using old SSH client that do not support the newer versions of the SSH protocol. Allow TCP forwarding - Select this option to allow other protocols like TCP to tunnel through SSH. Allow password based authentication - Select this option if you plan to use password type authentication for administrators logging-in to the UTM administrative console through SSH access. The password can be specified in the Change SSH Access Password field. Allow public key based authentication - Select this option if you plan to use public key type authentication for administrators logging-in to the UTM administrative console through SSH access. As a prerequisite, The public keys need to be added to the file /root/.ssh/authorized_keys. 49
 - The password for the administrator that can login to the shell for administration. Logins can be made either via the serial console, or remotely with an SSH client.")
50 Select the required options and click 'Save' for your configurations to take effect. Change SSH Access Password The administrator can specify the password for SSH access from external network. SSH Password (root) - The password for the administrator that can login to the shell for administration. Logins can be made either via the serial console, or remotely with an SSH client. Enter the password and confirm the same in the required boxes and click 'Change password' for the new password to take effect. Note: Passwords should be at least eight characters long and not easily guessed. They should contain a mixture of upper and lower case letters, numbers and special characters. SSH host keys The SSH host keys table displays a list of public SSH host keys of the UTM Appliance, generated during the initial connection of the openssh server, along with their fingerprint and key size in bits. Note: For a client to be accessible from an external network through SSH access, the client needs to be reachable from the external device. You can create a firewall rule under Firewall > System access to allow access to the client from the external device. Refer to the section Configuring System Access for more details. 5.5 Configuring GUI Settings The GUI settings interface allows you to select the interface language and modify the information which is shown in the interface. To access the interface, Click 'System' > 'GUI settings' from the left hand side navigation. Choose the language in which you wish the graphical user interface of the administrative console is to be 50

51 displayed from the 'Select your language' drop-down. Display hostname in window title - The hostname of the UTM appliance is displayed in the title bar of the browser window in which the administrative console is opened. De-select this option if you do not want the host name to be displayed. Click 'Save' changes for your configuration to take effect. 5.6 High Availability The high availability section allows you to configure an 'Active-Passive' failover formation for your Korugan appliance. This helps ensure continuity of operations and avoids a single point of failure. To configure the feature, you need to specify the IP address of a second Korugan appliance. Once set up, the slave Korugan server will take over operations should the master server fail. The two devices share a virtual IP address. To enable High Availability Click 'System' > 'High Availability' Toggle the 'Enable High Availability Service' switch to 'On': 51
52 Enter your 'Remote LAN IP'. For example, if two Korugan devices, 1 ( ) and 2 ( ), share a remote LAN IP address such as , you need to enter this address in both master and slave Korugan devices. The IP address is directed to device 1 ( ) and during fail-over is redirected to device 2 ( ). Enter 'Remote SSH Root Password' to provide secure remote login over an unsecured network. Click 'Generate' to establish connection to the slave Korugan device and thus provide high availability. 5.7 Viewing and Updating Firmware Version The Firmware screen displays the version number of the firmware installed on the UTM appliance and its update status. Also, if an new version is available, the administrator can initiate the update process. To access the 'Firmware' interface, click 'System' > 'Firmware' from the left hand side navigation. 52

53 Version - Shows the version number of the Comodo Korugan Firmware installed on your UTM appliance Status - Indicates whether your firmware is up-to-date. If it indicates 'System must be updated', you can initiate the update process by clicking the Update Firmware button. The firmware will be automatically downloaded and installed. 5.8 Creating and Scheduling Backup of UTM State Comodo Korugan enables the administrator to create backups of the state of the UTM appliance including the configuration settings, logs and database dumps at various time points. If the administrator wants to rollback the state of the appliance to any of the previous time point in case of any malfunction or wrong settings made, the selected backup can be restored and applied. If needed, the administrator can also restore the appliance to the factory default settings and reconfigure the appliance from the scratch. The backups can be manually created at any required time or scheduled for creation at set intervals. The backups can be encrypted, stored locally on the UTM Appliance, on a USB stick or can be ed for storage in a remote location. To open the Backup interface Click 'System' > 'Backup' from the left hand side navigation 53

54 The Backup interface displays a list of backups created so far under 'Backup sets' and allows the administrator to export the backups to desired location for archiving, remove backups and restore a selected backup to rollback the appliance to the respective time point. If the USB drive in which the previous backups are stored in plugged-in to the appliance, the back-ups stored in it are also displayed in the list. Backup Sets - Column Descriptions Column Header Description 54
55 Creation date Precise date and time at which the backup was created Content Displays the components of the appliance state, contained in the backup, its history and errors, if any, occurred during backup creation. The legend is given below: Charact Expansion er Description A Archive Contains archived log files C Chronologic The backup was created automatically by the schedule al D Database dumps Contains database dumps E Encrypted The backup was encrypted L Log files Contains log files S Settings Contains configurations and settings U USB The backup is stored in the USB drive! Error The backup operation failed Remark A short description entered by the administrator during backup creation Actions Displays control buttons for exporting, deleting and restoring the backups - Exports the backup so that the backup can be saved in the local storage of the computer from which the administrative console is accessed - Deletes the backup -Restores the backup and rollbacks the appliance to the respective time point. The following sections explain in detail on backup tasks: Manually creating a backup Scheduling backup operations Exporting a backup Importing a backup from an archive Rolling back the appliance to a previous time point Resetting the appliance to factory defaults Manually Creating a Backup The administrator can create backup at any desired time, for example, before making a critical configuration change to roll back the appliance, just in case the new configuration creates any glitches. The backup can be configured for inclusion of the components and can be stored either locally in the appliance or in a USB drive. Tip: To create a store the backup on a USB drive, plug-in the USB drive to the appliance. To create a backup 55

56 Open the Backup interface by clicking 'System' > 'Backup' from the left hand side navigation Ensure that the Backup tab is open Click the 'Create new backup' link above the list of backups The 'Create new Backup' pane will open. Choose the components to be included in the backup: Current configuration - Includes the current configuration of the appliance in the backup. Deselect the checkbox if you do not want the current configuration to be backed up. Include database dumps - Adds the UTM database content and logs to the backup. Deselect the checkbox if you do not want these components to be included. Enter a short description or remark for the backup in the text box. This description will appear in the 'Remark' column in the list of backup archives. If you want to store the backup in a USB drive ensure that you have plugged-in the USB drive to the appliance. A new option 'Create Backup on USB Stick' will appear below the 'Remark' text box. Select the 56
57 option to save the backup to the USB drive. Click 'Create Backup'. The backup will be created and added to the list of backups. If encryption is enabled, the backup file will be encrypted and saved. Refer to the section Encrypting Backup Archives for more details Scheduling Backup Operations The administrator can configure scheduled backup operations to automatically create backups at selected periodical intervals. The backups can be configured to be stored locally or to be ed to a specified address for storing the backup archive at a remote location. To create a backup schedule Open the Backup interface by clicking 'System' > 'Backup' from the left hand side navigation Click the 'Scheduled backups' tab to open Scheduled backups interface 57
58 Scheduled automatic backups Configure the scheduled backup job under the Scheduled automatic backups Enabled - Select this check box to activate the backup schedule Current Configuration - Select this option if you want the configuration at the time of creating the backup to be included in the backup Include database dumps - Adds the UTM database content and logs to the backup. Deselect the checkbox if you do not want these components to be included. Keep # of archives - Select the number of previous scheduled backup archives that the UTM should retain, from the drop-down. The backup archives older than these will be deleted, whenever a new backup is created. Schedule for automatic Backups - Select the time interval for creating the automated backups: Hourly - The backups will be created at every first minute of an hour Daily - The back up will be created at 01:25 am everyday Weekly - The back up will be created at 02:47 am on Sunday everyweek Monthly - The back up will be created at 03:52 am on first day of every month Click Save for your configuration to take effect. Send backups via Configure the options if you wish the backup archives to be sent to a specified address. The backup archives will be sent as attachments. The log file archives will be excluded from the backup archives. Enabled - Select this check box to receive backup archives through s address of recipient - address to which the backup archives are to be sent address of sender - account from which the s are to be sent. This can be same as the recipient Address of smarthost to be used - The IP address of the SMTP server to send the s Click Save for your configuration to take effect To test the backup operation, click 'Send a backup now'. A backup of the current state of the UTM appliance will be created and sent to the specified address. Encrypting Backup Archives Comodo Korugan can encrypt and store the backup archives created on both manual backup operation and scheduled backups using a GNU Privacy Guard (GPG) public key. The administrator can choose the encrypt the backup archives containing sensitive configurations like passwords. Note: Before configuration for backup encryption, ensure that the GPG public certificate is available in the local storage of the computer from which the administrative console is accessed. To configure for encrypting backups Open the Backup interface by clicking 'System' > 'Backup' from the left hand side navigation. Ensure that the Backup tab is open. Configure the encryption options under 'Encrypt backup archives with a GPG public key'. 58

59 Encrypt backup archives - Select this option to encrypt the backup archives Import GPG public key - Click 'Browse' and navigate to the location where the public key is stored in the local computer and clock 'Open' in the 'Choose file to upload' dialog. Click 'Save' to upload the public key and save the configuration Exporting a backup The backup archives stored in the UTM appliance and the USB drives can be exported and saved in the computer from which the administrative console is accessed. The administrator can store important backup archives with different configurations in a specified workstation, so that the appliance can be restored to the required configuration, even in the case where the backup archives stored in it were accidentally deleted. Refer to the section 'Importing a Backup' for more details on importing a backup archive from the computer to the appliance and the section 'Rolling Back the Appliance to aprevioustime Point' for restoring the appliance using the backup archive. Note: To store a backup archive from a USB drive in the local workstation, the USB drive should have been plugged-in to the appliance for the archives in it to be listed in the Backup interface. To export a backup archive Open the Backup interface by clicking 'System' > 'Backup' from the left hand side navigation. Ensure that the Backup tab is open. The list of available backup archives is displayed with their details and control buttons under Backup sets. If the USB drive containing backup archives is plugged-in to the appliance, the backups stored in it are also displayed. Click the Export button displayed. in the row of the required backup archive. The File Download dialog will be 59

60 Click 'Save', navigate to a safe location in your hard drive and click 'Save' in the 'Save As' dialog. The backup archive will be saved in.tar.gz archive file format with the default file name 'backup-<time stamp><hostname of the appliance>-<component1 in backup>-<component 2 in backup>.tar.gz'. The time stamp that indicates the time point at which the backup was created is of the format YYYYMMDDHHMMSS Importing a Backup Archive from a Local Computer The exported backup archives, exported from the administrative console and stored in a local computer through which the console is accessed, can be imported into the console for rolling back the appliance to the respective time point. Refer to the section Exporting a backup for more details on storing a backup archive from the console to the local computer. To import a backup archive Login to the Comodo Korugan administrative interface from the computer in which the backup is stored Open the Backup interface by clicking 'System' > 'Backup' from the left hand side navigation. Ensure that the Backup tab is open. Click 'Browse' next to File under 'Import backup archive', navigate to the location where the backup is stored, select the backup and click 'Open' in the 'Choose file to Upload' dialog. Enter a short description or remark for the imported backup in the 'Remark' text box. This description will appear in the 'Remark' column in the list of backup archives. Click 'Import' to save the backup archive in the appliance. On completion of import operation, the backup archive will be added to the list of backup archives under Backup Sets and will be available for restoring and rolling back the appliance to the respective time point. Refer to the 60

61 section Rolling Back the Appliance to a Previous Time Point for more details on this Rolling Back the Appliance to a Previous Time Point The backup archives enable the administrator to rollback the state of the appliance to any of the previous time point in case of any malfunction or wrong settings made. Restoring a backup from the Backup interface automatically applies the configuration contained it and restarts the appliance to roll back the appliance to the respective time point. To restore a backup Open the Backup interface by clicking 'System' > 'Backup' from the left hand side navigation. Ensure that the Backup tab is open. The list of available backup archives is displayed with their details and control buttons under Backup sets. If the USB drive containing backup archives is plugged-in to the appliance, the backups stored in it are also displayed. Click the 'Restore' button Click OK in the confirmation dialog. in the row of the required backup archive. A Confirmation dialog will appear. Comodo Korugan will be applied with the configurations as contained in the selected backup and the database dumps and log files will be replaced with those in the backup and the UTM will restart with the state at the time point at which the backup was created Resetting the Appliance to Factory Defaults If the administrator wants to clear all the configuration data, database dumps and the logs or in case of any abnormality in operation due to wrong configuration settings, the UTM appliance can be reset to factory settings and rolled back to a state it which it was newly purchased. Resetting the appliance clears all the configuration data and the stored passwords and restores the default credentials. The administrator needs to reconfigure the administrative console login credentials, network connections and so on from the scratch. Note: As a fail-safe measure, the appliance creates a backup of the current state before resetting to factory defaults. To reset the appliance Open the Backup interface by clicking 'System' > 'Backup' from the left hand side navigation. Ensure that the Backup tab is open. Click the Factory defaults button under 'Reset configuration to factory defaults and reboot'. A confirmation 61
62 dialog will appear. 5.9 Click OK in the dialog. The appliance will be reset and restarted with the default factory settings. Shutting Down the UTM Appliance The administrator can shutdown or reboot the appliance for various reasons like the UPS power going low or the operation of the device going unstable. To shutdown or Reboot the appliance Open the Backup interface by clicking 'System' > 'Backup' from the left hand side navigation. To shutdown the appliance, click 'Shutdown'. Caution: The appliance will be shutdown immediately without any confirmation dialog. You can only shutdown the appliance from the web console, but cannot start the appliance from the console. You can switch on the device only by pressing the power switch at the appliance. To restart the appliance, click 'Reboot'. The appliance will start rebooting immediately. After the restart, the appliance will automatically connect to the administrative console and can be accessed without the need to login again. Shutdown and reboot activities are logged. Logs include date, time, type of event, subject id, component name and outcome of the event. 6 Viewing UTM Appliance Status The 'Status' module displays the statistical details and status information of various components of the network, like system status, network status, network connections, realtime graphical representations of the network traffic and the mail statistics. 62

63 The 'Status' module contains the following screens for viewing the status details and the network traffic. System Status - Displays the statistics of the current running state of the appliance like services loaded, memory usage, disk usage and so on. Refer to the section System Status for more details. Network Status - Displays the network statistical data like active interfaces, NIC status and so on. Refer to the section Network Status for more details. System Graphs - Displays real-time graphical representations of the usage status of the system resources like CPU, physical memory, disk space and so on. Refer to the section System Usage Summaries for more details. Traffic Graphs - Displays real-time graphical representations of the data traffic through different network zones like external zone, internal or local network zone, DMZ and so on. Refer to the section Network Traffic for more details. Connections - Displays a table shows the connections to, from and through the UTM appliance with their source, destination, protocol and status. Refer to the section Network Connections for more details. SSL VPN Connections - Displays the users that have connected through SSL VPN along with the currently running VPN services. Refer to the section SSL VPN Connections for more details. 6.1 System Status The System Status screen displays the running status information like loaded services, loaded modules usage of resources like physical memory, disk space and so on, of the UTM appliance. The screen displays the following information panes one below the other: 63


64 Services - Shows the services that are currently loaded to the UTM appliance and their running status Memory - Shows the usage status of system memory Disk Usage - Shows the usage status of hard disk space Uptime and Users - Shows how long the appliance is running from the last start time and the users that are currently logged-in to the system Loaded Modules - Shows the kernel modules currently loaded into memory Kernel Version - Shows current kernel version number The administrator can navigate to the required pane by clicking the shortcut links at the top of the screen. Services The 'Services' pane shows a list of services that are currently loaded to the UTM appliance and whether they are running or stopped. A service may be stopped if the corresponding daemon or script is not enabled. Memory 64
65 The memory pane shows the usage status of the physical memory in the appliance. Memory Usage - Row Descriptions Row Description RAM Shows the total RAM size, used memory size, free available memory size in KB and a bar indicating in the memory usage in percentage. It can be close to 100% if the appliance is running for long time since the Linux kernel uses all available RAM as disk cache to speed up I/O operations. =/- buffers/cache Shows the size of memory actually used by currently running processes. The memory used by processes should not exceed 80% of the total memory, otherwise, the active processes will be swapped to disk, which will reduce the performance of the system. If the memory usage exceeds the threshold for long periods of time RAM should be added to maintain the system performances. Swap Shows the memory dedicated for swapping services/processes and its usage status. The average swap usage will be below 20%, if not all the services are used all the time. Disk usage The 'Disk Usage' pane shows the hard disk drives/ partitions mounted on the appliance, their mount point and the space of each disk partition similar to the output of Linux Disk Free (df) command. Disk Usage - Column Descriptions 65
66 Column Device Description The disk device or partition for various UTM modules. Examples: The main disk (/dev/sda1). The boot disk (/dev/sda1 /boot) The data disk (/dev/mapper/local-var). The temporary file system (/tmp) the log partition (/var/log). Mounted on The mount point of the partition. Size The total size of the partition. Used Used space in the disk Free Free Space in the disk Percentage The usage of the disk space in percentage The used space in partitions that store the data and the logs grow over time. It is recommended to ensure that their usage does not exceed 95% to maintain the efficiency of the system. Uptime and users The 'Uptime and Users' pane indicate the period for which the UTM appliance is continuously running from the last boot time and the list of users that are currently logged-in. The first line displays the following items in order: Current time The period for which the UTM appliance is up and running from the last boot time The number of users currently logged into the system The average load on the system for the past 1, 5 and 15 minutes. Following the first line, a table displays the details of the currently logged-in users. Users - Column Descriptions Column Description USER The username/type TTY The name of the terminal from which the user is connected FROM The remote host name from which the user is connected LOGIN@ The date and time at which the user logged-in to the system, for the current session IDLE The period for which the user is idle JCPU The time spent by the processes initiated by the terminal through which the used has connected to the system, excluding the past background jobs. However, it includes the 66
67 background jobs that are currently running. PCPU The time spent by the currently running processes, initiated by the actions listed under 'What' column. WHAT Shows what the user is doing. Loaded modules The 'Loaded Modules' pane displays the Kernel modules that are currently loaded to the system. Loaded Modules - Column Descriptions Column Description Module The name of the module Size Size of the module Used by Number of times the module is used and the parent modules that referred this module Kernel version The Kernel version pane displays the version number of the kernel currently used. 67
68 6.2 Network Status The Network Status screen displays real-time logs containing status information about components like connected Network Interfaces, Network Interface Controllers (NICs), routing table entries and address Resolution Protocol (ARP). The screen displays the following information panes one below the other: Interfaces NIC Status Routing Table Entries ARP Entries Administrators can navigate to the required pane by clicking the shortcut links at the top of the screen. 68

69 Interfaces The 'Interfaces' pane displays a list of all network interfaces connected to the appliance along with their associated MAC address, IP address, and additional communication parameters. Example connected interfaces can include Ethernet interfaces, bridges or virtual devices. The interfaces that are active are indicated by colors, corresponding to the network zones that that serve: Red - External network zone like WAN connected to Internet Yellow - DMZ zone Green - Internal network like Local Area Network (LAN) Blue - Wi-Fi zone NIC Status The 'NIC status' pane displays Network Interface Controllers (NICs) connected to the appliance along with their current configuration and capabilities. 69

70 Routing Table Entries The Routing Table Entries pane displays a list of routes configured for the network interfaces. Each line shows the traffic route within the corresponding network zones for the interface shown in the last column. Routing Tables Entries - Column Descriptions Column Description Destination The destination network or the host Gateway The gateway address. ('*' if none is set) Genmask The network mask of the destination network. The possible values are: Flags for a host destination for the default route. Displays the flags indicating the status. The possible values are: U - The route is up and operational. H - The route is to a specific host (not to a network). G - The route uses an external gateway R - The route was installed by a dynamic routing protocol running in the system, using the reinstate option D - Th route was dynamically installed by daemon or redirect 70
71 M - Modified by routing daemon or redirect A - The route is a cached one, and has an associated entry in the ARP table C - The route was from a Kernel routing cache L - The route is a local route B - The destination of the route is a broadcast address I - The route has a loopback interface! - The route will be rejected Metric Indicates the distance to the target (in hops). Ref Indicates the references made to this route Use The number of lookups made for this route Iface The network interface to which the packets are to be sent. ARP Entries The 'Address Resolution Protocol' (ARP) table shows a list of the physical (MAC) addresses which are associated with IP addresses in the local network. ARP Entries - Column Descriptions Column Description Address The IP address of the host destination network or the host or other hardware device HWtype The type of the hardware device HWaddress The MAC address of the hardware device Flags_Mask Displays the flags indicating the status of the device. The possible values are: Iface 6.3 C - Complete P - Published M - Permanent The interface to which the packets are to be sent. System Usage Summaries The System Graphs screen displays the usage history of system resources such as CPU, system memory, swap memory and disk drives for the past 24 hours. 71

72 Clicking any graph will open more detailed graphs for that component showing usage history for the past day, week, month and year. CPU Graph Memory Graph Swap Graph Disk Graph CPU Graph The CPU Graph displays the load on the appliance CPU over the past 24 hours. Processes are indicated with different colors. Green - Idle, CPU was not used by any of the processes Blue - User initiated processes, run with default priority Red - System processes 72


73 The table below the graph shows the maximum, average and current load of the CPU for the past day from various processes. Clicking the graph opens a new page with detailed CPU usage history graphs for the past day, week, month and year. Memory Graph The Memory Graph shows memory usage over the past 24 hours. The different types of memory are indicated with different colors. Blue - Memory used by running processes Red - Memory shared by concurrently running processes Pink - Buffered memory space used for temporarily storing data received from or sent to external devices Yellow - Cached memory, used for storing recent data used by running processes Green - Free, unallocated memory The table below the graph shows statistics of maximum, average and current usage of system memory for the past day. Clicking the graph opens a new page with detailed memory usage history graphs for the past day, week, month and year. Swap Graph 73

74 The Swap Graph shows the usage of the swap area in the hard disk, used for storing data from inactive processes, from the system memory. Different types of swap spaces are indicated with different colors. Blue - Used swap space Green - Free swap space The table below the graph shows statistics of maximum, average and current usage of swap space for the past day. Clicking the graph opens a new page with detailed usage history graphs for the past day, week, month and year. Disk Graph The Disk Graph shows disk access levels over the past two days. Green - Percentage of sectors accessed for writing into the disk Blue - Percentage of sectors accessed for reading from the disk The table below the graph shows maximum access, average access and current usage of the disk space over he past two days. Clicking the graph opens a new page with detailed access history graphs for the past day, week, month and year. 6.4 Network Traffic The Network Traffic Graphs screen shows the amount of data passing through different network zones (LAN, DMZ, Wi-Fi and external network zone). The number of graphs shown on this page depends on number of network zones configured in the UTM appliance. 74
.")
75 Selecting a graph opens a new page with more detailed graphs showing the data traffic for the past day, week, month and year. LAN Graph WIFI Graph DMZ Graph Uplink Graphs LAN Graph The LAN Graph shows the data traffic passing through the Local Area Network (LAN). The oncoming and outgoing traffic are indicated with different colors. Green - Incoming traffic Blue - Outgoing traffic 75

76 The table below the graph shows statistics of maximum, average and current data traffic through the local network for the past day. Clicking the graph opens a new page with detailed traffic statistics for the past day, week, month and year. WIFI Graph The WiFi Graph shows the data traffic through the Wi-Fi network zone defined in your network. Note: The WiFi Graph will be displayed only if you have a WiFi network zone configured in your network. The oncoming and outgoing traffic are indicated with different colors. Green - Incoming traffic Blue - Outgoing traffic The table below the graph shows statistics about the maximum, average and current data traffic through the WiFi network zone for the past day. Clicking the graph opens a new page with detailed traffic statistics for the past day, week, month and year. DMZ Graph The DMZ Graph shows the data traffic through the DMZ network zone defined in your network. Note: The DMZ Graph will be displayed only if you have a DMZ network zone configured in your network. 76

77 The oncoming and outgoing traffic are indicated with different colors. Green - Incoming traffic Blue - Outgoing traffic The table below the graph shows statistics for maximum, average and current data traffic through the DMZ network zone for the past day. Clicking the graph opens a new page with detailed data traffic statistics graphs for the past day, week, month and year. Uplink Graphs The Uplink Graph(s) show the traffic through external network zones, such as WANs, which are connected to the Internet. Note: If you have more than one uplinks configured for your network, separate graphs will be displayed for each uplink. Incoming and outgoing traffic are indicated with different colors. Green - Incoming traffic Blue - Outgoing traffic 77

78 The table below the graph shows statistics for maximum, average and current data traffic through the zone for the past day. Clicking the graph opens a new page with detailed traffic graphs for the past day, week, month and year. 6.5 Network Connections The Connections interface displays a list of current network connections to, from and through the UTM appliance with their source, destination, protocol and status. The background colors in the cells of the table depict the source and destination of the connection. Green - Indicates LAN connections Red - Indicates Internet connections Orange - Indicates DMZ connections Blue - Wireless connections Black - Indicates firewall connections, including daemons and services such as SSH or web access Purple - Indicates VPN or IPsec connections 78

79 IP Table Connections - Column Descriptions Column Description Source IP Displays the IP from which the connection originated. Source Port Displays the port number from which the connection originated. Destination IP Displays the IP to which the connection is directed. Destination Port Displays the port number to which the connection is directed. Protocol Displays the type of connection. Typically either TCP or UDP Status Indicates the current status of the connection (only for TCP). The status will be either Established (active connection) and Closed (connection closed). Expires Indicates the time the connection will remain in the same status. 6.6 SSLVPN Connections Administrators can configure the UTM appliance to allow OpenVPN clients in external networks to connect to internal network zones, and as an OpenVPN client for gateway to gateway connections to external PoenVPN servers. For more details on configuring OpenVPN connections and user accounts, refer to the sections OpenVPN Server and OpenVPN Client. The OpenVPN connections screen displays a list of active connections from external clients that are connected to the OpenVPN server configured in the UTM appliance. The interface also provides other details such as since when the connections is established, how long the connection is up and more. Administrators can also terminate unwanted VPN connections. 79
80 Open VPN Server Connection status and control table - Column Descriptions Column Description User The user name of the account with which the client has logged-in to the server Assigned IP The IP address dynamically assigned to the client from the server during the current session Real IP The original externally facing IP address of the client RX / TX Displays the data transmitted and received by the server to client during the current session Connected since The date and time from which the current session is active Uptime The period for which the current session is active Actions Displays control buttons for terminating the session. - Enables to stop the connection. 80
 Adding and managing hosts for local domain name resolution Adding and managing routing entries for static routing and")
81 7 Network Configuration - Advanced Settings The 'Network' module enables the administrator to perform advanced network configuration tasks such as: Carry out basic network configuration for the UTM appliance Adding new fail over uplinks and virtual local area networks (VLANS) Adding and managing hosts for local domain name resolution Adding and managing routing entries for static routing and policy routing Clicking the 'Network' tab from the left hand side navigation opens a sub-menu containing options to access to different configuration screens under the Network menu. The Network module has the following sub tabs: Interfaces - Enables the administrator to carry out create and edit the basic network configuration and interface devices, add uplinks to the appliance for fail-over and to configure Virtual Local Area Networks (VLANs). Refer to the chapter Configuring Interface Devices, Uplinks and VLANs for more details. Edit Hosts - Enables administrators to add and manage hosts and to map host names and IP addresses for address resolution. Refer to the section Adding and Managing Hosts for more details. Routing - Enables administrators to create custom routes for the appliance to connect to other networks through other devices like external routers or VPN tunnels. Refer to the section Routes for more details. 81
82 7.1 Configuring Interface Devices, Uplinks and VLANs The 'Interfaces' screen under the 'Network' module allows administrators to add and edit the interface devices for connecting to different network zones, add more uplinks to the appliance for fail-over and to configure Virtual Local Area Networks (VLANs). The interface contains three tabs: Network Configuration - Displays the interface devices connected to the physical ports of the appliance with their configuration details and connection statuses. The administrator can perform initial network configuration upon connecting the appliance to the network for the first time and edit the configuration parameters as and when any network interface device is newly connected or replaced and there is a change in the network setup and infrastructure. Refer to the chapter Network Configuration for more details. The interface also allows the administrator to configure additional gateway uplink interface devices for fail over. Refer to the section Adding and Managing Gateway Uplink Devices for more details. VLANs - Enables the administrator to add VLANs to be associated with network zone(s). Refer to the section Creating VLANs for more details Adding and Managing Gateway Uplink Devices The main uplink device connected to the appliance (configured during initial network configuration) connects the appliance to the Internet and allows network zones like the local area network and DMZ to access the Internet. As a standby, the administrator can connect more than one gateway uplink devices to the appliance. The additional gateway uplink device(s) can be configured and used for fail-over in case the main uplink fails. The 'Additional Gateway Uplinks' pane of the 'Network Configuration' screen displays a list of currently configured gateway uplinks and allows the administrator to add new gateway uplinks. 82

83 To add and manage gateway uplink devices Click 'Network' > 'Interfaces' from the left hand side navigation Click the 'Network Configuration' tab. The 'Additional Gateway Uplinks' pane displays the currently connected gateway uplink devices. Uplink Editor Table - Column Descriptions Column Description ID The identity of the gateway uplink device, as assigned automatically by the UTM appliance. Backup-link The alternative uplink connection that will be activated in the event of failure of this gateway uplink Actions Displays control buttons for enabling/disabling and editing the uplink. - Allows the administrator to enable or disable the uplink. A tick in the checkbox indicates that the uplink is enabled. - Opens the interface to edit the gateway uplink device configuration parameters. The 'Edit' interface is similar to interface adding a new device. Refer to the section Adding a Gateway Uplink Device for more details - Removes the uplink 83

84 Adding a Gateway Uplink Device Any node among your internal network zones, individually connected to Internet can be configured as additional gateway uplink device for the appliance. Note: Before configuring a new uplink, ensure that you have connected the uplink device to the UTM appliance. To add a new gateway uplink device Click the 'Add a New Gateway Uplink' link at the top left of the 'Additional Gateway Uplinks' pane. The 'interface for adding a new gateway uplink device will open. The 'Uplink Editor' interface is divided into four areas: Device Settings - Enter IP address and DNS servers for the gateway device Uplink Settings - Specify power and fail-over options for the uplink Advanced Settings - Specify connection timeout period for the uplink Device Settings 84

85 Default Gateway - Enter the IP address or hostname of the default gateway device for this uplink in the 'Default Gateway' text box Primary DNS and Secondary DNS - Enter the IP addresses/hostnames of the primary and secondary DNS servers to be used. Uplink Settings Uplink is Enabled - The uplink will be activated immediately after the creation of it. Deselect this checkbox if you don't want to enable the uplink device at this time. You can enable the uplink at a later time in two ways: Select the checkbox in the 'Actions' column of the 'Additional Gateway Uplinks' interface. Refer to the description of the Additional Gateway Uplinks interface for more details Select the 'Active' checkbox beside the uplink in the Uplinks box from the Dashboard. Refer to the portion explaining the Uplinks box in the 'Dashboard' chapter for more details. Start uplink on boot - The uplink will start automatically on every restart of the UTM appliance. Deselect this checkbox if you want to manually start the uplink only when required. Uplink is managed - The uplink will be managed by Korugan and its details will be displayed in the Dashboard. Deselect this option if you do not want the uplink details to be displayed in the Dashboard. You can switch the uplink to managed state at any time by selecting the 'Managed' checkbox beside the uplink in the Dashboard. Refer to the section explaining the Uplinks box in the 'Dashboard' chapter for more details. Backup Profile - Select this checkbox if you want to specify an alternative uplink connection to be activated in the event this uplink fails and choose the alternative uplink device from the drop-down. Additional Link check hosts - The uplink reconnects automatically after a time period set by your ISP, in the event of a connection failure. If you want the appliance to check whether the uplink has connected successfully, you can try to ping known hosts in an external network. Enabling this option will reveal a text field where you should enter a list of one or more perpetually reachable IP addresses or hostnames. One of the hosts could be your ISP's DNS server or gateway. Advanced Settings The Advanced Settings pane allows administrators to configure the reconnection time out period. These settings are only for advanced users, hence the pane is not displayed by default. To open this panel, click the '+' button next to 'Advanced Settings'. 85


86 Reconnection timeout - Specify the maximum time period (in seconds) that the uplink should attempt to reconnect in the event of a connection failure. The reconnection timeout period depends on the ISP configuration. If you are unsure, leave this field blank. MTU - Enter the Maximum Transmission Unit (MTU) of the data packets that can be sent over the network. (Optional) Click 'Create' after configuring the parameters. The uplink will be added to the Additional Gateway Uplinks interface. You can enable/disable the uplink at any time from this interface Creating VLANs Comodo Korugan allows administrators to create Virtual LAN interface devices associated with network zone(s). The devices can be associated with arbitrary VLAN IDs. VLAN interface devices provide an additional layer of separation from other network devices. They enable clients from different locations to be connected to a single LAN, separated from local network zones. The 'VLAN' tab displays a list of current VLAN interface devices and allows the administrator to add or remove devices. To access the VLAN manager interface Click 'Network' > 'Interfaces' from the left hand side navigation Click the 'VLAN' tab. VLANs Table - Column Descriptions Column Device Description The identity of the VLAN interface device. The device ID is of the format ethx.y, where 'X' is the identification number of the physical interface to which the VLAN interface is associated and 'y' is the VLAN ID. 86
 Orange - DMZ Blue - Wi-Fi network zone Actions Displays control buttons for deleting the VLAN interface device. - Removes the VLAN.")
87 VLAN ID The identification number of the VLAN On Interface The physical interface to which the VLAN is associated Zone Indicates the network zone to which the VLAN interface is associated Green - Local network zone (for example, a LAN) Orange - DMZ Blue - Wi-Fi network zone Actions Displays control buttons for deleting the VLAN interface device. - Removes the VLAN. To add a new VLAN interface device Click the 'Add new VLAN' link from the top left of the VLAN manager interface. The 'Add new VLAN' pane will open. Enter the parameters as given below: Interface - The drop-down displays all physical interfaces connected to the UTM appliance, with their link status. Choose the physical interface to which the VLAN interface device should be connected. VLAN ID - Assign an ID for the VLAN. The ID can be from '0' to '4095' Zone - The drop-down displays the network zones that were enabled in the Network > Interfaces interface. Select the network zone to which the VLAN should be associated. 87


88 Note: You can create a VLAN associated to a zone and connected to the interface that already serves the same zone. It is not possible to associate a VLAN to a zone and connect it to an interface that serves a different zone. For example, if eth0 serves Green LAN zone, you cannot associate a VLAN to blue Wi-Fi zone and connect it to eth0. Click 'Add VLAN' to create the VLAN. Once created, the VLAN interface device will be displayed as a interface device in the list of VLANs. It will also be shown in other areas of the administrative console like Status > Network Status, with the extension of the VLAN ID in the interface ID. The device can be assigned to new network zones in the 'Network' > 'Interfaces' interface. 7.2 Adding and Managing Hosts Korugan allows administrators to add and manage host entries and map host names and IP addresses for address 88
89 resolution. This is useful if the administrator wishes to point requests for a specific domain name to a specific host in the network that offers the requested service, overriding the DNS servers. To access the Host Configuration interface Click 'Network' > 'Edit hosts' from the left hand side navigation. The Host Configuration interface displays a list of current hosts along with their designated IP address, host name and domain name. Administrators can add new hosts or edit/delete existing hosts by clicking the icons in the 'Actions' column. Host Configuration - Column Descriptions Column Description Host IP address The IP address of the host Hostname The host name associated with the IP address. If multiple hosts share the same IP, each host will be added as a separate entry with the same IP address. Domain name The name of the domain in which the host is located Actions Displays control buttons for editing and deleting the host entries - Enables to edit the host entry. Refer to the section explaining editing a host entry for more details. - Removes the entry. Note: On clicking the Delete button, the host entry will be immediately deleted without requesting confirmation and is a irreversible action. If you accidentally delete an entry, you need to manually re-add it. The following sections provide detailed guidance on: Adding a new host entry Editing an existing host entry To add a new host entry Click the 'Add a Host' link at the top left. The 'Add a Host pane' will open above the list of hosts. 89
 Click 'Add Host' The new host entry will be added to the list.")
90 Enter the parameters as given below: IP Address - The IP address of the host Hostname - The host name Domain name - The domain in which the host is located. (Optional) Click 'Add Host' The new host entry will be added to the list. Note: If you have more than one host sharing same IP address, each host should be added as a separate entry with the same IP address. To edit a host entry Click the Edit button in the row of the host entry to be edited. 90

91 The 'Edit' interface is similar to the 'Add a Host' interface. Edit the details as required and click 'Update host'. Refer to the section above for more details. The new details will be saved and activated upon the next restart of the service. 7.3 Routes The UTM appliance maintains a default routing table for routing traffic between different network zones as per the network configuration. The default routing table can be viewed from the 'Network status Information' interface accessible by clicking Status > Network status. In addition to the default routing table, the administrator can create custom routes for an appliance to connect to other networks through other devices like external routers or VPN tunnels. Two types of custom routes can be created: Static Routes - The static route defines a custom route between a specific source network and a specific destination network through a specific gateway or uplink. Policy Routes - A rule that defines the route between specific network addresses, zones, or services (expressed as port and protocol) and a specific uplink. Custom routes can be added and managed through the 'Routes' interface ('Network' > 'Routing'): 91
92 The interface contains two tabs: Static Routing - Displays a list of existing static routes and allows administrators to add new static routes. Refer to the section Adding and Managing Static Routes for more details Policy Routing - Displays a list of existing policy routing rules and allows administrators to add new rules. Refer to the section Adding and Managing Policy Routing Rules for more details Adding and Managing Static Routes The 'Static Routing' interface displays a list of existing static routes to any source network to specific destination networks. New rules can be added by clicking the 'Add a new route' link. Existing rules can be enabled, disabled, edited or removed by using the controls in the 'Actions' column. To open the 'Static Routing' interface Click 'Network' > 'Routing' from the left hand side navigation. Click the 'Static Routing' tab Static Routing Table - Column Descriptions 92
93 Column Description Destination Network The traffic destination network defined for the route. This can be an external network or an internal network zone. Via Gateway The traffic between the defined source and destination networks will be passed through the gateway specified here. This can be a static gateway, an uplink connected to the appliance or an SSL VPN user. Remark A shot description of the route as entered by the administrator during creation. Actions Displays control buttons for enabling/disabling and editing the route. - Allows administrators to enable or disable the route. A tick in the checkbox indicates that the route is enabled. - Edit the route entry. - Removes the route. Note: On clicking the 'Remove' button, the route entry will be immediately deleted without requesting confirmation. This is action is irreversible so if you accidentally delete an entry, you need to manually re-add it. The following sections provide detailed guidance on: Adding a new static route entry Editing an existing static route entry To add a new static route entry Click the 'Add a new route' link from the top left of the 'Static Routing' interface. The 'Adding Routing entry' pane will open. 93

94 Destination Network - Specify the network range of the destination network in CIDR notation, e.g /24. To specify the source network as any network, leave the field blank. Route Via - Choose the route gateway for traffic between the source and destination networks. Available options are: Static Gateway - Specify the IP address of the router in the text box on the right. Uplink - Choose the uplink to be used, from the uplink interfaces connected to the appliance, from the drop-down at the right. SSL VPN User - Choose the SSL VPN client to be used from the drop-down on the right Enabled - Deselect if you do not want the route to be enabled after you click the 'Add Route' button. The route can be enabled/disabled at anytime from the Static Routing Editor interface. Remark - Enter a short description for the route. The description will appear in the 'Remark' column in the list of routes. Click 'Add Route' to save your changes. Example: If you want the appliance to connect to an external network, which in turn is connected to a router in the local area network, then enter the IP address range of the external network in the Destination field, select Static 94

95 Gateway for 'Route Via' and enter the IP address of the router as assigned in the LAN in the 'Static Gateway' field. To edit a static route entry Click the Edit button in the row of the route entry to be edited. The Edit interface is similar to 'Add Routing Entry' interface. Edit the details as required and click 'Update Route'. Refer to the section above for more details The new details will be saved and activated on the next restart of the service Adding and Managing Policy Routing Rules The 'Policy Routing' interface displays a list of all pre-configured static routes and policy routing rules with their configuration parameters. Policy routing rules can be added to route traffic from specified external networks, zones, interfaces, VPN users or clients to specified network zones or VPN users, for specific services/protocols. Rules can be precisely configured for passing packets with specific Type of Service parameter. The administrator can create new policy routing rules by defining source and destination networks, gateway, services 95
 into a routing rule by adding parameters like Type of Service (TOS) and Service/Port in this interface.")
96 and type of services and edit existing rules. You can covert static routes (those with only source and destination) into a routing rule by adding parameters like Type of Service (TOS) and Service/Port in this interface. To open the 'Policy Routing' interface Click 'Network' > 'Routing' from the left hand side navigation. Click the 'Policy Routing' tab. Policy Routing Editor Table - Column Descriptions Column Description Source The network from which traffic will originate for this rule. This can be an internal network zone or an external network. Destination The network to which traffic covered by this rule will be sent. This can be an external network or an internal network zone. ToS The Type of Service parameter defined for the route to filter the filter to pass through. See the section 'Note on TOS' below the table for more details. Via Gateway The traffic between the defined source and destination networks will be passed through the gateway specified here. This can be a static gateway, an uplink connected to the appliance or an SSL VPN user. Service The network service, protocol and the destination port defined for the rule Remark A shot description of the route as entered by the administrator during creation. Actions Displays control buttons for enabling/disabling and editing the rule. / - The arrows allow the administrator to move the rule up or down to change its priority. - Allows the administrator to enable or disable the rule. A tick in the checkbox indicates that the rule is enabled. - Edit the rule. - Removes the rule. Note: On clicking the 'Remove' button, the route entry will be immediately deleted without requesting confirmation. This is action is irreversible so if you accidentally delete an entry, you need to manually re-add it. 96
97 Note on ToS - The Type of Service (ToS) is a eight bit field in the header of an IPv4 packet for managing the routing of the datagram packet between its source and the destination depending on is priority, latency, throughput and reliability. The ToS value can be from: Eight priority values for Class Selectors (CS0-7), which denote backward compatibility with the TOS field. In other words, these are 'true' TOS values. Twelve latency values for Assured Forwarding (AF*xy*, where x being a class from 1 to 4 and y being a 'drop precedence' from 1 to 3 - low, medium, high) that provide low packet loss with minimum guarantees about latency. One reliability value for Expedited Forwarding (EF PHB), defined in RFC 3246 and used to give the highest priority to packets. It is useful for services requiring low delay, low latency, and low rate of losses, like e.g., VoIP or video streaming. The following sections provide detailed guidance on: Adding a new policy routing rule Editing an existing static route entry or policy routing rule To add a new policy routing rule Click the 'Create a policy routing rule' link from the top left of the 'Policy Routing' interface. The 'Policy routing rule editor' pane will open. 97

98 The following parameters can be configured: Source - Select the type of source from the 'Type' drop-down and specify the source in the text box below it. The options available are: Any - The rule will be applied to traffic from any source Zone/Interface - Select this option if the source is a network zone or an Interface connected to the appliance. Choose the network zone and/or the interface from the options listed in the text box. Press and hold the Ctrl key in the keyboard to choose multiple zones/interfaces. SSL VPN User - Select this option if the rule is to be applied to traffic from VPN user(s) added to the network. Choose user(s) from the list of pre-registered users displayed in the textbox. Press and hold the Ctrl key in the keyboard to choose VPN users. Network/IP - Select this option if the rule is to be applied to traffic from an external network or from a specific IP address. Enter the IP address of the network(s) in CIDR notation or the specific IP address(es) in the text box, as one entry per line. MAC - Select this option if the rule is to be applied to traffic from specific clients. Enter the MAC address(es) in the text box, with one entry per line. Destination - Select the type of destination for the traffic from the 'Type' drop-down and specify 98
99 the actual destination in the text box below it. The options available are: Any - The rule will be applied to traffic going any destination SSL VPN User - Select this option if the rule is to be applied to traffic to VPN user(s) which have been added to the network. Choose user(s) from the list of pre-registered users displayed in the text-box. Press and hold the Ctrl key in the keyboard to choose VPN users. Network/IP - Select this option if the rule is to be applied to traffic to an external network or to a specific IP address. Enter the IP address of the network(s) in CIDR notation or the specific IP address(es) in the text box, as one entry per line. Service/Port - Specify the service, protocol and destination port for the rule when the TCP, UDP, or TCP + UDP protocols are selected. Service - Select the service for which the rule to be applied from the drop-down. Protocol - Select the protocol for the service. Usually this field will be auto selected based on the service selected. destination port - Select the destination port for the service. Usually this field will be auto selected based on the service selected. Tip: The appliance is loaded with predefined combinations of service/protocol/port, like HTTP/TCP/80, <ALL>/TCP+UDP/0:65535, or <ANY>, which is a shortcut for all services, protocols, and ports. If you want to specify custom protocol/port combination, then select 'User Defined' from the service. This useful for the services run on ports different from the standard ones. Route Via - Choose the route gate way for the traffic between the source and destination from the drop-down. The options available are: Static Gateway - Specify the IP address of the router in the text box at the right. Uplink - Choose the uplink to be used, from the uplink interfaces connected to the appliance, through the drop-down at the right. SSL VPN User - Choose the SSL VPN client to be used from the drop-down at the right Type of Service - Choose the ToS parameter for the rule. For more details on ToS, refer to the note above. Remark - Enter a short description for the rule. The description will appear in the Remark column in the list of rules. Position - Select the priority of the rule from the drop-down. Enabled - Deselect if you do not want the rule to be enabled upon creation. The rule can be enabled/disabled at anytime from the Policy Routing Editor interface. Log all accepted packets - Select the checkbox if you want all the packets passed through the routing rule. Click 'Create Rule' to add your new rule to the appliance. To edit a policy routing rule Click the Edit button open. in the row of the rule you want to edit. The 'Policy routing rule editor' pane will 99

100 Edit the details as required and click 'Update Rule'. Refer to the section above for more details The new details will be saved and activated on the next restart of the service. 100
101 8 Configuring UTM Services and Protection Settings The 'Services' menu contains a plethora of basic and advanced services to prevent threats, monitor network zones and help you manage and control your network: DHCP Server - Acts as a Dynamic Host Control Protocol (DHCP) server for automatic IP address assignment of IP addresses to clients connected to different network zones. Dynamic DNS - Built-in clients for 14 popular Dynamic DNS (DDNS) service providers for hotsname/ip address resolution for domains associated with dynamic IP addresses. This is useful for domains hosted from home or small office networks. Advanced Threat Protection - Contains network security tools to block advanced zero-day threats and data breaches, application containment, remote endpoint management tools and the powerful Comodo Antivirus engine that scans networks for viruses, rootkits and other malware types. Time server - Enables you to specify a network time server (NTS) for your network and manually adjust/update time Content Flow Check - Enables you to configure rules for content flow check by the Intrusion Prevention System (IPS). Korugan uses Snort for network intrusion detection/prevention. Hotspot - Built-in Captive Portal Service for governing Wi-Fi hotspots on your network Traffic Monitoring - Monitors network traffic flowing through different zones and allows the administrator to analyze traffic by host, protocol, local network interface and other details. Quality of Service - Enables the administrator to set priority to IP traffic pertaining to specific services ICAP: - Configure the ICAP protocol, which is designed to adapt content while traversing between internet and individual nodes via Korugan. Clicking the 'Services' button on the left hand menu will open a sub-menu which allows you to access and configure all Korugan services. 101

102 The following sections provide detailed explanations on configuration of basic and advanced services: DHCP Server - Configure the DHCP parameters for assigning dynamic and fixed IP addresses to clients in different network zones Dynamic DNS - Enter your login details to your DDNS service providers Advanced Threat Protection - Define ATP profiles, file/application containment settings, manage security software at remote endpoints and configure the AV engine and schedule AV scans Time server - Specify a network time server (NTS) for your network and manually adjust/update time Content Flow System - Configure the Snort rules to be used for intrusion detection and prevention Hotspot - Configure the Captive Portal Service for Wi-Fi hotspot services in your network Traffic Monitoring - Enable/Disable traffic monitoring and view real time traffic details Quality of Service - Select devices and specify rules for setting priority for service based IP traffic ICAP - Enables to adapt content while traversing between internet and individual nodes via Korugan. 8.1 DHCP Server The UTM appliance has the ability assign both fixed and dynamic IP addresses to workstations connected to 102
103 different network zones. The DHCP Server interface enables the administrator to configure the start and end IP addresses for each network zone and specify the clients to which the fixed or dynamic addresses are to be assigned. The interface also allows granular configuration of DNS servers, NTP servers and WNS servers for each network zone. To access the DHCP Server interface, click 'Services' > 'DHCP Server' from the left hand side navigation. The DHCP Configuration interface contains two panes: DHCP Current fixed leases DHCP The upper pane allows administrators to enable/disable the DHCP server service and to configure/edit DHCP settings for LAN, DMZ and Wi-Fi network zones. To configure/edit the DHCP settings for a network zone 103
104 Click the '+' button beside Settings under the network zone name. The Settings panel will open. The settings panel displays the start and end IP addresses to be dynamically assigned to the clients, DNS servers, NTP server and WNS server configured for the selected zone. Start Address and End Address - The first and last IP addresses of the IP address range that can be assigned to the clients connected to that network zone. The address range needs to be within the subnet, that can be assigned to that zone. Note: Any client like a host, network printer or other network device connected to the selected zone will automatically obtain a valid IP address from the address range specified here, unless it is configured to get a fixed IP address in the lower pane. To enable a client to obtain the address automatically, it should be configured to to use DHCP in its network settings. Allow only fixed leases - When selected, no client in the selected zone will be automatically assigned a dynamic IP address. If required, the administrator can assign fixed IP addresses for each client from the lower panel Default lease time - The time in minutes for which the assigned IP address should be active on the client Max lease time - The maximum time (in minutes) for which the assigned IP address can be active on the client Domain name suffix - The domain name suffix to be passed on to the clients for local domain searches Default Gateway - The IP address of the default gateway used by the clients in the network zone. If left blank, the clients will use the UTM appliance as the gateway Primary DNS and Secondary DNS - The IP addresses of the primary and secondary DNS servers. 104
 servers to be used by the clients in the network zone for time synchronization.")
105 The defaults value is from the DNS cache of the UTM appliance. Primary NTP server and Secondary NTP server - The IP address or the hostname of the Network Time Protocol (NTP) servers to be used by the clients in the network zone for time synchronization. Primary WINS server address and Secondary WINS server address - The IP addresses of the Windows Internet Name Service (WINS) servers the clients should use. This is required only for Microsoft Windows networks that use the WINS service. Custom Configuration Lines - Allows Advanced Users to add custom configuration lines for DHCP, e.g., custom routes to subnets Enabled - The checkbox allows you to enable or disable the DHCP settings for the selected zone. Enter/Edit the parameters as required and click 'Save'. The service will restart for your settings to take effect. Repeat the process for other network zones as required Once a client(s) DHCP settings have been enabled and it has been auto-assigned IP addresses, the 'Current dynamic leases' pane will appear below the 'Current Fixed Leases' table. This displays the currently assigned dynamic IP address, the MAC address, the hostname and the expiry time of the address associated with each client. Current Fixed Leases The 'Current Fixed Leases' pane displays a list of fixed IP addresses assigned to specific clients and allows you to add new fixed address specifications. Current Fixed Leases Table - Column Descriptions Column Description MAC address The physical MAC address of the client IP Address The static IP address assigned to the client Next address The address to which the client will be redirected if the client is configured for network boot. The next address may point to the Trivial File Transfer Protocol (TFTP) server that hosts a boot image. Filename The boot image file name, if the client is configured for network boot. Root path The path of the boot image file, if the client is configured for network boot. Description A short description for the device that required the fixed IP address Actions Displays control buttons for the fixed lease entry 105

106 - Allows administrator to enable or disable the fixed lease entry. - Edit the entry. - Remove the entry. To add a new fixed IP address entry Click the 'Add a fixed lease' link at the top left of the interface The 'Add a fixed lease' pane will open which contains the following fields and settings: MAC Address - The physical MAC address of the client IP Address - The static IP address to be assigned to the client Description - A short description of the client Next Address - The address to which the client to be redirected, if it is in network boot mode. This setting is only for disk-less client or thin client (Optional) Filename - The file name of the boot image stored in the server to which the client needs to be redirected for network boot Root path - The path of the boot image file stored in the server to which the client needs to be redirected for network boot Enabled - The IP address will be assigned and enabled upon creation. If you want the address to be enabled at a later time, deselect this checkbox. You can enable the address when required by selecting the 'Enabled' checkbox under the Actions column in the Current fixed leases table. Note: To avoid conflicts, make sure that the IP address specified here is not included in the IP range specified in DHCP settings for the network zone to which the client is connected and in the range of OpenVPN address pool 8.2 Dynamic DNS The Dynamic DNS (DDNS) interface allows administrators to configure the DDNS service for hosts with dynamic IP addresses. Background Note: Dynamic DNS (DDNS) service providers offer dynamically updated DNS services to web 106
107 services/domains hosted on servers whose IP addresses are not fixed. Hosts connected to small scale networks like home networks and small office networks, that are not assigned with static IP addresses from the ISP, get dynamically assigned IP addresses from their DCHP server. The domains/web services offered from such servers can be reached by end users only if their DNS entries are constantly updated with the currently assigned IP addresses for hostname/ip address resolution. For web services or domains hosted from servers with dynamic IP addresses, the website operator/owner should subscribe for a DDNS service and configure a client provided by the DDNS service provider. Comodo Korugan has in-built clients for 14 popular Dynamic DNS (DDNS) service providers. Administrators can select the DDNS service provider to whom they are subscribed and configure it accordingly for their hosts. To access the Dynamic DNS interface, click 'Services' > 'Dynamic DNS' from the left hand side navigation. The interface displays a list of existing, configured DDNS services per host: The table contains the following information about each host: Dynamic DNS Current Hosts Table - Column Descriptions Column Description Service The DDNS service provider with whom the domain name is registered Hostname The hostname of the web-server Domain The registered domain name Anonymous web proxies Indicates whether the appliance is connecting to Internet through a proxy and enables the administrator to deactivate or activate proxy Wildcards Indicates whether wildcard domains for the registered domain name are active and enables the administrator to deactivate or activate wildcards Enabled Allows the administrator to enable or disable the host entry. Actions Displays control buttons for the host entry - Edit the entry. - Remove the entry. Force Update - Administrators should click the 'Force Update' button after making any configuration changes; after adding a new host entry or if the IP address of the external network zone has changed 107

108 because the uplink disconnected and reconnected. All DDNS entries will be immediately updated. To add a new host Click the Add a host link from the top left. The 'Add a host' pane will open. Enter the parameters as given below: Service - Select the DDNS service provider with whom the domain name is registered. Behind a proxy - Select this checkbox if the UTM appliance connects to the Internet through a proxy. This setting is necessary only if you choose 'no.ip.com' from the service drop-down. Enable wildcards - Select this option if you want to enable sub domains that are hosted from the same IP address of the main domain. Searches for sub-domains will be re-directed to the same IP address as the main domain. This feature requires similar configuration in your DDNS account. Host-name - Enter the hostname of the server that hosts the domain Domain - Enter the domain name as registered with the DDNS service Username and password - Enter the username and password provided by the DDNS service provider to access the service behind Router(NAT) - Select this checkbox if the UTM appliance connects to the Internet through a router or a gateway. Enabled - The entry will be enabled immediately after clicking the 'Add Host' or 'Update Host' button. Deselect this option if you want to enable the host at a later time. You still need to click the 'Force Update' button to fully activate the change. You can enable the host entry from the current hosts table at any time. 108
109 8.3 Click 'Add Host' to add the host entry and click 'Force Update' for the changes to take effect at the DDNS service immediately Advanced Threat Protection Advanced Threat Protection (ATP) safeguards the network against Advanced Persistent Threats (APTs), hack attempts, data breaches, known and unknown zero-hour malware and so on. ATP intercepts the files downloaded from websites or from attachments and uses a proprietary combination of cloud and local based virus scans, real-time behavior analysis, automatic file look-up and multiple blacklist checks to quickly and accurately identify known and unknown threats. ATP uses the following techniques to analyze the files: Cloud-based file look-up service - File reputation service which Instantly checks a files signature against the very latest database to ascertain whether or not it is trusted, malicious or unknown. Comodo Antivirus - Continuously updated antivirus scanner which provides dependable protection against known malicious files. Blacklist checking - Real-time checks of whether the domains, URLs and IP addresses visited by your users are flagged as malicious by major blacklisting services. Comodo Automated Malware Analysis (CAMAS) A cloud based behavior analysis service which improves detection of zero-day threats by rigorously testing the run-time actions of unknown files. Based on the analyses files are identified as: Safe - Files identified as known good files from the whitelist/clean/safe are allowed to be downloaded at the endpoint Threats - Files identified as known bad from the blacklist/malicious/threats are blocked and a warning is displayed at the endpoint Unknown - Files that could not be identified are classified as 'Unknown'. These files are subjected to containment technology - meaning the files are wrapped and forwarded to the endpoint. Upon execution, the file is made to run in a isolated sandbox environment at the endpoint, whereby it is not allowed to modify other processes running on the endpoint nor access user data. This ensures the download is secure because it is not possible for the file to infect the endpoint, even if it transpires to be malicious. Note: In order to run unknown file/application inside the sandbox, Korugan installs Comodo Endpoint Security (CES) on the destination endpoint while forwarding the unknown file, if CES is not already installed. For activation of licenses to the CES installation, the administrator needs to configure for activation of licenses in the 'Services' > 'Advanced Threat Protection' > 'Endpoint Management' interface. Refer to the section Endpoint Management for more details. If CES is already installed on the endpoint, the 'Unknown' file will be automatically run inside the sandbox. For more details on sandbox, refer to the online CES user guide at ATP automatically creates whitelist and blacklist of domains based on malware analysis of the files accessed by them and also allows the administrators to manually add domains to these lists. The Advanced Threat Protection interface allows the administrator to create and manage the profiles for ATP which can be applied for web protection and protection in Firewall Policy rules, view and manage whitelist and black list of domains, configure for licensing endpoint security software and Comodo Antivirus. To access the Advanced Threat Protection interface, click 'Services' > 'Advanced Threat Protection' from the left hand side navigation. 109
110 The interface contains four tabs: Profiles - Allows the administrator to create and manage ATP profiles which define the scan types to be used, application containment settings and file types/sizes to be blocked. These profiles are applied for web protection and protection in Firewall Policy Rules. Refer to the section Managing ATP profiles for more details. Threat Intelligence - Allows the administrator to view the list of domains automatically added to whitelist and blacklist of domains based on malware analysis of files from them. The administrator can also manually add files to the list and view the list of files intercepted by the ATP based on the profiles. Refer to the section Threat Intelligence for more details. Endpoint Management - Allows the administrator to configure for activating licenses to the endpoint security software (CES) installed on the endpoints for running 'Unknown' files inside the sandbox. Refer to the section Endpoint Management for more details. Comodo AV Settings - Allows the administrator to configure the AV engine and schedule AV scans. Refer to the section Comodo Antivirus for more details Managing ATP Profiles ATP profiles define the scan types to be applied to the files downloaded from websites and attachments by the endusers and application of containment technology to the unknown files. In addition, profiles can be created for blocking the files of specified types and sizes. The profiles can be applied for Web Protection settings and protection settings while configuring Firewall policies. The Profiles interface allows the administrator to create and manage ATP profiles that define how the files are to be scanned, files types/sizes to be blocked and containment of files from different domains. To open ATP profiles interface Click 'Services' > 'Advanced Threat Protection' from the left hand side navigation Click the 'Profiles' tab. 110

111 The 'Profiles' interface displays a list of ATP profiles added to Comodo Korugan and allows the administrator to create new profiles and edit existing profiles. ATP Profiles Table - Column Descriptions Column Description Profile Name The name of the profile. Comment A short description of the profile. Actions Displays control buttons for managing the profile. - Opens the 'Edit' interface and enables to edit the parameters of the profile. The Edit interface is similar to 'Add Profile' interface. Refer to the section Creating an ATP Profile for more details. - Removes the profile. To add the packets intercepted by the ATP to the device logs, select the 'Log Packets' checkbox at the top left. Creating an ATP Profile Different ATP profiles can be created and applied for blocking different file types and to define application containment for files passed over the network. To create an ATP Profile Open the 'Profiles' interface by clicking 'Services' > 'Advanced Threat Protection' from the left hand side navigation and selecting the 'Profiles' tab. Click the 'Add a new ATP Profile' link at the top left. 111

112 Enter the parameters as given below: Profile Name - Enter a name for the ATP profile Comment - Enter a short description of the profile. Scan Type - Choose whether the files intercepted should be scanned with the local scan engines or the cloud scan engines. The available options are: Single Scan - Scans files using the local virus signature database Cloud Scan - Implements Cloud-based file look-up service, CAMAS, ClamAV and cloud based Blacklist checking in addition to using local database. 112


113 Blocked File Type - Select the types of files to be blocked as per the profile Click the '+' button beside the drop-down and select the file types from the drop-down. You can add or remove the file types at any time by editing the profile. The added file types will be displayed as a list. To remove a file type, click the button beside it. Block File if the size is more than - If you want large files to be blocked, enter lower limit of the file size (in MB) to be blocked. Files whose size is more than that specified here will not be allowed to pass through the network. Application Containment - If you want Korugan to apply containment to the unknown files,enable 'Application Containment' using the toggle switch. (Default = Disabled). Once enabled Korugan will apply containment technology to the file types specified in the 'Contain by File Type' field. 113


114 Domain Exceptions - You can add the domains to be excluded from application containment. The files downloaded from the domains included in the list will be excluded from containment Contain by file type - Select the types of files to be contained as per the profile Click the '+' button beside the drop-down and select the file types from the drop-down. Click 'Create Rule' to save your profile Your profile will be added to the list of ATP profiles and will take effect immediately Threat Intelligence ATP identifies the domains that are safe and malicious, based on the malware analyses of the files downloaded from or targeted them and automatically creates a whitelist and Blacklist of domains: Whitelist - The files downloaded from the whitelisted domains will be allowed to pass through without scanning and application containment. Blacklist - The files downloaded from blacklisted domains will be blocked. The Threat Intelligence interface displays the whitelist and blacklist of domains and a list of files intercepted with their scan results. The administrator can: Manually add or remove domains to/from the whitelist and the blacklist; Analyze the scan results of the files from the list of intercepted files and add their target domains to whitelist of blacklist. To access the 'Threat Intelligence' interface 114
115 Click 'Services' > 'Advanced Threat Protection' from the left hand side navigation Click the 'Threat Intelligence' tab. The interface displays the Domain Whitelist, Domain Blacklist and a table with a list of files intercepted by ATP with their scan results. Scan Results Table - Column Descriptions Column Header Description Date & Time Precise date and time at which the file was intercepted Session ID The session identifier of the connection session between the user and the source of the file Source IP The IP address of the host from which the file is passed over the network Source Agent Name The user agent that accessed the file. Source User The user that uploaded or downloaded the file. Target URL The URL to which the file is uploaded or downloaded Target Domain The domain to which the file is uploaded or downloaded Target Filename The file name of the intercepted file Target Filehash The hash value of the file FLS Verdict The result from cloud based File Lookup Service (FLS) performed for the file AV Verdict The scan result of the file from local AV scan engine CAMAS Verdict The scan result for the file from Comodo Automated Malware Analysis (CAMAS) Actions Displays action buttons for adding the target domain of the file to whitelist or blacklist. - Adds the target domain of the file to the whitelist. 115
116 - Adds the target domain of the file to the blacklist. To manually add domains to the whitelist or blacklist Click the below the respective list A textbox for entering the domain name will appear. Enter the domain name or the IP address to be added to the list and click 'Add Domain'. To edit a domain name in the whitelist or blacklist Select the domain from the list. Click the below the respective list. 116
117 The domain name will appear in the text box below the list. Edit the name as required and click 'Update Domain'. To remove a domain from the list, select the list and click the remove button Endpoint Management The Advanced Threat Protection (ATP) module runs files and executables downloaded by an enduser from websites or mail attachments and classified as 'Unknown' at the endpoint inside the sandbox - an isolated environment from which it cannot modify other processes running on the endpoint nor access user data. This ensures the download is secure because it is not possible for the file to infect the endpoint, even if it transpires to be malicious. In order to use the sandbox, Korugan requires the remotely managed endpoint security software Comodo Endpoint Security (CES) installed on the endpoints and their licenses activated. If CES is not already installed at the endpoint, Korugan remotely installs the software when the user attempts to run/execute a downloaded file classified as 'Unknown', applied with containment technology and forwarded to the endpoint by the ATP. If CES is already installed, it automatically runs the downloaded file classified as 'Unknown' by the ATP. The end-user licenses for the CES installations can be activated in two ways: The administrator can setup remote endpoint security management server 'Comodo Endpoint Security Manager' (CESM) on the network and point Korugan to activate license of CES installations through CESM. For more details on the features, subscribing for and setting up CESM, refer to the online administrator guide at The administrator can subscribe for multi-user CES license keys, and use them to activate the CES installations at the endpoints. 117
118 The 'Endpoint Management' interface allows the administrator to configure for activating licenses for the CES installations at the endpoints and displays a list of license activated CES installations with their details. To access the 'Endpoint Management' interface Click 'Services' > 'Advanced Threat Protection' from the left hand side navigation Click the 'Endpoint Management' tab. The interface has two panes: License Configuration List of Endpoints License Configuration The upper pane allows the administrator to configure and manage the CES licenses. The administrator can enter the network domain details, CES license keys or CESM server details in this pane. Domain Details: Domain Name - Enter the network domain name Domain Username - Enter the login username for an administrative account in the AD server in the domain. Korugan will use this account to login to the network and install CES on to the required endpoints. Domain Password - Enter the login password for the administrative account. License Details: You can activate the CES licenses in two ways: 1. Using CESM for activating Licenses - If you have setup CESM server on your network you can use the same to activate CES licenses at the endpoints. Choose 'Use Comodo Endpoint Security Manager for activating CES in endpoints' and enter the CESM server details: 118
119 ESM Server - Enter the IP address or Hostname of the server on which CESM is installed. Port - Enter the port number of the server, configured for CESM service. (Default = 57193). Click 'Save' for your settings to take effect. 2. Using Manually added CES Licenses - If you have subscribed for multi-user CES licenses, you can add the license keys to this area and use them to activate CES installations at the remote endpoints within the network. Choose 'Use Manually added CES licenses' and add the license keys to the list To add a new license key Click 'Add New License'. A text box for entering the license key will appear. Paste the new license key in the text box and click 'Add License' The license key will be added to the list and will be applied for activating the CES licenses at the endpoints. License Keys Table - Column Descriptions Column Header Description License Key Displays the CES license key Title Displays the product name and number of endpoint installations covered by the license Expiration From Displays the start date of the license term 119
120 Expiration To Displays the license expiry date Validation Date Displays the date at which the license was first applied and validated Actions Displays control buttons for the license key entries - Allows administrator to enable or disable the license key. - Removes the entry. Clicking 'Show active keys' displays only the licenses that are currently enabled Click 'Save' for your settings to take effect. List of Endpoints The lower pane displays the list of endpoints at which CES is installed, with the details of the endpoints. List of Endpoints - Column Descriptions Column Header Description Remote IP The IP address of the endpoint on which CES is installed. Win Version The version number of the Windows operating system at the endpoint. CES Version The version number of CES software installed at the endpoint. Installation Date The date at which CES was installed. Active User The currently logged-in user at the endpoint. Machine Name The Computer Name assigned to the endpoint. Domain Name The network domain to which the endpoint is connected. Comment A short description indicating the installation status of CES at the endpoint. Status The current network connection status of the endpoint Comodo Antivirus Comodo Korugan boasts a state-of-the-art antivirus engine from Comodo, a leader in Internet Security. The antivirus engine uses constantly updated virus signature database and provides comprehensive protection against malware outbreaks on your network. Comodo Antivirus periodically scans all files and documents in the network and automatically moves any threats to quarantine, in addition to on-access scans run based on the ATP profiles. Background Note: The quarantine facility removes and isolates suspicious files into a safe location Any files transferred in this fashion are encrypted - meaning they cannot be run or executed. This isolation prevents infected 120

121 files from affecting the rest of the network. The Antivirus engine configuration interface allows the administrator to schedule virus database updates and to configure scan parameters. To access the Comodo Antivirus interface Click 'Services' > 'Advanced Threat Protection' from the left hand side navigation Click the 'Comodo AV Settings' tab. The interface has two panels: Comodo Configuration Comodo virus signatures Comodo Configuration The Comodo Configuration panel allows administrators to modify scan parameters and set the frequency of virus database updates. Anti Archive Bomb - Max File Size - (MB) Files larger than the size specified will not be scanned. Note on archive bombs: One of the techniques used by attackers to disable an antivirus system is an 'Archive Bomb'. Similar to a Denial of Service (DoS) attack, an archive bomb is designed to overload the AV system by presenting it with more process requests than it can handle. Large files containing redundant data are compressed repeatedly and nested inside a very complicated archive structure inside the zip. When an antivirus application tries to extract those archives while scanning, it consumes an inordinate amount of system resources and often halts 121
122 other operations. It is advised to configure the antivirus in a computer to skip scanning files larger than a set threshold. Comodo Signature update schedule - The virus signature data base of the antivirus engine will be updated at the frequency selected here. Comodo virus signatures The 'Comodo virus signatures' panel displays a log of previous update events. 8.4 Time Server The Time Server interface allows administrators to configure system time and synchronization with Internet time servers. Administrators can also manually set the date and time via this interface. To access the 'Time Server' interface, click 'Services' > 'Time Server' from the left hand side navigation. The interface has two panels: Use a network time server Adjust manually Use a network time server Comodo Korugan's system time can be synchronized to the zones of most major cities in the world using Network Time Protocol (NTP) servers. If required, the administrator can synchronize with a manually specified custom or local time server. This is useful, for example, if the appliance is used in an environment without an Internet connection. Override default NTP servers - Selecting this option instructs the appliance to use custom time servers for time synchronization. The custom time servers can be specified in the text box that opens below the option. Any number of time servers can be specified by entering their URLs in the box, one per line. Timezone - Select the time zone to which the appliance should synchronize. 122
123 Click 'Save' to save your settings. To synchronize the time immediately with the specified NTP servers, click 'Synchronize now'. Adjust Manually The administrator can also manually set the time in system clock from the lower panel. This is useful if the system clock has stopped for some time and immediate time update is needed. Enter the year, month, date, and the current time in hours and minutes Click 'Set time'. Tip: The time server is used to provide time-stamps for important operations like audit generation. Hence, it is important to keep it precise and accurate. 8.5 Content Flow Check System Comodo Korugan includes 'Snort', the state-of-the-art network intrusion prevention and detection system (IDS/IPS) directly built-in to its IP tables. Snort employs signature, protocol, and anomaly-based inspection of incoming traffic and is the de facto IPS standard and checks the data flow through the network for intrusion detection and prevention. Snort uses IPS rulesets, containing a number of intrusion detection/prevention rules and application detection rule sets containing a number of rules for identifying applications generating TCP/IP traffic on the network. The application rule sets enable reporting application names along with IPS events. The rules are developed by their Vulnerability Research Team (VRT) for inspecting different parts of data packets and actions to be taken. The rule sets are constantly updated to confront emerging network intrusion techniques, that can be periodically downloaded from Snort servers. Using up-to-date rulesets enables Korugan to detect and prevent unprecedented network intrusions attempts. The Intrusion Prevention System interface allows the administrator to configure Snort rules update schedule, create and upload Snort rules and enable/disable rule sets. To access the 'Content Flow Check System' interface, click 'Services' > 'Content Flow Check' from the left hand side navigation. 123
124 The Interface has three tabs: Content Flow Check System - Allows the administrator to enable/disable the intrusion prevention system and configure ruleset updates. Refer to the section Configuring Intrusion Prevention System for more details. IPS Rules - Displays the currently loaded IPS rulesets and allows the administrator to manage them. Refer to the section Managing IPS Rulesets for more details. Application Identification - Displays the currently loaded Application Identification rulesets and allows the administrator to manage them. Refer to the section Managing Application Identification Rulesets for more details Configuring Intrusion Prevention System The Content Flow Check System interface allows the administrator to configure the ruleset updates for Snort. The ruleset updates can be scheduled to run automatically at specified intervals and can be run manually on demand. Advanced users can locally create custom Snort rules for network intrusion detection and prevention as per their specific needs and upload to the UTM from the 'Intrusion Prevention System' interface. For more details on creating new custom rules is available in the online page To open the 'Content Flow Check System' interface Click 'Services' > 'Content Flow Check' from the left hand side navigation. Click the 'Content Flow Check System' tab 124
125 IPS Rules Settings Automatically fetch IPS rules - Select this checkbox for scheduled automatic Snort ruleset updates. Korugan will download the ruleset database updates from the Snort servers and install them locally at the selected intervals. The interval can be chosen from 'Choose update schedule' drop-down, that appears on selecting this option. The available options are: Hourly Daily (Default) Weekly Monthly Manual Ruleset updates - To instantly update the ruleset database, click the 'Update rules now' button. Custom IPS Rules IPS rulesets containing custom rules can be created as per the network requirements by the administrator and can be uploaded to the UTM appliance for implementation at any time. The constituent rules can be defined in a text file and stored as.rules file to form a rule set file. The interface allows to upload single ruleset file or tar.gz or zip file containing several ruleset files. To upload the custom ruleset file(s) Click 'Browse' under 'Custom IPS Rules' and navigate to the location of the rules file and click 'Open'. Click 'Upload custom rules' Click 'Save' and 'Restart' after completing the any configuration change The Content Flow Check service will restart for your changes to take effect Managing IPS Rulesets The 'IPS Rules' interface displays a list of currently loaded IPS rulesets and enables administrators to enable/disable rulesets, and configuring for allowing or blocking the data packets intercepted by a ruleset. 125

126 To open the IPS Rules interface Click 'Services' > 'Content Flow Check' from the left hand side navigation. Click the 'IPS Rules' tab Rules Table - Column Descriptions Column Description Rule filename The name of the.rules file that contains the constituent rules of the ruleset Rules count Indicates the number of constituent rules in the rule set Actions Displays control buttons for the ruleset. - The checkbox allows the administrator to switch the ruleset between enabled and disabled states / - Indicates the application policy of the ruleset and enables the administrator to toggle the policy. See Changing application policy of rulesets for more details. - Removes the ruleset The interface allows the administrator to: Enable/Disable rulesets Change application policy of rulesets Remove rulesets Enabling/Disabling Rulesets The rulesets can be enabled or disabled individually or collectively from the Rules interface. 126

127 To enable or disable a single ruleset, select or unselect the checkbox beside the ruleset in the 'Actions' column To enable inactive rulesets collectively, select the rules by marking the checkboxes at the left of the rulesets to be enabled and click the 'Enable' button from the bottom of the right pane. To disable active rulesets collectively, select the rules by marking the checkboxes at the left of the rulesets to be disabled and click the 'Disable' button from the bottom of the right pane. After making the changes, click the 'Apply' button in the confirmation pane that appears at the top to apply the changes. Changing application policy of rulesets A ruleset can be applied in two ways: Alert Policy - The IPS generates an alert when a data packet matching a rule in the ruleset is encountered and passes the packet. The policy is indicated by alert icon. Drop Policy - The IPS blocks the data packet matching a rule in the ruleset without generating an alert. The policy is indicated by shield icon. The administrator can toggle the application policy for individual rulesets or for group of rulesets. To toggle the policy of a ruleset from 'Alert' policy to 'Drop' policy, click the 'Alert' icon in the row of the ruleset under the 'Actions' column To toggle the policy of a ruleset from 'Drop' policy to 'Alert' policy, click the 'Shield' icon in the row of the ruleset under the 'Actions' column To toggle the policy of a group of rulesets with 'Alert' policy to 'Drop' policy, select the rulesets by marking the checkboxes at the left of the ruleset file names and click the 'Drop' button at the bottom of the interface To toggle the policy of a group of rulesets with 'Drop' policy to 'Alert' policy, select the rulesets by marking the checkboxes at the left of the ruleset file names and click the 'Alert' button at the bottom of the interface After making the changes, click the Apply button in the confirmation pane that appears at the top to apply the changes. Removing rulesets Unwanted rulesets can be removed from Comodo Korugan from the Rules interface. To remove a single ruleset click the delete icon and click 'OK' in the confirmation dialog in the row of the ruleset filename, under 'Actions' column 127

128 To remove a group of rulesets collectively, select the them by marking the checkboxes at the left of the ruleset file names and click the 'Delete' button at the bottom of the interface. Click 'OK' in the confirmation dialog Managing Application Identification Rulesets The 'Application Identification' interface displays a list of Application Identification rulesets that are currently loaded to the appliance and enables administrators to enable/disable rulesets. The administrator can also configure the content flow check system to allow or block the TCP/IP traffic from the applications, identified by the rules in a ruleset. To open the 'Application Identification' rules interface Click 'Services' > 'Content Flow Check' from the left hand side navigation. Click the 'Application Identification' tab Rules Table - Column Descriptions Column Description Rule filename The name of the.rules file that contains the constituent rules of the ruleset Rules count Indicates the number of constituent rules in the rule set Actions Displays control buttons for the ruleset. - The checkbox allows the administrator to switch the ruleset between enabled and disabled states / - Indicates the application policy of the ruleset and enables the administrator to 128
129 toggle the policy. See Changing application policy of rulesets for more details. - Removes the ruleset The interface allows the administrator to: Enable/Disable rulesets Change application policy of rulesets Remove rulesets Enabling/Disabling Rulesets The rulesets can be enabled or disabled individually or collectively from the Rules interface. To enable or disable a single ruleset, select or unselect the checkbox beside the ruleset in the 'Actions' column To enable inactive rulesets collectively, select the rules by marking the checkboxes at the left of the rulesets to be enabled and click the 'Enable' button from the bottom of the right pane. To disable active rulesets collectively, select the rules by marking the checkboxes at the left of the rulesets to be disabled and click the 'Disable' button from the bottom of the right pane. After making the changes, click the 'Apply' button in the confirmation pane that appears at the top to apply the changes. Changing application policy of rulesets A ruleset can be applied in two ways: Alert Policy - The content flow check system generates an alert when a data packet from applications identified by a rule in the ruleset is encountered and passes the packet. The policy is indicated by alert icon. Drop Policy - The content flow check system blocks the data packet from an application identified by a rule in the ruleset without generating an alert. The policy is indicated by shield icon. The 'Application Identification' rulesets can be enabled or disabled individually or collectively from the 'Application Identification' interface. To toggle the policy of a ruleset from 'Alert' policy to 'Drop' policy, click the 'Alert' icon in the row of the ruleset under the 'Actions' column To toggle the policy of a ruleset from 'Drop' policy to 'Alert' policy, click the 'Shield' icon in the row of the ruleset under the 'Actions' column To toggle the policy of a group of rulesets with 'Alert' policy to 'Drop' policy, select the rulesets by marking the checkboxes at the left of the ruleset file names and click the 'Drop' button at the bottom of the interface To toggle the policy of a group of rulesets with 'Drop' policy to 'Alert' policy, select the rulesets by marking the checkboxes at the left of the ruleset file names and click the 'Alert' button at the bottom of the interface After making the changes, click the Apply button in the confirmation pane that appears at the top to apply the changes. Removing rulesets Unwanted Application Identification rulesets can be removed from Comodo Korugan from the 'Application Identification' interface. To remove a single ruleset click the delete icon and click 'OK' in the confirmation dialog in the row of the ruleset filename, under 'Actions' column To remove a group of rulesets collectively, select the them by marking the checkboxes at the left of the 129

130 ruleset file names and click the 'Delete' button at the bottom of the interface. Click 'OK' in the confirmation dialog 8.6 Configuring Wireless Hotspot Comodo Korugan features Hotspot service that provides Internet connection to mobile device users through WiFi from the uplink device or external network zone interface by which the appliance is connected to Internet. The Hotspot interface enables the administrator to configure the captive portal service for authenticating the Wi-Fi connections and regulate the connection sessions. The authentication can be chosen from two methods: Using Turkish Identification Number Using one time password (OTP) sent to the user's device through SMS Note: For enabling authentication through SMS, the administrator should have subscribed for the OTP service from a SMS token service provider. The administrator can also create a whitelist of devices, enabling the device users to login to the Hotspot service without the need of authenticating themselves every time. To access the 'Hotspot' interface, click 'Services' > Hotspot' from the left hand side navigation. The following sections provide more details on: Configuring Captive Portal Service Customizing the Login Page 130
131 Adding and Managing Permanent Users Configuring Captive Portal Service The Configuration interface allows the administrator to enable/disable the Captive Portal service and configure the authentication process for the end-users to login and connect to the hotspot. If the captive portal service is enabled, the administrator can choose the method of authentication for the users to login to the WiFi hotspot and connect to Internet. Authentication Options: Authentication with Turkish Identification Number - The end-users that attempt to connect to the hotspot need to enter their 11 digit Turkish Identification Number. The user will be authenticated upon validation of the number. SMS Authentication - Korugan sends an one-time-password (OTP) as authentication token to the user's SMS enabled mobile device, like smartphone. The end-user needs to enter the token in the login screen displayed at the time of login attempt to connect to the hotspot. When an user attempts to connect o the hotspot, the login screen will be displayed requesting the user to enter the phone number. 131

132 On receiving the phone number, Korugan sends a random generated OTP to the device through SMS. The user needs to enter the OTP in the next screen to authenticate him/herself. 132
133 To configure the Captive Portal Service Open the Configuration interface by clicking Services > Hotspot from the left hand side navigation and selecting the 'Configuration' tab. 133
134 Enable Captive Portal Service - Use the toggle switch to enable or disable the captive portal service for the Wi-Fi hotspot Captive Portal Options Enable Authentication with Turkish Identification Number - Enables the end-users to authenticate themselves by entering their Turkish Identification Number. Enable SMS Authentication - Enables the end-users to authenticate themselves by entering the the OTP sent to their mobile devices. Note: For SMS type authentication, the administrator should have subscribed for the SMS token service from a third-party SMS service provider and obtained the API URL for the same. The API should be integrated to the UTM appliance by entering the URL in this interface. On selecting the SMS authentication, you need to configure the following options: Request type - Choose the HTTP Request Type of the API from the SMS service provider from the dropdown. The options available are GET and POST. Request URL - Enter the SMS Send Request URL obtained from the service provider in the 'SMS Send 134
135 HTTP Request' text field. The URL should contain $$NUMBER$$ for the phone number variable and $ $MESSAGES$$ variable for the OTP to be sent. Example: Session Time Option Session Time - Enter the maximum period (in hours) for which a single Wi-Fi connection session is allowed for a user. The user will be automatically logged out on lapse of the period. To continue, the user needs to re-authenticate and login to the hotspot. Click 'Save' for your settings to take effect Customizing the Login Page The administrator can customize the login page for the hotspot, to display the logo/brand image and a welcome message. To customize the Wi-Fi login page Click 'Services' > 'Hotspot' from the left hand side navigation and select the 'Login Page' tab. To upload the logo/brand image of the organization click 'Browse', navigate to the image file stored in the local disk of the computer and click 'Open'. To display a custom message in the login screen, enter the message in the 'Company Message' text box. Clicking 'Show Preview' will display the login page in a new browser window for confirmation. Click 'Upload image and Save' to save your login page Adding and Managing Permanent Users Korugan allows the administrator to add a list of permanent users, who can be given access to the hotspot without the need of authenticating them. The hotspot service maintains a whitelist of devices to which access can be granted without authentication. The administrator can obtain the MAC address of the devices to be added to the whitelist and add them to the appliance through the 'Permanent Users' interface. The users added to the Permanent Users interface can connect to the hotspot without entering the Turkish Identification number/one time password (OTP) to the login page. 135
136 To add devices to the whitelist Click 'Services' > 'Hotspot' from the left hand side navigation and select the 'Permanent Users' tab. Enter the MAC address of the device to be added to the whitelist and click 'Save'. The device will be added to the whitelist To remove a device from whitelist, delete the MAC address from the box and click 'Save'. 8.7 Traffic Monitoring Comodo Korugan uses NTOP service for traffic measurement and monitoring. The service monitors the traffic in and to all the network zones and provide very detailed traffic statistics. Using the reports, the administrator can analyze and identify several network factors like: the hosts that are consuming most of the bandwidth resources; the protocols that were most used; the network applications that were most used; the local hosts that share large amount of data; the time at which the network resources are most used the websites that were visited most by the users in different network zones; and so on. The Traffic Monitoring service can be enabled from the Traffic Monitoring interface. Once enabled, the administrator can access the Ntop administrative interface that shows summaries, graphs and detailed statistics of the network traffic sorted by protocols, hosts, IP addresses and so on. The administrator can also configure the Ntop service by enabling plugins for additional features like Netflow collection, Round Robin Database (RRD), sflow and more. To access the Traffic Monitoring interface, click 'Services' > 'Traffic Monitoring' from the left hand side navigation. 136
137 To enable the Traffic Monitoring service, select the 'Enable Traffic Monitoring' checkbox. Once enabled, the access link to the Ntop administrative interface will appear beneath the checkbox. To access the administrative interface, click the administration interface link in the text below the checkbox The Ntop administration interface will open in a new browser window. The interface displays the statistical summaries and detailed reports as tables, graphs and text reports. The administrator can drill down the reports based on finer parameters under each category for their analysis. Also, the administrator can configure the service for additional features from the interface. 137

138 For more details, refer to the online documentation for Ntop services by clicking About > Online Documentation from the interface, or visit the Ntop online documentation page at Quality of Service Comodo Korugan enables administrators to define Quality of Service (QoS) rules to set priority of IP traffic for the services that are more essential or have more importance than the others. The services, for example, interactive services like VoIP, require prioritized bandwidth resource over bulk traffic for instant data transfer. QoS rules can be created to reserve the bandwidth resources for these services from the available bandwidth for both incoming and outgoing traffic, so that the services run at their full efficiency, all the time. 138
139 A QoS rule is defined with three building blocks: Target Device - A target device is a network interface (LAN/WiFI/Uplink/ etc) or network zone to which bandwidth controls are applied. Administrators can allocate maximum downstream and upstream bandwidth in Kbits/s for each selected device. Devices need to be defined before creating classes and rules. Class - Classes are logical groups of traffic with specific bandwidth throttling settings. For each device you create, four default 'classes' are automatically created with high, medium, low and bulk traffic priority levels. Administrators can edit the settings of these default classes and add new classes as required. Classes can be added to the rules that you deploy. Rule - Implementation of a bandwidth 'class' to the traffic of a selected service from/to a device. Administrators can select traffic according to services (ex: TCP port 22), traffic source or TOS/DSCP flag (Standard IP header) and can apply a traffic class that has been defined previously. The QoS rules can be created from the Quality of Services interface. To access the QoS interface, click 'Services' > Quality of Service' from the left hand side navigation. The interface contains three tabs: Devices Classes Rules Devices The 'Devices' tab displays the list of target devices configured with bandwidth resource allocations and allows the administrator to define new target device to be used in a QoS rule. A target device is a combination of interface device 'Type' (LAN/WiFI/Uplink/ etc) and that interface's maximum downstream and upstream bandwidth, in Kbits/s. It is possible to specify more than one Device of the same type. For example, LAN 1 may have a different upstream/downstream speeds to LAN 2 Once a Device is added, all devices of that type will be assigned a color designation to easily identify that type. For example, all 'WIFI' devices will be assigned the color 'Blue'. Four default 'Classes' (bandwidth rules) will be automatically created for the Device in the 'Classes' tab. These classes are suggestions. They have not yet been applied to any device and can be edited at leisure. Devices are used to form the basis of 'Classes' Refer to the section Step 1 - Define the target device for QoS rule for more details creating a new target device. 139
 The allotted bandwidth for outgoing traffic for the device in kbits/sec Actions Displays control buttons for managing the target device.")
140 QoS Devices Table - Column Descriptions Column Description Device The target network interface device for a QoS rule Downstream Bandwidth (kbit/s) The allotted bandwidth for incoming traffic for the device in kbits/sec Upstream Bandwidth (kbit/s) The allotted bandwidth for outgoing traffic for the device in kbits/sec Actions Displays control buttons for managing the target device. - The checkbox allows the administrator to switch the target device between enabled and disabled states. - Opens the 'Edit' interface and enables to edit the allocation for the device. The 'Edit' interface is similar to creating a new target device for a QoS rule. Refer to the section Step 1 - Define the target device for QoS rule for more details. - Removes the target device. Classes The 'Classes' tab displays a list of available bandwidth throttling settings which can be added to a 'Rule' which is in turn deployed to a specific traffic. For each target device under the Devices tab, four classes are auto-created with respective priorities and reserved bandwidth resources: High Priority Medium Priority Low Priority Bulk Traffic The classes can be edited by the administrators as required: Admins determine Min and Max % of available bandwidth that can be used by the class. Available bandwidth was determined in the 'Devices' section. Admins can apply 'priority' (High, Medium, low). This determines the process priority level assigned to the traffic relevant to the service defined in the rule. Classes can be ordered using the arrow buttons. Classes at the top are the first to be processed when the bandwidth does not suffice for all the traffic. The interface allows the administrator to edit the existing classes and to add new classes. Refer to the section Step 2 - Manage QoS classes for more details. 140

141 QoS Classes Table - Column Descriptions Column Description Name The name of the class. The auto-created classes include the target device name and the priority in their names. Device The target device associated with the class Reserved The bandwidth resource reserved for the class, shown as percentage of the bandwidth allotted for the target device Limit The maximum bandwidth resource that may be used the class, shown as percentage of the bandwidth allotted for the target device Priority The priority allotted to the class. Actions Displays control buttons for managing the class. - Opens the 'Edit' interface and enables to edit the parameters of the class. Refer to the section Step 2 - Manage QoS classes for more details. / - The arrows allow the administrator to move the class up or down. The classes are processed in order from the top for prioritizing traffic when the available bandwidth for the UTM appliance falls below sufficient level. - Removes the class. Rules A QoS Rule defines which bandwidth class is to be applied to the traffic pertaining to a specific service. The 'Rules' tab displays a list of QoS rules defined for high priority services and allows the administrator to create new rules to specify the QoS class for the traffic pertaining to a selected service. 141

142 QoS Rules Table - Column Descriptions Column Description Source The source of the traffic pertaining to the service for which the rule is created. The source can be a network zone, interface device, a network, IP address or a MAC Address. Destination The destination of the traffic. The destination can be a network zone or IP address(es) connected to the target network interface device specified in the Traffic Class column. Protocol The protocol adopted by the traffic. Service The service for which the rule is created. TOS/DSCP The Type of Service (TOS)/Differentiated Services Code Point (DSCP) of the service. Traffic Class Select the QoS Class for the traffic. Actions Displays control buttons for managing the rule. - The checkbox allows the administrator to switch the rule between enabled and disabled states. - Opens the 'Edit' interface and enables to edit the parameters of the rule. The Edit interface is similar to Add QoS Rule interface. Refer to the section Step 3 - Create QoS rule for the service for more details. - Removes the rule. Adding a Qos Rule Defining a QoS rule involves three steps: Step 1 - Define the target device for Qos Rule Step 2 - Manage QoS classes Step 3 - Create QoS rule for the service Step 1 - Define the target device for QoS rule The first step in creating a QoS rule for a service is to define a target network interface device with pre-allotted bandwidth resource usage. To create a target device Open the 'Quality of Service Devices' interface by clicking the 'Devices' tab under 'Services' > 'Quality of 142

143 Service' Click the Create new item link at the top left The Add Quality of Service Device pane will open. Enter the parameters for the new target device as shown below: Target Device - Select the network interface device from the drop-down Downstream Bandwidth - Enter the usable bandwidth for incoming traffic in kbits/sec Upstream Bandwidth - Enter the usable bandwidth for outgoing traffic in kbits/sec Enabled -Select this checkbox to activate the device immediately upon creation Click 'Add' to save the target device with its bandwidth resource allocations. The target device will be added to the 'Devices' list. Step 2 - Manage the QoS classes For each target device added under the 'Devices' tab, four classes are automatically created with different priority levels: High Priority 143
144 Medium Priority Low Priority Bulk Traffic Each class will be assigned with reserved bandwidth usage from the bandwidth allotted to the target device and a priority ranking between one and ten. The administrator can edit these parameters of the auto-created classes and change their order in the list of classes as the classes and hence the rules using these classes, are processed in order from the top for prioritizing traffic when the available bandwidth for the UTM appliance falls below sufficient level. If needed, the administrator can create new QoC classes for use in rules. To add a new class Open the 'Quality of Service Classes' interface by clicking the 'Classes' tab under 'Services' > 'Quality of Service' Click the Create new item link at the top left The 'Add Quality of Service Class' pane will open. 144

145 Enter the parameters for the new class as shown below: Reserved - The bandwidth usage that can be reserved for the class, specified as percentage of the overall bandwidth resource allotted to the target device to be chosen below. Name - The name of the class for identification. Priority - The priority ranking for the class, chosen between 1 an 10 from the drop-down Limit - The maximum percentage of the overall bandwidth resource available to the target device, 145
146 that can be assigned to the class QoS Device - The target device for which the class is created, chosen from the drop-down Note: The sum of the reserved bandwidths for all the classes pertaining to a single device cannot exceed 100%. The reserved bandwidth for a single class cannot exceed its limit bandwidth. Click 'Save' to add the QoS class to the list. To modify the parameters of a class Click the Edit icon in the row of the class to be edited, from the Actions column. The Edit pane will appear, enabling the administrator to modify required parameters. The edit pane is similar to the 'Add Quality of Service Class' pane. Refer to the section above for more details. Step 3 - Create QoS rule for the service The administrator should specify QoS rule that specifies the QoS class to be adopted by the type of traffic pertaining to a specified class. To create a new rule Open the 'Quality of Service Rules' interface by clicking the 'Rules' tab under 'Services' > 'Quality of Service' Click the 'Create new item' link at the top left The 'Add Quality of Service Rule' pane will open. 146

147 Enter the parameters for the new rule as shown below: Comment - Enter a short description for the rule Service/Port - The Service/Port area enables you to specify the service for which the rule is created, the 147
148 protocol used by the service and the destination port(s). Service - Choose the type of service from the drop-down Protocol - Choose the protocol used by the service Destination port - Specify the destination port(s) of the service one by one, in the 'Destination Port' text box. Tip: The appliance is loaded with predefined combinations of service/protocol/port, like HTTP/TCP/80, <ALL>/TCP+UDP/0:65535, or <ANY>, which is a shortcut for all services, protocols, and ports. If you want to specify custom protocol/port combination, then select 'User Defined' from the service. You can also specify additional destination ports for standard combinations, for the services that run on ports different from the standard ones. Source - The Source area enables you to specify the source from which the traffic pertaining to the service originates. Choose the type of the source from the Type drop-down. Depending on the chosen type, you need to specify the values in the text box that appears on selecting the type. The options available are: Zone/Interface - If the source is a Network Zone/Interface, select the network zone(s)/interface device(s) from the Select interfaces text box. Network/IP - If the source is external network(s) or a machine(s), enter the network address(es) or IP address(es) one by one in the text box. MAC Address - If the source is machine(s) identified by its/their MAC address(es), enter the MAC address(es) one by one in the textbox. TOS/DSCP - The TOS/DSCP area enables you to specify the Type of Service (TOS) or Differentiated Services Code Point (DSCP) parameters, Choose the type of the TOS/DSCP parameter to be specified from the Type drop-down. Depending on the chosen type, you need to specify the values in the text box that appears on selecting the type. The options available are: TOS - Choose the TOS flag from the Match traffic drop-down, so that the traffic containing the flag will be applied with the rule DSCP Class - Choose the DSCP class from the Match traffic drop-down, so that the traffic with the DSCP class will be applied with the rule DSCP Value - Enter the DSCP value in the Match traffic text box, so that the traffic with the DSCP value will be applied with the rule Destination Device/Traffic Class - The Destination Device/Traffic Class area allows you to select the QOS class to be used for the traffic and the Destination Netwrok/IP. The first drop-down displays all the classes added to the QoS Classes interface. Choose the class from the drop-downs Enter the network address or IP address of the destination of the traffic in the Destination Network/IP textbox Enabled - Select the checkbox if you wish the rule to take effect immediately upon creation. Click 'Add' to save your rule. The rule will be added to the Qos Rules list and will be applied to the traffic, if enabled. 8.9 Internet Content Adaptation Protocol ICAP is a protocol that enables adapting or filtering content, translating language and content over internet. For example : By entering the IP address of the node that has MyDLP data prevention software and its ICAP service port number to Korugan interface, you can be benefited with prevention form data loss, content adaptation and HTTP data traffic. 148

149 To Add ICAP service: 9 Select 'Services' and click 'ICAP'. Enter the service name, for example : 'MyDLP'. Enter IP address of the node in which the service is installed followed by its ICAP service port number. Enter the path where the service is located Choose the message type of the data packet from the drop down. Check the options 'Should Bypass on Error' as per your requirement. If you need to have the service enabled, leave the 'Enable' option checked. Please note that this option is enabled by default. Managing Firewall Configuration Comodo Korugan contains a highly configurable packet filtering firewall which offers the highest levels of security against inbound and outbound threats. The firewall allows you to create rules for managing the following types of traffic: NAT - Network address translation (NAT) for traffic from a host in the network to external (SNAT), traffic from external source directed to a host in the network (Virtual IP) with port forwarding Incoming traffic - Traffic from external network zones to specified hosts in the internal network zone Outgoing traffic - Traffic from hosts to the external network zone Inter-zone traffic - Traffic between network zones connected to the appliance VPN traffic - Traffic generated by VPN users 149

150 System Access - Access to the UTM appliance Each traffic type requires a specific type of rule in order to allow or block traffic of that type. In addition to user defined rules for each type of firewall module, the appliance generates a set of rules called 'System Rules', that cannot be disabled or edited. System Rules are mandatory for correct interoperability of the services running on the UTM Appliance with the Network infrastructure. Clicking the 'Firewall' tab on the left opens a sub-menu which allows you to create and manage rules. The following sections provide detailed descriptions on rule construction for each firewall module: Firewall Objects Source Network Address Translation Configuring Virtual IP for Destination Network Address Translation Configuring System Access Configuring Firewall Policy Rules and VPN Traffic Rules 9.1 Firewall Objects A firewall address object can be defined as a network IP address, a range of IP addresses, a sub-net of a host or a set of hosts and can be used to quickly reference these defined addresses/host in any firewall rules you create. Once defined, the object can be edited at any time to change the referenced host(s) and the change will be propagated to all firewall rules which include that object. This relieves administrators of the burden of editing each individual firewall rule. A firewall object group can be defined with a group of firewall address objects, that enables the administrator to configure firewall rules for several objects at once, by just referencing the firewall group while configuring the rule. 150
151 The Firewall Objects enables the administrator to create and manage firewall address objects and firewall object groups for use in configuring the firewall rules in Comodo Korugan. Also the administrator can create a time schedule for the periods at which the Firewall needs to be active and configure integration with AD server for importing the users from the Active Directory. To access the 'Firewall Objects' interface, click 'Firewall' > 'Objects' from the left hand side navigation. The interface contains four tabs: Firewall Addresses - Allows the administrator to create and manage Firewall Address Objects. Refer to Managing Firewall Address Objects for more details. Firewall Groups - Allows the administrator to create and manage Firewall Object Groups. Refer to Managing Firewall Object Groups for more details. Schedule - Allows the administrator to create schedule objects that cover set the time periods for which the firewall should be active. Refer to Managing Firewall Schedules for more details. Active Directory - Allows the administrator integrate company's Active Directory (AD) server for importing users, adding them to Firewall objects and using them in firewall rules created for the users. Refer to Active Directory Integration for more details Managing Firewall Address Objects Firewall Address Objects can be created to reference a specific host or a group of hosts in the internal network infrastructure. Instead of continually entering the IP address/ip address range/subnet while creating firewall rules for a host computer or group, the administrator can just refer to the object name. If firewall rules are to be configured for a collection of objects, objects groups can be formed and can be referred to in the rule. Firewall address objects can be edited at anytime. Any changes will be effected in all rules which include the object. To create or manage firewall address objects Click 'Firewall' > 'Objects' from the left hand side navigation. Open the 'Firewall Addresses' interface by clicking the 'Firewall Addresses' tab. 151
 of the host computer(s) contained in the object.")
152 The 'Firewall Addresses' interface displays a list of firewall address objects added to Comodo Korugan and allows the administrator to create new objects. Firewall Address Objects Table - Column Descriptions Column Description Name The name of the firewall address object. Address The IP address(s) of the host computer(s) contained in the object. Type The reference type of the hosts in the object. It can be IP address, IP address range or Subnet. Comment A short description of the object Actions Displays control buttons for managing the object. - Opens the 'Edit' interface and enables to edit the parameters of the object. The Edit interface is similar to 'Add Object' interface. Refer to the section Creating a Firewall Address Object for more details. - Removes the object. Note: The object which is currently referenced in a firewall rule or in a group cannot be removed. To remove a group, the group is to be first removed from the firewall rule or group in which it is included. Creating a Firewall Address Object The firewall address object can be created in two ways: From the 'Add an Address' pane by defining a name for the object and the, IP address, IP range or subnet of the host(s) to be included in the object. Refer to the section below for more details. Importing users from Active Directory. Refer to the section Adding User to Firewall Objects under the section Active Directory Integration. To create a new object 152
 representing the host(s) included in the")
153 Click 'Firewall' > 'Objects' from the left hand side navigation and click the 'Firewall Addresses' tab. Click the 'Add an address' at the top left Enter the parameters for the new object as shown below: Name - Specify a name for the object (15 characters max) representing the host(s) included in the object. Comment - Enter a short description of the object. Type - Select the type by which the hosts are to be referred in the object. The available options are: Subnet - Select this if a sub network of computers is to be covered by the object and enter the sub network address IP address - Select this if a single host is to be covered by the object and enter the IP address of the host IP range - Select this if more than one host is to be covered by the object and enter the IP address range of the hosts Click 'Add'. The new object will be added to the list. The object will be available for selection for specifying source or destination while creating a firewall rule, by starting to type the first few letters of the object name. 153


154 9.1.2 Managing Firewall Object Groups Firewall object group can be created with a collection of firewall address objects, if the collection is required to be referenced as source and/or destination in the firewall rules configured in Comodo Korugan. The object groups can be edited at anytime to change the member objects included in it, and the change will be effected in all the firewall rules involving the object group, allowing collective management of different firewall rules at once. To create or manage firewall address object groups Click 'Firewall' > 'Objects' from the left hand side navigation. Open the 'Firewall Groups' interface by clicking the 'Firewall Groups' tab. The 'Firewall Groups' interface displays a list of firewall address object groups added to Comodo Korugan and allows the administrator to create and manage object groups. Firewall Groups Table - Column Descriptions Column Description Name The name of the firewall address object group. Address The member objects of the group. Comment A short description of the object group. Actions Displays control buttons for managing the object group. - Opens the 'Edit' interface and enables to edit the parameters of the object group. The Edit interface is similar to 'Add Group' interface. Refer to the section Creating a Firewall Address Object Group for more details. 154


155 - Removes the object group. Note: The object group which is currently referenced in a firewall rule cannot be removed. To remove a group, the group is to be first removed from the firewall rules in which it is included as source/destination. Creating a Firewall Address Object Group The firewall object group can be created in two ways: From the 'Add a Group' pane by defining a name for the group and the member objects to be included in the group. Refer to the section below for more details. Importing users from Active Directory. Refer to the section Adding User Groups as Firewall Object Groups under the section Active Directory Integration. To create a new object group Open the 'Firewall Groups' interface by clicking the 'Firewall Groups' tab under 'Firewall' > 'Objects' Click the 'Add a group' at the top left Enter the parameters for the new group as shown below: Name - Specify a name for the group (15 characters max). Comment - Enter a short description of the group. Addresses - Enter the names of the objects separated by comma, for inclusion in the group. Typing the first few letters of the name of an object will show the matching objects as a drop-down to select from. Click 'Add'. The new object will be added to the list. The group will be available for selection for specifying source or destination while creating a firewall rule, by starting to type the first few letters of the group name. 155
.")

156 9.1.3 Managing Firewall Schedules The 'Schedule' tab allows you to specify the days and times when a firewall rule should be active. For example, it could be that a more restrictive firewall rule is applied on weekends and non-working hours than the one during working hours (when greater flexibility may be required). Once a schedule object has been created in this interface, it can be applied it to a particular rule when creating or editing a rule in the 'Firewall' section. If the schedule of a rule needs to be changed, it is sufficient to edit the schedule object in this interface. The change will be propagated to all the rules to which the schedule object is applied. Korugan ships with a default and recommended schedule of 'Always' to keep the firewall activated at all times. Administrators may edit and create new schedules using the controls in the 'Actions' column. To access the Schedule interface Click 'Firewall' > 'Objects' from the left hand side navigation Click the 'Schedule' tab The 'Schedule' interface displays a list of existing schedule objects. Each schedule displays the days and times when the firewall will be active. Schedules Table - Column Descriptions Column Description Name Name to describe the schedule. Days The days of the week at which the rule is activated Start Time The time at which the rule is started on the days listed in the 'Days' column. 156

157 Stop Time The time at which the rule is disabled on the days listed in the 'Days' column. Actions Displays controls for managing the schedule. - Opens the 'Edit' interface and enables to edit the days and start and stop times of the rule. The Edit interface is similar to 'Add a Schedule' interface. Refer to the section Creating a new Schedule for more details. - Removes the schedule. Creating a new schedule A new firewall schedule object can be created from the 'Add a Schedule' pane by specifying the days and start/stop times for the rule. To create a new schedule Open the 'Schedule' interface by clicking the 'Schedule' tab under 'Firewall' > 'Objects' Click 'Add a Schedule' at top left Enter the parameters for the new schedule as shown below: Name - Specify a name for the schedule. Days - Select the days of the week at which the firewall should be active. Start Time and Stop Time - Enter a time at which the firewall should be started and stopped at the selected days in 24 Hrs time format. Click 'Add' for the new schedule to be created. The Schedule object will be available for selection while creating and editing individual firewall rules from the 'Policy Firewall' interface. 157

158 9.1.4 Active Directory Integration Integrating Korugan with your Active Directory (AD) server allows you to implement identity-based security on your network. Once a directory has been imported, Korugan will map usernames to IP addresses, thus allowing administrators to apply firewall policies to individuals or groups. Korugan uses the Lightweight Directory Access Protocol (LDAP) to import the list of network users from the AD server, track login activity and regulate traffic to and from the IP addresses of the users/groups. Integration of your AD server involves four steps: Step 1- Install the Comodo Korugan AD Agent onto the AD Server Step 2 - Add Socket Exception for the AD Agent in the server Step 3 - Configure the AD Agent Step 4 - Configure the AD Agent connection and LDAP server connection to the appliance Step 1- Install the Comodo Korugan AD Agent onto the AD Server In order to communicate, Korugan requires the installation of an agent on your AD server. 1. Download the Comodo Korugan AD Agent setup file from transfer it to the server from which the AD server is hosted. 2. Double click on the setup file to start the installation wizard. 158
 or C:\Program")

159 3. Follow the wizard and complete the installation. By default, the agent will be installed in the location C:\Program Files (32 bit system) or C:\Program Files (x86) (64-bit system). Step 2 - Add Socket Exception for the AD Agent in the server The next step is to configure a socket exception for the AD agent in the Windows Firewall of your server. This will allow the agent to communicate with Korugan. 159


160 1. Click the 'Windows Firewall' icon from the Windows Server Control Panel. This will open the 'Windows Firewall' configuration panel. 2. Click 'Allow a program or feature': 3. On the next screen, click 'Allow another program' to add the agent to the list of exceptions. 4. Click 'Browse' in the resulting 'Add a Program' dialog. Navigate to the installation folder of the agent and 160


161 select the file named 'ActiveADUsersService.vshost'. 5. Click OK in the 'Allow programs to communicate through the Windows Firewall' dialog to save the settings. Step 3 - Configure the AD Agent Next, the AD agent needs to be configured to connect to the Korugan appliance. 1. Browse to the agent installation folder (C:\Program Files on 32-bit system and or C:\Program Files (x86)) and double click 'ActiveADUsersService.exe'. 161
162 2. Configure the parameters as shown below: Connection Parameters Require Authentication - If you require password authentication for the appliance to connect o the server, select the 'Require Authentication' checkbox and enter a password in the 'Password' text box Listening Port - By default, the server listens to the appliance through the port If you want to change the port, enter the port number in the text field. Time Intervals Every Query Interval - Enter the time interval (in seconds) at which the agent should poll Korugan for updates. It is recommended to set the interval according to the size of the directory. Directories with larger numbers of users should be checked more frequently. Dead Entry Interval - Korugan will delete a username-ip map entry if a user has not logged-in for a certain period of time. For example, if the 'Dead Entry Interval' is set as 720 hours, then the username-ip map entry for the user will be deleted if the user does not login for 30 days. Tasks Show Logon Users - Displays the currently logged-in users and their IP addresses Select Domains - By default, the agent tracks login events for all domains which have been added to the AD server. Click the 'Select Domains' button to enable or disable tracking on specific domains. Set Group Filters - By default, the agent tracks login events for all AD user groups. Click the 'Set Group Filters' button to enable or disable tracking on specific domains. Set Ignore List - By default, the agent tracks login events for all AD users. Click the 'Set Ignore Users' button to choose which users should not be tracked. Sync Agent Configuration - Enables you to export the current configuration of the agent. Click 'Apply' to save the configuration Click 'Save and Close' to close the application window. The agent process will continue to run in the background. The agent is now configured to connect to the appliance. The next step is to configure the appliance to receive the connection. Step 4 - Configure the AD Agent connection and LDAP server connection to the appliance The next step is to configure Korugan to communicate with the agent and the AD server. In order to allow access to the appliance, Firewall Rules are to be created under Firewall > System Access interface, specifying the IP address/port and the service details. Refer to the following section Allowing Access to the Appliance for more details on creating the system access rules. A detailed description of System Access rules can be found in the section Configuring System Access. For the appliance to receive the username - IP address mapping tables and the updates from the agent, the IP address and port details of the server and the agent are to be entered to the administrative console. Refer to the following section Configuring the Active Directory Connection for more details. Allowing Access to the Appliance The System Access rules for allowing the the AD server and the agent are to be added to the appliance from the System Access interface. To add the rule for the server to access the appliance Open the 'System Access' interface by clicking 'Firewall' > 'System Access' from the left hand side navigation Click 'Add a new system access rule' link from the top left. 162

163 Enter the parameters for the new rule as shown below: Incoming Interface - Select 'Any' from the drop-down Source Address - Need not select any firewall object Service/Port - Select the LDAP service traffic received at port 389 Service - Choose 'LDAP' from the drop-down Protocol - By default TCP will be chosen Destination port - The default port number 389 will be auto-filled in the 'Destination Port' text box. If the LDAP port of the server is different from 389, enter the new port number. Policy - Choose 'Allow'. General Settings - Configure the General Settings to enable the rule, enable/disable logging of packets filtered by the rule, enter a short description and select a position for the rule in the list. Remark - Enter a short description for the rule. The description will appear in the Remark column of the respective Rules interface (Optional) Position - Set the priority for the rule in the list of rules in the respective rules interface. The rules in the iptables are processed in the order they appear on the list. Enabled - Leave this checkbox selected if you want the rule to be activated upon creation. Log all accepted packets - Select this checkbox if you want the packets allowed by the rule are to 163

164 be logged. Refer to the section Viewing Logs for more details on configuring storage of logs and viewing the logs. Click 'Add Rule' To add the rule for the agent to access the appliance Open the 'System Access' interface by clicking Firewall > System Access from the left hand side navigation Click 'Add a new system access rule' link from the top left. Enter the parameters for the new rule as shown below: Incoming Interface - Select 'Any' from the drop-down Source Address - Need not select any firewall object Service/Port - Select the TCP traffic received at port 389 Service - Choose 'User Defined' from the drop-down Protocol - Choose TCP from the drop-down Destination port - Enter the agent port as configured in the server in Step 3. (Default = 7004). Policy - Choose 'Allow'. General Settings - Configure the General Settings to enable the rule, enable/disable logging of packets filtered by the rule, enter a short description and select a position for the rule in the list. Remark - Enter a short description for the rule. The description will appear in the Remark column of the respective Rules interface (Optional) Position - Set the priority for the rule in the list of rules in the respective rules interface. The rules in the iptables are processed in the order they appear on the list. Enabled - Leave this checkbox selected if you want the rule to be activated upon creation. Log all accepted packets - Select this checkbox if you want the packets allowed by the rule are to be logged. Refer to the section Viewing Logs for more details on configuring storage of logs and viewing the logs. Click 'Add Rule'. The rules will be added to the System Access interface. Place new two rules to uppermost levels by clicking arrow buttons order. / and Click 'Apply' to apply new Configuring the Active Directory Connection 164
165 The Active Directory interface in the administrative console allows you to configure the appliance for the connection. To access the Active Directory interface Click 'Firewall' > 'Objects' from the left hand side pane Click the 'Active Directory' tab Enter the parameters for the agent and the AD server as shown below: Active Directory Agent Connection Agent Connection - Choose 'Enabled' to enable the connection from the agent IP Number - Enter the IP address of the server on which the agent is installed Port - Enter the agent connection port as configured in the server in Step 3. (Default = 7004). Password - Enter the password if it is set on agent in Step 3 Click 'Update' to save and activate the agent connection. LDAP Server Connection 165
.")

166 LDAP Server IP - Enter the IP address of the AD server. The IP address is generally same with the agent's address. Port - Enter the LDAP service port of the server. By default, the LDAP port is 389. If you have configured a different port, enter the new port number. Common Name Identifier - Enter the Common Name Identifier of Active Directory. (Default = CN). Domain Name - Enter the Domain Name to select which domain is going to monitored on LDAP Table displayed at the bottom of the page. Username and Password - Enter the Username and Password of a user account that has the 'Read' access the AD server. 'Write' access is not required. Click 'Update' to save and activate the AD server connection. The selected domain(s) will be displayed in the 'LDAP Table' at the bottom of the interface. Clicking the Domain name expands the tree structure of the active directory. You can add the users to firewall objects and user groups to firewall object groups from the tree LDAP table. Adding User to Firewall Objects Click the Domain name to expand the tree structure of the active directory. Locate the user by expanding the parents. Click 'Add User' to add the user to Firewall Objects. Adding User Groups to Firewall Objects 166

167 Click the Domain name to expand the tree structure of the active directory. Locate the user group by expanding the parents. Click 'Add Group' to add the user group to Firewall Object Groups. 9.2 Source Network Address Translation In order to safeguard the hosts in the internal network zones from external attacks, Comodo Korugan masquerades the IP addresses for the outbound traffic from all the network zones with the IP address of the primary uplink device, by default. If the outgoing traffic from a specific host in the network infrastructure should contain the IP address assigned to the host, then a Source NAT (SNAT) rule can be configured for it. This is useful If a server in the network infrastructure hosts a web service or a web based application and the outgoing packets from the servers should contain the external IP address of the server instead of that of the uplink device or a masqueraded IP address. For example, if one of the hosts in the DMZ acts as a mail server, an SNAT rule can be created so that one of the static IP addresses assigned to the mail server will be used as masqueraded IP address for the outgoing traffic from the mail server. Tip: Comodo Korugan also allows you to create Destination NAT (DNAT) rules for incoming traffic for redirecting service specific traffic from a port on a host or interface to another host/port combination, especially to limit access from untrusted external networks to the hosts in the network infrastructure. Refer to the next section Configuring Virtual IP for Destination Network Address Translation for more details. The SNAT rules can be created and managed from the 'SNAT' interface. To access the SNAT interface, click 'Firewall' > 'SNAT' from the left hand side navigation. 167

168 The 'SNAT' interface displays a list of the current SNAT rules in effect and allows the administrator to create new rules. SNAT Table - Column Descriptions Column Description # ID number of the rule. SNAT is applied based on the first matching rule in the list, regardless of other matching rules that follow, hence the order of the rules play an important role in NAT. Source The Firewall Object containing the IP address, IP address range or subnet of the host(s) from which the traffic originates Destination The interface device through which the traffic is directed to external network Service The service that uses the traffic, indicated as the protocol and the port used NAT to The IP address of the host, to be contained in the headers of the outgoing packets Remark A short description of the rule Count Indicates the number of packets and size of data intercepted by the rule. Actions Displays control buttons for managing the rule. - The checkbox allows the administrator to switch the rule between enabled and disabled states. - Opens the 'Edit' interface and enables to edit the parameters of the rule. The Edit interface is similar to Add Rule interface. Refer to the section Creating an SNAT rule for more details. - Removes the rule. Clicking the right arrow button beside 'Show system rules' displays a list of SNAT rules auto generated by the UTM appliance. These rules cannot be modified or removed. 168

169 Creating an SNAT rule The Source NAT rule can be created from the Source NAT rule Editor pane by defining the source of the outgoing data traffic, destination, service and the IP address to be masqueraded. To create a new SNAT rule Open the 'SNAT' interface by clicking 'Firewall' > 'NAT' from the left hand side navigation Click the 'Add a new Source NAT Rule' link at the top left 169

170 Enter the parameters for the new rule as shown below: Source - Specify whether the origin of the traffic to be intercepted by this rule, is a Network address/ip address or the SSL VPN user by choosing the option from the 'Type' drop-down. 1. Network address/ip address - Choose the Firewall Object containing the IP address, IP Address Range or the subnet of the host(s) from the 'Select network/ips' drop-down. If a firewall object covering the IP address/ip Address range or the subnet to be specified has not been created under the Firewall Objects interface previously, you an create a new object from this interface too. To create a new firewall object Click the drop-down arrow and click 'Create' at the bottom of the list. A new pane for creating a new object will appear. 170
171 Name - Specify a name for the object (15 characters max) representing the host(s) included in the object. Comment - Enter a short description of the object. Type - Select the type by which the hosts are to be referred in the object. The available options are: Subnet - Select this if a sub network of computers is to be covered by the object and enter the sub network address IP address - Select this if a single host is to be covered by the object and enter the IP address of the host IP range - Select this if more than one host is to be covered by the object and enter the IP address range of the hosts Click 'Add'. The new object will be added and will be available for selection from the Select network/ips drop-down. 171

172 The new object will also be added to the list of objects under Firewall Objects and will be available for selection for creating other firewall rules too. 2. SSLVPN User - Choose the SSL VPN user from the 'Select SSLVPN users' drop-down. Destination - Specify the whether the destination of the traffic is network zone/uplink device/vpn, network address/ip address or the SSL VPN user. 1. Zone/VPN/Uplink - Choose the interface device, the VPN or the physical port to which the interface is connected, from the 'Select interfaces' drop-down. 2. Network address/ip address - Choose the Firewall Object containing the IP address, IP Address Range or the subnet of the host(s) from the 'Select network/ips' drop-down. If a firewall object covering the IP address/ip Address range or the subnet to be specified has not been created under the Firewall Objects interface previously, you an create a new object from this interface too. Refer to the explanation above for more details. 3. SSLVPN User - Choose the SSL VPN user from the 'Select SSLVPN users' drop-down. Service/Protocol/Port - Select the type or the service hosted by the source, the protocol and the port used by the service. Service - Choose the type of service from the drop-down Protocol - Choose the protocol used by the service Destination port - Specify the destination port(s) of the service one by one, in the 'Destination Port' text box. Tip: The appliance is loaded with predefined combinations of service/protocol/port, like HTTP/TCP/80, <ALL>/TCP+UDP/0:65535, or <ANY>, which is a shortcut for all services, protocols, and ports. If you want to specify custom protocol/port combination, then select 'User Defined' from the service. You can also specify additional destination ports for standard combinations, for the services that run on ports different from the standard ones. NAT - The NAT option allows you to choose whether or not to apply the NAT. On applying NAT, the IP address/port contained in the headers of the data packets will be changed to the IP address selected from the drop-down at the right. Choose the NAT option from the drop-down at the left. The options available are: 1. NAT - The NAT will be applied. Choose the source IP address to be contained in the headers of the data packets from the drop-down at the right. The drop-down at the right displays the network zones, network interface devices and the IP addresses from which the outgoing traffic is allowed. Ensure that the outgoing traffic is allowed from the host. Open the Policy Firewall interface by 172
173 clicking Firewall > Firewall. Add a rule to allow outgoing traffic from the host. Refer to the section Configuring Firewall Policy Rules for more details. If you want a static IP address assigned to the server to be shown in the outgoing traffic, then add the IP address as an additional address for the uplink device through which the traffic will be routed to external network. Open Uplink Editor interface by clicking Network > Interfaces > Uplink Editor tab Click the Edit icon in the row of the uplink device Ensure that the 'Add additional addresses' checkbox is selected, enter the IP address/netmask into the textbox and click 'Update Uplink'. Selecting 'Auto' or 'Zone <network zone> - IP: Auto' chooses the IP address of the respective outgoing interface No NAT - The Network Address Translation will not be applied Map Network - All IPs from the source subnet will be statically mapped to another network of the same size. Specify the subnet to which the IPs are to be mapped in the textbox at the right. General Settings - Configure the General Settings to enable/disable, enter a short description and select a position for the rule in the list. Enabled - Leave this checkbox selected if you want the rule to be activated upon creation. Remark - Enter a short description for the rule. The description will appear in the Remark column of the respective Rules interface Position - Set the priority for the rule in the list of rules in the respective rules interface. The rules in the iptables are processed in the order they appear on the list. Click 'Create Rule'. A confirmation dialog will appear. Click 'Apply'. The firewall will be restarted with the new rule applied. SNAT rule management activities are logged including date, time, type of event, subject id, component name and event outcome. 9.3 Configuring Virtual IP for Destination Network Address Translation Comodo Korugan allows you to redirect service specific traffic from a port on a host or interface to another host/port combination. Virtual IP rules can be used to limit access from untrusted external networks to the hosts in the network infrastructure. Examples: 1. Virtual IP rules can be specified for publishing services located in a host with private IP address to be accessible to external networks through a public IP address. For example, If a service is hosted on a server within the LAN network zone connected to the UTM appliance, it can be made accessible at the IP address/port combination of an uplink device connected to the appliance. 2. The UTM blocks SSH connection requests from untrusted external IP addresses to any host within the DMZ zone by default. If required, rules can be created to allow SSH access to specific host in the DMZ. In this way, the traffic from external network can be limited to specific hosts, safeguarding other hosts in the network infrastructure. Virtual IP rules can also be created for Load distribution - Distribute traffic directed to a single host to a range of IP addresses to avoid bottlenecks and overloading a single IP. Network Mapping - Translate the incoming traffic to a different sub-network. The network translation statically maps the addresses of a whole network onto addresses of another network. The Virtual IP rules can be created and managed from the 'Virtual IP' interface. To access the Virtual IP interface, click 'Firewall' > 'Virtual IP' from the left hand side navigation. 173

174 The 'Virtual IP' interface displays a list of the Virtual IP rules and allows the administrator to create new rules. DNAT Table - Column Descriptions Column Description Name Name to identify the rule Comment A short description of the rule Interface The interface through which the traffic is received External IP The external IP address or IP address range the host(s) to which the traffic pertaining to a service is directed. Mapped IP The IP address or IP address range of the destination host/device to which the traffic is to be redirected Protocol The protocol used by the service External Service Port The port or port range in the host(s)/device(s) to which the traffic is directed. Map to Port The port or port range in the destination host/device to which the traffic is to be redirected Actions Displays control buttons for managing the rule. - Opens the 'Edit' interface and enables to edit the parameters of the rule. The Edit interface is similar to Add Rule interface. Refer to the section Creating a Virtual IP rule for more details. - Removes the rule. Creating a Virtual IP rule Virtual IP rules can be created from the 'Add a Virtual IP' pane. To create a DNAT rule Open the 'Virtual IP' interface by clicking the 'Firewall' > 'Virtual IP' from the left hand side navigation. Click the 'Add a Virtual IP' link at the top left The 'Add a Virtual IP' pane will open. 174
 to which the connection request is received.")
175 Enter the parameters for the new rule as shown below: Name - Enter a name to identify the rule. Comment - Enter a short description of the rule'. Interface - Specify the interface through which the traffic is forwarded. External IP Address/Range - Specify the External IP address(es) to which the connection request is received. You can enter a single IP address or a range. If the traffic is directed to a single IP address, enter the address in both the fields. If the traffic is directed to a range of IP addresses, enter the start and end addresses in the respective fields. Mapped IP Address/Range - Specify the IP address(es) of the destination to which the traffic has to be redirected. You can enter a single IP address or a range. If the traffic is to be redirected to a single IP address, enter the address in both the fields. If the traffic is to be redirected to a range of IP addresses, enter the start and end addresses in the respective fields. Protocol - Choose the protocol used by the service External Service Port - Specify the port/port range to which the traffic is directed. If the traffic is directed to a single port, enter the port number in both the fields. If the traffic is directed to a port range, enter the start and end port numbers in the respective fields. Map to Port - Specify the port/port range to which the traffic is to be redirected. 175
176 If the traffic is to be redirected to a single port, enter the port number in both the fields. If the traffic is to be redirected to a port range, enter the start and end port numbers in the respective fields. Click 'Add' to save the rule. The rule will take effect immediately. Virtual IP rule management activities are logged. Items logged include date, time, type of event, subject id, component name and event outcome. 9.4 Configuring System Access The system access firewall rules manage the access to the Comodo Korugan UTM appliance from the hosts in various internal network zones and external networks. Comodo Korugan is pre-configured with firewall rules that allow the hosts in different network zones to access the UTM appliance for selected services like: DNS (through port 53); administrative interface (through port 10443); and DHCP service (through port 67) hosted by it. These rules are required for the hosts and clients to receive the essential services and for correct functioning of the appliance. Whenever a new service is enabled in the appliance, rules are auto-created to provide the service to hosts in the required network zones. The administrator can view the rules but can edit or remove the rules. Refer to the section explaining Show rules of system services for more details on how to view the rules. But the administrator can create and manage new rules to provide/block access to the appliance from the internal hosts for specific services and to allow/block access from external networks or specific external IP addresses. The system access firewall rules can be viewed and managed from the 'System access' interface. To access the 'System access' interface, click 'Firewall' > 'System access' from the left hand side navigation. The interface displays a list of system access firewall rules and enables the administrator to create new rules. System Access Firewall Rules Table - Column Descriptions Column # Description ID number of the rule. A packet is allowed or denied based on the first matching rule in the list, regardless of other matching rules that follow, hence the order of the rules play an important role in packet filtering. 176
 from which the traffic originates.")
177 From The interface of the UTM device at which the traffic is received. Source The firewall object/object group containing the IP addresses or subnet address of the internal or external host(s) from which the traffic originates. Service The service that uses the traffic, indicated as the protocol and the port used Policy Indicates the allow/block policy of the rule Remark A short description of the rule Count Indicates the number of packets and size of data intercepted by the rule. Actions Displays control buttons for managing the rule. - The checkbox allows the administrator to switch the rule between enabled and disabled states. - Opens the 'Edit' interface and enables to edit the parameters of the rule. The Edit interface is similar to Add Rule interface. Refer to the section Creating System Access Firewall rules for more details. - Removes the rule. Clicking the right arrow button beside 'Show rules of system services' displays the list of preconfigured/auto-created firewall rules for system access. These rules cannot be modified or removed. From this interface, the administrator can: Create new system access firewall rules Configure logging of packets intercepted by the rules Creating System Access Firewall rules 177

178 The system access firewall rules can be created from the 'Add a system access rule' pane by defining the source, the interface of the appliance at which the traffic is received and the service. To create a new rule Open the 'System access configuration' interface by clicking 'Firewall' > 'System access' from the left hand side navigation. Click the 'Add a new system access rule' link at the top left. The 'Add a system access rule' pane will open. 178
179 Enter the parameters for the new rule as shown below: Incoming Interface - Select the interface device(s) or physical ports to which the interface device(s) are connected from the drop-down, at which the traffic is received Source Address - Specify the source of the traffic for which the rule is to be applied. The source can be an internal or external network or a specific IP address, added as a Firewall object. Choose the Firewall Object(s) or Object Group(s) containing the IP address, IP Address Range or the subnet of the host(s) from the drop-down. If a firewall object covering the IP address/ip Address range or the subnet to be specified has not been created under the Firewall Objects interface previously, you an create a new object from this interface too. Note: For security and operational efficiency, specify individual or narrow ranges of IP addresses/subnets rather than large subnets. For example, /32 or /24 instead of /8. To create a new firewall object Click the drop-down arrow and click 'Create' at the bottom of the list. A new pane for creating a new object will appear. Name - Specify a name for the object (15 characters max) representing the host(s) included in the object. Comment - Enter a short description of the object. Type - Select the type by which the hosts are to be referred in the object. The available options are: Subnet - Select this if a sub network of computers is to be covered by the object and enter the sub network address 179

180 IP address - Select this if a single host is to be covered by the object and enter the IP address of the host IP range - Select this if more than one host is to be covered by the object and enter the IP address range of the hosts Click 'Add'. The new object will be added and will be available for selection from the drop-down. The new object will also be added to the list of objects under Firewall Objects and will be available for selection for creating other firewall rules too. System access rule activities are logged, including date, time, type of event, subject id, component name and event outcome. Service/Port - Select the type or the service hosted by the source, the protocol and the port used by the service. Service - Choose the type of service from the drop-down Protocol - Choose the protocol used by the service Destination port - Specify the destination port(s) of the service one by one, in the 'Destination Port' text box. Tip: The appliance is loaded with predefined combinations of service/protocol/port, like HTTP/TCP/80, <ALL>/TCP+UDP/0:65535, or <ANY>, which is a shortcut for all services, protocols, and ports. If you want to specify custom protocol/port combination, then select 'User Defined' from the service. You can also specify additional destination ports for standard combinations, for the services that run on ports different from the standard ones. Policy - Specify whether the packets matching the rule should be allowed or denied from the Policy drop-down. The options available are: Allow with IPS - The data packets from the source will be allowed after analyzing the packets with Intrusion Prevention System. Allow - The data packets will be allowed without filtering Drop - The packets will be dropped Reject - The packets will be rejected, and error packets will be sent in response General Settings - Configure the General Settings to enable/disable the rule, enable/disable logging of packets filtered by the rule, enter a short description and select a position for the rule in the list. Remark - Enter a short description for the rule. The description will appear in the Remark column of the 180
181 respective Rules interface (Optional) Position - Set the priority for the rule in the list of rules in the respective rules interface. The rules in the iptables are processed in the order they appear on the list. Enabled - Leave this checkbox selected if you want the rule to be activated upon creation. Log all accepted packets - Select this checkbox if you want the packets allowed by the rule are to be logged. Refer to the section Viewing Logs for more details on configuring storage of logs and viewing the logs. Click 'Add Rule'. A confirmation dialog will appear. Click 'Apply'. The firewall will be restarted with the new rule applied. 9.5 Configuring Firewall Policy Rules Comodo Korugan applies a firewall 'Policy' to manage the data traffic flowing in and out of and within your network. The policy is constructed from a series of firewall rules that are created and imposed for different types of data traffic. The rules can also be individually scheduled to be active only on specified time periods. Incoming traffic - Traffic from external network zones to specified hosts in the internal network zone Outgoing traffic - Traffic from hosts to the external network zone Inter-zone traffic - Traffic between network zones connected to the appliance VPN traffic - Traffic generated by VPN users The Firewall Rules interface allows the administrator to enable/disable the policy firewall and to create and manage the firewall rules with granular configuration. To access the 'Firewall Rules' interface, click 'Firewall' > 'Policy' from the left hand side navigation. 181

182 The interface contains two tabs: Policy Firewall - Allows the administrator to create and manage firewall policy rules for incoming, outgoing and inter-zone traffic. Refer to the section Managing Firewall Policy Rules for more details. VPN Firewall - Allows the administrator to create and manage firewall rules for regulating traffic from/to VPN users.. Refer to the section Managing VPN Firewall Rules for more details Managing Firewall Policy Rules The Firewall Policy interface allows the administrator to enable/disable the firewall policy and to create and manage the firewall rules for outgoing, incoming and inter-zone traffic. To access the Policy Firewall interface, click 'Firewall' > 'Policy' from the left hand side navigation and select the 'Firewall Policy' tab. 182
183 The interface displays two panes: Current Rules - The upper 'Current Rules' pane displays a list of rules in action and allows the administrator to add new rules and edit existing rules. Refer to the section Managing Firewall Rules for more details on viewing and managing the rules. Policy Firewall Settings - The lower ' Policy Firewall Settings' pane displays the current enabled/status of the policy firewall, allows the administrator to change the status and to configure the policy firewall log. Refer to the section Configuring the Policy Firewall Settings for more details. Managing Firewall Rules The 'Current Rules' pane displays a list of rules in action with their configuration parameters and allows the administrator to manage them and to create new rules. Policy Firewall Rules Table - Column Descriptions Category General Settings Column Description # Serial number of the rule. From The interface device or the network zone from which the traffic originates. To The interface device or the network zone to which the traffic is directed. 183
184 Web Protection Protection Source The Firewall Object or Object Group containing the IP address, IP Address Range or the subnet of the host(s) from which the traffic originates. Destination The Firewall Object or Object Group containing the IP address, IP Address Range or the subnet of the host(s) to which the traffic is directed. Schedule The schedule object that covers the time period for which the rule is active Service The service that uses the traffic, indicated as the protocol and the port used Policy Indicates the allow/block policy of the rule Remark A short description of the rule URL Filter Indicates whether the Web Filter security profile is enabled for the rule and the profile applied to the rule. Advanced Threat Protection Indicates whether the Advanced Threat Protection is enabled for the rule and the profile applied to the rule. SSL Intercept Indicates whether the HTTPS Intercept Web Filter security profile is enabled for the rule and the profile applied to the rule. Anti-spam (SMTP) Indicates whether the SMTP security profile is enabled for the rule and the profile applied to the rule. Advanced Threat Protection Indicates whether the Advanced Threat Protection is enabled for protection of the rule and a profile applied to the rule. IPS Indicates whether the Intrusion Protection System (IPS) security profile is enabled for the rule and the profile applied to the rule. 184

185 Count Indicates the number of packets and size of data intercepted by the rule. Rule ID Identity number of the rule as per the order of creation in the appliance. The traffic is allowed or denied based on the first matching rule in the ascending order of the ID numbers, regardless of order of the rules as displayed in the table. Actions Displays control buttons for managing the rule. - The checkbox allows the administrator to switch the rule between enabled and disabled states. - Opens the 'Edit' interface and enables to edit the parameters of the rule. The 'Edit' interface is similar to 'Policy Firewall Rule Editor' interface from which the new rules are created. Refer to the section Creating Policy Firewall rules for more details. - Removes the rule. Clicking the right arrow button beside 'Show system rules' displays a list of firewall rules auto generated by the UTM appliance. These rules cannot be modified or removed. Creating Policy Firewall rules A firewall rule for the firewall policy can be created from the 'Policy Firewall Rule Editor' pane by defining the source, destination, the service used by the traffic, selecting security profiles and the action to be taken on the traffic. To create a new firewall rule Open the 'Firewall Policy' interface by Clicking 'Firewall' > 'Policy' from the left hand side navigation and selecting 'Firewall Policy' tab. Click the 'Add a new firewall rule' link at the top left. The 'Policy Firewall Rule Editor' will open. 185
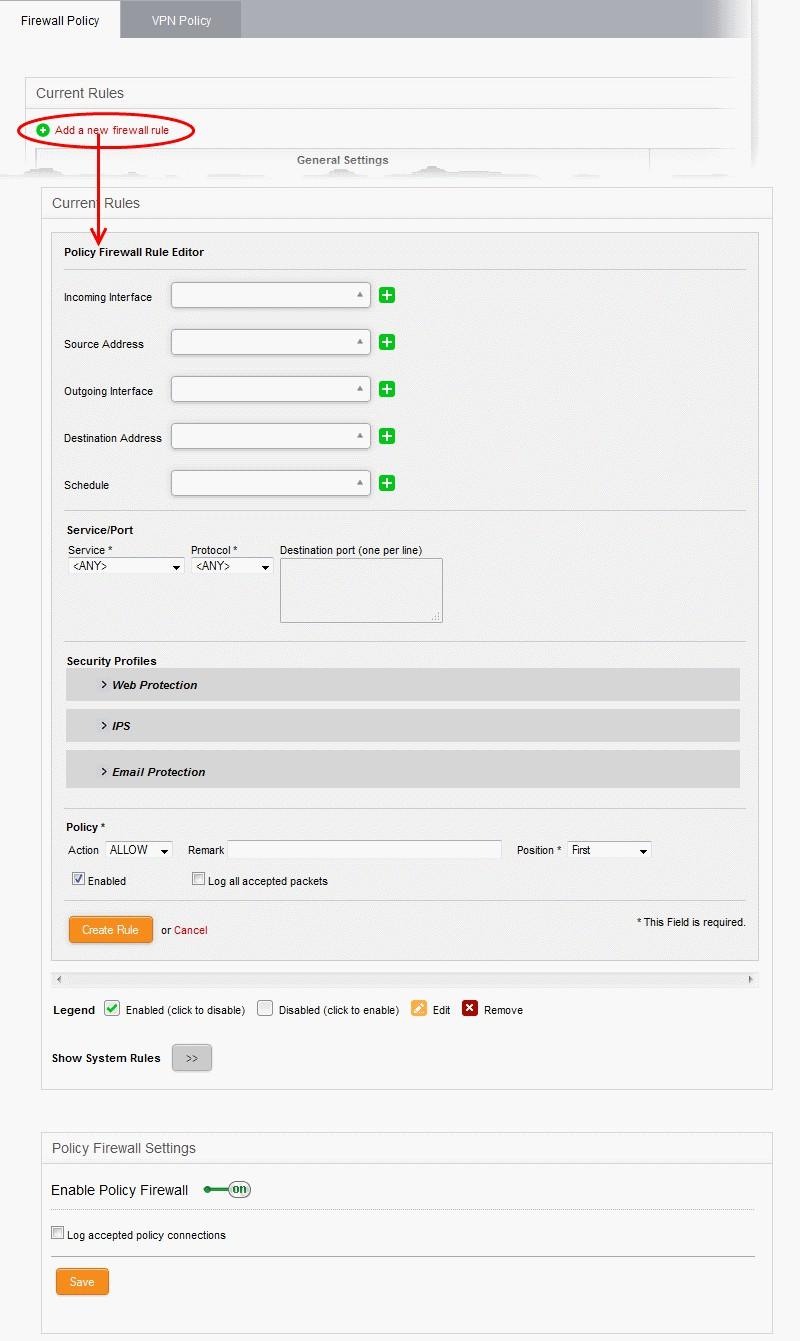
186 186
187 The 'Policy Firewall Rule Editor' interface is divided into four areas for specifying the different components of the rule: Address Settings and Schedule - Choose the source and destination of the traffic and set a schedule for the rule to be active Service/Port - Specify the service pertaining to the traffic to be intercepted by the rule Security Profiles - Configure profiles for web protection like URL filtering, Advanced Threat Protection (ATP) and HTTPS intercepts, Intrusion Protection System and protection like Antispam profile and ATP profile Policy Settings - Configure to allow or block the traffic intercepted by the rule Address Settings and Schedule Incoming Interface - Choose the interface device or the physical port at which the traffic is received, from the drop-down. Source Address - Choose the firewall object or the object group that covers the IP address, IP address range or the subnet, at which the traffic to be intercepted by the rule, is received. If a firewall object covering the IP address/ip Address range or the subnet to be specified has not been created under the Firewall Objects interface previously, you an create a new object from this interface too. To create a new firewall object Click the drop-down arrow and click 'Create' at the bottom of the list. A new pane for creating a new object will appear. 187
188 Name - Specify a name for the object (15 characters max) representing the host(s) included in the object. Comment - Enter a short description of the object. Type - Select the type by which the hosts are to be referred in the object. The available options are: Subnet - Select this if a sub network of computers is to be covered by the object and enter the sub network address IP address - Select this if a single host is to be covered by the object and enter the IP address of the host IP range - Select this if more than one host is to be covered by the object and enter the IP address range of the hosts Click 'Add'. The new object will be added and will be available for selection from the Select network/ips drop-down. 188

189 The new object will also be added to the list of objects under Firewall Objects and will be available for selection for creating other firewall rules too. Outgoing Interface - Choose the interface device or the physical port to which the traffic is directed, from the drop-down. Destination Address - Choose the Firewall Object or Object Group containing the IP address, IP Address Range or the subnet of the host(s) to which the traffic is directed, from the drop-down. If a firewall object covering the IP address/ip Address range or the subnet to be specified has not been created under the Firewall Objects interface previously, you an create a new object from this interface too. Refer to the explanation above for more details. Schedule - The Schedule Objects added to the Firewall Objects > Schedule interface will be available in the drop-down. Choose the schedule object(s) that cover the time period(s) for which the rule needs to be active from the drop-down. If the schedule object covering the required time period P to be specified has not been created under the Firewall Objects > Schedule previously and hence not available in the drop-down, you can create a new object from this interface too. To create a new schedule object Click the drop-down arrow and click 'Create' at the bottom of the list. A new pane for creating a new object will appear. 189
190 Name - Specify a name for the schedule. Days - Select the days of the week at which the firewall should be active. Start Time and Stop Time - Enter a time at which the firewall should be started and stopped at the selected days in 24 Hrs time format. Click 'Add' for the new schedule to be created. The new schedule object will also be available for selection in the drop-down and also will be added to the list of schedule objects under Firewall Objects > Schedule interface. The new object will be available for selection for creating other firewall rules too. Service/Port Service/Port - Select the type or the service hosted by the source, the protocol and the port used by the service. Service - Choose the type of service from the drop-down Protocol - Choose the protocol used by the service Destination port - Specify the destination port(s) of the service one by one, in the 'Destination Port' text box. Tip: The appliance is loaded with predefined combinations of service/protocol/port, like HTTP/TCP/80, <ALL>/TCP+UDP/0:65535, or <ANY>, which is a shortcut for all services, protocols, and ports. If you want to specify custom protocol/port combination, then select 'User Defined' from the service. You can also specify additional destination ports for standard combinations, for the services that run on ports different from the standard ones. Security Profiles The Security Profiles area allows you to enable/disable various security features for Web Protection, Intrusion 190
191 Prevention System (IPS) and Protection and choose pre-configured profiles for them. Web Protection - Clicking the down arrow in the 'Web Protection' stripe will open the security features for web protection: URL Filtering - Allows you to enable/disable the URL filtering to be applied to the traffic intercepted by the rule. To enable Web Filtering, move the toggle switch to ON position and select the URL filter profile that covers the websites to be blocked/allowed, from the drop-down. The rules with Web Filtering enabled and configured with a URL filter profile will be added for HTTP/HTTPS Proxy server settings. The URL Access policies for HTTP/HTTPS Proxy Server can be viewed from the 'Proxy' > 'HTTP/HTTPS' > 'URL Filter' interface. Refer to the section Configuring URL and Content Filtering Policies for more details. The 'Web Filter' drop-down displays a list of profiles created and managed under the 'Proxy' > 'HTTP/HTTPS' > 'URL Filter' interface. If the profile that covers the required websites to be specified has not been created under the 'Proxy' > 'HTTP/HTTPS' > 'URL Filter' previously and hence not available in the drop-down, you can create a profile from this interface too. Click the drop-down arrow and click 'Create' at the bottom of the list. A new pane for creating a new profile will appear. Refer to the section Configuring URL and Content Filtering for more details on creating a new profile. Advanced Threat Protection - Allows you to enable/disable Advanced Threat Protection (ATP) to be applied to the traffic intercepted by the rule. The ATP profiles can be created and managed from 'Services' > 'Advanced Threat Protection' > 'Profiles' interface. For more details on creating the ATP policies, refer to the section Managing ATP Profiles. To enable ATP for Web Protection, move the toggle switch to ON position and select the ATP profile, from the drop-down. 191
192 SSL Interception - Allows you to enable/disable HTTPS exceptions to be applied to the traffic intercepted by the rule. To enable SSL Interception, move the toggle switch to ON position and select the profile, from the drop-down. On selecting 'Default', the HTTPS Exceptions settings as configured under the 'Proxy' > 'HTTP/HTTPS' > 'HTTPS Exceptions' interface will be applied. Refer to the section Managing HTTPS Exceptions for more details. IPS - Clicking the down arrow in the 'IPS' stripe will open the security features for IPS: IPS - Allows you to enable/disable Intrusion Prevention System (IPS) to be applied to the traffic intercepted by the rule. To enable IPS, move the toggle switch to ON position and select the profile, from the drop-down. 192
193 On selecting 'Default', the rules settings as configured under 'Services' > 'Content Flow Check System' interface will be applied. Refer to the section Content Flow Check System for more details. Protection - Clicking the down arrow in the ' Protection' stripe will open the security features for Protection: Anti-Spam (SMTP) - Allows you to enable/disable the SMTP filtering to be applied to the traffic intercepted by the rule. To enable SMTP Filtering, move the toggle switch to ON position and select the profile, from the drop-down. On selecting 'Default', the SMTP filtering settings as configured under 'Proxy' > 'SMTP' interface will be applied. Refer to the section SMTP Proxy for more details. Advanced Threat Protection - Allows you to enable/disable Advanced Threat Protection (ATP) to be applied to the mail traffic intercepted by the rule. The ATP profiles can be created and managed from 'Services' > 'Advanced Threat Protection' > 'Profiles' interface. For more details on creating the ATP policies, refer to the section Managing ATP Profiles. To enable ATP for Protection, move the toggle switch to ON position and select the ATP profile, from the drop-down. 193
194 Policy Settings Action - Specify whether the packets matching the rule should be allowed or denied from the Policy dropdown. The options available are: Allow - The data packets will be allowed without filtering Deny - The packets will be dropped Reject - The packets will be rejected, and error packets will be sent in response Remark - Enter a short description for the rule. The description will appear in the Remark column of the Rules table. Position - Set the priority for the rule in the list of rules in the respective rules interface. The rules in the iptables are processed in the order they appear on the list. Enabled - Leave this checkbox selected if you want the rule to be activated upon creation. Log all accepted packets - Select this checkbox if you want the packets allowed by the rule are to be logged. Refer to the section Viewing Logs for more details on viewing the logs. Click 'Create Rule'. A confirmation dialog will appear. Click 'Apply'. The firewall will be restarted with the new rule applied. Configuring the Policy Firewall Settings 194
195 The lower 'Policy Firewall Settings' pane allows the administrator to enable/disable the Policy firewall rules and to opt for logging the packets that pass the rule. Use the 'Enable policy firewall' toggle switch to switch the state of the VPN firewall. Select the 'Log accepted policy connections' checkbox to log the packets that has passed the Firewall Policy. Refer to the section Viewing Logs for more details on viewing the logs. Click 'Save' for your settings to take effect. Policy firewall rule activities are logged, including date, time, type of event, subject id, component name and event outcome Managing VPN Firewall Rules Comodo Korugan can be configured for limiting incoming and outgoing traffic from/to users and hosts that are connected through SSL VPN and IPsec tunnels by creating appropriate VPN traffic firewall rules. For more details on configuring the UTM appliance to act as VPN server/client for VPN connections and SSL VPN User Accounts, refer to the sections SSL VPN Server and SSL VPN Client. For more details on configuring secure IPsec tunnel connections between external networks and sites to internal networks, refer to the section IPsec Configuration. The appliance is shipped with the VPN Firewall disabled, allowing both the incoming outgoing traffic between the VPN hosts and the hosts in the LAN zone without filtering and enabling the VPN hosts to access the hosts in all the other zones. The traffic from the VPN hosts are not subjected to filtering by the outgoing traffic firewall or the InterZone traffic firewall rules. The VPN Firewall can be enabled/disabled and the Firewall rules for VPN traffic can be created and managed from the VPN firewall Settings interface. To access the ' VPN firewall configuration' interface, click 'Firewall' > 'Policy' from the left hand side navigation and select the 'VPN Policy' tab. 195

196 By default, the VPN firewall is disabled. Click on the toggle switch beside 'Enable VPN firewall' to enable or disable the VPN firewall. If enabled, the interface displays two panes: Current Rules - The upper 'Current Rules' pane displays a list of rules in action and allows the administrator to add new rules and edit existing rules. Refer to the section Managing VPN Traffic Rules for more details on viewing and managing the rules. VPN Firewall Settings -The lower ' VPN Firewall Settings' pane displays the current enabled/status of the VPN firewall, allows the administrator to change the status and to configure the firewall log for the VPN connections. Refer to the section Configuring the VPN Firewall Settings for more details. Managing VPN Traffic Rules 196
197 The 'Current Rules' pane displays a list of rules in action with their configuration parameters and allows the administrator to manage them and to create new rules. VPN Firewall Rules Table - Column Descriptions Category General Settings Web Protection Protection Column Description # Serial number of the rule. From The interface device, the VPN tunnel or the network zone from which the traffic originates. To The interface device, the VPN tunnel or the network zone to which the traffic is directed. Source The Firewall Object or Object Group containing the IP address, IP Address Range, the subnet of the host(s) or VPN user(s) from which the traffic originates. Destination The Firewall Object or Object Group containing the IP address, IP Address Range, the subnet of the host(s) or the VPN user(s) to which the traffic is directed. Schedule The schedule object that covers the time period for which the rule is active Service The service that uses the traffic, indicated as the protocol and the port used Policy Indicates the allow/block policy of the rule Remark A short description of the rule URL Filter Indicates whether the Web Filter security profile is enabled for the rule and the profile applied to the rule. Advanced Threat Protection Indicates whether the Advanced Threat Protection is enabled for the rule and the profile applied to the rule. HTTPS Intercept Indicates whether the HTTPS Intercept Web Filter security profile is enabled for the rule and the profile applied to the rule. Anti-Spam (SMTP) Indicates whether the SMTP security profile is enabled for the rule and the profile applied to the rule. Advanced Threat Protection Indicates whether the Advanced Threat Protection is enabled for protection of the rule and a profile applied to the rule. IPS Indicates whether the Intrusion Protection System (IPS) security profile is enabled for the rule and the profile applied to the rule. Count Indicates the number of packets and size of data intercepted by the rule. Actions Displays control buttons for managing the rule. - The checkbox allows the administrator to switch the rule between enabled and disabled states. - Opens the 'Edit' interface and enables to edit the parameters of the rule. The Edit interface is similar to Add Rule interface. Refer to the section Creating Firewall rules for VPN Traffic for more 197
198 details. - Removes the rule. Clicking the right arrow button beside 'Show system rules' displays a list of firewall rules auto generated by the UTM appliance. These rules cannot be modified or removed. Creating Firewall rules for VPN Traffic The firewall rules for VPN traffic can be created from the 'VPN firewall rule editor' pane by defining the source, destination, the service used by the traffic, selecting security profiles and the action to be taken on the traffic. To create a new firewall rule Open the 'VPN Firewall' interface by clicking 'Firewall' > 'Policy' from the left hand side navigation and selecting the 'VPN Policy' tab. Click the 'Add a new VPN firewall rule' link at the top left. The 'VPN firewall rule editor' will open. 198
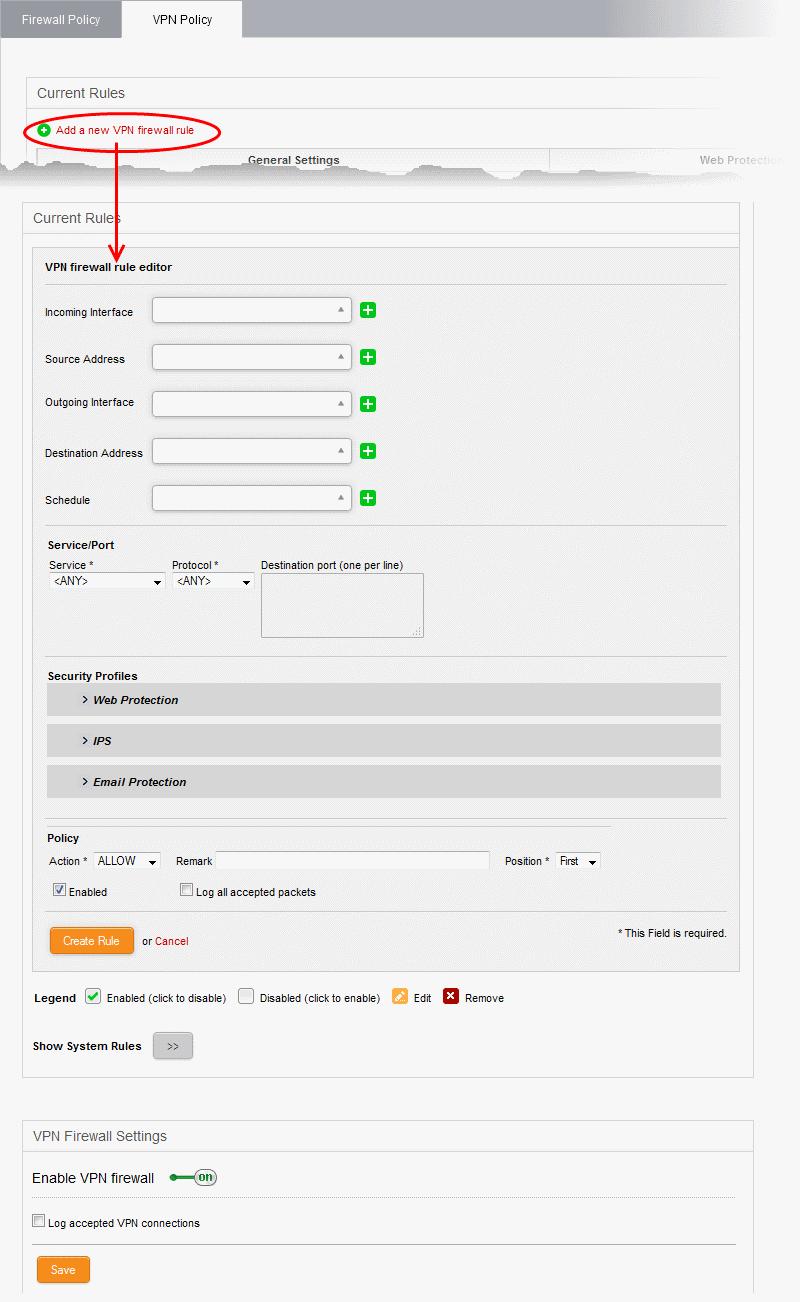
199 199
200 The 'VPN Firewall Rule Editor' interface is divided into four areas for specifying the different components of the rule: Address Settings and Schedule - Choose the source and destination of the traffic and set a schedule for the rule to be active Service/Port - Specify the service pertaining to the traffic to be intercepted by the rule Security Profiles - Configure profiles for web protection like URL filtering, Advanced Threat Protection (ATP) and HTTPS intercepts, Intrusion Protection System and protection like Antispam profile and ATP profile Policy Settings - Configure to allow or block the traffic intercepted by the rule Address Settings and Schedule Incoming Interface - Choose the interface device, VPN tunnel or the physical port at which the traffic is received, from the drop-down. Source Address - Choose the firewall object or the object group that covers the IP address, IP address range, the subnet or the VPN user(s), at which the traffic to be intercepted by the rule, is received. If a firewall object covering the IP address/ip Address range or the subnet to be specified has not been created under the Firewall Objects interface previously, you an create a new object from this interface too. To create a new firewall object Click the drop-down arrow and click 'Create' at the bottom of the list. A new pane for creating a new object will appear. 200
201 Name - Specify a name for the object (15 characters max) representing the host(s) included in the object. Comment - Enter a short description of the object. Type - Select the type by which the hosts are to be referred in the object. The available options are: Subnet - Select this if a sub network of computers is to be covered by the object and enter the sub network address IP address - Select this if a single host is to be covered by the object and enter the IP address of the host IP range - Select this if more than one host is to be covered by the object and enter the IP address range of the hosts Click 'Add'. The new object will be added and will be available for selection from the Select network/ips drop-down. The new object will also be added to the list of objects under Firewall Objects and will be available for selection for creating other firewall rules too. Outgoing Interface - Choose the interface device or the physical port to which the traffic is directed, from the drop-down. Destination Address - Choose the Firewall Object or Object Group containing the IP address, IP Address Range or the subnet of the host(s) to which the traffic is directed, from the drop-down. 201
202 If a firewall object covering the IP address/ip Address range or the subnet to be specified has not been created under the Firewall Objects interface previously, you an create a new object from this interface too. Refer to the explanation above for more details. Schedule - The Schedule Objects added to the Firewall Objects > Schedule interface will be available in the drop-down. Choose the schedule object(s) that cover the time period(s) for which the rule needs to be active from the drop-down. If the schedule object covering the required time period P to be specified has not been created under the Firewall Objects > Schedule previously and hence not available in the drop-down, you can create a new object from this interface too. To create a new schedule object Click the drop-down arrow and click 'Create' at the bottom of the list. A new pane for creating a new object will appear. Name - Specify a name for the schedule. Days - Select the days of the week at which the firewall should be active. Start Time and Stop Time - Enter a time at which the firewall should be started and stopped at the selected days in 24 Hrs time format. Click 'Add' for the new schedule to be created. The new schedule object will also be available for selection in the drop-down and also will be added to the list of schedule objects under Firewall Objects > Schedule interface. The new object will be available for selection for creating other firewall rules too. Service/Port Service/Port - Select the type or the service hosted by the source, the protocol and the port used by the service. 202
203 Service - Choose the type of service from the drop-down Protocol - Choose the protocol used by the service Destination port - Specify the destination port(s) of the service one by one, in the 'Destination Port' text box. Tip: The appliance is loaded with predefined combinations of service/protocol/port, like HTTP/TCP/80, <ALL>/TCP+UDP/0:65535, or <ANY>, which is a shortcut for all services, protocols, and ports. If you want to specify custom protocol/port combination, then select 'User Defined' from the service. You can also specify additional destination ports for standard combinations, for the services that run on ports different from the standard ones. Security Profiles The Security Profiles area allows you to enable/disable various security features for Web Protection, Intrusion Prevention System (IPS) and Protection and choose pre-configured profiles for them. Web Protection - Clicking the down arrow in the 'Web Protection' stripe will open the security features for web protection: URL Filtering - Allows you to enable/disable the URL filtering to be applied to the traffic intercepted by the rule. To enable Web Filtering, move the toggle switch to ON position and select the URL filter profile that covers the websites to be blocked/allowed, from the drop-down. The rules with Web Filtering enabled and configured with a URL filter profile will be added for HTTP/HTTPS Proxy server settings. The URL Access policies for HTTP/HTTPS Proxy Server can be viewed from the 'Proxy' > 'HTTP/HTTPS' > 'URL Filter' interface. Refer to the section Configuring URL and Content Filtering Policies for more details. The 'Web Filter' drop-down displays a list of profiles created and managed under the 'Proxy' > 'HTTP/HTTPS' > 'URL Filter' interface. If the profile that covers the required websites to be specified has not been created under the 'Proxy' > 'HTTP/HTTPS' > 'URL Filter' previously and hence not available in the drop-down, you can create a profile from this interface too. Click the drop-down arrow and click 'Create' at the bottom of the list. A new pane for creating a new profile will appear. Refer to the section Configuring URL and Content Filtering for more details on creating a new profile. Advanced Threat Protection - Allows you to enable/disable Advanced Threat Protection (ATP) to be applied to the traffic intercepted by the rule. 203


204 The ATP profiles can be created and managed from 'Services' > 'Advanced Threat Protection' > 'Profiles' interface. For more details on creating the ATP policies, refer to the section Managing ATP Profiles. To enable ATP for Web Protection, move the toggle switch to ON position and select the ATP profile, from the drop-down. SSL Interception - Allows you to enable/disable HTTPS exceptions to be applied to the traffic intercepted by the rule. To enable SSL Interception, move the toggle switch to ON position and select the profile, from the drop-down. On selecting 'Default', the HTTPS Exceptions settings as configured under the 'Proxy' > 'HTTP/HTTPS' > 'HTTPS Exceptions' interface will be applied. Refer to the section Managing HTTPS Exceptions for more details. IPS - Clicking the down arrow in the 'IPS' stripe will open the security features for IPS: IPS - Allows you to enable/disable Intrusion Prevention System (IPS) to be applied to the traffic intercepted by the rule. To enable IPS, move the toggle switch to ON position and select the profile, from the drop-down. 204
 - Allows you to enable/disable the SMTP filtering to")

205 On selecting 'Default', the rules settings as configured under 'Services' > 'Content Flow Check System' interface will be applied. Refer to the section Content Flow Check System for more details. Protection - Clicking the down arrow in the ' Protection' stripe will open the security features for Protection: Anti-Spam (SMTP) - Allows you to enable/disable the SMTP filtering to be applied to the traffic intercepted by the rule. To enable SMTP Filtering, move the toggle switch to ON position and select the profile, from the drop-down. On selecting 'Default', the SMTP filtering settings as configured under 'Proxy' > 'SMTP' interface will be applied. Refer to the section SMTP Proxy for more details. Advanced Threat Protection - Allows you to enable/disable Advanced Threat Protection (ATP) to be applied to the mail traffic intercepted by the rule. The ATP profiles can be created and managed from 'Services' > 'Advanced Threat Protection' > 'Profiles' interface. For more details on creating the ATP policies, refer to the section Managing ATP Profiles. To enable ATP for Protection, move the toggle switch to ON position and select the ATP profile, from the drop-down. 205


206 Policy Settings Action - Specify whether the packets matching the rule should be allowed or denied from the Policy dropdown. The options available are: Allow - The data packets will be allowed without filtering Deny - The packets will be dropped Reject - The packets will be rejected, and error packets will be sent in response Remark - Enter a short description for the rule. The description will appear in the Remark column of the Rules table. Position - Set the priority for the rule in the list of rules in the respective rules interface. The rules in the iptables are processed in the order they appear on the list. Enabled - Leave this checkbox selected if you want the rule to be activated upon creation. Log all accepted packets - Select this checkbox if you want the packets allowed by the rule are to be logged. Refer to the section Viewing Logs for more details on viewing the logs. Click 'Create Rule'. A confirmation dialog will appear. Click 'Apply'. The firewall will be restarted with the new rule applied. Configuring the VPN Firewall Settings 206
207 The lower 'VPN Firewall Settings' pane allows the administrator to enable/disable the VPN firewall rule and to opt for logging the packets that pass the rule. Use the 'Enable VPN firewall' toggle switch to switch the state of the VPN firewall. Select the 'Log accepted VPN connections' checkbox to log the packets that has passed the VPN Policy. Refer to the section Viewing Logs for more details on viewing the logs. Click 'Save' for your settings to take effect. 10 Configuring Proxy Services Comodo Korugan has the ability to provide proxy services for HTTP/HTTPS,and SMTP protocols. Each proxy service can be individually and independently configured and enabled/disabled. Once configured, user traffic to the service in question will pass through the specified proxy server. The proxy will act as an intermediary between client requests and the requested external or internal resource, allowing administrators to optionally run additional services on the traffic before it is forwarded to the intended destination. Services can include URL filtering, compliance checking, virus scanning, spam filtering and more. For each proxy to function properly, the corresponding service should be running. If a proxy service is started, the corresponding network service will also be automatically started, if not already running. Hence before configuring and starting a proxy service, the corresponding network service should have been configured according to the requirements. HTTP / HTTPS - Web proxy service for HTTP/HTTPS protocols. The administrator can configure content/url filtering, SSL support for HTTPS and HTTPS Exceptions. SMTP - Proxy for outgoing s and spam filter. The administrator can configure general settings, blacklists and whitelists, domains, mail routing and spam filter. The 'Proxy' interface can be accessed by selecting the 'Proxy' tab from the menu bar. Clicking the 'Proxy' tab from the left hand side navigation opens a sub-menu containing options to access to different configuration screens to manage the proxy services. 207


208 The following sections provide detailed descriptions of different proxy services and their configuration: HTTP/HTTPS Proxy SMTP Proxy 10.1 HTTP/HTTPS Proxy Server Comodo Korugan uses the Squid HTTP proxy technology to cache a large variety of resources, such as documents, images and webpages, which have been requested by hosts connected to internal network zones. Korugan will answer the initial request for a document or webpage by retrieving the resource from the original location. The cached version will then be served to answer subsequent requests for the same resource. This reduces network traffic and reduces page load time for end-users. The HTTP Proxy server maintains logs of query parameters in requested URLs, which pages were subject to content filtering and the user agents used by browsers to identify themselves to the web servers. For more details on setting up the location for storing the logs and viewing the logs, refer to the section Viewing Logs. For more details on Squid technology, please refer to The 'HTTP/HTTPS proxy' interface enables the administrator to configure various parameters and security features of the HTTP/HTTPS proxy service. To access the 'HTTP/HTTPS proxy' interface, click 'Proxy' > 'HTTP/HTTPS ' from the left hand side navigation. 208

209 The interface contains three tabs: URL Filter - Allows the administrator to limit access to websites based on content types ans specific URLs. Refer to the section Configuring URL and Content Filtering for more details. HTTPS - Allows the administrator to configure HTTPS proxy service and certificates. Refer to the section HTTPS Proxy for more details. HTTPS Exceptions - Allows the administrator to specify types of websites to be excluded from HTTPS proxy service. Refer to the section Managing HTTPS Exceptions for more details Configuring URL and Content Filtering Comodo Korugan uses the embedded Web Filtering from CYREN, to govern the websites accessed through the HTTP proxy service. The feature allows the administrator to create profiles for filtering URLs: by specifying webpages to be filtered based on content category. by specifying whitelist/blacklist of urls and domains, to be allowed/denied. These profiles can be used as filter profiles in Firewall Policy Rules ad VPN Policy Rules. Refer to the sections Managing Firewall Policy Rules and Managing VPN Firewall Rules for more details The URL/Web filtering profiles can be created for different enterprise and home network scenarios. For example, filter profiles may be applied: To beef security by automatically blocking malware sites to the network To prevent employees from visiting social networking sites during working hours. To imply parental control by blocking webpages with inappropriate content to juvenile users The Web Filtering profiles can be created and managed through 'URL Filter' interface. To configure the Web Filter Click 'Proxy' > 'HTTP/HTTPS' from the left hand side navigation Click the 'URL Filter' tab. The interface displays a list of existing web filtering profiles and enables the administrator to create new profiles. The list contains 'Default Profile' which can be edited or but cannot be deleted as the first item. The default profile allows access to all the web pages, and applied to the access policies to which no filter policy is specified. URL Filter - Column Descriptions Column Description # ID number of the profile. Profile name The name of the profile, for easy identification Actions Displays control buttons for managing the profile. 209

210 - Opens the 'Profile editor' interface and enables to edit the parameters of the profile. The editor interface is similar to the interface for adding a profile. Refer to the section Creating a Web Filter Profile for more details. - Removes the profile. Creating a Web Filter Profile A Web Filter profile can be created by specifying the filter parameters in two ways: Specifying the content categories - The web pages having content falling into specified categories will be automatically blocked Creating custom URL Whitelist/Blacklist - The URLs and Domains specified in the whitelist will be passed without filtering and the URLs and domains in the blacklist will be blocked. A single profile can be created with a combination of both the category filter and whitelist/blacklist. To create a Web Filtering profile Click the 'Create a Profile' link at the top left of the interface. The 'Profile editor' pane will open for adding a new profile. Profile Name - Enter a name for the profile to be created, for easy identification Filter Unknown Categories - Select this checkbox if you want the proxy to block all the websites that do not fall under any of the category in the built-in list of categories. The list can be viewed by clicking the ' Filter pages known to have content of the following categories' stripe below the option. To specify the categories for blocking the pages containing the content falling under them, click the 'Filter pages known to have content of the following categories. (URL Blacklist)' stripe. 210

211 Each main category is displayed as a tile. The arrow at the top right of each tile indicates whether the category is allowed or blocked. - Indicates that the category is allowed - Indicates that the category is blocked - Indicates that some of the sub categories are blocked To block the whole category, click on the green arrow. The arrow will turn red, indicating that the category will be blocked. To block only selected sub categories within a category, click on the tile. A list of sub-categories will open, with an arrow at their right indicating whether they are allowed or not. Click on the green arrow at the right of the sub category to block it. 211


212 To add URLs to whitelists or blacklists, click the 'Custom black-and whitelists' stripe. The text boxes for entering the whitelist and blacklist domains will open. Enter the URLs or domains of the websites to be allowed in the 'Allow the following sites' text box. Enter the URLs or domains of the websites to be denied in the 'Block the following sites' text box. Note: The URLs of the websites/domains should not contain the protocols ( or Wildcard characters are allowed while specifying domain(s) and sub domain(s) Click 'Create profile'. A confirmation dialog will be displayed at the top Click 'Apply' to save your profile. The profile will now be added to the list and will be available in the 'URL Filter' drop-down under 'Web Protection' in the Add/Edit firewall rule interface for configuring the firewall policy HTTPS Proxy Comodo Korugan has the ability to provide the HTTPS Proxy service. The service receives the requests for SSL encrypted webpages from the internal hosts, forwards them to remote servers, retrieves and caches the requested resources, applies the access control policies and forwards them to the requested hosts as done by the HTTP proxy service. The only difference is that the HTTPS proxy service requires an intermediate SSL certificate installed in the host to authenticate itself to the HTTPS proxy. 212
213 Also, the administrator can specify website categories and specific URLs or domains to be exempted from the HTTPS proxy service. Refer to the section Managing HTTPS Exceptions for more details. The HTTPS Proxy service can be configured from the 'HTTPS proxy' interface. To configure the service Click 'Proxy' > 'HTTP/HTTPS' from the left hand side navigation Click the 'HTTPS' tab. The interface enables the administrator to specify/create intermediate certificate for authentication. Note: In order to use HTTPS Proxy service, it is mandatory to install an intermediate certificate both in the UTM appliance and the client computers. The service can be enabled only after deploying the certificate in the UTM appliance. Refer to the section Certificate Settings for more details. Accept every certificate - This option appears only if the HTTPS proxy service is enabled. If left unselected, the UTM appliance will accept only the valid SSL certificates from the remote servers. If selected, the appliance will accept all the certificates from the remote servers including outdated certificates. Click 'Save'. A confirmation dialog will appear. Click 'Apply' for your settings to take effect. Certificate Settings The Intermediate certificate can be deployed to the HTTPS proxy service in two ways: Using an existing certificate Creating a new certificate In either case, the same certificate needs to be deployed on to the host computers in the network infrastructure that need access to the HTTPS proxy service. Using an existing certificate If you already posses an intermediate certificate, you can upload the same to the UTM appliance and install in the 213

214 client computers. To upload an existing certificate Prerequisite: Ensure that the intermediate certificate is locally stored in the computer from which you are accessing the administrative console of the Korugan UTM appliance. Click the 'Browse' button under the 'Upload proxy certificate' option, navigate to the location where the certificate is stored and click 'Open'. Click 'Upload' The certificate will be uploaded to the appliance and deployed. Creating a New Certificate The Korugan is capable of creating a new self signed intermediate certificate with one year validity and use it for authentication. Once a new certificate is created, the existing certificate, if any, will be replaced by the new certificate. Hence the administrator should download the certificate and install it on to the host computers in the network infrastructure that need to authenticate them to the HTTPS proxy service. To create a certificate Click the 'Create a new certificate' button. A confirmation dialog will be displayed. Click 'OK' A new certificate will be created and deployed in the UTM appliance. To download the certificate for transferring to the clients in the network, click the 'Download' link within the parenthesis beside 'Upload proxy certificate'. Transfer the certificate onto the computers in the network and install it on their Intermediate Certificate Store Managing HTTPS Exceptions The HTTPS proxy service intercepts all the SSL encrypted traffic through the UTM appliance and applies the access control policies, once enabled. However, the administrator can specify exceptions to the proxy service, so that traffic to and from specific website categories and/or specific domains will not be intercepted by the proxy service. The 'HTTPS proxy Exceptions' interface allows the administrator to define the exceptions for the HTTPS proxy service. To add exceptions to the HTTPS proxy service Click 'Proxy' > 'HTTP/HTTPS' from the left hand side navigation Click the 'HTTPS Exceptions' tab. 214
215 Enable HTTPS Exceptions - Select this checkbox if you wish to add exceptions to the HTTPS proxy service. The websites and domains to be excluded can be defined in two ways: Selecting the categories - A list of website categories is displayed in the interface. To exclude websites/domains of specific category(ies), select the checkboxes beside them in the list. Specifying custom websites/domains - Enter the websites/domains to be excluded, in the 'Custom HTTPS Interception Exceptions' textbox Click 'Save' for your configuration to take effect SMTP Proxy Comodo Korugan features a built-in SMTP Proxy service which allows you to filter outgoing mail from your network. The proxy features spam filtering, virus scanning and white/blacklisting by sender, domain, recipient, attachment and more. The proxy can be configured for mail servers in internal network zones (LAN, DMZ, WiFi) or external networks. The SMTP proxy interface enables the administrator to enable/disable the service and configure the parameters for processing, filtering and routing the s. To access the ' SMTP Proxy' interface, click 'Proxy' > 'SMTP ' from the left hand side navigation. 215
216 The interface contains five tabs: Configuration - Allows the administrator to enable/disable the SMTP proxy service and configure general settings like spam detection settings, virus scanning settings and so on. Refer to the section Configuring General SMTP Proxy Settings for more details. Black & Whitelists - Enables the administrator to configure realtime blacklist (RBL) of domains and IPs for blocking mails from them. Refer to the section Configuring SMTP Proxy Whitelists and Blackists for more details. Incoming Domains - Enables the administrator to specify the external domains connected through the external interface that can send s through mail servers behind the UTM appliance. Refer to the section Managing Incoming Domains for more details. Mail Routing - Allows the administrator to track the mails sent to or sent by specific users, by adding a BCC address to the mails to/from the user. Refer to the section Mail Routing for more details. Advanced - Allows the administrator to configure advanced settings like SMTP smarthost, IMAP server for SMTP authentication and so on. Refer to the section Configuring Advanced SMTP Proxy Settings for more details Configuring General SMTP Proxy Settings The SMTP proxy service can be enabled/disabled, and its general settings can be configured under the 'Configuration' interface. To configure general settings for SMTP proxy Click 'Proxy' > 'SMTP' from the left hand side navigation Click the 'Configuration' tab. 216


217 The SMTP proxy is enabled by default and is transparent to all the network zones. The proxy service will be available to any user in the network zone, without the need to manually configure their clients. The proxy server automatically handles all the SMTP requests on Port 25. The option is not available for the external interface (Internet). The Configuration interface contains two panes: Spam Settings Virus Settings Spam Settings Comodo Korugan uses a proactive antispam engine 'SpamAssassin' to filter the spam mails. The 'Spam Settings' pane allows the administrator to enable/disable spam filter. Filter mail for spam - Select this check box to enable spam filtering in the outgoing s. Once enabled, SpamAssassin identifies the spam s, adds a prefix "****SPAM****" to the subject line and delivers the mail to the intended recipient. Note: For a more granular spam filtering, by specifying the allowed attachment sizes, scan types and configuring containment of files received through s, the administrator can create Advanced Threat Protection (ATP) profile and apply it as 'Anti-Spam' profile to the Firewall Policy Rule applied to a specific network zone or a group of users. Refer to the sections Managing ATP Profiles for more details on creating ATP profiles and Managing Firewall Policy Rules for more details on creating and applying Firewall Policy Rules. Virus Settings 217
, by choosing the option from the drop-down.")

218 The 'Virus Settings' pane allows the administrator to enable virus scanning on intercepted s and how to handle infected s. Choose Virus Handling The administrator can instruct the proxy on how to handle the mail infected with virus (or containing a malware attachment), by choosing the option from the drop-down. The options available are: Move to default quarantine location - The infected s will be diverted to the the spam admin, whose address is specified in the ' used for spam notifications' field. Send to quarantine address - Selecting this option enables the administrator to specify a custom address, so that the infected s will be automatically forwarded to the address. Enter the custom address in the 'Virus quarantine address' textbox that appears on selecting this option. Pass to recipient (regardless of bad contents) - The infected will be delivered to the intended recipient(s) without processing. used for virus notifications The SMTP proxy sends notification mails to the administrator on identifying infected s. The administrator can enter the address at which the notification is to be received. Click 'Save' at the bottom of the interface. A confirmation dialog will be displayed. Click Apply. The SMTP proxy service will be restarted for your changes to take effect Configuring SMTP Proxy Whitelists and Blackists The STMP proxy service is capable of allowing and blocking intercepted outgoing mails, based on realtime blacklists of domains and IP addresses. The Realtime Blacklists (RBLs) are lists of IP addresses and domains that were identified as sending spam s. The RBLs are created and managed by various organizations. The SMTP proxy service of Korugan can use the RBLs to filter spam mails by blocking the mails from those IP addresses and domains, if configured. This saves the bandwidth resources as the mails from these IP addresses and domains are outright rejected, rather than being intercepted, processed like a legitimate and then rejected. The 'SMTP Black & Whitelists' interface allows the administrator to configure the proxy to use Real Time Blacklists 218
219 (RBL) for spam filtering. To configure Realtime blacklists for SMTP proxy Click 'Proxy' > 'SMTP' from the left hand side navigation Click the 'Black & Whitelists' tab. The Blacklist & Whitelists interface displays lists of IP address based RBLs and Domain based RBLs. The lists can be expanded or closed by clicking on the '+' or '-' icons in the title bar. The RBL items that are enabled are indicated by the icon and those that are disabled are indicated by icon. Clicking an item in the list will open the homepage of the organization that manages the list. By default all the RBL items are enabled from both the lists. To disable an RBL item, click on the 219

220 icon. To re-enable a disabled item click on the icon. Click 'Save' at the bottom of the interface. A confirmation dialog will be displayed. Click 'Apply'. The SMTP proxy service will be restarted for your changes to take effect Managing Incoming Domains Comodo Korugan allows the hosts connected to an external network and hence connected to the UTM appliance through the external network interface, to send mails through a mail server inside an internal network zone like DMZ or LAN. In order to enable the external hosts to forward the mails to an SMTP server in the internal network zones, Incoming traffic firewall rules need to be specified to allow the incoming traffic from the external host/network to the internal SMTP server for the SMTP service, under 'Firewall > Policy > Firewall Policy' interface. Refer to the section Managing Firewall Policy Rules for more details. The 'Incoming Domains' interface enables the administrator to declare domains to be accepted by the SMTP proxy and the mail servers to which the mails from the domains are to be forwarded. Once configured, the mails from the clients belonging to a domain, connected to both internal and external networks, will be forwarded to the respective mail server. To configure Incoming Domains Click 'Proxy' > 'SMTP' from the left hand side navigation. Click the 'Incoming domains' tab. The interface displays a list of incoming domains and the mails servers responsible for each domain. Incoming Domains Table - Column Descriptions Column Description Domain The name of the domain served Mail server The IP address of the mail server that serves the domain Actions Displays control buttons for editing and deleting the domain entries - Enables to edit the domain entry. The interface for editing a domain entry is similar to the interface for adding a domain entry. Refer to the section explaining adding an incoming domain for more details. - Removes the entry. Note: On clicking the Delete button, the domain entry will be immediately deleted without requesting confirmation and is a irreversible action. If you accidentally delete an entry, you need to manually re-add it. To add an incoming domain 220


221 Click the 'Add a domain' link at the top left. A pane for adding a new domain will open. Domain - Enter the name of the domain to be accepted Mailserver IP - Enter the IP address of the mail server in the internal zone like DMZ or LAN, that is responsible for sending mails from the domain. Click the 'Add' button. A confirmation dialog will be displayed. Click 'Apply'. The domain will be added to the list and the changes will be applied to the SMTP proxy Mail Routing Comodo Korugan enables the administrator to get a copy of outgoing mails sent by selected senders or addressed to selected recipients to be forwarded to a specific address as a blind carbon copy (BCC). Tip: The administrator can also configure the proxy to forward a copy of all the mails processed by it, irrespective of senders or recipients to a specified address. Refer to the section Mail Server Settings under Configuring Advanced SMTP Proxy Settings for more details. The 'Mail Routing' interface allows the administrator to associate the BCC addresses to sender or recipient addresses of the mails that pass through the SMTP proxy service. To configure Mail Routing Click 'Proxy' > 'SMTP' from the left hand side navigation. Click the 'Mail Routing' tab. 221

222 The interface displays a list of previously added mail routes. Mail Routing Table - Column Descriptions Column Description Direction Indicates the direction of the mail, that is whether the BCC field is to be added to outgoing mails sent by the particular sender or addressed to a particular recipient. Address The address of the sender or recipient BCC Address The address to be added to the BCC field of the . Actions Displays control buttons for editing and deleting the mail routing entries - Enables to edit the mail routing entry. The interface for editing a mail routing entry is similar to the interface for adding a mail routing entry. Refer to the section explaining adding a mail route for more details. - Removes the entry. Note: On clicking the Delete button, the entry will be immediately deleted without requesting confirmation and is a irreversible action. If you accidentally delete an entry, you need to manually re-add it. To add a mail route Click the 'Add a Mail Route' link at the top left. A pane for adding a new mail route will open. Direction - Choose whether the BCC address is to be added to mails from a sender or addressed to a recipient. Mail Address - Enter the address or the sender or the recipient as chosen from the previous option, whose mails are to be added with the BCC address. BCC address - Enter the address at which the copies of the mails are to be received. Click 'Add Mail Route'. A confirmation dialog will appear. 222

223 Click Apply. The new route will be added and the changes will be applied to the proxy Configuring Advanced SMTP Proxy Settings The 'SMTP proxy: Advanced' interface allows administrators to configure Smart Hosts, configure IMAP servers for SMTP authentication, configure SMTP mail server settings and configure spam prevention settings. Smarthost configuration IMAP server for SMTP authentication SMTP Mail server settings Spam prevention Settings Smart host configuration The SMTP proxy can be configured to use a smarthost for delivering the s. A smart host is an intermediary mail transfer server to relay the mails from an SMTP server to the recipient server. This is particularly useful for the SMTP server that has a dynamic IP address, for example when using an ISDN or an ADSL dial-up Internet connection. If the IP addresses is in the blacklist of any RBL, the recipient mail servers will reject the mail. If the mail is routed through a smart host, the recipient mail server will accept the mail as the smart host is trusted. Also some recipient mail servers prefer to receive mails from a trusted smart host for reducing the volume of spam mails they receive. Some smart hosts also require authentication from the SMTP servers to relay the mails from them. Usually, the Internet Service Provider(ISP)'s SMTP server will be used as smart host. The 'Smarthost configuration' pane allows the administrator to activate and configure the smarthost to be used. The pane can be opened by clicking the 'Smarthost configuration' stripe. 223
.")
224 Smarthost for delivery Activate smarthost for delivery - Select this check box to enable using a smart host for mail delivery. The following parameters can be configured on activating the smart host. Smarthost address Enter the IP address or host name of the smart host server to be used. Smarthost port Specify the port on which the smart host is listening (Default = 25). Smarthost authentication Smarthost requires authentication - Select this checkbox if the smart host requires authentication for the SMTP proxy to connect. The following options will appear only on selecting this chekbox. Smarthost username and Smarthost password Enter the username and password for the SMTP proxy to authenticate itself to the smart host Choose authentication method Select the authentication method to be used by the smart host from the drop-down. The options available are: PLAIN LOGIN CRAM-MD5 DIGEST-MD5 IMAP server for SMTP authentication The administrator can configure the IMAP server that should be used for authentication when sending s, especially from the clients that are connected to the UTM appliance through the external interface device. The 'IMAP server for SMTP authentication' pane allows the administrator to activate and configure the IMAP server to be used for authentication. The pane can be opened by clicking the 'IMAP server for SMTP authentication' stripe. 224

225 SMTP authentication Activate SMTP authentication with IMAP server - Select this check box to enable using an IMAP server for authentication. The following parameters can be configured on activating the IMAP server. Choose number of authentication daemons Specify the number of concurrent logins from the IMAP server, that are possible through the UTM appliance, from the drop-down. IMAP authentication server Enter the IP address or the host name of the IMAP server IMAP authentication port Specify the port on which the IMAP server is listening. (Default = 143 for non SSL connection and 993 for SSL connection) SMTP Mail server settings The 'Mail server settings' pane allows the administrator to configure how the SMTP proxy should handle the outgoing mails. The 'Mail server settings' pane allows the administrator to configure the advanced mail server settings. The pane can be opened by clicking the 'Mail server settings' stripe. 225
226 SMTP HELO Require SMTP HELO - Select this option if you wish the SMTP proxy to accept the mails only from the clients that send the HELO (or EHLO) command at the beginning of each SMTP session SMTP HELO name Specify the host name that should be contained in the HELO or the EHLO command. The default is 'REDIP', but any custom hostname in FQDN format is accepted. Invalid hostname Reject invalid hostname - Select this option if you wish the proxy to reject the connection request from the clients that supply invalid host name in the HELO or EHLO command. Always BCC to address The proxy can forward a copy of all the s processed by it, to a specified address as Blind Carbon Copy (BCC). If you wish to receive the copies of all the s, specify the address at which the BCC of the s are to be received. Tip: The administrator can also configure the proxy to forward only the outgoing s sent by selected senders or addressed to selected recipients as BCC to a specified address. Refer to the section Mail Routing for more details. Choose mail template language Choose the language in you wish the proxy to display the error messages and to send the notification s from the drop-down. Verify recipient address Recipient address verification - Select this option of you wish the proxy to check the validity of the recipient address before forwarding the mail. The mails with invalid addresses will not be forwarded. Choose hard error limit If the mails are delivered through an external SMTP server, specify the maximum number of errors that can be allowed for the remote server. If the number of errors exceed this value, the proxy disconnects from the remote server. (Default = 20) 226
 from the drop-down or enter a custom value by choosing 'custom email content size' from the drop-down.")
227 Choose maximum content size Specify the maximum size for a single with attachments. The s whose size are exceeding the limit specified, will be rejected. You can choose the size (in MB) from the drop-down or enter a custom value by choosing 'custom content size' from the drop-down. Spam prevention In addition to the spam detection parameters configured under Spam Settings pane in the general configuration interface, the administrator can configure advanced spam filtering parameters in the 'Spam prevention' pane. The 'Spam prevention' pane can be opened by clicking the 'Spam prevention' stripe. Invalid Recipient Reject invalid recipient (non-fqdn) - Select this option if you wish the proxy to block the s if the domain name in the TO: address is not in FQDN format. Unknown Recipient Domain Reject unknown recipient domain - Select this option if you wish the proxy to block the s if domain in the TO: address does not have a DNS or MX record. Invalid sender Reject invalid sender (non-fqdn) - Select this option if you wish the proxy to block the s if the host name in the HELO or EHLO command is not in FQDN format. unknown sender Reject sender from unknown domains -Select this option if you wish the proxy to block the s if domain name in the sender address does not have a DNS or MX record. Click 'Save' for your configuration to take effect. 11 Configuring Virtual Private Network Settings Comodo Korugan enables creating Virtual Private Network (VPN) connections, enabling remote networks or individual computers at geographically separated locations to connect to the local network through a potentially insecure network like Internet. The connections through the VPN pass through encrypted tunnels, ensuring the same security levels as if the remote networks or the computers are connected through a trusted local network. 227
.")
228 Korugan supports both SSLVPN based and IPsec/L2TP based VPN connections, as a sever to connect remote clients and as a client to connect to other UTM appliance in a remote network, as a client. It can also play both the roles at the same time. SSLVPN Server - The UTM appliance can act as a SSLVPN server to allow remote clients to connect to local network zone(s). It also allows other UTM appliances configured as clients to connect in gateway to gateway (Gw2Gw) setup. SSLVPN Client - The UTM appliance can act as a OpenVPN client to connect to other UTM appliance configured as SSLVPN server through Gw2Gw setup IPsec - The UTM appliance enables the administrator to create IP Security (IPsec) tunnels for connection to remote networks and clients through VPN. L2TP Server - The UTM appliance can act as a L2TP server, to connect remote L2TP clients to connect to local network zones. Clicking the 'VPN' tab from the left hand side navigation opens a sub-menu containing options to access to different configuration screens to manage the VPN services. The following sections provide detailed descriptions of different VPN services and their configuration: SSLVPN Server SSLVPN Client IPsec Configuration L2TP Server Configuration IPsec / L2TP Users Configuration 11.1 SSL VPN Server The Comodo Korugan UTM appliance can be configured as a SSL VPN server, to allow remote clients to connect to 228
229 the local network zones. Once configured, the server allows the administrator to download the authentication certificate and client configuration file from it, for deployment onto the remote SSL VPN clients. The server can accept remote connections from remote clients that are configured to connect to the server as if it were a local workstation or a server. The SSL VPN server also accepts connection requests from a remote UTM appliance configured as SSL VPN client as a gateway to gateway (Gw2Gw) connection, allowing remote networks to connect to the local network zones. The 'SSL VPN Server' interface enables the administrator to enable/disable the service and configure the general parameters, advanced parameters and add VPN client accounts. To access the 'SSL VPN' interface, click 'VPN' > 'SSLVPN Server ' from the left hand side navigation. The interface contains three tabs: Server Configuration - Allows the administrator to enable/disable the SSL VPN server and configure general settings like dynamic IP address pool for assignment of IP addresses to the clients and so on. The interface also displays a list of active client connections and allows the administrator to download the authentication certificate for distribution to clients. Refer to the section Configuring General SSL VPN Server Settings for more details. Accounts - Allows the administrator to add and manage user accounts for the clients to connect to the server. Refer to the section Managing SSL VPN Client Accounts for more details. Advanced - Allows the administrator to configure advanced settings like port, protocol, global push options and authentication certificate settings. Refer to the section Configuring Advanced SSL VPN Server Settings for more details Configuring General SSL VPN Server Settings The Server Configuration interface allows the administrator to enable/disable the SSL VPN server and to configure general settings like the local network zone to which the connection is to be bridged and the dynamic IP address pool, for dynamically assigning IP addresses to the clients connecting to the server. The administrator can also download the server certificate for deploying to the clients for authentication. To configure general settings for SSL VPN Server 229
230 Click 'VPN' > 'SSLVPN Server' from the left hand side navigation Click the 'Server configuration' tab. SSLVPN server enabled - Select the checkbox to enable the SSLVPN server Bridged - Select the checkbox if you wish to run the server in bridged mode. Bridge to - Choose the local network zone to which the server is to be bridged. This option will appear only if you chose to run the server in bridged mode in the previous option. Dynamic IP pool start address and Dynamic IP pool end address - Enter the first and last address of the IP address pool from which the IP addresses are to be dynamically assigned to the clients that are connecting to the server. All the traffic from these IP addresses will pass through the VPN firewall, if enabled. Refer to the section Configuring Firewall Rules for VPN Traffic for more details. Click 'Save and Restart'. The SSL VPN server service will be restarted for your settings to take effect. To download the server certificate for deployment to the clients, click 'Download CA certificate'. The certificate can also be downloaded from the Accounts interface. For more details on Server Certificate settings, refer to the section Configuring Advanced SSL VPN Server Settings > Authentication Settings. The lower pane of the interface displays a list of active SSL VPN connections to the server with their connection statistics. The list also allows the administrator to terminate unwanted VPN connections. SSL VPN Server Connection status and control table - Column Descriptions Column Description User The user name of the account with which the client has logged-in to the server Assigned IP The IP address dynamically assigned to the client from the server during the current session 230

231 Real IP The original externally facing IP address of the client RX / TX Displays the data transmitted and received by the server to client during the current session Connected since The date and time from which the current session is active Uptime The period for which the current session is active Actions Displays control buttons for terminating the session. - Enables to stop the connection Managing SSL VPN Client Accounts The 'Accounts' interface allows the administrator to add and manage the user accounts for external clients to connect to the VPN server. To manage the user accounts Click 'VPN' > 'SSLVPN Server' from the left hand side navigation Click the 'Accounts' tab. A list of existing user accounts will be displayed. SSL VPN Server Account Configuration table - Column Descriptions Column Description Username The user name of the account with which the client can log-in to the server Remote nets The network subnet address of the VPN gateway server for the client to connect to VPN. Push nets The network(s) whose routes are pushed to the client, once it is connected Static ip If a static IP address is assigned to the remote client, the IP address will be displayed. Actions Displays control buttons for enabling, editing and deleting the account. - The checkbox allows the administrator to switch the account between enabled and disabled states. - Enables to edit the account configuration. The pane for editing an account is 231
232 similar to the pane for adding an account. Refer to the section explaining adding a new user account for more details. - Removes the entry. To add a new user account Click the 'Add account' button. The 'Add new user' pane for adding a new domain will open. Account information 232
233 The administrator should specify the username and password for the user account. These credentials are to be entered to the SSL VPN client for authenticating itself to the server. Username - Enter a username for the account Password - Enter a password for the account Verify password - Re-enter the password for confirmation Client routing The administrator can configure for routing traffic to the client Direct all client traffic through the VPN server - Select this option if you wish all the incoming and outgoing traffic pertaining to the client should be passed through the VPN server Push only global options to this client - Instructs the server to push only the network routes, name servers and domains specified under the Global Push Options in Advanced Settings. Refer to the section Configuring Advanced SSL VPN Server Settings for more details. Push route to WIFI zone - Instructs the server to push the route to internal Wi-Fi zone, so that the client can connect to the hosts in the Wi-Fi zone in the local network infrastructure. Push route to DMZ zone - Instructs the server to push the route to internal DMZ zone, so that the client can connect to the hosts in the DMZ zone in the local network infrastructure. Networks behind client - Enter the network subnet address of the VPN gateway server for the client to connect to VPN. Push only these networks - If you wish to push the routes of only selected networks to the client, then enter the network/subnet addresses of the networks. If you wish to push the routes of networks of all the other clients, leave this field blank. Custom push configuration Static ip addresses - If you wish to assign static IP addresses for the clients using this account, enter the IP addresses in CIDR format. To avoid IP address clashes, it is recommended to specify the static IP addresses outside the Dynamic IP address pool specified under the Server Configuration tab. Push these nameservers - If you wish the clients to use specific name servers for DNS resolution, select the Enable checkbox and enter the IP addresses of the name servers in the text box. Push domain - If you wish to specify a specific search domain for the clients using this account, to identify the servers and network resources in the VPN network, select the 'Enable' checkbox and enter the domain name in the text box. Click 'Save'. The account will be added to the list of accounts. The account will be activated enabling the clients to connect to the server only after the next restart of the SSL VPN server. Click 'Restart SSL VPN server' to instantly restart the server. You an download the server certificate and the SSL VPN client configuration file from the 'Accounts' interface. The files can be transferred to the remote workstations and deployed in the clients to enable the connection. The server certificate type for authentication can be configured under 'Advanced' tab > Authentication Settings. Click the 'Download CA certificate' link to download the server certificate. Click the 'Download Client Configuration' link to download the SSL VPN client configuration file in.ovpn format. Once the certificate is deployed and the configuration file is imported to the client, the client can be connected to the server by entering the IP address of the VPN server, that is the UTM appliance and the username and password specified for the account. By default, only one client is allowed to connect to the server using one account. But the administrator can choose to have several clients at different locations to share a single account, by selecting the option 'Allow multiple connections from one account' under 'Advanced' tab Configuring Advanced SSL VPN Server Settings The 'Advanced' interface allows the administrator to configure advanced parameters like the connection port for the 233
234 VPN server and the protocol to be used, global push options and authentication settings. To configure the advanced settings for the SSL VPN server Click 'VPN' > 'SSLVPN Server' from the left hand side navigation Click the 'Advanced' tab. The 'Advanced' interface contains three areas: Advanced Settings Global Push Options Authentication Settings Advanced Settings 234
235 Port - Specify the port for listening to the VPN client requests. (Default = 1194). The administrator can also create port forwarding rules under Firewall > Port forwarding / NAT, to allow multiple ports to listen to the requests and forward them to the default port. Protocol - Choose the protocol to be used for VPN connections. (Default = UDP) Block DHCP responses coming from tunnel - Select this option, if you wish to block the DHCP responses from the network at the other side of the VPN tunnel that conflict with the local DHCP server. Don't block traffic between clients - By default, the VPN server does not allow the data traffic between the VPN clients connected to it. If you wish to allow the data transfer among the VPN clients, select this check box. Allow multiple connections from one account - By default, for a single user account, only one client can connect to the VPN server. If you wish to allow several clients at different locations to connect to the server using the same account, select this option. However, if several clients are using a single account, the VPN firewall rules will not be applied. Click 'Save and restart'. The VPN server will be restarted for your configuration changes to take effect. Global Push Options Push these networks - If you wish the routes to specific networks are to be pushed to all the clients that connect to the VPN server. Select the 'Enable' checkbox and enter the network addresses/subnet masks in the text field. Push these nameservers - If you wish the clients to use specific name servers for DNS resolution, select the 'Enable' checkbox and enter the IP addresses of the name servers in the text box. Push domain - If you wish to specify a specific search domain for all the clients, to identify the servers and network resources in the VPN network, select the 'Enable' checkbox and enter the domain name in the text box. 235
236 Click 'Save and restart'. The VPN server will be restarted for your configuration changes to take effect. Authentication Settings The SSL VPN server deployed in Comodo Korugan allows three types of authentication for the clients to authenticate themselves to the server. Pre-Shared Key (PSK) (Default) X.509 certificate X.509 certificate and PSK (two factor) PSK (username/password) The PSK authentication type requires the CA public certificate to be installed onto the clients and entering username and password of the account created for the client under 'Accounts' tab, for the client to authenticate itself to the server. On selecting the PSK type, the administrator can download the public certificate generated by the VPN server for deployment onto the clients. The interface also allows the administrator to export the certificate for deployment onto other SSL VPN server configured as fall back server and import the certificate from primary SSL VPN server, if this UTM appliance is configured as fallback server. To select the PSK authentication type, select the PSK radio button. Certificate Management To download the public certificate in.cer format for deployment on to the clients, click 'Download CA certificate' and save the certificate. To export the certificate as a PKCS#12 certificate in.p12 format, click 'Export CA as PKCS#12 file' and save the file. This file can be transferred and imported on to other SSL VPN appliance configured as fallback server. Importing the certificate If the SSL VPN server deployed in the UTM appliance is configured as fallback server for a different primary SSL VPN server, the administrator needs to import the public certificate generated by/issued for the primary server. 236
237 Prerequisite - The certificate needs to be exported as a PKCS#12 certificate from the server or to be downloaded from the CA that has issued the certificate and stored locally in the computer from which the UTM appliance administrative console is accessed. To import the certificate Click 'Browse' beside the PKCS#12 file text box and navigate to the location of the certificate stored in the local computer or the network and click Open. Enter the challenge password to access the certificate in the 'Challenge password' text box. Click 'Save and restart'. The certificate will be imported and the VPN server will be restarted for your configuration to take effect. X.509 certificate Comodo Korugan allows the deployment of server certificate and client certificates obtained from an external CA. The X.509 authentication type requires the administrator to obtain: A Server certificate with the fields C = IT, O = efw and CN = from an external CA for uploading to the SSL VPN server configured in the UTM appliance A Client certificate for each client with the Common Name field = The 'username' of the client account configured under the 'Accounts' tab, for installation at the SSL VPN client. To select the X.509 authentication type, select the X.509 radio button. Certificate Management Prerequisite - The certificate needs to be downloaded as a X.509 certificate from from the CA that has issued the 237

238 certificate and stored locally in the computer from which the UTM appliance administrative console is accessed. To import the server certificate obtained from an external CA click 'Browse', navigate to the location on your computer where the certificate is stored in X.509 format and click Open, enter the password entered for storing the private key of the certificate in the challenge password field and click 'Save and restart'. The certificate will be installed automatically and the VPN Server will restart for the installation to take effect. Certificate Revocation - The administrator can specify a certificate revocation list to confirm that the imported certificate is valid. X.509 certificate and PSK (two factor) The X.509 and PSK authentication type requires both the server and client certificates obtained from an external CA to be installed on the server and on the clients respectively and entering the username and password of the account created for the clients under 'Accounts' tab, for the client to authenticate itself to the server. Refer to the explanations under PSK (Username/Password) and X.509 certificate above SSLVPN Client Comodo Korugan can be configured to create secure tunnels for connection to external SSL VPN servers and to serve as VPN gateway for the local network infrastructure. Each tunnel is constructed as a client to connect to different servers. The 'SSLVPN Client' interface displays a list of VPN client connections and enables the administrator to create new tunnels. To access the 'SSLVPN Client' interface, click 'VPN' > 'SSLVPN Client ' from the left hand side navigation. SSL VPN Clients table - Column Descriptions Column Status Description Indicates the connection status of the tunnel. The possible values are: Established - The connection to the external VPN server is enabled and live Connecting - The connection is being established Closed - The connection is terminated Connection name The name given to the connection for identification. Options Additional connection options, if any, specified during creation of the tunnel. 238
239 Remark A short description of the tunnel. Actions Displays control buttons for enabling, editing and deleting the tunnel. - The checkbox allows the administrator to switch the connection between enabled and disabled states. - Enables to edit the tunnel configuration. The pane for editing a tunnel is similar to the pane for adding a new tunnel. Refer to the section explaining Creating a new tunnel configuration for more details. - Removes the tunnel configuration. New tunnel configurations, and hence connections to different OpenVPN servers can be configure in two ways: Creating a new tunnel configuration Importing the configuration from the SSL VPN server Creating a New Tunnel Configuration A VPN tunnel can be added for connection to an external SSL VPN server by simply specifying its hostname, uploading its server certificate and entering the username and password to access it. The configuration interface also allows the administrator to specify advanced tunnel configuration parameters like fallback servers, device/connection types and so on, if required. Prerequisite - The server certificate of the external SSL VPN server needs to be exported as a PKCS#12 certificate and stored locally in the computer from which the UTM appliance administrative console is accessed. To add a new tunnel configuration Click 'Add tunnel configuration'. The 'Add VPN tunnel' interface will open. Connection name - Enter a name to identify the tunnel 239
240 Connect to - Enter the host name or IP address of the external SSL VPN server in the following format: <hostname (in FQDN format)>:port:protocol or <IP address>:port:protocol If the default port 1194 is to be used, you need not specify the port Specify the protocol in lowercase letters. If the default protocol UDP is used, you need not specify the protocol Upload certificate - The server certificate of the external VPN server needs to be imported into the client. If the external VPN server uses PSK type authentication, then the server's host certificate needs to be uploaded to the client If the external server uses client certificate type authentication, then the client certificate for your user account, obtained from the external CA needs to be uploaded Click 'Browse' beside the 'Upload Certificate' and navigate to the location of the certificate stored in the local computer or the network and click 'Open'. PKCS#12 challenge password - Enter the challenge password to access the certificate in the 'Challenge password' text box. If the external SSL VPN server is another Comodo Korugan UTM appliance, leave this field blank. Username/Password - If the external VPN server requires the username and password of your user account to be entered to connect to it, enter the username and password. Remark - Enter a short description for the tunnel. If you wish to configure advanced configuration parameters for the tunnel, click the '>>' button beside the 'Advanced tunnel configuration'. Else click 'Save'. The SSL VPN client will be restarted and a new connection will be established to the server specified. Advanced Tunnel Configuration Clicking the >> button will open the opens Advanced Tunnel Configuration pane. 240
241 Fallback VPN Servers - If any fallback servers are setup for the primary VPN server, specify the fallback servers in the same format used for the primary server. Device type - Choose the type of the virtual-network kernel device used by the server. The choice available are TUN and TAP. Connection type - Choose the connection type if TAP network device is used. The options available are 'Routed' and 'Bridged'. NAT - If the connection type is 'Routed', choose whether are not Network Address Translation (NAT) is to be applied. If applied, the host computers connected through this gateway client will be hidden behind the firewall's VPN IP address. This configuration will prevent incoming connections requests to the hosts. Bridge to - If the connection type is 'Bridged', choose the internal network zone to which the connection is to be bridged. Block DHCP responses coming from tunnel - Select this option, if you wish to block the DHCP responses from the network at the other side of the VPN tunnel that conflict with the local DHCP server. Use LZO compression - Select this option, if wish to apply lossless and high speed Lempel-ZivOberhumer (LZO) data compression to the traffic passing through the tunnel. The LZO compression reduces the load on the tunnel. Protocol - Choose the protocol used by the external EasyVPN server. The default protocol is UDP. If the UTM Appliance can access the Internet only through an upstream HTTP proxy then choose TCP and ensure that the external server also uses TCP protocol. Enter the HTTP Proxy parameters on choosing TCP. 241
242 HTTP proxy - specify the HTTP Proxy server in the same format used for the primary server. Proxy username / Proxy password - Enter the username/password to access the proxy server Forge proxy user-agent - Enter the user agent string to be used by the UTM appliance to identify itself as a browser to the proxy server, This is optional, and useful if the proxy accepts connections only for some type of browsers. Click 'Save'. The new advanced parameters for the tunnel configuration will be saved. Importing the Configuration from the SSL VPN Server If the client configuration profile is available from the external VPN server for automatic configuration of the client, then the simplest way of creating a new tunnel is by directly importing the configuration from the server. Upon successful import of the configuration profile from the server, a new tunnel will be automatically created for connection to the external server. To import the configuration profile Click 'Import profile from SSLVPN Access Server' from the SSLVPN Client interface. The 'Import VPN tunnel from SSLVPN Access Server' pane will open. 242
243 Connection name - Enter a name to identify the tunnel. Access Server URL - Enter the URL of the external SSLVPN server with the Remote Procedure Call (RPC) configuration Username / Password - Enter the username and password of your user account at the server. Verify SSL certificate - If the server runs on SSL encrypted channel, select this option. The client will check for the valid SSL certificate at the server in order to establish the connection. If the server is implemented with a self-signed certificate, do not select this option. Remark- Enter a short description for the tunnel. Click 'Import Profile' after entering the details. The client will connect to the server and import the client configuration file. A new tunnel will be configured with the imported configuration profile IPsec Configuration The IPsec services area allows administrators to configure connections between external networks and sites to internal networks through secure IPsec VPN tunnels. The appliance supports: Host to Net VPN - Allows mobile and portable computers (road warriors) to securely connect to internal networks Net to Net VPN - Allows network to network IPsec VPN connections L2TP Host to Net VPN - Enables external clients using L2TP clients to connect to internal networks through an IPsec VPN 243
244 Administrators can use the interface to create, enable, configure and monitor IPsec connections and to configure authentication preferences. Authentication between IPsec connected interfaces can be implemented via certificatebased authentication or by pre-shared key. To access the 'IPsec' interface, select the 'VPN' tab from the menu bar and click 'IPsec' from the left hand side navigation. The interface contains three areas: Global Settings Connection status and control Certificate authorities Global Settings 244
245 The 'Global Settings' area allows administrators to enable or disable the IPsec VPN service, to configure which internal network zones can be accessed over IPsec and to specify the dynamic IP address pool that should be used when assigning addresses to external clients that connect to the internal network. The 'Debug Options' area allows administrators to choose how much information is included in IPsec events in debugging logs. Enabled - Select the checkbox to enable the IPsec VPN service Zone - Choose the internal network zone to allow external clients and networks to access through the IPsec VPN Dynamic IP pool network address/cidr - Specify the IP addresses for dynamic assignment to the external clients in CIDR notation Debug options - Allows the administrator to configure the level of detail recorded for IPsec events in the debug log file in the event of connection failures. The log file is located at /var/log/messages in the internal storage of the appliance. Click the '+' button to view the list of available options. Click 'Save' for your settings to take effect Connection Status and Control The 'Connection Status and Control' area displays a list of IPsec tunnels that have been added, their connection status and controls for enabling, disabling and editing them. IPsec Connection Status and Control table - Column Descriptions Column Description Name The name for identifying the connection Type Indicates the type of the tunnel and the authentication type used. The IPsec service supports two types of authentication: Pre-Shared key (PSK) - Requires username/password to be entered at the 245
246 client device Certificate - Requires the client certificate to be installed on the client and entering username and password. The client certificate can be generated from the UTM appliance and deployed in the client device. Common Name If certificate type authentication is used, the Common Name fields included in the certificate is displayed here. Remark A short description of the tunnel. Status Indicates the connection status of the tunnel. The possible values are: Actions Established - The connection to the external client is enabled and live Connecting - The connection is being established Closed - The connection is terminated Displays control buttons for managing the tunnel. - Allows the administrator to re-establish closed connections. - Available only for connections with certificate type authentication. Clicking this icon opens the Certificate pane that displays the client certificate. - Allows the administrator to download the client certificate for deployment on to the client machine. - Allows the administrator to switch the connection between enabled and disabled states. - Enables to edit the tunnel configuration. The pane for editing a tunnel is similar to the pane for adding a new tunnel. Refer to the section explaining adding a new IPsec tunnel configuration for more details. - Removes the tunnel configuration. Certificate Authorities The 'Certificate authorities' area allows the administrator to manage the Root certificate / Host certificate or the server certificate for authentication of remote clients connecting through the IPsec tunnel. The external client/network can authenticate itself by using a client certificate: That was generated by the UTM appliance and sent to the client ; Generated by the UTM appliance by signing the certificate request received from the client; or Obtained from an external CA. Initially, no certificate will be available with the UTM appliance. If a new tunnel configuration is created with certificate type authentication, the administrator should first generate self-signed root and host certificates or upload a server certificate obtained from an external CA for deployment on to the UTM appliance. This certificate will be used to generate a new client certificate for the client or to sign the certificate request received from the client. 246

247 The following sections explain on: Generating new self-signed Root/Host certificates Uploading server certificate obtained from an external CA To generate new self-signed certificates Click 'Generate root/host certificates'. The 'Generate root/host certificates' pane will open. The pane allows the administrator to create a new certificate or upload a previously generated certificated stored locally in PKCS12 format. Organization name - Enter the name of your organization. This will appear in the 'Organization' field of your certificate KORUGAN UTM hostname - Enter the IP address or host name of the Korugan UTM appliance. Your address - Enter your address, to be included in the certificate Your department - Enter your department. This will appear in the 'Organizational Unit' (OU) field of the certificate City - Enter your city State or province - Enter your state or province Country - Choose your country from the drop-down Subject alt name - Enter the alternative host names of the UTM appliance, if any. 247

248 Click 'Generate root/host certificate' Alternatively, if the administrator has any of the previously generated certificates stored in PKCS12 format, then the certificate can be uploaded to the appliance, instead of creating new certificates. To upload an existing certificate Click the Browse button beside 'Upload PKCS12 file and navigate to the location in the local storage or the network where the certificate was exported and stored' Enter the password entered while exporting the certificate Upload PKCS12 certificate. The certificates will be created and listed under 'Certificate authorities' At a time only one certificate can be stored which serves for a single connection. If a new tunnel need to be configured, the existing certificate and the connection using the existing certificate can be removed by resetting the certificate store. The administrator can view the certificates by clicking the button or download the certificate by clicking the button. The downloaded certificates can then be exported to PKCS12 format for importing into the appliance in future. To upload server certificate obtained from external CA Enter the CA name for identification in the CA name text field. Click the Browse button beside the text field and navigate to the location in the local storage or the network where the certificate is stored and click 'Open'. Click 'Upload CA certificate'. The certificate will be imported into the UTM appliance. Adding a New Tunnel Configuration Three types of IPsec VPN Tunnels can be created in Comodo Korugan: Host to Net VPN - Enabling mobile and portable computers (a.k.a Road Warriors) to connect to the internal networks Net to Net VPN - For connection from external IPsec VPN servers enabling network to network VPN connection L2TP Host to Net VPN - Enabling external clients using L2TP clients to connect to the internal networks through IPsec VPN Note: In order to allow L2TP Hosts to connect to the VPN, the L2TP server must be enabled and configured in the UTM appliance. Refer to the section L2TP server Configuration for more details. By default only one connection is allowed at a time for L2TP/IPsec connection. To enable more number to users to connect simultaneously, the L2TP/IPsec user accounts are to be added to the server. Refer to the section IPsec / L2TP Users Configuration for more details. 248
249 To create a new tunnel Click 'Add' from the Connection Status and Control area in the 'IPsec 'interface. The Connection type interface will open. Choose the connection type and click 'Add'. The interface for specifying the connection configuration parameters and the authentication parameters will open. The interface is similar for all the three types of connection, except for an additional parameter 'Remote subnet', if you are creating Net to Net connection type. The interface contains two areas: Connection Configuration Name - Enter a name to identify the connection tunnel 249
250 Enabled - Select this checkbox if you wish the tunnel to be enabled upon creation. Do not select this, if you just want to create the connection this time and enable it at a later time. Interface - Choose the uplink interface device connected to the UTM appliance, through which the external client should connect to the local network infrastructure Local Subnet - This field is auto populated with the local sub network of LAN. If you want to specify a different subnet, enter the address in CIDR format. Local ID - Enter an identification string for the local network. Local Remote Remote host/ip - Enter the IP address or hostname of the external host or network Remote subnet - The option is available only if you are creating 'Net to Net' connection type. Specify the sub network of the external network that can connect through the tunnel Remote ID - Enter an identification string for the local network. Options Extended Authentication (Xauth) - Select this option if you wish to enable extended certificate based authentication for the remote client. You must install the client certificate on to the external client, if you select this option. Dead peer detection action - Choose the action to be taken by the UTM appliance if the peer disconnects. The options available are: Clear - Disconnect the connection Hold - Wait for the peer to reconnect Restart - Restart the peer Remark - Enter a short description for the connection Edit advanced settings - Select this option if you wish to edit advanced configuration parameters of the tunnel. The advanced parameters can be edited only after saving the tunnel configuration. Refer to the section explaining editing advanced parameters of IPsec tunnel configuration for more details Authentication The Authentication Settings area allows the administrator to select the authentication type. If certificate authentication type is chosen, the administrator can configure for generating the client certificate from this area. The certificate will be available for download from the Connection status and control area. 250
251 Select the authentication type from the options available in this interface: Use a pre-shared key - Select this option if you wish to apply PSK type authentication for the remote client and enter the password to be used for authentication by the remote client. Warning: It is recommended to not to choose PSK type authentication type for 'Host to Net' connection type. The following options are for client certificate type authentication and will be available only if Root and Host certificates are generated or a server certificate obtained from CA has been uploaded for the IPsec server in the UTM appliance. Refer to the section Certificate Authority for more details. Upload a certificate request - If the IPsec tunnel implementation in the remote host does not have its own CA, a certificate request, which is a partial X.509 certificate can be generated at the host. The certificate request can be transferred to the computer from which the administrative console is accessed and uploaded to the UTM appliance. The appliance will sign the request using its root certificate. The signed client certificate will be available from the Connection status and control area, which can then be transferred to the remote host and deployed. To upload a client certificate request, select this option and click the Browse button. Navigate to the location where the request file is stored and click 'Open.' Upload a certificate - If the remote host already has a client certificate in X.509 format, the certificate can be transferred to the computer from which the administrative console is accessed and uploaded to the appliance. To upload the certificate, select this option and click the Browse button. Navigate to the location where the certificate file is stored and click 'Open.' Upload PKCS12 file PKCS12 file password - If the client certificate is exported to PKCS format from the remote host, the.p12 file can be transferred to the computer from which the administrative console is accessed and uploaded to the appliance. To upload the certificate, select 251
252 this option and click the Browse button. Navigate to the location where the certificate file is stored and click 'Open.' Peer is identified by either IPV4_ADDR, FQDN, USER_FQDN or DER_ASN1_DN string in remote ID field - Select this option if you wish the remote host is to be authenticated based on its IP Address, domain name, or by other unique information of the IPsec tunnel entered in the Remote ID field of the Connection Configuration area. Generate Certificate - Select this option if you wish to generate a new client certificate for the remote host signed by the Root certificate of IPsec server in the UTM appliance. Enter the parametes for the certificate in the fields below. Upon generation, the client certificate will be available for download from the Connection status and control area. The certificate can be transferred to the remote host and deployed for authenticating itself to the server. User's full name or system hostname - Enter the username or the hostname of the remote host. This name will be included in the CN field of the certificate. User's address - Enter the address of the user of the host. User's department - Enter the department to which the en-user belongs. Organization name - Enter the name of the organization to which the end-user belongs. City, State or province, Country - Enter the address details of the end-user Subject alt name - Enter the alternative host names, if any, for the remote host. PKCS12 file password - Enter the password for storing the certificate file in.p12 format and re-enter it for confirmation in the next field. This password needs to be entered while importing the certificate at the remote host. Click 'Save'. If you have chosen to edit advanced settings while creating the connection, the 'Advanced Connection Parameters' interface will open after clicking 'Save'. Else, the connection will be added to the Connection status and control area. The certificates generated can be downloaded and imported onto the remote host. The remote host will now be able to connect to the sub network of the internal network specified under Connection Configuration, by configuring the IPsec VPN connection at the host. Editing Advanced Configuration Parameters of IPsec Tunnel Configuration Warning: The Advanced connection parameters are automatically selected for optimal performance. It is recommended to leave these settings to default, unless you are an expert and understand the risk of altering encryption parameters. 252
253 Internet Key Exchange (IKE) Protocol Configuration IKE Encryption - Select the encryption method(s) to be supported by IKE. IKE Integrity - Select the encryption algorithms to be used for checking the integrity of IKE data packets IKE group type - Select the group type of IKE packets IKE lifetime - Specify how long the IKE packets are to be valid Encapsulating security payload configuration ESP Encryption - Select the encryption method(s) to be supported for encapsulation. ESP Integrity - Select the encryption algorithms to be used for checking the integrity of encapsulated data packets ESP key life - Specify how long the encapsulated data packets are to be valid Additional options Perfect Forward Secrecy (PFS) - Select this option to enable perfect forward secrecy, so that the keys exchanged during long-term connection sessions are protected from being compromised. Negotiate payload compression - Select this option If you wish to allow compression of payload in data packets. Click 'Save' for your configuration to take effect. The connection will be added to the Connection status and control area. The certificates generated can be downloaded and imported onto the remote host. The remote host will now be able to connect to the sub network of the internal network specified under Connection Configuration, by configuring the IPsec VPN connection at the host L2TP Server Configuration Comodo Korugan allows clients allow clients using Layer 2 Tunneling Protocol (L2TP) to connect to IPsec VPN tunnel. In order to allow L2TP clients, the L2TP service needs to b enabled and configured in the appliance. The 'L2TP' services area allows administrators to enable the service and configure the connection parameters for the L2TP server. To access the 'L2TP' interface, click 'VPN' > 'L2TP' from the left hand side navigation. 253
254 Enabled - Select the checkbox to enable the L2TP service Zone - Choose the internal network zone to allow external clients and networks to access through the IPsec VPN using L2TP Dynamic IP pool start address/end address - Specify the IP address range for dynamic assignment to the external clients that connect through L2TP Debug options - Allows the administrator to configure the level of detail recorded for L2TP events in the debug log file in the event of connection failures. The log file is located at /var/log/messages in the internal storage of the appliance. Click the '+' button to view the list of available options. Click 'Save and restart'. The VPN server will be restarted for your configuration to take effect. If the administrator wishes to allow several L2TP users to connect through the IPsec tunnel, the endusers are to be created for the service. Refer to the section in the IPsec / L2TP Users Configuration for more details IPsec / L2TP Users Configuration The IPsec / L2TP Users Configuration area allows the administrator to add and manage user accounts for the end users that connect to the IPsec VPN tunnel. 254

255 To access the 'IPsec / L2TP Users' interface, click 'VPN' > 'IPsec / L2TP Users' from the left hand side navigation. A list of user accounts added to the service will be listed. IPsec / L2TP User Configuration table - Column Descriptions Column Description Name The name of the user. Remark A short description about the user account. Authentication The authentication method used for identifying the user to the VPN service Actions Displays control buttons for managing the user account. - Allows the administrator to switch the user account between enabled and disabled states. - Enables to edit the user account. The pane for editing a user account is similar to the pane for adding a new user account. Refer to the section explaining adding a new user account for more details. - Removes the user account. To add a new user account Click 'Add account'. The 'Add new user' pane will open. 255
256 User Information Username - Enter the name of the user Password - Enter the password for the user to connect to the VPN and re-enter the password for confirmation in the 'Verify password' field Remark- A short description of the user account Authentication Methods Select the type(s) of authentication used by the user by selecting the respective checkboxe(s). Click 'Save' The user will be added to the list. But for the user account to take effect, the IPsec / L2TP server needs to be re-started. Click Restart IPsec / L2TP server for enable the user. 12 Viewing Logs The Logs module displays the list of events that are currently taking place across all modules, allowing administrators to effectively troubleshoot any problems and to stay informed of events in real time. Also the administrator can specify a remote syslog server to maintain detailed logs covering all aspects of the appliance. The logs can be filtered according to granular criteria to locate events which, for example, took place in a certain time period, which contain certain keywords or which concerned specific modules. 256

257 The following sections provide detailed descriptions of viewing realtime logs and configuring the 'Logs' module. Realtime Logs - Viewing realtime logs of selected features/utm modules. Configuring Log Settings - Configuring the log settings like log view options, remote syslog server, life cycle of log summaries and so on. Using Korugan Log Collector - Setting up a remote log server within the network and viewing the logs from the Korugan Appliance Realtime Logs Comodo Korugan can display realtime log of events from selected modules for instant analysis and trouble shooting. The Live Logs interface displays a list of modules and enables the administrator to select the module(s) to view their current events. The list of events pertaining to the selected module(s) are displayed in a new scrolling window, which is updated in real time. The window also allows the administrator to filter the logs to search for events of specific type. To access the 'Live Logs' interface, click 'Logs' > 'Live' from the left hand side navigation. 257

258 The administrator can view the realtime logs of following modules from this interface: Antivirus - Displays log of current scan and antivirus database update events from the Antivirus module Content filter - Displays the log of websites and pages that were filtered according to Content Filtering Settings. Refer to the section Configuring URL and Content Filtering for more details of the settings. Firewall - Displays the log of network connection attempts that were allowed and blocked by the Firewall. The administrator can view the full details like the IPAddress:Port/MAC address of the source and destination, the connection protocol etc., of each entry by clicking the + button beside the entry. Webserver - Displays a list of web pages and elements that passe through the URL filter. Refer to the section Configuring URL and Content Filtering for more details on configuring the URL filter. SSLVPN - Displays the list of current events relevant to SSL VPN connections. SMTP Proxy - Displays the list of current events relevant to SMTP proxy service configured under Proxy > SMTP interface. Refer to the section SMTP Proxy for more details on the configuration of the SMTP Proxy service. Intrusion detection - Displays the list of current events relevant to attempts of intrusion into the network, as identified by the Intrusion Detection System (IDS) service. Web proxy - Displays the list of current events relevant to the HTTP/HTTPS Proxy services. System - Displays the list of current events relevant to changes in Korugan system settings and network configuration. To view the live logs Open 'Live Logs' interface by clicking 'Logs' > 'Live' from the left hand side navigation To view the live log viewer for a single module or service, click 'Show this log only' link beside the module/service name To view the live log viewer for a set of modules, choose the modules by selecting the checkboxes beside them and click 'Show selected logs' To view the live log viewer for all the modules, select 'Select all' checkbox and click 'Show selected logs' Tip: You can add or remove modules for which you wish to view the logs from the live log viewer module too. 258

259 The Live Log Viewer will open in a new browser window. Click the '+' button at the right end of a log entry to view its details. The 'Settings' pane of the live log viewer contains the filtering options and controls. The 'Live Logs' pane displays the list of the current events relevant to the selected modules in forward or reverse chronological order and is continuously updated. Settings The Settings area contains the options and controls for the following: Selecting Modules for viewing Logs Filtering the Log Entries Pausing and Resuming the log updates Autoscrolling the Live Log Viewer Selecting Modules for viewing Logs The modules for which the live loges are displayed, are listed at the top right of the settings pane. Each module name is highlighted by a color that indicate log type. The log entries in the Live Logs pane are highlighted with the respective color of the log type. To add or remove modules to view the logs Click the 'Show More' link at the top right. A list of modules will be displayed. 259

260 Select the modules for which you wish to view the live logs and deselect the modules for which you do not wish to view the live logs The realtime log entries corresponding only to the selected modules are displayed in the lower pane. Filtering the Log Entries The log entries displayed at the lower pane can be filtered by entering the filter criteria keywords. To filter the log entries Enter the keyword for primary filter in the 'Filter' text field Enter the keyword for filtering the results from the primary filter, in the 'Additional filter' text field The realtime log entries will be filtered and displayed based on the entered filter criteria. Pausing and Resuming the log updates By default, the Live Log viewer is dynamically updated with the current events that are pertinent to the selected modules. The administrator can temporarily stop the updates, for deeper analysis of certain events. To pause the updates click the 'Pause' now button. To resume updating, click 'Continue' button. Autoscrolling the Live Log Viewer The dynamically updated live log viewer can automatically scroll upwards to show the chronologically added latest entries at the bottom of the list. If the autoscrolling is not enabled, the administrator can use the scroll bar at the right to move the list upwards to see the latest entries. To enable autoscrolling, select the 'Autoscroll' checkbox Note: The 'Autoscroll' will be available only if the live log viewer is configured to sort the entries in chronological order, that is the latest entries added to the bottom of the list. If the live log viewer is configured to sort the entries in reverse chronological order by selecting the option 'Sort in reverse chronological order' from the Settings interface, the 'Autoscroll' option will not be available. Refer to the section 'Configuring Log Settings' for more details on configuring the log viewer. Changing height of the Log Viewer The Live Logs area displays the list of events pertaining to the selected modules and services. Each entry contains the log type, the precise date and time of the event and the message describing the event. The administrator can increase or decrease the height of the live log viewer. To increase the height of the log viewer in order to view large number of log entries at once, click 'Increase 260
261 height' repeatedly. The height is increased by two entries for a single click. To reduce the height of the log viewer, click 'Decrease height'. The height is decreased by two entries for a single click Configuring Log Settings Comodo Korugan allows the administrator to customize the log viewers of various modules under the Logs menu through the 'Log settings' interface. Also the administrator can enable remote logging, instructing the UTM appliance to pass the logs to a remote log server and specify certain important connection event types to be included in the Firewall logs, in addition to the usual events. Remote syslog configuration activities are logged, including date, time, type of event, subject id, component name and event outcome. To access the 'Log Settings' interface, click 'Logs' > 'Settings' from the left hand side navigation. The interface contains four areas: Log Viewing Options Remote Logging Firewall Logging Log Viewing Options The 'Log Viewing Options' area allows the administrator to customize the log viewer screens of different UTM modules/services. Number of lines to display - Specify the number of log entries to be displayed in a single page in the log viewer Sort in reverse chronological order - The log entries are normally displayed in chronological order, that is the latest entries added to the bottom of the page On selecting this option, the entries will be sorted in reverse chronological order, that is the latest entries will be added to the top of each page. 261
262 Remote Logging If the logs are to be posted on to a remote log server, the administrator can specify the remote server and the protocol to be used for the data transfer. The administrator can also setup a remote syslog server within the network, for example at the computer used by the administrator by installing 'Korugan Log Collector' and configure the appliance to forward the logs to it. Korugan Log Collector displays the logs from various modules in a granularly configurable interface. Refer to the section Using Korugan Log Collector for more details. Enabled - Select the checkbox to enable remote logging Syslog server -Specify the host name or the IP address of the remote logging server to which the logs are to be passed. Ensure that the server supports the latest IETF syslog protocol standards. If a remote syslog server is setup in the network by installing 'Korugan Log Collector', specify the IP address or the hostname of the endpoint at which the log collector is installed. Protocol - Choose the data transfer protocol to be used for transferring the logs from the drop-down. Tip: For Korugan Log Collector, choose UDP as data transfer protocol. Firewall Logging The Firewall Logging area allows the administrator to specify the certain connection event types to be included in the Firewall Logs, in addition to the usually logged events. Select the event types from the options in this area: Log packets with BAD constellation of TCP flags - Instructs the Firewall to include packets with all flags set, in the log. Log NEW connections without SYN flag - Instructs the Firewall to include all the new connections without the synchronization flag, in the log. Log accepted outgoing connections - Instructs the Firewall to include even the outgoing connections that pass the Firewall from the internal network zones, in the log. Log refused packets - Instructs the Firewall to include even the details of the packets that were refused from the external sources, in the log. Click 'Save' for your configuration to take effect Using Korugan Log Collector The Log Collector enables administrators to setup a remote syslog server within the network for remotely collecting and viewing logs from Korugan. The following sections provide more details on setting up the server and viewing the logs: Setting up the Log Server Viewing the Logs Setting up the Log Server Administrators can setup a remote syslog server within the network by downloading the Korugan Log Collector setup file and installing it on an endpoint (for example, the computer used by the administrator). The endpoint must be running Windows 7 SP1 or higher and Java 1.8 or higher. To download and install the Korugan Log Collector Open the Live Logs or Log Settings interface by clicking Logs from the left hand side navigation and choosing 'Live' or 'Settings' from the options. 262

263 Click the Download Korugan Log Collector link at the top right and save it on the endpoint at which the syslog server is to be configured. Note: The Endpoint in which the Syslog Server is setup should be in the same local network to which the Korugan Appliance is connected. Double click on the setup file to start the installation wizard. 263

264 By default, the log collector will be installed in the location C:\Koruganlogs. You can change the installation location as you wish in the next step of the wizard. Follow the wizard and complete the installation. Configure the appliance to forward the logs to the syslog server. Login to the appliance console and open the 'Log Settings' interface by clicking Logs > Settings 264

265 from the left hand side navigation Select 'Enabled' in the 'Remote Logging' settings, enter the IP address or hostname of the endpoint on which the Log Collector is installed and choose 'UDP' as data transfer protocol Click 'Save' for your settings to take effect The Syslog server is now setup and configured. The appliance will periodically forward the logs to the syslog server. You can configure the time interval for the syslog server to fetch the logs from the appliance from the Time Filter in the log viewer module. Refer to the description of setting log refresh time interval in the section below, for more details. Viewing the Logs Once the syslog server has been configured on the endpoint, the log viewer module can be opened using any web browser. To view the log viewer, Enter at the address bar of the web browser The authentication dialog will be displayed. Use the default username 'korugan' and password 'korugan' and login to the log viewer. The log viewer will be displayed. 265

266 Logs from each module can be accessed used the menu on the left. The logs themselves are displayed in the main pane on the right. You can search for specific events using the filter options, configure log labels, columns to be displayed and more. Dashboard - Displays a summary snapshot of event logs from all the modules in a 'tile' view. You can configure the label, and type of charts to be displayed on each tile. Web - Displays the logs of web/url filtering events at the endpoints. System - Displays the logs of system related events at the endpoints. Firewall - Displays the logs of Firewall actions at the endpoints with the respective firewall rule applied DHCP - Displays the logs from DHCP server configured in the appliance, that applied fixed and dynamic IP addresses to clients in different network zones. Analyser - Displays the logs from the Advanced Threat Protection (ATP) Module that analyzes each and every file downloaded from web sites and attachments at each endpoint. Wrapper - Logs actions where containment technology was deployed by the ATP Module on an unknown file. Hotspot Displays connection attempts by wireless devices to the hotspot created by the appliance, including login credentials, IP addresses and MAC addresses. Filtering the Logs by Time You can view logs for specific periods using the Time Filter: To filter the logs by time Click the 'Time Filter' drop-down and choose the time period for viewing the logs from the past N number of minutes, hours or days. 266
267 To view the logs for a specific time period Click the 'Time Filter' drop-down and choose 'Custom'. Enter the precise date and time of the start and end of the period to view the logs from. 267
268 To Set Log Refresh Time Interval Click the 'Time Filter' drop-down hover the mouse cursor over 'Auto Refresh' and choose the time interval 268

269 Saving the Logs The log viewer allows administrators to save the logs from selected module in.pdf format for later analysis. To save the logs Click the 'Save As' button at the top right and choose the file format. 269
Comodo Korugan Software Version 1.8
 rat Comodo Korugan Software Version 1.8 Unified Threat Management Administrator Guide Guide Version 1.8.050515 Comodo Security Solutions 1255 Broad Street Clifton, NJ 07013 Table of Contents 1 Introduction
Comodo Dome Firewall Software Version 2.0
 rat Comodo Dome Firewall Software Version 2.0 Dome Firewall Virtual Appliance Administrator Guide Guide Version 2.0.092017 Comodo Security Solutions 1255 Broad Street Clifton, NJ 07013 Table of Contents
Comodo Dome Firewall Software Version 2.3
 3rat Comodo Dome Firewall Software Version 2.3 Dome Firewall Virtual Appliance Administrator Guide Guide Version 2.3.020618 Comodo Security Solutions 1255 Broad Street Clifton, NJ 07013 Table of Contents
Comodo Dome Firewall Software Version 2.7
 3rat Comodo Dome Firewall Software Version 2.7 Dome Firewall Virtual Appliance Administrator Guide Guide Version 2.7.121118 Comodo Security Solutions 1255 Broad Street Clifton, NJ 07013 Table of Contents
Comodo Dome Firewall Software Version 2.4
 rat Comodo Dome Firewall Software Version 2.4 Dome Firewall Virtual Appliance Quick Start Guide Guide Version 2.4.042418 Comodo Security Solutions 1255 Broad Street Clifton, NJ 07013 Comodo Dome Firewall
Comodo One Software Version 3.8
 rat Comodo One Software Version 3.8 Dome Cloud Firewall Administrator Guide Guide Version 1.1.091517 Comodo Security Solutions 1255 Broad Street Clifton, NJ 07013 Table of Contents 1 Introduction to Dome
Comodo One Software Version 3.8
 rat Comodo One Software Version 3.8 Dome Cloud Firewall Quick Start Guide Guide Version 1.1.061118 Comodo Security Solutions 1255 Broad Street Clifton, NJ 07013 Comodo Dome Cloud Firewall Quick Start This
Comodo Dome Firewall Central Manager Software Version 1.2
 3rat Comodo Dome Firewall Central Manager Software Version 1.2 Administrator Guide Guide Version 1.2.042418 Comodo Security Solutions 1255 Broad Street Clifton, NJ 07013 Table of Contents 1 Introduction
Barracuda Link Balancer
 Barracuda Networks Technical Documentation Barracuda Link Balancer Administrator s Guide Version 2.3 RECLAIM YOUR NETWORK Copyright Notice Copyright 2004-2011, Barracuda Networks www.barracuda.com v2.3-111215-01-1215
CHAPTER 7 ADVANCED ADMINISTRATION PC
 ii Table of Contents CHAPTER 1 INTRODUCTION... 1 Broadband ADSL Router Features... 1 Package Contents... 3 Physical Details... 4 CHAPTER 2 INSTALLATION... 6 Requirements... 6 Procedure... 6 CHAPTER 3 SETUP...
RX3041. User's Manual
 RX3041 User's Manual Table of Contents 1 Introduction... 2 1.1 Features and Benefits... 3 1.2 Package Contents... 3 1.3 Finding Your Way Around... 4 1.4 System Requirements... 6 1.5 Installation Instruction...
Deployment Guide: Routing Mode with No DMZ
 Deployment Guide: Routing Mode with No DMZ March 15, 2007 Deployment and Task Overview Description Follow the tasks in this guide to deploy the appliance as a router-firewall device on your network with
LevelOne FBR User s Manual. 1W, 4L 10/100 Mbps ADSL Router. Ver
 LevelOne FBR-1416 1W, 4L 10/100 Mbps ADSL Router User s Manual Ver 1.00-0510 Table of Contents CHAPTER 1 INTRODUCTION... 1 FBR-1416 Features... 1 Package Contents... 3 Physical Details... 3 CHAPTER 2
SonicWALL Security Appliances. SonicWALL SSL-VPN 200 Getting Started Guide
 SonicWALL Security Appliances SonicWALL SSL-VPN 200 Getting Started Guide SonicWALL SSL-VPN 200 Appliance Getting Started Guide This Getting Started Guide contains installation procedures and configuration
User Manual DIR-615. Wireless N 300 Home Router
 DIR-615 Wireless N 300 Home Router April 2013 Contents Chapter 1. Introduction...5 Contents and Audience...5 Conventions...5 Document Structure...5 Chapter 2. Overview...6 General Information...6 Specifications...7
DSL/CABLE ROUTER with PRINT SERVER
 USER S MANUAL DSL/CABLE ROUTER with PRINT SERVER MODEL No:SP888BP http://www.micronet.info 1 Content Table CHAPTER 0:INTRODUCTION... 4 FEATURES... 4 MINIMUM REQUIREMENTS... 4 PACKAGE CONTENT... 4 GET TO
Comodo Dome Shield - Admin Guide
 rat Comodo Dome Shield Software Version 1.12 Administrator Guide Guide Version 1.12.111717 Comodo Security Solutions 1255 Broad Street Clifton, NJ 07013 Table of Contents 1 Introduction to Comodo Dome
Wireless-G Router User s Guide
 Wireless-G Router User s Guide 1 Table of Contents Chapter 1: Introduction Installing Your Router System Requirements Installation Instructions Chapter 2: Preparing Your Network Preparing Your Network
Peplink SD Switch User Manual. Published on October 25th, 2018
 Peplink SD Switch User Manual Published on October 25th, 2018 1 Table of Contents Switch Layout 4 Specifications 5 Hardware Overview 6 Quick Start Functions 7 Reset Switch 7 Connect Ethernet 7 Connect
Multi-Homing Broadband Router. User Manual
 Multi-Homing Broadband Router User Manual 1 Introduction... 4 Features... 4 Minimum Requirements... 4 Package Content... 4 Note... 4 Get to know the Broadband Router... 5 Back Panel... 5 Front Panel...
UIP1869V User Interface Guide
 UIP1869V User Interface Guide (Firmware version 0.1.8 and later) Table of Contents Opening the UIP1869V's Configuration Utility... 3 Connecting to Your Broadband Modem... 5 Setting up with DHCP... 5 Updating
IP806GA/GB Wireless ADSL Router
 IP806GA/GB Wireless ADSL Router 802.11g/802.11b Wireless Access Point ADSL Modem NAT Router 4-Port Switching Hub User's Guide Table of Contents CHAPTER 1 INTRODUCTION... 1 Wireless ADSL Router Features...
Conceptronic C100BRS4H Quick Installation Guide. Congratulations on the purchase of your Conceptronic 4-ports Broadband Router.
 Conceptronic C100BRS4H Quick Installation Guide Congratulations on the purchase of your Conceptronic 4-ports Broadband Router. The enclosed Hardware Installation Guide gives you a step-by-step explanation
SonicOS Release Notes
 SonicOS Contents Platform Compatibility... 1 Known Issues... 2 Resolved Issues... 4 Upgrading SonicOS Enhanced Image Procedures... 5 Related Technical Documentation... 10 Platform Compatibility The SonicOS
NetExtender for SSL-VPN
 NetExtender for SSL-VPN Document Scope This document describes how to plan, design, implement, and manage the NetExtender feature in a SonicWALL SSL-VPN Environment. This document contains the following
LKR Port Broadband Router. User's Manual. Revision C
 LKR-604 4-Port Broadband Router User's Manual Revision C 1 Contents 1 Introduction... 4 1.1 Features... 4 1.2 Package Contents... 4 1.3 Finding Your Way Around... 5 1.3.1 Front Panel... 5 1.3.2 Rear Panel
User Manual DIR-615. Wireless Router with Built-in 4-port Switch
 DIR-615 Wireless Router with Built-in 4-port Switch December 2011 Contents Chapter 1. Introduction...4 Contents and Audience...4 Conventions...4 Document Structure...4 Chapter 2. Overview...5 General Information...5
AccessEnforcer Version 4.0 Features List
 AccessEnforcer Version 4.0 Features List AccessEnforcer UTM Firewall is the simple way to secure and manage your small business network. You can choose from six hardware models, each designed to protect
A5500 Configuration Guide
 A5500 Configuration Guide Sri Ram Kishore February 2012 Table of contents Gateway Configuration... 3 Accessing your gateway configuration tool... 3 Configuring your broadband Internet access... 3 Configuring
Broadband Router. User s Manual
 Broadband Router User s Manual 1 Introduction... 4 Features... 4 Minimum Requirements... 4 Package Content... 4 Note... 4 Get to know the Broadband Router... 5 Back Panel... 5 Front Panel... 6 Setup Diagram...7
MikroWall Hotspot Router and Firewall System
 MikroWall Hotspot Router and Firewall System Installation and configuration guide Contents: 1.0 The Device:...2 1.1 The MikroWall Wireless...2 1.2 MikroWall Standard...2 2.0 Installation...2 2.1 Before
Installation Procedure Windows 2000 with Internet Explorer 5.x & 6.0
 Installation Procedure Windows 2000 with Internet Explorer 5.x & 6.0 Printer Friendly Version [ PDF 266K ] Before You Begin Before proceeding with the installation of a SOHO 6 appliance, you must have
Introduction... 3 Features... 3 Minimum Requirements... 3 Package Content... 3 Note... 3 Get to know the Broadband Router... 4 Back Panel...
 Introduction... 3 Features... 3 Minimum Requirements... 3 Package Content... 3 Note... 3 Get to know the Broadband Router... 4 Back Panel... 4 Front Panel... 5 Setup Diagram... 6 Getting started... 7 Chapter
Content 1 OVERVIEW HARDWARE DESCRIPTION HARDWARE INSTALLATION PC CONFIGURATION GUIDE... 5 WEB-BASED MANAGEMENT GUIDE...
 Content 1 OVERVIEW...1 1.1FEATURES...1 1.2 PACKETCONTENTS...3 1.3 SYSTEM REQUIREMENTS... 1.4 FACTORY DEFAULTS...4 1.5 WARNINGS AND CAUTIONS...4 2 HARDWARE DESCRIPTION... 6 3 HARDWARE INSTALLATION...8 4
Installation Procedure Windows 95/98/ME with Internet Explorer 5.x & 6.0
 Installation Procedure Windows 95/98/ME with Internet Explorer 5.x & 6.0 Printer Friendly Version [ PDF 240K ] Before You Begin Before proceeding with the installation of a SOHO 6 appliance, you must have
Configuring High Availability (HA)
") 4 CHAPTER This chapter covers the following topics: Adding High Availability Cisco NAC Appliance To Your Network, page 4-1 Installing a Clean Access Manager High Availability Pair, page 4-3 Installing
4 CHAPTER This chapter covers the following topics: Adding High Availability Cisco NAC Appliance To Your Network, page 4-1 Installing a Clean Access Manager High Availability Pair, page 4-3 Installing
Installation Procedure Windows NT with Netscape 4.x
 Installation Procedure Windows NT with Netscape 4.x Printer Friendly Version [ PDF 232K ] Before You Begin Before proceeding with the installation of a SOHO 6 appliance, you must have the following: A
1. Introduction... 5 The zones The Panda Gatedefender Appliance Management Interface Accessing the Panda Gatedefender Appliance...
 Reference Manual Gatedefender Contents 1. Introduction... 5 The zones... 6 The Panda Gatedefender Appliance Management Interface... 7 Accessing the Panda Gatedefender Appliance... 11 2. The System Menu...
UTM Content Security Gateway CS-2001
 UTM Content Security Gateway CS-2001 Quick Installation Guide Table of Contents 1. Package Contents... 3 2. Setup the UTM Content Security Gateway... 4 3. Hardware Installation... 5 4. Basic System Configuration...
The Administration Tab - Diagnostics
 The Administration Tab - Diagnostics The diagnostic tests (Ping and Traceroute) allow you to check the connections of your network components. Ping Test. The Ping test will check the status of a connection.
CyberGuard SG User Manual
 CyberGuard SG User Manual CyberGuard 7984 South Welby Park Drive #101 Salt Lake City, Utah 84084 Email: support@snapgear.com Web: www.cyberguard.com Revision 2.1.0 August 23rd, 2004 Contents 1. Introduction...1
CyberGuard SG User Manual
 CyberGuard SG User Manual CyberGuard 7984 South Welby Park Drive #101 Salt Lake City, Utah 84084 Email: support@snapgear.com Web: www.cyberguard.com Revision 2.1.5 July 21 st, 2005 Contents 1. Introduction...1
Unified Threat Management
 G H I J ECS Enter Unified Threat Management CR500ia-1F QUICK START GUIDE CR500ia-1F Appliance Document Version: PL QSG500ia-1F/96000/10.02.0.0.473/08082012 G H I J CR500ia-1F ECS Enter DEFAULTS Default
SonicOS Enhanced Release Notes
 SonicOS Contents Platform Compatibility... 1 Known Issues... 2 Resolved Known Issues... 3 Upgrading SonicOS Enhanced Image Procedures... 4 Related Technical Documentation...7 Platform Compatibility The
User Manual. SSV Remote Access Gateway. Web ConfigTool
 SSV Remote Access Gateway Web ConfigTool User Manual SSV Software Systems GmbH Dünenweg 5 D-30419 Hannover Phone: +49 (0)511/40 000-0 Fax: +49 (0)511/40 000-40 E-mail: sales@ssv-embedded.de Document Revision:
Viewing Network Status, page 116. Configuring IPv4 or IPv6 Routing, page 116. Configuring the WAN, page 122. Configuring a VLAN, page 137
 Networking Using the Networking module to configure your Internet connection, VLAN, DMZ, zones, routing, Quality of Service (QoS), and related features. It includes the following sections: Viewing Network
Broadband Router DC-202. User's Guide
 Broadband Router DC-202 User's Guide Table of Contents CHAPTER 1 INTRODUCTION... 1 Broadband Router Features... 1 Package Contents... 3 Physical Details...3 CHAPTER 2 INSTALLATION... 5 Requirements...
VMware Identity Manager Connector Installation and Configuration (Legacy Mode)
") VMware Identity Manager Connector Installation and Configuration (Legacy Mode) VMware Identity Manager This document supports the version of each product listed and supports all subsequent versions until
VMware Identity Manager Connector Installation and Configuration (Legacy Mode) VMware Identity Manager This document supports the version of each product listed and supports all subsequent versions until
VG422R. User s Manual. Rev , 5
 VG422R User s Manual Rev 1.0 2003, 5 CONGRATULATIONS ON YOUR PURCHASE OF VG422R... 1 THIS PACKAGE CONTAINS... 1 CONFIRM THAT YOU MEET INSTALLATION REQUIREMENTS... 1 1. INSTALLATION GUIDE... 2 1.1. HARDWARE
Comodo Dome Shield - Admin Guide
 rat Comodo Dome Shield Software Version 1.16 Administrator Guide Guide Version 1.16.062718 Comodo Security Solutions 1255 Broad Street Clifton, NJ 07013 Table of Contents 1 Introduction to Comodo Dome
LevelOne FBR-1405TX. User s Manual. 1-PORT BROADBAND ROUTER W/4 LAN Port
 LevelOne FBR-1405TX 1-PORT BROADBAND ROUTER W/4 LAN Port User s Manual 1 Introduction... 4 Features... 4 Minimum Requirements...4 Package Content... 4 Note...4 Get to know the Broadband Router... 5 Back
SOHO 6 Wireless Installation Procedure Windows XP with Internet Explorer 5.x & 6.0
 SOHO 6 Wireless Installation Procedure Windows XP with Internet Explorer 5.x & 6.0 Before you Begin Before you install the SOHO 6 Wireless, you must have: A computer with a 10/100BaseT Ethernet card installed
Dual WAN VPN Firewall VPN 3000 User s Guide. Version 1.0 Date : 1 July 2005 Please check for the latest version
 Dual WAN VPN Firewall VPN 3000 User s Guide Version 1.0 Date : 1 July 2005 Please check www.basewall.com for the latest version Basewall 2005 TABLE OF CONTENTS 1: INTRODUCTION... 4 Internet Features...
Comodo Dome Shield. Administrator Guide Guide Version Software Version 2.4. Comodo Security Solutions 1255 Broad Street Clifton, NJ 07013
 rat Comodo Dome Shield Software Version 2.4 Administrator Guide Guide Version 2.4.032019 Comodo Security Solutions 1255 Broad Street Clifton, NJ 07013 Table of Contents 1 Introduction to Comodo Dome Shield...3
SonicOS Enhanced Release Notes
 SonicOS Contents Platform Compatibility... 1 Known Issues... 2 Resolved Known Issues... 3 Upgrading SonicOS Enhanced Image Procedures... 5 Related Technical Documentation...8 Platform Compatibility The
User Guide TL-R470T+/TL-R480T REV9.0.2
 User Guide TL-R470T+/TL-R480T+ 1910012468 REV9.0.2 September 2018 CONTENTS About This Guide Intended Readers... 1 Conventions... 1 More Information... 1 Accessing the Router Overview... 3 Web Interface
LevelOne Broadband Routers
 LevelOne Broadband Routers FBR-1100TX FBR-1400TX FBR-1401TX FBR-1700TX User's Guide TABLE OF CONTENTS CHAPTER 1 INTRODUCTION... 1 Features of your LevelOne Broadband Router... 1 Package Contents... 4
SonicWALL / Toshiba General Installation Guide
 SonicWALL / Toshiba General Installation Guide SonicWALL currently maintains two operating systems for its Unified Threat Management (UTM) platform, StandardOS and EnhancedOS. When a SonicWALL is implemented
Viewing System Status, page 404. Backing Up and Restoring a Configuration, page 416. Managing Certificates for Authentication, page 418
 This chapter describes how to maintain the configuration and firmware, reboot or reset the security appliance, manage the security license and digital certificates, and configure other features to help
Broadband Router User s Manual. Broadband Router User s Manual
 Broadband Router User s Manual Table of Contents 1 Introduction... 1 1.1 Features... 1 1.2 Package Contents... 2 1.3 LEDs & Connectors of Broadband Router... 2 1.4 System Requirements... 2 1.5 Installation
Cisco Unified Operating System Administration Web Interface
 Cisco Unified Operating System Administration Web Interface ServerGroup, page 1 Hardware, page 2 Network Configuration, page 3 Software Packages, page 4 System, page 5 IP Preferences, page 6 Ethernet Configuration,
IPMI Configuration Guide
 IPMI Configuration Guide 1. Introduction of IPMI Server Manager... 2 2. IPMI Server Manager GUI Overview... 3 1 1. Introduction of IPMI Server Manager IPMI Server Manager allows remote access of computers
Cisco Unified Operating System Administration Web Interface for Cisco Emergency Responder
 Cisco Unified Operating System Administration Web Interface for Cisco Emergency Responder These topics describe the Cisco Unified Operating System (OS) Administration web interface for Cisco Emergency
MIMO Wireless Broadband Route r User s Manual 1
 MIMO Wireless Broadband Router User s Manual 1 Introduction...4 Features...4 Minimum Requirements...4 Package Content...4 Note...4 Get to know the Broadband Router...5 Back Panel...5 Front Panel...6 Setup
Agent and Agent Browser. Updated Friday, January 26, Autotask Corporation
 Agent and Agent Browser Updated Friday, January 26, 2018 2018 Autotask Corporation Table of Contents Table of Contents 2 The AEM Agent and Agent Browser 3 AEM Agent 5 Privacy Mode 9 Agent Browser 11 Agent
SonicOS Enhanced Release Notes
 SonicOS Contents Platform Compatibility... 1 Known Issues... 2 Resolved Issues... 5 Upgrading SonicOS Enhanced Image Procedures... 8 Related Technical Documentation... 13 Platform Compatibility The SonicOS
Introduction... 3 Features... 3 Minimum Requirements... 3 Package Content... 3 Note... 3 Get to know the Broadband Router... 4 Back Panel...
 Introduction... 3 Features... 3 Minimum Requirements... 3 Package Content... 3 Note... 3 Get to know the Broadband Router... 4 Back Panel... 4 Front Panel... 5 Setup Diagram... 6 Getting started... 7 Chapter
Configuring the SMA 500v Virtual Appliance
 Using the SMA 500v Virtual Appliance Configuring the SMA 500v Virtual Appliance Registering Your Appliance Using the 30-day Trial Version Upgrading Your Appliance Configuring the SMA 500v Virtual Appliance
Wireless Broadband Router
 LW6005A-R2 Wireless Broadband Router Manual 1 Introduction... 4 Features... 4 Minimum Requirements... 4 Package Content... 4 Note... 4 Get to know the Broadband Router... 5 Back Panel... 5 Front Panel...
User Manual. AC ac Wireless Access Point/Router. Model WAC124. NETGEAR, Inc.
 AC2000 802.11ac Wireless Access Point/Router Model WAC124 December 2018 202-11885-02 NETGEAR, Inc. 350 E. Plumeria Drive San Jose, CA 95134, USA AC2000 802.11ac Support Thank you for purchasing this NETGEAR
AplombTech Smart Router Manual
 AplombTech Smart Router Manual (Version: 1.0) 1 Version & Purpose Version Manual version V 1.0 Explanation Corresponds to the initial version of device Purpose This manual describes the function features
Panda GateDefender Reference Manual
 Panda GateDefender Reference Manual Table of Contents Introduction... 1 Getting Started... 1 Conventions Used in This Document... 1 The zones... 2 The Panda GateDefender Appliance Management Interface...
1. Press "Speed Test" to find out your actual uplink and downlink speed.
 ASRock G10 Gaming Router 6.4 QoS Settings QoS Add Gaming Boost web page. Gaming Boost: Enable or disable the Gaming Boost. Bandwidth The router supports Gaming Boost natively, which identifies and intelligently
AirCruiser G Wireless Router GN-BR01G
 AirCruiser G Wireless Router GN-BR01G User s Guide i Contents Chapter 1 Introduction... 1 Overview...1 Features...1 Package Contents...2 AirCruiser G Wireless Router Rear Panel...2 AirCruiser G Wireless
BaseWall VPN 1000 User s Guide
 BaseWall VPN 1000 User s Guide Version 1.0 Date : 4 July 2005 Please check www.basewall.com for the latest version Basewall 2005 Note : Please check on our website www.basewall.com for the latest version
Linksys E2000 Advanced Wireless-N Router. User Guide
 User Guide Table of Contents Contents Chapter 1: Product Overview 1 Top....................................................... 1 Back...................................................... 1 Horizontal
Endpoint Security Manager
 Comodo Endpoint Security Manager Software Version 1.6 CIS Configuration Editor Version 1.6.010511 Comodo Security Solutions 1255 Broad Street STE 100 Clifton, NJ 07013 Table of Contents 1.Introduction
Manual Overview. This manual contains the following sections:
 Table of Contents Manual Overview This manual contains the following sections: Section 1 - Product Overview describes what is included with the DIR-130 router, and things to consider before installing
Yamaha Router Configuration Training ~ Web GUI ~
 Yamaha Router Configuration Training ~ Web GUI ~ Equipment RTX810 Gigabit VPN Router SWX2200-8G/24G Smart L2 Switch GbE 5, USB 3G modem 1Gbps throughput All GbE Cooperation with RTX810 200Mbps VPN throughput
Introduction... 3 Features... 3 Minimum Requirements... 3 Package Content... 3 Get to know the Broadband Router... 4 Back Panel... 4 Front Panel...
 Introduction... 3 Features... 3 Minimum Requirements... 3 Package Content... 3 Get to know the Broadband Router... 4 Back Panel... 4 Front Panel... 5 Setup Diagram... 6 Getting started... 7 Chapter 1...
LevelOne WBR User s Manual. 11g Wireless ADSL VPN Router. Ver
 LevelOne WBR-3407 11g Wireless ADSL VPN Router User s Manual Ver 1.00-0510 Table of Contents CHAPTER 1 INTRODUCTION... 1 Wireless ADSL Router Features... 1 Package Contents... 5 Physical Details... 6 CHAPTER
rat Comodo EDR Software Version 1.7 Administrator Guide Guide Version Comodo Security Solutions 1255 Broad Street Clifton, NJ 07013
 rat Comodo EDR Software Version 1.7 Administrator Guide Guide Version 1.1.120318 Comodo Security Solutions 1255 Broad Street Clifton, NJ 07013 Table of Contents 1 Introduction to Comodo EDR...3 1.1 Purchase
Step-by-Step Configuration
 Step-by-Step Configuration Kerio Technologies C 2001-2004 Kerio Technologies. All Rights Reserved. Printing Date: April 25, 2004 This guide provides detailed description on configuration of the local network
Introduction... 3 Features... 3 Minimum Requirements... 3 Package Content... 3 Get to know the Broadband Router... 4 Back Panel... 4 Front Panel...
 Introduction... 3 Features... 3 Minimum Requirements... 3 Package Content... 3 Get to know the Broadband Router... 4 Back Panel... 4 Front Panel... 5 Setup Diagram... 6 Getting started... 7 Chapter 1...
Wireless a CPE User Manual
 NOTICE Changes or modifications to the equipment, which are not approved by the party responsible for compliance, could affect the user's authority to operate the equipment. Company has an on-going policy
300M Wireless-N Broadband Router User Manual
 300M Wireless-N Broadband Router Model No.: ib-wrb314n User Manual Ver.: 1.0.0 Contents...Error! Bookmark not defined. Chapter 1 Product Overview... 3 Package Contents 3 Conventions....4 Panel Overview...
Comodo Dome Data Protection Software Version 3.8
 Comodo Dome Data Protection Software Version 3.8 Installation Guide Guide Version 3.8.102417 Comodo Security Solutions 1255 Broad Street Clifton, NJ 07013 Table of Contents 1.About Dome Data Protection...
4-Port Broadband user manual Model
 4-Port Broadband Router user manual Model 524537 INT-524537-UM-0309-02 introduction Thank you for purchasing the INTELLINET NETWORK SOLUTIONS 4-Port Broadband Router, Model 524537. Combining a router,
Gigaset Router / en / A31008-E105-B / cover_front_router.fm / s Be inspired
 s Be inspired Table of Contents Table of Contents Safety precautions........................... 3 The Gigaset Router........................... 3 Features and Benefits..................................................
Peplink Balance Multi-WAN Routers
 Peplink Balance Multi-WAN Routers Model 20/30/210/310/380/390/580/710/1350 User Manual Firmware 5.1 September 10 Copyright & Trademarks Specifications are subject to change without prior notice. Copyright
Comodo Next Generation Security Information and Event Management Software Version 1.4
 rat Comodo Next Generation Security Information and Event Management Software Version 1.4 Administrator Guide Guide Version 1.4.101915 Comodo Security Solutions 1255 Broad Street Clifton, NJ 07013 Table
Standalone DVR User s Manual. Figure 4-81
 Figure 4-81 4.11.2 Network 4.11.2.1 TCP/IP The single network adapter interface is shown as in Figure 4-82 and the dual network adapters interface is shown as in Figure 4-83 Network Mode : Includes multiple
Configuration Guide TL-ER5120/TL-ER6020/TL-ER REV3.0.0
 Configuration Guide TL-ER5120/TL-ER6020/TL-ER6120 1910012186 REV3.0.0 June 2017 CONTENTS About This Guide Intended Readers... 1 Conventions... 1 More Information... 1 Viewing Status Information... 2 System
Installation Procedure Red Hat 7 with Netscape 6
 Installation Procedure Red Hat 7 with Netscape 6 Printer Friendly Version [ PDF 285K ] Before You Begin Before proceeding with the installation of a SOHO 6 appliance, you must have the following: A computer
Connecting the DI-804V Broadband Router to your network
 Before you begin Make sure that any existing Firewall Software/Devices are disabled and/or shutdown before beginning installation of your new D-Link DI-804V Broadband Router. Contents of Package DI-804V
Comodo cwatch Network Software Version 2.23
 rat Comodo cwatch Network Software Version 2.23 Administrator Guide Guide Version 2.23.060618 Comodo Security Solutions 1255 Broad Street Clifton, NJ 07013 Table of Contents 1 Introduction to Comodo cwatch
Broadband Router DC 202
 Broadband Router DC 202 Full Manual Table of Contents DC-202 xdsl/cable Broadband router REQUIREMENTS...4 INTRODUCTION...4 DC-202 Features...4 Internet Access Features...4 Advanced Internet Functions...5
CE APPROVED.4 INTRODUCTION.5 PACKAGE CONTENTS. 6 PRE - INSTALLATION CHECKLIST. 6 SYSTEM REQUIREMENTS. 6 FEATURES AND BENEFITS.11 SETUP WIZARD.
 Web Edition Dec. 2002 Contents CE APPROVED...4 INTRODUCTION...5 PACKAGE CONTENTS... 6 PRE - INSTALLATION CHECKLIST... 6 SYSTEM REQUIREMENTS... 6 FEATURES AND BENEFITS... 7 4 - PORT CABLE/XDSL ROUTER...9
Viola M2M Gateway Enterprise Edition
 Page 1(5) User Manuals User manuals and other documentation for Viola M2M Gateway product are available at: http://www.violasystems.com/docs/m2mgw/ Overview This document is a short description how to
07/ CONFIGURING SECURITY SETTINGS
 SECURITY LOG Malformed packet: Failed parsing a packed has been blocked because it is malformed. Maximum security enabled service a packet has been accepted because it belongs to a permitted service in