Urban Land Institute. November Make Your Move. Brian Beaulieu ITR Economics.
|
|
|
- Alban Palmer
- 5 years ago
- Views:
Transcription

1 Urban Land Institute November 212 Make Your Move Brian Beaulieu ITR Economics
 Housing 17 579 Ths Units 67 ( 4.8%) Employment 2 141.1 million 139.9 (-.9%) CPI 17 2.9% 3.2% * End of year 12-month index estimate")
2 Results for Duration Forecast Actual GDP 18 $ $ (-1.4%) US Ind Prod (12MMA) 93.8 (.8%) EU Ind. Prod (12MMA) 11.2 (.1%) CA Ind. Prod (.%) Retail Sales 18 $2.116 Trillion $2.16 (-.5%) Housing Ths Units 67 ( 4.8%) Employment million (-.9%) CPI % 3.2% * End of year 12-month index estimate
3 Results for Country Duration Accuracy Germany % France % Italy % United Kingdom % Spain % China % Japan % Brazil % EU Industries %
4 US/Global Recovery 4 Leading indicators pointing up Liquidity is not an issue Stimulative monetary policy Employment rising (companies right-sized) Banks are lending Retail Sales are rising Construction is improving Deficit spending continues

5 World GDP, Bils of US $, Current Prices 5 Source: IMF Trillion US$ Percent of 211 World GDP


6 Real Gross Domestic Product Trillions of $ '7 '8 '9 '1 '11 '12 '13 '14 '15 1.5


7 US Industrial Production to ITR Leading Indicator US IP 21 Indicator Indicator - Monthly US IP - 12/12 '8 '82 '84 '86 '88 '9 '92 '94 '96 '98 ' '2 '4 '6 '8 '1 '12 ' USIP 12/12 Indicator - Monthly
8 Phase 1 Data Preparation 8 Raw Jan Feb Mar Apr May Jun Jul Aug Sep Oct Nov Dec Jan Feb Mar Apr May Jun Jul Aug Sep Oct Nov Dec MMT / % 13.6% 13.2% 15.1% 13.5% 14.1% 11.3% 11.5% 1.1% 1.5% 12MMT / % 3/12 Rate-of-Change = December 211 3MMT December 21 3MMT = = 1.5% /12 Rate-of-Change = December MMT December 21 12MMT 1 1 = = 12.7%


9 Phase 3 Generate the Quantitative Forecast 9 Internal Trends Leading Economic Indicators ITR Long Term Business Cycle Theory News and Market Observations

10 Output - Deliverables 1 Applicable Advice Accurate Forecasts
11 US Industrial Production to Gross Domestic Product % % -7.1% GDP US IP -5.3% -14.6% '82 '84 '86 '88 '9 '92 '94 '96 '98 ' '2 '4 '6 '8 '1 '12 ' Year-over-year Quarter to Quarter (3/12)

12 Global Industrial Production 12 Year-Over-Year Growth Rates %
13 US to Europe Industrial Production US Europe US Europe Annual Average Data Trends


14 Western Europe Industrial Production 14 Year-Over-Year Growth Rates %

15 Gross Domestic Product by State All Industry Total, Millions of current dollars

16 US, Minnesota & the Plains Annual GSP Growth Rate % vs. 27.9%college educated -6 '98 ' '2 '4 '6 '8 '1 '12 U.S. Minnesota Plains

17 Unemployment Rates ' '1 '2 '3 '4 '5 '6 '7 '8 '9 '1 '11 '12 US Minnesota

18 Minnesota Construction Industry Employment 18 R-O-C 12 3/12 MMA / MMA 12MMA '98 '99 ' '1 '2 '3 '4 '5 '6 '7 '8 '9 '1 '11 '12 '13 '14 Thousands of Units 1 8
19 Minneapolis/St. Paul Construction Industry Employment 19 R-O-C 2 3/12 MMA / MMA 12MMA '98 '99 ' '1 '2 '3 '4 '5 '6 '7 '8 '9 '1 '11 '12 '13 '14 2 Thousands of Units
20 Employment Private Sector Employment Mils of Jobs '92 '94 '96 '98 ' '2 '4 '6 '8 '1 '12 ' Annual Data Trend
21 Unemployment Rate With and Without the Recover Plan

22 Total U.S. Public Debt (% of GDP)

23 Federal Spending Without & With Sequester Cuts Annual and Cumulative, FY 213*221 23

24 Surplus/Deficit as a Percentage of GDP 24
25 Costs by Age Categories 25

26 Caught in the Web Who can do what to whom 26 Federal Reserve Act of pages Glass-Steagall Act 37 Dodd-Frank 848 Not rules, but instructions on how to create more regulations and bureaucracies Source: The Economist

27 U.S. Dependence on Foreign Oil Declining Net imports as a share of domestic consumption 27 6% 6% 58% 57% 52% 49% 45%

28 G7 Productivity 28 Source: OECD / National Post

29 US Manufacturing as a % of GDP (Value Added) % % '88 '9 '92 '94 '96 '98 ' '2 '4 '6 '8 '1 '12 '14 1 3MMA


30 Consumer Price Index All Items /12 12/12 '82 '84 '86 '88 '9 '92 '94 '96 '98 ' '2 '4 '6 '8 '1 '12 '14-3 Rates-of-Change

31 Velocity of Money /12 12/12 '6 '8 '1 '12 ' Rates-of-Change

32 Crude Oil Futures Prices RAW 12MMA 5 25 '92 '94 '96 '98 ' '2 '4 '6 '8 '1 '12 '14 Light & Sweet $ per Barrel, Data Trends

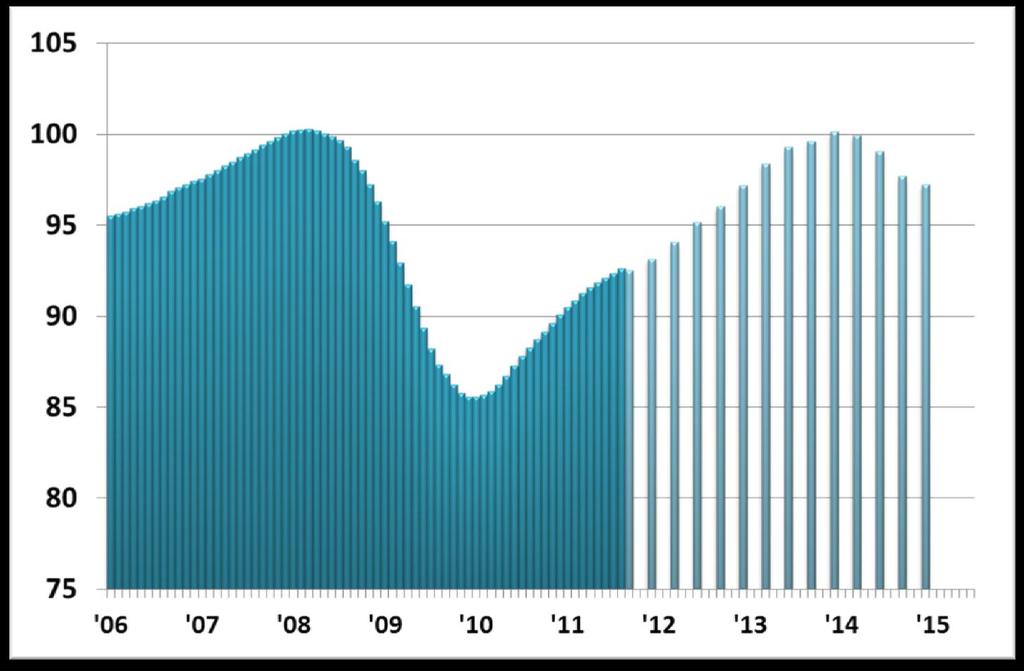
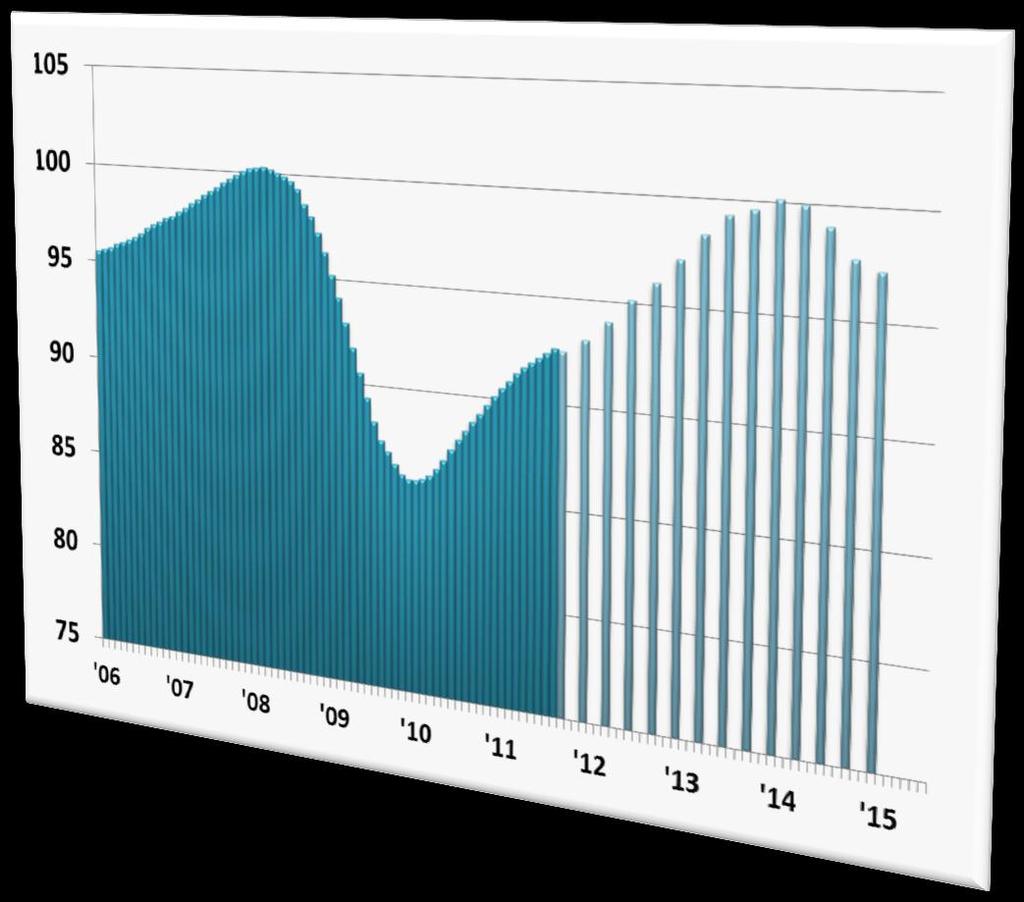
33 US Industrial Production Index Forecast Through December '82 '84 '86 '88 '9 '92 '94 '96 '98 ' '2 '4 '6 '8 '1 '12 '14 '16-15 Annual Average Index

34 Trends 1 34 Nonresidential Construction Wholesale Trade New Orders Housing Production Financial Retail Foreign Prices Medical Soft Landing Soft Landing Hard Landing


35 Nondefense Capital Goods New Orders w/o Aircraft 35 R-O-C MMT /12 12/12 Feb ' Oct '9 1 Jul '8-4 12MMT $ MMT Nov '9 6-8 '92 '94 '96 '98 ' '2 '4 '6 '8 '1 '12 '14 4 Billions of $


36 M2 Money Supply 36 R-O-C MMA Oct '9 1 12/ / Dec '9 Nov ' Actual MMA Jul '95 '94 '96 '98 ' '2 '4 '6 '8 '1 '12 '14 2. Trillions of 82$

37 Mortgage Rates to Federal Funds Mortgage Rates Federal Funds Raw Data


38 US Industrial Production to Corporate Bond Prices US IP 16 Bonds US IP Corporate Bonds /12 Rates-of-Change
39 US Government 1-Year Bond Yields to Municipal Bond Yields Municipal Bonds Long Term Bonds '9 '92 '94 '96 '98 ' '2 '4 '6 '8 '1 '12 '14 '16 Raw Data

40 US Leading Indicator Actual 12MMA '94 '96 '98 ' '2 '4 '6 '8 '1 '12 '14 6

41 Purchasing Managers Index Raw '9 '92 '94 '96 '98 ' '2 '4 '6 '8 '1 '12 ' Raw Data
42 Chicago Fed National Activity Index MMA '7 '8 '9 '1 '11 '12 ' Month Moving Average


43 University of Michigan Consumer Expectations Index /12 3/12 '7 '8 '9 '1 '11 '12 ' /12 Rate-of-Change


44 Delinquency Rates on Consumer Loans Percentage Percentage Year Average 1 Year Average Consumer Loan Delinquency Rate Consumer Credit Card Delinquency Rate '9 '91 '92 '93 '94 '95 '96 '97 '98 '99 ' '1 '2 '3 '4 '5 '6 '7 '8 '9 '1 '11 '12 '13 ' MMA Data Trends

45 Delinquency Rates for C&I Loans / % -41.1% 12/12 '9 '92 '94 '96 '98 ' '2 '4 '6 '8 '1 '12 ' /12 & 12/12 Rates-of-Change


46 Retail Sales Excluding Automobiles R-O-C 14 MMT /12 3/ MMT $ MMT '94 '96 '98 ' '2 '4 '6 '8 '1 '12 '14 1. Trillions of 82-84$

47 Personal Savings '8 '82 '84 '86 '88 '9 '92 '94 '96 '98 ' '2 '4 '6 '8 '1 '12 '14 Billions of $, Annual Data Trend SAAR
48 Stock Prices Index Raw 12MMA Data Trends

49 S&P 5 to FTSE 1 S&P 5 FTSE S&P 5 FTSE '86 '88 '9 '92 '94 '96 '98 ' '2 '4 '6 '8 '1 '12 '14 Data Trends

50 S&P 5 to S&P Toronto Stock Exchange (TSX) S&P S&P TSX 16, 14, 12, 1, 8, 6, 4, 5 2 S&P 5 S&P TSX 2, '94 '95 '96 '97 '98 '99 ' '1 '2 '3 '4 '5 '6 '7 '8 '9 '1 '11 '12 '13 '14 Data Trends

51 S&P 5 to Shanghai Stock Exchange Composite Index (SSEA) S&P S&P 5 SSEA '94 '95 '96 '97 '98 '99 ' '1 '2 '3 '4 '5 '6 '7 '8 '9 '1 '11 '12 '13 '14 51 SSEA 9, 8, 7, 6, 5, 4, 3, 2, 1, Data Trends


52 Existing Home Sales R-O-C 3 MMT /12 12/ MMT 12MMT '94 '96 '98 ' '2 '4 '6 '8 '1 '12 '14 3 Millions of Units


53 Housing Starts 53 R-O-C /12 12/ MMT MMT 12MMT '94 '96 '98 ' '2 '4 '6 '8 '1 '12 '14.2 Millions of Units
54 Building Permits '98 '99 ' '1 '2 '3 '4 '5 '6 '7 '8 '9 '1 '11 '12 '13 '14 U.S. Minnesota -5 12/12 Rates-of-Change
55 Minnesota Building Permits 55 R-O-C 1 MMT /12 12/ MMT 12MMT '98 '99 ' '1 '2 '3 '4 '5 '6 '7 '8 '9 '1 '11 '12 '13 '14 Thousands of Units
56 Minneapolis Area Building Permits R-O-C 15 Apartment vacancy low at 2.4% and rents on the rise MMT /12 12/ MMT 12MMT '98 '99 ' '1 '2 '3 '4 '5 ''6 '7 '8 '9 '1 '11 '12 '13 '14 Thousands of Units
57 US to Minneapolis/St. Paul Median Home Sale Prices US Median Price Minneapolis Median Price $169.2 $158.4 '2 '3 '4 '5 '6 '7 '8 '9 '1 '11 '12 '13 ' Annual Data Trends
58 Minnesota Housing Price Index Raw 1 1 Year over Year % Change
59 Housing Starts to Multi-Family Residential Construction Starts Construction Starts Construction '94 '96 '98 ' '2 '4 '6 '8 '1 '12 ' /12 Rates-of-Change
60 US Industrial Production to Non-Residential Construction Index 155 Construction Index Construction Data Trends
61 Architecture Billings Index /12 12/12 '98 ' '2 '4 '6 '8 '1 '12 ' /12 Rates-of-Change
62 Private Commercial Buildings Construction to Multi-Retail Buildings Construction Commercial 3 Multi-Retail MSP retail : total value and mean price rising Vacancy rate about national average at 11.5% Commercial Multi-Retail '96 '98 ' '2 '4 '6 '8 '1 '12 ' /12 Rates-of-Change
63 Warehouse Buildings Construction R-O-C MMT /12 12/ MMT 12MMT '96 '98 ' '2 '4 '6 '8 '1 '12 '14 Private, Billions of Dollars


64 Public Educational Buildings Construction to State & Local Government Expenditures Construction 4 Expenditures Construction - 12/12 Expenditures - 3/12 '82 '84 '86 '88 '9 '92 '94 '96 '98 ' '2 '4 '6 '8 '1 '12 ' Rates-of-Change


65 Office Buildings Construction R-O-C /12 12/12 MSP vacancy high at 18.2%; rents expected to be rising MMT MMT MMT '94 '96 '98 ' '2 '4 '6 '8 '1 '12 '14 1 Billions of $
66 213 66

67 214 67
68 Phase Management Objectives TM Recovery 1. Positive leadership modeling (culture turns to behavior) 2. Establish goals: tactical goals which lead to strategic achievement 3. Develop a system for measurement and accountability re:#2 4. Align compensation plans with #2 and #3 5. Be keenly aware of the BE (Break Even) point and check it regularly 6. Judiciously expand credit 7. Check distributions systems for readiness to accommodate increased activity 8. Review and uncover competitive advantages 9. Invest in customer market research (know what they value) 1. Improve efficiencies with investment in technology and software

69 Phase Management Objectives TM Recovery Part Start to phase out marginal opportunities 12. Add sales staff 13. Build inventories (consider lead time and turn rate) 14. Introduce new product lines 15. Determine capital equipment needs and place orders 16. Begin advertising and sales promotions 17. Hire "top" people 18. Implement plans for facilities expansion 19. Implement training programs
70 7 Must Watch Items 7 ITR Leading Indicator Housing Starts US Leading Indicator Purchasing Managers Index Retail Sales Employment Nondefense Capital Goods New Orders Available from ITR via ITR Trends Report, the ITR Advisor, or on the web
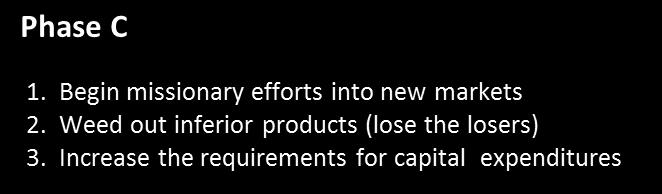
71 Phase Management Objectives TM 71 Phase Late C - Warning 9. Identify and overcome any competitive disadvantages 1. Make sure you and the management team are not in denial 11. Cross train key people 12. Watch Accounts Receivable aging 13. Increase the requirements for justification of capital expenditures 14. Evaluate vendors for strength (don t get caught honoring their warranties with no one to accept returned goods) 15. Manage the backlog through pricing and delivery, try to fill the funnel


72 Complimentary Copy of the ITR Advisor 72 Concise 4 Page Report Excellent Economic Snap Shot" Consists of Current Events, Brief Industry Segments, Snap Shot Indicators, Readers' Questions, Fed Notes, ITR Opportunity Index, and more Delivered Monthly
CEMA Marc Mar h c 2013 Alan Alan Beaulieu ITR E c E onomics ITR Economics
 CEMA March 213 Make Your Move: 213-214214 Alan Beaulieu ITR Economics 212 Forecast Results 2 Duration Forecast GDP 12 $13.593 Actuals $13.593 Trillion $13.648 $13.648.4% US Ind. Prod. 31 97.2 (12MMA) 97.2.%
FISCAL REALITY. Alan Beaulieu, President, ITR Economics
 FISCAL REALITY Alan Beaulieu, President, ITR Economics Alan s presentations cover a wide variety of topics including short- and long-term global economic forecasts, regional economic updates, an outlook
2014 Forecast Results
 214 Forecast Results Duration Forecast Result* Accuracy US GDP 15 $16.98 Trillion $16.345 Trillion 98.5% US Ind. Prod. 13 11.5 (12MMA) 14.2 97.3% EU Ind. Prod. 14 1.6 (12MMA) 11.6 99.% Canada Ind Prod
Urban Land Institute A Bend in the Road
 Urban Land Institute A Bend in the Road Brian Beaulieu CEO 216 Forecast Results 2 Duration Accuracy US GDP 15 99.1% US Ind. Prod. 1 99.9% Eur Ind. Prod. 15 99.2% Canada Ind Prod 15 99.6% China Ind Prod
The Vision Council Winds of Change
 The Vision Council Winds of Change Brian Beaulieu CEO Preliminary 217 Forecast Results If you heard ITR a year ago 2 Duration Accuracy US GDP (data through Sep) 24 98.5% US Ind. Prod. (Dec) 24 96.8% Eur
Forging Industry Association
 Forging Industry Association Alan s TEC Generic Prosperity in the Age of Decline Brian Beaulieu CEO 213 Forecast Results 2 Duration Forecast Actuals Accuracy US GDP 12 $15.818 Trillion $15.966 Dec 99.3%
Economic Outlook. William Strauss Senior Economist and Economic Advisor Federal Reserve Bank of Chicago
 Economic Outlook Illinois Public Pension Fund Association Hoffman Estates, IL February 16, 217 William Strauss Senior Economist and Economic Advisor Federal Reserve Bank of Chicago GDP expanded by 1.9%
Economic Update. Automotive Insights Conference. Paul Traub. Federal Reserve Bank of Chicago January 18, Senior Business Economist
 Economic Update Automotive Insights Conference Federal Reserve Bank of Chicago January 18, 2018 Paul Traub Senior Business Economist Main Economic Indicators Year-over-year Comparison 2015 2016 2017 GDP
Economic Update German American Chamber of Commerce
 Economic Update German American Chamber of Commerce Federal Reserve Bank of Chicago October 6, 2015 Paul Traub Senior Business Economist U.S. Real GDP Billions Chained $2009, % Change Q/Q at SAAR $ Billions
Economic Update Birmingham Bloomfield Chamber Breakfast
 Economic Update Birmingham Bloomfield Chamber Breakfast Federal Reserve Bank of Chicago February 2, 2016 Paul Traub Senior Business Economist Overview U.S. Economy (C + I + G + Nx) U.S. Consumer Monetary
Today s Vision Tomorrow s Reality. Brian Beaulieu CEO
 Canadian Institute of Plumbing and Heating Today s Vision Tomorrow s Reality Brian Beaulieu CEO 215 Forecast Results 2 Duration 215 Forecast Result Accuracy US GDP 18 $16.632 Trillion $16.442 Trillion
Hydraulic Institute Annual Conference A Good Year Ahead
 Hydraulic Institute Annual Conference A Good Year Ahead Dr. Alan Beaulieu President Preliminary 216 Forecast Results 2 Duration Accuracy US GDP 15 99.5% US Ind. Prod. 1 99.8% Eur Ind. Prod. 15 99.2% Canada
Economic and Housing Market Trends and Outlook
 Economic and Housing Market Trends and Outlook Lawrence Yun, Ph.D. Chief Economist NATIONAL ASSOCIATION OF REALTORS Presentation to Memphis Area Association of REALTORS Memphis, TN April 2, 213 Forecast
Marine Leadership Alliance Winds of Change
 Marine Leadership Alliance Winds of Change Connor Lokar Economist 217 Forecast Results If you heard ITR around two years ago 2 Duration Accuracy US GDP 24 99.7% US Ind. Prod. 24 96.8% Europe Ind. Prod.
Light Vehicle Sales Are We at a Turning Point?
 Light Vehicle Sales Are We at a Turning Point? Federal Reserve Bank of Chicago June 3, 2016 Paul Traub Senior Business Economist Overview U.S. Economy (C + I + G + Nx) U.S. Consumer Ability and Willingness
Economic Update Baker College - Flint
 Economic Update Baker College - Flint Federal Reserve Bank of Chicago January 10, 2017 Paul Traub Senior Business Economist Main Economic Indicators Year-over-year Comparison Actual 2014 2015 2016 GDP
Baird Family Wealth Group
 Baird Family Wealth Group Presents: Brian Beaulieu September 7, 216 www.bairdfamilywealthgroup.com Milwaukee 777 East Wisconsin Avenue Milwaukee, WI 5322 414-765-792 Dallas 595 Berkshire Lane Dallas, TX
Economic Outlook C.F.A. West Michigan Society Luncheon
 Economic Outlook C.F.A. West Michigan Society Luncheon Federal Reserve Bank of Chicago Detroit Branch May 22, 2012 Paul Traub Overview Economy - GDP The U.S. Consumer Home Prices Inflation Employment U.S.
Economic Outlook. William Strauss Senior Economist and Economic Advisor Federal Reserve Bank of Chicago
 Economic Outlook Midwest Association of Rail Shippers Lombard, IL January 13, 216 William Strauss Senior Economist and Economic Advisor Federal Reserve Bank of Chicago The Great Recession ended in June
Guidance in Uncertain Times. Alex Chausovsky Senior Analyst
 Guidance in Uncertain Times Alex Chausovsky Senior Analyst 1 216 Forecast Results 2 Duration Accuracy US GDP 15 99.1% US Ind. Prod. 1 99.9% Eur Ind. Prod. 15 99.2% CanadaInd Prod 15 99.6% China Ind Prod
Consensus Outlook
 Consensus Outlook - 219 Thirty-second Annual Economic Outlook Symposium November 3, 218 William Strauss Senior Economist and Economic Advisor Federal Reserve Bank of Chicago The views expressed herein
Consensus Outlook
 Consensus Outlook - 218 Thirty-first Annual Economic Outlook Symposium December 1, 217 William Strauss Senior Economist and Economic Advisor Federal Reserve Bank of Chicago The views expressed herein are
Consensus Outlook 2018 and 2019
 Consensus Outlook 218 and 219 Twenty-fourth Annual Automotive Outlook Symposium June 2, 217 William Strauss Senior Economist and Economic Advisor Federal Reserve Bank of Chicago The views expressed herein
THE ELECTION, SMALL BUSINESS, AND THE ECONOMY
 THE ELECTION, SMALL BUSINESS, AND THE ECONOMY WILLIAM DUNKELBERG CHIEF ECONOMIST, NFIB TWO WAYS OUT, NEITHER DESIRABLE INDEX OF CONSUMER SENTIMENT QUARTERLY APRIL 110 100 Index Value 90 80 70 60
Real Estate Forecast 2015
 Real Estate Forecast 2015 No Place But Up Interest Rates Rents Prices Real Estate and the Economy Ted C. Jones, PhD Chief Economist Stewart Title Guaranty Company Thank Heavens for Global Warming Think
Industrial Supply Association Winds of Change
 Industrial Supply Association Winds of Change Dr. Alan Beaulieu President 217 Forecast Results If you heard ITR around two years ago 2 Duration Accuracy US GDP 24 99.7% US Ind. Prod. 24 96.8% Europe Ind.
Houston Economic Outlook. Prepared by Patrick Jankowski SVP Research
 Houston Economic Outlook Prepared by Patrick Jankowski SVP Research Longest U.S. Expansions Tech Boom '91 - '01 120 Current Boom June '09 to Present 114 60s Boom '61 - '69 Reagan Years '82 - '90 92 106
Federal Reserve Bank of Chicago 22 nd Annual Economic Outlook Symposium. Automotive Outlook. Will Shearin December 5, 2008
 Federal Reserve Bank of Chicago 22 nd Annual Economic Outlook Symposium Automotive Outlook Will Shearin December 5, 2008 Ability to Buy Leading Indicators Nov 07 Nov 08 Disposable Income Green Red Household
Economic Update Birmingham Bloomfield Chamber
 Economic Update Birmingham Bloomfield Chamber Paul Traub Senior Business Economist Federal Reserve Bank of Chicago/Detroit Branch January 11, 2019 The views expressed here are our own and do not necessarily
North American Wholesale Lumber Association Winds of Change
 Alex Chausovsky Senior Consulting Advisor North American Wholesale Lumber Association Winds of Change 217 Forecast Results If you heard ITR around two years ago 2 Duration Accuracy US GDP 24 99.7% US Ind.
Houston Economic Outlook. Patrick Jankowski
 Houston Economic Outlook Patrick Jankowski Houston s Economic Drivers U.S. Economic Growth Global Trade Outlook for Energy U.S. Economic Growth 3 Gross Domestic Product Seasonally Adjusted Annual Growth
2016 Market Update. Gary Keller and Jay Papasan Keller Williams Realty, Inc.
 2016 Market Update Gary Keller and Jay Papasan Housing Market Cycles 1. Home Sales The Numbers That Drive U.S. 2. Home Price 3. Months Supply of Inventory 4. Mortgage Rates Real Estate 1. Home Sales Nationally
Automotive Outlook. William Strauss Senior Economist and Economic Advisor Federal Reserve Bank of Chicago
 Automotive Outlook Georgia State University Economic Forecasting Center Atlanta, GA August 23, 2017 William Strauss Senior Economist and Economic Advisor Federal Reserve Bank of Chicago Brief Macro Assessment
Houston Economic Outlook. Patrick Jankowski
 Houston Economic Outlook Patrick Jankowski www.houston.org Follow me on Twitter @pnjankowski May 22 10:30 a.m. Hilton Post Oak It s not Christmas but... 5 It s not Christmas but... Population Estimates
Houston Economic Overview Presented by Patrick Jankowski, SVP Research Greater Houston Partnership
 Houston Economic Overview Presented by Patrick Jankowski, SVP Research Greater Houston Partnership Order of the Day Order of the Day Rig count fell 80% Oil prices dropped 75% Energy layoffs spiked Office
Petroleum Equipment Institute. A Bend in the Road. Brian Beaulieu CEO. First in Forecasts Since 1948
 Petroleum Equipment Institute A Bend in the Road Brian Beaulieu CEO 217 Forecast Results If you heard ITR around two years ago 2 Duration Accuracy US GDP 24 99.7% US Ind. Prod. 24 96.8% Europe Ind. Prod.
The Role of the Federal Reserve Metropolitan Research Group UM-D
 The Role of the Federal Reserve Metropolitan Research Group UM-D Federal Reserve Bank of Chicago January 24, 2017 Paul Traub Senior Business Economist The Federal Reserve System 1 Functions of the Federal
For Every Action There is An Equal and Opposite Reaction Newton Was an Economist - The Outlook for Real Estate and the Economy
 For Every Action There is An Equal and Opposite Reaction Newton Was an Economist - The Outlook for Real Estate and the Economy Ted C. Jones, PhD Chief Economist Twitter #DrTCJ Mega Themes More Jobs Than
October Machinery Orders
 Japan's Economy 13 December 2017 (No. of pages: 6) October Machinery Orders Manufacturing industry shows strong growth trend Japanese report: 13 Dec 2017 Economic Research Dept. Kazuma Maeda Shunsuke Kobayashi
Cornbelt Economic Prospects for November 7, 2012 Decatur, IL. David Oppedahl Business Economist
 Cornbelt Economic Prospects for 2013 November 7, 2012 Decatur, IL David Oppedahl Business Economist 312-322-6122 david.oppedahl@chi.frb.org The economy hit bottom in June 2009, with hesitant growth since
Valve Manufacturers Association Navigating the Crest
 Valve Manufacturers Association Navigating the Crest Alex Chausovsky Senior Analyst 16 Forecast Results 2 Duration Accuracy US GDP 15 99.1% US Ind. Prod. 1 99.9% Eur Ind. Prod. 15 99.2% Canada Ind Prod
76 Million Boomers. 83 Million Millennials 19 to Million Millennials 16 to 35
 76 Million Boomers 83 Million Millennials 19 to 35 91 Million Millennials 16 to 35 Top Millennial Population Growth Markets 2005 to 2015 12-Month Population Job Rank City, State Growth Growth 1 Charlotte,
History May Not Repeat Itself, But it Certainly Does Rhyme* *Mark Twain. An Economic and Real Estate Forecast. Chief Economist, Stewart Title
 History May Not Repeat Itself, But it Certainly Does Rhyme* *Mark Twain An Economic and Real Estate Forecast November 5, 2010 Ted C. Jones, PhD Chief Economist, Stewart Title http://blog.stewart.com/ The
ECONOMIC OUTLOOK SECOND-LONGEST US EXPANSION IN HISTORY, CAN IT SET A RECORD?
 ECONOMIC OUTLOOK SECOND-LONGEST US EXPANSION IN HISTORY, CAN IT SET A RECORD? Augustine Faucher Chief Economist Florida School Finance Officers Association Hyatt Regency Jacksonville June 15, 2018 Gus
Real Estate Forecast 2017
 Real Estate Forecast 2017 Twitter @DrTCJ Non-Renewals - Dead on Arrival Mortgage Insurance Deductibility Residential Mortgage Debt Forgiveness Residential Energy Savings Renewables Wind and Solar ObamaCare
1Q17 RESULTS M AY / 2017
 RESULTS M AY / 2017 Positivo Tecnologia recorded a net revenue of R$453.5 million in, an increase of 20.7% Continuous progress in the diversification of the business, with mobile phones reaching 32.6%
Business Result for the Second Quarter ended September 30, 2017 Regional Market Environments and Projections
 Business Result for the Second Quarter ended September 3, 217 Regional Market Environments and Projections October 2, 217 Hitachi Construction Machinery Co., Ltd. Executive Vice President and Executive
Consensus Forecast for 2007 William Strauss
 Consensus Forecast for 2007 William Strauss Senior Economist and Economic Advisor Federal Reserve Bank of Chicago Winners of last year s Economic Outlook Symposium forecast Best Overall Economic Forecast:
Winds of Change. Alex Chausovsky Senior Consulting Advisor
 Winds of Change Alex Chausovsky Senior Consulting Advisor 217 Forecast Results If you heard ITR around two years ago 2 Duration Accuracy US GDP 24 99.7% US Ind. Prod. 24 96.8% Europe Ind. Prod. 27 99.9%
The Economic Outlook. Dr. George Mokrzan Director of Economics. November 9, 2017
 The Economic Outlook Dr. George Mokrzan Director of Economics November 9, 217 The Economic Outlook for the Nation The U.S. economy (real GDP) is forecasted to grow at a moderate pace of 2.3% in 218, close
DATA FOR DEVELOPMENT June 13, 2017
 DATA FOR DEVELOPMENT June 13, 2017 1 Recent economic developments and outlook 2 Data for development Malaysia s development and its data ecosystem o Data and the public sector- public service delivery
QUARTERLY FORECAST REPORT 1ST QUARTER
 QUARTERLY FORECAST REPORT 1ST QUARTER 216 77 Sundial Ave. Manchester, NH 313 E-mail: ptda@itreconomics.com Table of Contents Definitions & Methodology.... 3 MTI Total Sales... 4 Monthly Data Record...
Economic Performance and Outlook
 1/14/211 From Recovery to Expansion: How and When The U.S. and Washington Area Economic Performance and Outlook Stephen S. Fuller, PhD Dwight Sh Schar Faculty Chair and University it Professor Director,
Where Did Prosperity Go and How Do We Bring it Back?
 Where Did Prosperity Go and How Do We Bring it Back? by Lacy H. Hunt, Ph.D., Chief Economist Hoisington Investment Management Co. SIC 2016 May 24-27, 2016 6836 Bee Caves Road Building 2, Suite 100 Austin,
The Outlook for the U.S. Economy
 The Outlook for the U.S. Economy John V. Duca Associate Director of Research and Vice President Federal Reserve Bank of Dallas Danforth/Lewis Professor of Economics Oberlin College January 2018 The views
Kenya at the tipping Point?
 Kenya at the tipping Point? with a special focus on the ICT revolution and Mobile Money World Bank Economic Team Presentation by Jane Kiringai Nairobi December 2, 2010 Main messages 1 2 Kenya may now be
Is the U.S. Losing Its Manufacturing Base?
 Is the U.S. Losing Its Manufacturing Base? Rocky Mountain Economic Summit Afton, WY July 10, 2014 William Strauss Senior Economist and Economic Advisor Federal Reserve Bank of Chicago 2 The Setup Manufacturing
Risk Management in Monetary Policymaking
 EMBARGOED UNTIL TUESDAY, MARCH 5, 219, AT 7:35 A.M.; OR UPON DELIVERY Risk Management in Monetary Policymaking Eric S. Rosengren President & CEO Federal Reserve Bank of Boston National Association of Corporate
Statistical Release Gross Domestic Product First Quarter 2012
 Statistical Release Gross Domestic Product First Quarter 2012 1.0 Economic performance Provisional estimates for the first quarter of 2012 show that the economy exped by 3.5 per cent over a similar quarter
Asia Key Economic and Financial Indicators
 Quarterly Yearly Quarterly Quarterly Month-End Quarter-End Monthly (USD) Monthly Monthly Monthly Monthly Interest Daily GDP GDP per BoP CA IR External Debt Import Trade Unemployment IPI PPI CPI Rates*
Economic Update Michigan Actuarial Society
 Economic Update Michigan Actuarial Society Paul Traub Senior Business Economist Federal Reserve Bank of Chicago/Detroit Branch December 5, 2018 The views expressed here are our own and do not necessarily
Houston Economy Update. Patrick Jankowski
 Houston Economy Update Patrick Jankowski Worst is over 2 $ Per Barrel NYMEX WTI Spot Price 120 100 80 Avg. Last Week of Oct = $49/barrel 60 40 20 0 Jun '14 Dec '14 Jun '15 Dec '15 Jun '16 Dec '16 Source:
OUTLOOK FOR THE U.S. ECONOMY AND FINANCIAL MARKETS
 OUTLOOK FOR THE U.S. ECONOMY AND FINANCIAL MARKETS GIC/PCBE Luncheon Philadelphia February, A Presentation by: Martin H. Barnes Managing Editor The Bank Credit Analyst mbarnes@bcaresearch.com Sherbrooke
THE 2014 DISTRIBUTION INDUSTRY OUTLOOK
 Download handouts (PDF) : www.mdm.com/slides or info@mdm.com THE 2014 DISTRIBUTION INDUSTRY OUTLOOK Featuring: Andrew Duguay, Lindsay Konzak and Ranga Bodla January 16, 2014 Produced by: Event Sponsor:
Asia Key Economic and Financial Indicators
 ASEAN Brunei (BN) Cambodia (KH) Indonesia () Laos (LA) Malaysia () Myanmar (MM) Philippines () Singapore () Thailand () Vietnam () East Asia China (CN) Hong Kong (HK) Japan (JP) South Korea (KR) Taiw an
U.S. Oil & Gas Industry Chartbook
 U.S. Oil & Gas Industry Chartbook BBVA Research USA Houston, TX March 215 DISCLAIMER This document was prepared by Banco Bilbao Vizcaya (BBVA) BBVA Research U.S. on behalf of itself and its affiliated
Asia Key Economic and Financial Indicators
 ASEAN Brunei (BN) Cambodia (KH) Indonesia () Laos (LA) Malaysia () Myanmar (MM) Philippines () Singapore () Thailand () Vietnam () East Asia China (CN) Hong Kong (HK) Japan (JP) South Korea (KR) Taiw an
the 3-month period ended Jun.30,2011 July 28,
 Financial Highlights the 3-month period ended Jun.30,2011 (Fiscal 2011) July 28, 2011 http://www.hitachi-metals.co.jp E-Mail:hmir@hitachi-metals.co.jpco Performance Overview First Quarter of Fiscal 2011
Consolidated Financial Results for the Second Quarter, Fiscal 2018
 Consolidated Financial Results for the Second Quarter, Fiscal 2018 Ⅰ. Consolidated Financial Results for the First Half, Fiscal 2018 Consolidated Financial Results for Fiscal 2018 Ⅱ. Supplementary Data
Seattle (NWMLS Areas: 140, 380, 385, 390, 700, 701, 705, 710) Summary
 Summary") November, 2016 MTD MARKET UPDATE Data Current Through: November, 2016 (NWMLS Areas: 140, 380, 385, 390,, 701, 705, 710) Summary 4,000 3,500 3,000 2,500 2,000 1,500 1,000 500 0 Active, Pending, & Months
November, 2016 MTD MARKET UPDATE Data Current Through: November, 2016 (NWMLS Areas: 140, 380, 385, 390,, 701, 705, 710) Summary 4,000 3,500 3,000 2,500 2,000 1,500 1,000 500 0 Active, Pending, & Months
Prentice Hall: Economics Principles in Action 2005 Correlated to: Kansas Social Studies Standards (High School)
") Prentice Hall: Economics Principles in Action 2005 Kansas Social Studies Standards (High School) High School Economics Standard: The student uses a working knowledge and understanding of major economic
Prentice Hall: Economics Principles in Action 2005 Kansas Social Studies Standards (High School) High School Economics Standard: The student uses a working knowledge and understanding of major economic
TCL International Holdings Limited FY2000 Review & Outlook
 TCL International Holdings Limited FY2000 Review & Outlook Mr. Vincent Yan, Executive Director March 2001 Agenda Company Background FY2000 Overview PRC Economic Outlook Home Appliances IT Business Corporate
All King County Summary Report
 September, 2016 MTD MARKET UPDATE Data Current Through: September, 2016 18,000 16,000 14,000 12,000 10,000 8,000 6,000 4,000 2,000 0 Active, Pending, & Months Supply of Inventory 15,438 14,537 6.6 6.7
Ted C. Jones, PhD Chief Economist
 Ted C. Jones, PhD Chief Economist Hurricanes U.S. Jobs Jobs (Millions) Seasonally Adjusted 150 145 140 135 130 1.41% Prior 12 Months 2.05 Million Net New Jobs in Past 12-Months 125 '07 '08 '09 '10 '11
Why Japan? Masashi Nakazono JETRO Genève. Prepared for Handelskammer beider Basel & JETRO seminar on 4 Nov 2016
 Why Japan? Masashi Nakazono JETRO Genève Prepared for Handelskammer beider Basel & JETRO seminar on 4 Nov 2016 Copyright (C) 2016 JETRO. All rights reserved. Who are we? Japan External Trade Organization
Appendices Charts & Tables
 Financial Crisis Inquiry Commission Hearing September 8, 2010 Las Vegas, NV Appendices Charts & Tables Financial Crisis Inquiry Commission 1 Selected National Comparisons Financial Crisis Inquiry Commission
Economics: Principles in Action 2005 Correlated to: Indiana Family and Consumer Sciences Education, Consumer Economics (High School, Grades 9-12)
") Indiana Family and Consumer Sciences Education, Consumer Economics Consumer Economics 1.0 PROCESSES: Explain, demonstrate, and integrate processes of thinking, communication, leadership, and management
Indiana Family and Consumer Sciences Education, Consumer Economics Consumer Economics 1.0 PROCESSES: Explain, demonstrate, and integrate processes of thinking, communication, leadership, and management
Seattle (NWMLS Areas: 140, 380, 385, 390, 700, 701, 705, 710) Summary
 Summary") September, 2016 MTD MARKET UPDATE Data Current Through: September, 2016 (NWMLS Areas: 140, 380, 385, 390,, 701, 705, 710) Summary Active, Pending, & Months Supply of Inventory 5,000 4,500 4,000 3,500 4,091
September, 2016 MTD MARKET UPDATE Data Current Through: September, 2016 (NWMLS Areas: 140, 380, 385, 390,, 701, 705, 710) Summary Active, Pending, & Months Supply of Inventory 5,000 4,500 4,000 3,500 4,091
Seattle (NWMLS Areas: 140, 380, 385, 390, 700, 701, 705, 710) Summary
 Summary") October, 2016 MTD MARKET UPDATE Data Current Through: October, 2016 (NWMLS Areas: 140, 380, 385, 390,, 701, 705, 710) Summary Active, Pending, & Months Supply of Inventory 4,500 4,000 3,500 4,197 4,128
October, 2016 MTD MARKET UPDATE Data Current Through: October, 2016 (NWMLS Areas: 140, 380, 385, 390,, 701, 705, 710) Summary Active, Pending, & Months Supply of Inventory 4,500 4,000 3,500 4,197 4,128
UBS Global Technology and Services Conference New York City. Craig DeYoung VP, Investor Relations & Corporate Communications
 UBS Global Technology and Services Conference New York City Craig DeYoung VP, Investor Relations & Corporate Communications June 9, 2009 / Slide 1 Safe Harbor "Safe Harbor" Statement under the US Private
Q Results. Emirates Integrated Telecommunications Company PJSC May 2014
 Q1 214 Results Emirates Integrated Telecommunications Company PJSC May 214 Disclaimer Emirates Integrated Telecommunications Company PJSC (hereafter du ) is a telecommunication services provider in the
No Place But Up Interest Rates Rents, Prices Real Estate and the Economy
 No Place But Up Interest Rates Rents, Prices Real Estate and the Economy But Not Oil Ted C. Jones, PhD Chief Economist Stewart Title Guaranty Company Mega Themes More Jobs Than Ever in History Retail Boom
Ted C. Jones Chief Economist. Ted C. Jones, PhD Chief Economist
 Ted C. Jones Chief Economist Ted C. Jones, PhD Chief Economist When Getting On An Airplane, the Person On the Aisle Always Gets There First Things Change Jobs are Everything Period U.S. Jobs Jobs (Millions)
Oil Prices Outlook 2Q18
 2Q18 June, 218 United States Key Messages 1. The geopolitical premium marked the evolution of oil prices in 2Q18 2. OPEC may decide to boost production to compensate the shortfall left by Iran and Venezuela
App Economy Market analysis for Economic Development
 App Economy Market analysis for Economic Development Mustapha Hamza, ISET Com Director mustapha.hamza@isetcom.tn ITU Arab Forum on Future Networks: "Broadband Networks in the Era of App Economy", Tunis
Investor Presentation. June 2018
 Investor Presentation June 2018 Safe Harbor Statement Safe Harbor Statement Windstream Holdings, Inc. claims the protection of the safe-harbor for forward-looking statements contained in the Private Securities
Safaricom Ltd FY 2011 Results Announcement 18 th May 2011
 Safaricom Ltd FY 2011 Results Announcement 18 th May 2011 2 Company Strategy Growth towards Total Communications Maintain market leadership in subscriber & revenue market share Grow all Revenue streams
PRESS RELEASE January 16, 2009 Sony Ericsson reports results for fourth quarter and full year 2008
 PRESS RELEASE January 16, 2009 Sony Ericsson reports results for fourth quarter and full year 2008 Highlights: Global economic slowdown leads to contracting consumer demand Previously announced annual
IMPLICATIONS AND OPPORTUNITIES OF THE REIT MODERNIZATION ACT
 IMPLICATIONS AND OPPORTUNITIES OF THE REIT MODERNIZATION ACT INTRODUCTION Congress created REITs in 1960 to allow people to invest in diversified, professionally managed real estate enterprises, but over
COUNTRY PROFILE. Estonia
 COUNTRY PROFILE Estonia Statistical tables Factor I: Economic Performance WORLD COMPETITIVENESS RANKING 2018 All data are available from the World Competitiveness Online. Visit our eshop 1 COMPETITIVENESS
PRESS RELEASE October 17, 2008
 PRESS RELEASE October 17, 2008 Sony Ericsson reports third quarter results Q3 highlights: Break even results, excluding restructuring charges, as challenging business conditions continued C902 Cyber-shot
Kazakhstan: Balance of Payments and External Debt. for the first quarter of 2017
 Kazakhstan: Balance of Payments and External Debt for the first quarter of 2017 August 2017 This publication was prepared by the Balance of Payments and Currency Regulation Department. It reflects the
Telecom Sector Outlook and Spectrum Trading: the Case of Pakistan
 Telecom Sector Outlook and Spectrum Trading: the Case of Pakistan Shahbaz Nasir Pakistan Telecommunication Authority ITU Workshop on Economic Aspects of Spectrum Management 21 st 23 rd November 2016 Tehran
GREEN BUILDINGS MARKET INTELLIGENCE GHANA COUNTRY PROFILE
 GREEN BUILDINGS MARKET INTELLIGENCE GHANA COUNTRY PROFILE 60 40 20 - MARKET GROWTH GHANA: COUNTRY SUMMARY Building Stock (million m2) Residential Office & Retail Other Commercial % new green buildings
Sony Ericsson sells over 100 million handsets in 2007
 PRESS RELEASE January 16, 2008 Sony Ericsson sells over 100 million handsets in 2007 Q4 Highlights: 2007 Highlights: 18% increase in volume year-on-year Continued market share gains and profitable growth
Vertical Market Trends: Western Europe, (Executive Summary) Executive Summary
 Executive Summary") Vertical Market Trends: Western Europe, (Executive Summary) Executive Summary Publication Date: 21 March 2003 Authors Cathy Tornbohm Peter Redshaw This document has been published to the following Marketplace
Vertical Market Trends: Western Europe, (Executive Summary) Executive Summary Publication Date: 21 March 2003 Authors Cathy Tornbohm Peter Redshaw This document has been published to the following Marketplace
Telefônica Brasil S.A Results 1Q12
 05.10.2012 Results 1Q12 Disclaimer For comparative purposes, the 1Q11 figures were prepared on a combined basis. Thus, the annual variations presented may differ from those reported in the financial statement
CRE investment weakens in Q as investors struggle to find product in prime markets
 2006.3 2007.1 2007.3 2008.1 2008.3 2009.1 2009.3 2010.1 2010.3 2011.1 2011.3 2012.1 2012.3 2013.1 2013.3 2014.1 2014.3 2015.1 2015.3 2016.1 Europe Capital Markets, Q1 2016 CRE investment weakens in Q1
COUNTRY PROFILE. Qatar
 COUNTRY PROFILE Qatar Statistical tables Factor I: Economic Performance WORLD COMPETITIVENESS RANKING 2018 All data are available from the World Competitiveness Online. Visit our eshop 1 COMPETITIVENESS
ISE Cyber Security UCITS Index (HUR)
") ISE Cyber Security UCITS Index (HUR) Why Cybersecurity is important Data breaches have become almost commonplace in the last few years Cybersecurity focuses on protecting computers, networks, programs,
ISE Cyber Security UCITS Index (HUR) Why Cybersecurity is important Data breaches have become almost commonplace in the last few years Cybersecurity focuses on protecting computers, networks, programs,