Intro to Segmentation Fault Handling in Linux. By Khanh Ngo-Duy
|
|
|
- Martha Skinner
- 6 years ago
- Views:
Transcription
1 Intro to Segmentation Fault Handling in Linux By Khanh Ngo-Duy
2 Seminar What is Segmentation Fault (Segfault) Examples and Screenshots Tips to get Segfault information
3 What is Segmentation Fault? Segmentation Fault (Segfault) or access violation is a particular error condition that can occur during the operation of computer software A Segfault occurs when a program attempts to access a memory location that is not allowed to access, or attempts to access a memory location in a way that is not allowed Write to a read-only location To overwrite part of the operating system or protected memory locations Access to invalid memory location. e.g : memorry address NULL, etc...
4 Examples and Screenshots (1 of 3) Write to Read-Only memory address
")
5 Examples and Screenshots (2 of 3) Write to Invalid memory address (NULL = 0x00)
6 Examples and Screenshots (3 of 3) Stack overflow
7 Tips to get Segfault information (1 of 7) Generally, when Segfault occurs, very less information is provided (see previous slides) Very hard to debug

8 Tips to get Segfault information (2 of 7) Use dmesg to show information that saved by the Kernel when any application crashes Last Segfault information
9 Tips to get Segfault information (3 of 7) How to read dmesg outputs? Application name Address caused fault Other values??? I DON'T KNOW... Stack Pointer address S eg fa ult[19960]: s eg fa ult a t 7fffff7feff8 ip s p 7fffff7ff000 erro r 6 in S eg fa ult[ ] Reason it crashed Instruction Pointer address Additional error code
10 Tips to get Segfault information (4 of 7) Add -g when compiling the source code. The compiler will add debugging symbols into the binary Will provide more useful information when debugging with gdb Compiled binary size will be largers (debugging symbols are added) Application runs slower, takes more RAM Maybe, some other drawbacks
11 Tips to get Segfault information (5 of 7) Add -g when compiling the source code. The compiler will add debugging symbols into the binary Will provide more useful information when debugging with gdb Without -g, gcc still adds some minimal debugging information Compiled binary size will be largers (debugging symbols are added) Application runs slower, takes more RAM Maybe, some other drawbacks

12 Tips to get Segfault information (6 of 7) Use nm to view the symbols in the binary file Address of symbol, symbol type, symbol name can be listed Give us chance to know the Segfault occurred with what symbol $man nm for more information on the usage

13 Tips to get Segfault information (7 of 7) Use ldd to view the shared library dependencies Show shared library name, starting address of library We know Segfault occurred in our application or in shared library $man ldd for more information how to use ldd
14 Using gdb The GNU Debugger Core dump file and gdb objdump
15 Using gdb The GNU Debugger (1 of 6) gdb supports: Starting programs, attaching to running programs or debugging crashed programs Debugging locally or remotely (via gdbserver) Setting breakpoints and watchpoints Examining variables, registers and call stack Changing data and calling functions Automating debug tasks Multi threaded programs
16 Using gdb The GNU Debugger (2 of 6) In order to effectively debug program, add -g when compiling with gcc Load a program into gdb: $gdb program Once you are in gdb, you can run the program (gdb)run [parameters to program] To stop program, press Ctrl+C To quit gdb, execute command q
 Step 3: Quit")
17 Using gdb The GNU Debugger (3 of 6) Step 1: Load the program into gdb Step 2: execute the program gdb detects Segfault but very less info (-g is not add when compiling) Step 3: Quit from gdb
, file: Segfault.")
18 Using gdb The GNU Debugger (4 of 6) add -g when compile Step 1: Load Step 2: Run gdb detects Segfault, shows the lines which caused Segfault Line 6, in main(), file: Segfault.c Step 3: Quit from gdb
19 Using gdb The GNU Debugger (5 of 6) Is this useful and easy? YES!!! But why? Because of -g we can see the file name, function name and line number Because of the source code is available can see the exactly line of code If there is no source code we can see the filename, function name, line number but NOT contents of the line cause Segfault No problem, still GOOD! :-) Because this situation is simple, sometime you can NOT use this technique! See next...
20 Using gdb The GNU Debugger (6 of 6) This technique can O N LY be used when: You know for sure, Segfault will occur Only when testing. When in production time, you can NOT gdb causes many side effects: slow down the running, running is not stable etc Even when testing, if application is so Big or threads, many resources) Complicated (many gdb can not handle To be able to debug when your application is in production mode and not able to reduce the Segfault? See the next techniques...
21 core dump file and gdb (1 of 5) A core dump consists of the recorded state of the working memory of a computer program at a specific time, generally when the program has terminated abnormally (crashed) Core dump file might contain: processor registers, which may include the program counter and stack pointer, memory management information, and other processor and operating system flags and information Core dumps are disabled by default on some Linux distributions To force the core dump generation, you can using command line $ulimit -c <limit size of core file> To force the core dump generation, you can also insert code to your application to request generating the core dump when it crashes To disable the core dump just set <limit size of core file> to 0

22 core dump file and gdb (2 of 5) Enable core dump, limit to 1024 MB, just once core file is generated when app crashes It is here!
23 core dump file and gdb (3 of 5) Once you have core dump, what to do? Just load it into gdb and see $gdb <application name> <core file name>

24 core dump file and gdb (4 of 5) Load the application and core file gdb reads core file and shows the results as if the Application has just run and crashed, actually core dump just shows the actual HISTORY
25 core dump file and gdb (5 of 5) Is this better than the previous technique? Yes, because I could not reproduce the Segfault, however, core file shows me Though it is good, still some disadvantages Core file may grow very large if your application uses much memory, so sometime you simply can not use this method In case of complicated application, there might be some side effects when forcing core dump your application might run unstable What I read till now, just s ide effec ts. Is there any else? I don't want to risk the production system! YES. There is, see the last techniques...
26 objdump (1 of 9) Advantages No need to add -g do not affect the memory and reduce the size of binary file No need to generating core dump no side effects, do not take disk space Actually, you do not need to do anything, what will come will come, and you will solve it! Disadvantages? You need a little knowledge about assembly language :-) don't be scare, still easy! If adding optimization flag to gcc (-O, -O2, -O3) it will be a little hard you to read assembly code later
27 objdump (2 of 9) First of all, what you need is the output of dmesg (very first slide told you). Note the Address caused fault and Instruction pointer address Use the tool named objdump to generate information from your application Output of objdump should be redirected to a file, we need this file later! $objdump -DCl <application name> > <output file>
")
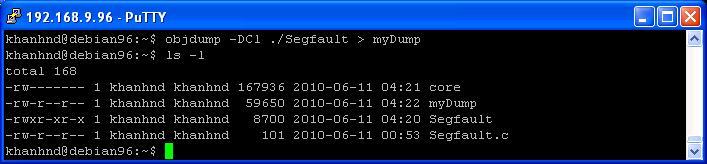
28 objdump (3 of 9)
29 objdump (4 of 9) OK, so my fault address is 0x40058c and instruction pointer is 0x40048c mydump contains the assembly code of my app Now I will see at what line of code, my app crashed just find where is 0x40048c in mydump $grep -n -A 100 -B c./myDump What it does it just find the line having 40048c in./mydump, and also show 100 more lines after the found line, and 100 lines before the found line. You can customize the grep command as you want ;)
30 objdump (5 of 9) Step 1: Find instruction pointer address Step 3: Look above to see the code that caused segfault in what function? Here it is in main() Step 2: Found, This caused segfault
31 objdump (6 of 9) Now you know the code that cause Segfault in assembly. What to do is open your source code (in C, C++ ) to see the appropriate line of code corresponding to that Assembly code, you will figure out what caused Segfault :-)
")

32 objdump (7 of 9) 0x48 = 'H'
33 objdump (8 of 9) You are done now! Bravo!!! Just with Instruction Pointer, you know where caused Segfault exactly How about the Address caused fault (0x40058c), we have not used it, haven't we? No we don't. BUT, till now I can say the line caused Segfault is * s = 'H '; And, the address of variable s at that time is 0x40058c Meaningless to know this? NO! There is sometime you will need it to know the root cause, see the next slide

34 objdump (9 of 9) Sometimes, the Address caused fault tell you the root cause. See the following example, we can say that, value of s is N U L L
35 Thanks for watching If you see it useful clap your hands :-)
Exercise Session 6 Computer Architecture and Systems Programming
 Systems Group Department of Computer Science ETH Zürich Exercise Session 6 Computer Architecture and Systems Programming Herbstsemester 2016 Agenda GDB Outlook on assignment 6 GDB The GNU Debugger 3 Debugging..
Debugging uclinux on Coldfire
 Debugging uclinux on Coldfire By David Braendler davidb@emsea-systems.com What is uclinux? uclinux is a version of Linux for CPUs without virtual memory or an MMU (Memory Management Unit) and is typically
CSE 374 Programming Concepts & Tools. Brandon Myers Winter 2015 Lecture 11 gdb and Debugging (Thanks to Hal Perkins)
") CSE 374 Programming Concepts & Tools Brandon Myers Winter 2015 Lecture 11 gdb and Debugging (Thanks to Hal Perkins) Hacker tool of the week (tags) Problem: I want to find the definition of a function or
CSE 374 Programming Concepts & Tools Brandon Myers Winter 2015 Lecture 11 gdb and Debugging (Thanks to Hal Perkins) Hacker tool of the week (tags) Problem: I want to find the definition of a function or
CS354 gdb Tutorial Written by Chris Feilbach
 CS354 gdb Tutorial Written by Chris Feilbach Purpose This tutorial aims to show you the basics of using gdb to debug C programs. gdb is the GNU debugger, and is provided on systems that
Scientific Programming in C IX. Debugging
 Scientific Programming in C IX. Debugging Susi Lehtola 13 November 2012 Debugging Quite often you spend an hour to write a code, and then two hours debugging why it doesn t work properly. Scientific Programming
Source level debugging. October 18, 2016
 Source level debugging October 18, 2016 Source level debugging Source debugging is a nice tool for debugging execution problems; it can be particularly useful when working with crashed programs that leave
Welcome. HRSK Practical on Debugging, Zellescher Weg 12 Willers-Bau A106 Tel
 Center for Information Services and High Performance Computing (ZIH) Welcome HRSK Practical on Debugging, 03.04.2009 Zellescher Weg 12 Willers-Bau A106 Tel. +49 351-463 - 31945 Matthias Lieber (matthias.lieber@tu-dresden.de)
CSE 374 Programming Concepts & Tools
 CSE 374 Programming Concepts & Tools Hal Perkins Fall 2017 Lecture 11 gdb and Debugging 1 Administrivia HW4 out now, due next Thursday, Oct. 26, 11 pm: C code and libraries. Some tools: gdb (debugger)
Debugging. ICS312 Machine-Level and Systems Programming. Henri Casanova
 Debugging ICS312 Machine-Level and Systems Programming Henri Casanova (henric@hawaii.edu) Debugging Even when written in high-level languages, programs have bugs Recall the thought that when moving away
ECE/ME/EMA/CS 759 High Performance Computing for Engineering Applications
 ECE/ME/EMA/CS 759 High Performance Computing for Engineering Applications Elements of Program Debugging Dan Negrut, 2017 ECE/ME/EMA/CS 759 UW-Madison Debugging on Euler [with gdb] Slides on gdb include
Lab 8. Follow along with your TA as they demo GDB. Make sure you understand all of the commands, how and when to use them.
 Lab 8 Each lab will begin with a recap of last lab and a brief demonstration by the TAs for the core concepts examined in this lab. As such, this document will not serve to tell you everything the TAs
18-600: Recitation #3
 18-600: Recitation #3 Bomb Lab & GDB Overview September 12th, 2017 1 Today X86-64 Overview Bomb Lab Introduction GDB Tutorial 2 3 x86-64: Register Conventions Arguments passed in registers: %rdi, %rsi,
Program Design: Using the Debugger
 rogram Design, February 2, 2004 1 Program Design: Using the Debugger A debugger is an alternative to putting print (printf in C) statements in your program, recompiling and trying to find out what values
Reviewing gcc, make, gdb, and Linux Editors 1
 Reviewing gcc, make, gdb, and Linux Editors 1 Colin Gordon csgordon@cs.washington.edu University of Washington CSE333 Section 1, 3/31/11 1 Lots of material borrowed from 351/303 slides Colin Gordon (University
GDB Tutorial. A Walkthrough with Examples. CMSC Spring Last modified March 22, GDB Tutorial
 A Walkthrough with Examples CMSC 212 - Spring 2009 Last modified March 22, 2009 What is gdb? GNU Debugger A debugger for several languages, including C and C++ It allows you to inspect what the program
Efficient and Large Scale Program Flow Tracing in Linux. Alexander Shishkin, Intel
 Efficient and Large Scale Program Flow Tracing in Linux Alexander Shishkin, Intel 16.09.2013 Overview Program flow tracing - What is it? - What is it good for? Intel Processor Trace - Features / capabilities
Jackson State University Department of Computer Science CSC / Advanced Information Security Spring 2013 Lab Project # 5
 Jackson State University Department of Computer Science CSC 439-01/539-02 Advanced Information Security Spring 2013 Lab Project # 5 Use of GNU Debugger (GDB) for Reverse Engineering of C Programs in a
CNIT 127: Exploit Development. Ch 2: Stack Overflows in Linux
 CNIT 127: Exploit Development Ch 2: Stack Overflows in Linux Stack-based Buffer Overflows Most popular and best understood exploitation method Aleph One's "Smashing the Stack for Fun and Profit" (1996)
Using the Debugger. Michael Jantz Dr. Prasad Kulkarni
 Using the Debugger Michael Jantz Dr. Prasad Kulkarni 1 Debugger What is it a powerful tool that supports examination of your program during execution. Idea behind debugging programs. Creates additional
The Dynamic Debugger gdb
 Introduction The Dynamic Debugger gdb This handout introduces the basics of using gdb, a very powerful dynamic debugging tool. No-one always writes programs that execute perfectly every time, and while
Using gdb to find the point of failure
 gdb gdb is the GNU debugger on our CS machines. gdb is most effective when it is debugging a program that has debugging symbols linked in to it. With gcc and g++, this is accomplished using the -g option,
Lab 2: Buffer Overflows
 Department of Computer Science: Cyber Security Practice Lab 2: Buffer Overflows Introduction In this lab, you will learn how buffer overflows and other memory vulnerabilities are used to takeover vulnerable
Tech Note 726 Capturing a Memory Dump File Using the Microsoft Debug Diagnostic Tool (32bit)
") Tech Note 726 Capturing a Memory Dump File Using the Microsoft Debug Diagnostic Tool (32bit) All Tech Notes, Tech Alerts and KBCD documents and software are provided "as is" without warranty of any kind.
Tech Note 726 Capturing a Memory Dump File Using the Microsoft Debug Diagnostic Tool (32bit) All Tech Notes, Tech Alerts and KBCD documents and software are provided "as is" without warranty of any kind.
Introduction to Linux (Part II) BUPT/QMUL 2018/03/21
 BUPT/QMUL 2018/03/21") Introduction to Linux (Part II) BUPT/QMUL 2018/03/21 Contents 10. vi 11. Other commands 12. Developing tools 2 10. Editor - vi Text editor Insert mode Override mode Use sub-commands Tradition tools and
Introduction to Linux (Part II) BUPT/QMUL 2018/03/21 Contents 10. vi 11. Other commands 12. Developing tools 2 10. Editor - vi Text editor Insert mode Override mode Use sub-commands Tradition tools and
Checkpointing using DMTCP, Condor, Matlab and FReD
 Checkpointing using DMTCP, Condor, Matlab and FReD Gene Cooperman (presenting) High Performance Computing Laboratory College of Computer and Information Science Northeastern University, Boston gene@ccs.neu.edu
Recitation #12 Malloc Lab - Part 2. November 14th, 2017
 18-600 Recitation #12 Malloc Lab - Part 2 November 14th, 2017 1 2 REMINDER Malloc Lab checkpoint is due on 11/17 This is Friday (instead of the usual Thursday deadline) No late days available Final submission
Using a debugger. Segmentation fault? GDB to the rescue!
 Using a debugger Segmentation fault? GDB to the rescue! But first... Let's talk about the quiz Let's talk about the previous homework assignment Let's talk about the current homework assignment K findkey(v
CSCI0330 Intro Computer Systems Doeppner. Lab 02 - Tools Lab. Due: Sunday, September 23, 2018 at 6:00 PM. 1 Introduction 0.
 CSCI0330 Intro Computer Systems Doeppner Lab 02 - Tools Lab Due: Sunday, September 23, 2018 at 6:00 PM 1 Introduction 0 2 Assignment 0 3 gdb 1 3.1 Setting a Breakpoint 2 3.2 Setting a Watchpoint on Local
U Reverse Engineering
 U23 2016 - Reverse Engineering Andy andy@koeln.ccc.de November 15, 2016 Introduction Static program analysis Dynamic program analysis Tools strings objdump IDA Hopper gdb Live Reversing Exercises Section
Your code must have been compiled with the -g compiler option. Example:
 ddd Tips This provides some helpful information about the Unix ddd debugger. with more detailed information: There are other resources available gnu ddd manual matloff ddd information Contents Prerequisites...
Introduction to debugging. Martin Čuma Center for High Performance Computing University of Utah
 Introduction to debugging Martin Čuma Center for High Performance Computing University of Utah m.cuma@utah.edu Overview Program errors Simple debugging Graphical debugging DDT and Totalview Intel tools
SGI Altix Getting Correct Code Reiner Vogelsang SGI GmbH
 SGI Altix Getting Correct Code Reiner Vogelsang SGI GmbH reiner@sgi.com Module Objectives After completing the module, you will able to Find caveats and hidden errors in application codes Handle debuggers
Improving Linux development with better tools
 Improving Linux development with better tools Andi Kleen Oct 2013 Intel Corporation ak@linux.intel.com Linux complexity growing Source lines in Linux kernel All source code 16.5 16 15.5 M-LOC 15 14.5 14
When you add a number to a pointer, that number is added, but first it is multiplied by the sizeof the type the pointer points to.
 Refresher When you add a number to a pointer, that number is added, but first it is multiplied by the sizeof the type the pointer points to. i.e. char *ptr1 = malloc(1); ptr1 + 1; // adds 1 to pointer
Data and File Structures Laboratory
 Tools: GDB, Valgrind Assistant Professor Machine Intelligence Unit Indian Statistical Institute, Kolkata August, 2018 1 GDB 2 Valgrind A programmer s experience Case I int x = 10, y = 25; x = x++ + y++;
Debugging and Profiling
 Debugging and Profiling Dr. Axel Kohlmeyer Senior Scientific Computing Expert Information and Telecommunication Section The Abdus Salam International Centre for Theoretical Physics http://sites.google.com/site/akohlmey/
Project 1 Notes and Demo
 Project 1 Notes and Demo Overview You ll be given the source code for 7 short buggy programs (target[1-7].c). These programs will be installed with setuid root Your job is to write exploits (sploit[1-7].c)
CS168: Debugging. Introduc)on to GDB, Wireshark and Valgrind. CS168 - Debugging Helpsession
on to GDB, Wireshark and Valgrind. CS168 - Debugging Helpsession") CS168: Debugging Introduc)on to GDB, Wireshark and Valgrind GDB: The GNU Debugger gdb is an executable file that serves as a portable debugger Works for Ada, C, C++, Objec)ve- C, Pascal, and others Useful
CS168: Debugging Introduc)on to GDB, Wireshark and Valgrind GDB: The GNU Debugger gdb is an executable file that serves as a portable debugger Works for Ada, C, C++, Objec)ve- C, Pascal, and others Useful
CSE 351. GDB Introduction
 CSE 351 GDB Introduction Lab 2 Out either tonight or tomorrow Due April 27 th (you have ~12 days) Reading and understanding x86_64 assembly Debugging and disassembling programs Today: General debugging
CS356: Discussion #5 Debugging with GDB. Marco Paolieri
 CS356: Discussion #5 Debugging with GDB Marco Paolieri (paolieri@usc.edu) Schedule: Exams and Assignments Week 1: Binary Representation HW0. Week 2: Integer Operations Week 3: Floating-Point Operations
Homework 1 CS 642: Information Security
 Homework 1 CS 642: Information Security September 22, 2012 This homework assignment tasks you with understanding vulnerabilities in five target programs. You may (optionally) work with a partner. It is
MSRPC Heap Overflow Part II
 MSRPC Heap Overflow Part II Dave Aitel So a new approach is needed. As with any heap overflow, you get to chose a where and a what value, subject to certain constraints. If you chose a what value that
CSE 410: Systems Programming
 CSE 410: Systems Programming Recitation 4: Introduction to gdb Introduction The GNU Debugger, or gdb, is a powerful symbolic debugger. Symbolic debuggers are available for many languages and platforms,
Systems software design. Software build configurations; Debugging, profiling & Quality Assurance tools
 Systems software design Software build configurations; Debugging, profiling & Quality Assurance tools Who are we? Krzysztof Kąkol Software Developer Jarosław Świniarski Software Developer Presentation
CS 11 C track: lecture 6
 CS 11 C track: lecture 6 Last week: pointer arithmetic This week: The gdb program struct typedef linked lists gdb for debugging (1) gdb: the Gnu DeBugger http://courses.cms.caltech.edu/cs11/material /c/mike/misc/gdb.html
PathFinder-XD for MIPS Powered Devices. Simulator
 v.1.0.6, 15 th January 2013 PathFinder-XD for MIPS Powered Devices Simulator Contents 1. Introduction 2 2. Installation 2 2.1 Windows Installation 2 2.2 Linux Installation 2 3. Using PathFinder-XD with
ECS 153 Discussion Section. April 6, 2015
 ECS 153 Discussion Section April 6, 2015 1 What We ll Cover Goal: To discuss buffer overflows in detail Stack- based buffer overflows Smashing the stack : execution from the stack ARC (or return- to- libc)
CMPSC 311- Introduction to Systems Programming Module: Debugging
 CMPSC 311- Introduction to Systems Programming Module: Debugging Professor Patrick McDaniel Fall 2016 Debugging Often the most complicated and time-consuming part of developing a program is debugging.
Simple C Program. Assembly Ouput. Using GCC to produce Assembly. Assembly produced by GCC is easy to recognize:
 Simple C Program Helloworld.c Programming and Debugging Assembly under Linux slides by Alexandre Denault int main(int argc, char *argv[]) { } printf("hello World"); Programming and Debugging Assembly under
Programming Tips for CS758/858
 Programming Tips for CS758/858 January 28, 2016 1 Introduction The programming assignments for CS758/858 will all be done in C. If you are not very familiar with the C programming language we recommend
CMPSC 311- Introduction to Systems Programming Module: Debugging
 CMPSC 311- Introduction to Systems Programming Module: Debugging Professor Patrick McDaniel Fall 2014 Debugging Often the most complicated and time-consuming part of developing a program is debugging.
Shellbased Wargaming
 Shellbased Wargaming Abstract Wargaming is a hands-on way to learn about computer security and common programming mistakes. This document is intended for readers new to the subject and who are interested
int32_t Buffer[BUFFSZ] = {-1, -1, -1, 1, -1, 1, 2, 4, 8, 16, 32, 64, 128, 256, 512, -1, -1, -1, -1, -1}; int32_t* A = &Buffer[5];
![int32_t Buffer[BUFFSZ] = {-1, -1, -1, 1, -1, 1, 2, 4, 8, 16, 32, 64, 128, 256, 512, -1, -1, -1, -1, -1}; int32_t* A = &Buffer[5];](/thumbs/75/72537717.jpg "int32_t Buffer[BUFFSZ] = {-1, -1, -1, 1, -1, 1, 2, 4, 8, 16, 32, 64, 128, 256, 512, -1, -1, -1, -1, -1}; int32_t* A = &Buffer[5];") This assignment refers to concepts discussed in the course notes on gdb and the book The Art of Debugging by Matloff & Salzman. The questions are definitely "hands-on" and will require some reading beyond
This assignment refers to concepts discussed in the course notes on gdb and the book The Art of Debugging by Matloff & Salzman. The questions are definitely "hands-on" and will require some reading beyond
Lab 03 - x86-64: atoi
 CSCI0330 Intro Computer Systems Doeppner Lab 03 - x86-64: atoi Due: October 1, 2017 at 4pm 1 Introduction 1 2 Assignment 1 2.1 Algorithm 2 3 Assembling and Testing 3 3.1 A Text Editor, Makefile, and gdb
Debugging with gdb and valgrind
 Debugging with gdb and valgrind Dr. Axel Kohlmeyer Associate Dean for Scientific Computing, CST Associate Director, Institute for Computational Science Assistant Vice President for High-Performance Computing
gdbtui - Linux Command
 tui tui - Linux Command -batch -cd= dir -f -b bps -tty= dev -s sym -e prog -se prog -c core cmds -d dir prog core procid]] SYNOPSIS -help-nx-q DESCRIPTION The purpose of a debugger such as GDB is to allow
Section 1: Tools. Contents CS162. January 19, Make More details about Make Git Commands to know... 3
 CS162 January 19, 2017 Contents 1 Make 2 1.1 More details about Make.................................... 2 2 Git 3 2.1 Commands to know....................................... 3 3 GDB: The GNU Debugger
Introduction p. 1 Why Linux? p. 2 Embedded Linux Today p. 3 Open Source and the GPL p. 3 Free Versus Freedom p. 4 Standards and Relevant Bodies p.
 Foreword p. xix Preface p. xxi Acknowledgments p. xxvii About the Author p. xxix Introduction p. 1 Why Linux? p. 2 Embedded Linux Today p. 3 Open Source and the GPL p. 3 Free Versus Freedom p. 4 Standards
Compilation, Disassembly, and Profiling (in Linux)
") Compilation, Disassembly, and Profiling (in Linux) CS 485: Systems Programming Spring 2016 Instructor: Neil Moore 1 Turning C into Object Code Code in files p1.c p2.c Compile with command: gcc O1 p1.c
Compilation, Disassembly, and Profiling (in Linux) CS 485: Systems Programming Spring 2016 Instructor: Neil Moore 1 Turning C into Object Code Code in files p1.c p2.c Compile with command: gcc O1 p1.c
Debug for GDB Users. Action Description Debug GDB $debug <program> <args> >create <program> <args>
 Page 1 of 5 Debug for GDB Users Basic Control To be useful, a debugger must be capable of basic process control. This functionally allows the user to create a debugging session and instruct the process
Exploring the file system. Johan Montelius HT2016
 1 Introduction Exploring the file system Johan Montelius HT2016 This is a quite easy exercise but you will learn a lot about how files are represented. We will not look to the actual content of the files
Short Introduction to tools on the Cray XC system. Making it easier to port and optimise apps on the Cray XC30
 Short Introduction to tools on the Cray XC system Making it easier to port and optimise apps on the Cray XC30 Cray Inc 2013 The Porting/Optimisation Cycle Modify Optimise Debug Cray Performance Analysis
Using the GNU Debugger
 Using the GNU Debugger 6.828 Fall 2016 September 14, 2016 6.828 Fall 2016 Using the GNU Debugger September 14, 2016 1 / 14 Homework solution 6.828 Fall 2016 Using the GNU Debugger September 14, 2016 2
Bruce Merry. IOI Training Dec 2013
 IOI Training Dec 2013 Outline 1 2 Outline 1 2 What is GDB? Tool that peeks inside your program Helps examine what is happening Helps trace crashes Integrated into Eclipse, some other IDEs GDB vs debug
52 Remote Target. Simulation. Chapter
 Chapter 52 Remote Target Simulation This chapter describes how to run a simulator on a target and connect it to the SDL simulator interface (SimUI) on the host via TCP/IP communication. July 2003 Telelogic
Using the GNU Debugger
 Using the GNU Debugger 6.828 Fall 2014 September 10, 2014 6.828 Fall 2014 Using the GNU Debugger September 10, 2014 1 / 14 Homework solution From bootasm.s: # Set up the stack pointer and call into C.
CS201 Lecture 2 GDB, The C Library
 CS201 Lecture 2 GDB, The C Library RAOUL RIVAS PORTLAND STATE UNIVERSITY Announcements 2 Multidimensional Dynamically Allocated Arrays Direct access support. Same as Multidimensional Static Arrays No direct
Debugging Linux With LinuxScope-JTD
 Application Notes for Professional Developers of Embedded Systems #07-001 OVERVIEW Debugging Linux With LinuxScope-JTD The purpose of this Application Note is to show the user a general method for using
Development Environment & Linux Guide
 Development Environment & Linux Guide Juwon Lee(jwlee@archi.snu.ac.kr) School of Computer Science and Engineering Seoul National University Development Environment MobaXterm Provide Linux-like environment
Improving Linux Development with better tools. Andi Kleen. Oct 2013 Intel Corporation
 Improving Linux Development with better tools Andi Kleen Oct 2013 Intel Corporation ak@linux.intel.com Linux complexity growing Source lines in Linux kernel All source code 16.5 16 15.5 M-LOC 15 14.5 14
1. Allowed you to see the value of one or more variables, or 2. Indicated where you were in the execution of a program
 CS0449 GDB Lab What is a debugger? A debugger is a program that helps you find logical mistakes in your programs by running them in a controlled way. Undoubtedly by this point in your programming life,
Introduction to Operating Systems Prof. Chester Rebeiro Department of Computer Science and Engineering Indian Institute of Technology, Madras
 Introduction to Operating Systems Prof. Chester Rebeiro Department of Computer Science and Engineering Indian Institute of Technology, Madras Week - 01 Lecture - 03 From Programs to Processes Hello. In
Problem Set 1: Unix Commands 1
 Problem Set 1: Unix Commands 1 WARNING: IF YOU DO NOT FIND THIS PROBLEM SET TRIVIAL, I WOULD NOT RECOMMEND YOU TAKE THIS OFFERING OF 300 AS YOU DO NOT POSSESS THE REQUISITE BACKGROUND TO PASS THE COURSE.
Hands-on Workshop on How To Debug Codes at the Institute
 Hands-on Workshop on How To Debug Codes at the Institute H. Birali Runesha, Shuxia Zhang and Ben Lynch (612) 626 0802 (help) help@msi.umn.edu October 13, 2005 Outline Debuggers at the Institute Totalview
Configurations. Make menuconfig : Kernel hacking/
 Kernel Debugging Configurations Make menuconfig : Kernel hacking/ Timing info on printks depreciated logic Detection of hung tasks SLUB debugging Kernel memory leak detector Mutext/lock debugging Kmemcheck
Debugging with GDB and DDT
 Debugging with GDB and DDT Ramses van Zon SciNet HPC Consortium University of Toronto June 13, 2014 1/41 Ontario HPC Summerschool 2014 Central Edition: Toronto Outline Debugging Basics Debugging with the
Helping Developers Help You. Tom Caputi
 Helping Developers Help You Tom Caputi tcaputi@datto.com The ZFS Code Base 2 The ZFS on Linux* Code Base: Statistics Source code 641 files 383950 lines of code ZFS Test suite (not including ztest) 1327
Learning Objectives. A Meta Comment. Exercise 1. Contents. From CS61Wiki
 From CS61Wiki Contents 1 Learning Objectives 2 A Meta Comment 3 Exercise 1 3.1 Questions 3.2 Running code and using GDB 3.3 Compiler Optimizations 3.4 hexdump: a handy function 3.4.1 Questions 3.5 Checkpoint
1 A Brief Introduction To GDB
 1 A Brief Introduction To GDB GDB, the GNU Project debugger, allows you to see what is going on inside another program while it executes or what another program was doing at the moment it crashed. GDB
An Introduction to Komodo
 An Introduction to Komodo The Komodo debugger and simulator is the low-level debugger used in the Digital Systems Laboratory. Like all debuggers, Komodo allows you to run your programs under controlled
Laboratory 1 Semester 1 11/12
 CS2106 National University of Singapore School of Computing Laboratory 1 Semester 1 11/12 MATRICULATION NUMBER: In this lab exercise, you will get familiarize with some basic UNIX commands, editing and
12. Debugging. Overview. COMP1917: Computing 1. Developing Programs. The Programming Cycle. Programming cycle. Do-it-yourself debugging
 COMP1917 12s2 Debugging 1 COMP1917: Computing 1 12. Debugging Overview Programming cycle Do-it-yourself debugging Debugging withgdb Nastier bugs Memory leaks COMP1917 12s2 Debugging 2 Developing Programs
CNIT 127: Exploit Development. Ch 3: Shellcode. Updated
 CNIT 127: Exploit Development Ch 3: Shellcode Updated 1-30-17 Topics Protection rings Syscalls Shellcode nasm Assembler ld GNU Linker objdump to see contents of object files strace System Call Tracer Removing
Buffer Overflow Defenses
 Buffer Overflow Defenses Some examples, pros, and cons of various defenses against buffer overflows. Caveats: 1. Not intended to be a complete list of products that defend against buffer overflows. 2.
Embedded Systems Programming
 Embedded Systems Programming ES Development Environment (Module 3) Yann-Hang Lee Arizona State University yhlee@asu.edu (480) 727-7507 Summer 2014 Embedded System Development Need a real-time (embedded)
CS61 Lecture II: Data Representation! with Ruth Fong, Stephen Turban and Evan Gastman! Abstract Machines vs. Real Machines!
 CS61 Lecture II: Data Representation with Ruth Fong, Stephen Turban and Evan Gastman Abstract Machines vs. Real Machines Abstract machine refers to the meaning of a program in a high level language (i.e.
Portland State University Maseeh College of Engineering and Computer Science. Proficiency Examination Process
 Portland State University Maseeh College of Engineering and Computer Science Proficiency Examination Process 2016-2017 PSU Expectations of Student Competencies Students that apply to PSU s Computer Science
T Hands-on 2. User-mode debuggers OllyDbg
 T-110.6220 Hands-on 2 User-mode debuggers OllyDbg Disassemblers vs debuggers Static analysis / Disassemblers Theoretic approach Give us a static view of the binary Example: IDA Dynamic analysis / Debuggers
Making things work as expected
 Making things work as expected System Programming Lab Maksym Planeta Björn Döbel 20.09.2018 Table of Contents Introduction Hands-on Tracing made easy Dynamic intervention Compiler-based helpers The GNU
DEBUGGING ON FERMI PREPARING A DEBUGGABLE APPLICATION GDB. GDB on front-end nodes
 DEBUGGING ON FERMI Debugging your application on a system based on a BG/Q architecture like FERMI could be an hard task due to the following problems: the core files generated by a crashing job on FERMI
LAB #8. GDB can do four main kinds of things (plus other things in support of these) to help you catch bugs in the act:
 to help you catch bugs in the act:") LAB #8 Each lab will begin with a brief demonstration by the TAs for the core concepts examined in this lab. As such, this document will not serve to tell you everything the TAs will in the demo. It is
LAB #8 Each lab will begin with a brief demonstration by the TAs for the core concepts examined in this lab. As such, this document will not serve to tell you everything the TAs will in the demo. It is
Configuring Ubuntu to Code for the OmniFlash or OmniEP
 Configuring Ubuntu to Code for the OmniFlash or OmniEP Table of Contents Introduction...2 Assumptions...2 Getting Started...2 Getting the Cross Compiler for ARM...2 Extracting the contents of the compressed
CSci 4061 Introduction to Operating Systems. Programs in C/Unix
 CSci 4061 Introduction to Operating Systems Programs in C/Unix Today Basic C programming Follow on to recitation Structure of a C program A C program consists of a collection of C functions, structs, arrays,
Reversed Buffer Overflow Cross Stack Attacks. Kris Kaspersky Endeavor Security, Inc.
 Reversed Buffer Overflow Cross Stack Attacks Kris Kaspersky Endeavor Security, Inc. Who am I? journalist, reversing as a hobby; currently working for: XAKEP magazine (www.xakep.ru) Endeavor Security, Inc
Programming Tools. Venkatanatha Sarma Y. Lecture delivered by: Assistant Professor MSRSAS-Bangalore
 Programming Tools Lecture delivered by: Venkatanatha Sarma Y Assistant Professor MSRSAS-Bangalore 1 Session Objectives To understand the process of compilation To be aware of provisions for data structuring
The CS-220 Development Environment
 The Development Environment (No relevant sections in text) Picking the right tool for the job 2 Integrated Development Environment 3 Command Line Mentality Old fashioned but surprisingly efficient (except
Debugging for production systems
 Debugging for production systems February, 2013 Tristan Lelong Adeneo Embedded tlelong@adeneo-embedded.com Embedded Linux Conference 2013 1 Who am I? Software engineer at Adeneo Embedded (Bellevue, WA)
Tips on Using GDB to Track Down and Stamp Out Software Bugs
 Tips on Using GDB to Track Down and Stamp Out Software Bugs Brett Viren Physics Department MINOS Week In The Woods, 2005 Brett Viren (Brookhaven National Lab) Using GDB to Debug Ely 2005 1 / 34 Outline
Introduction to the Command line. Introduction to the command line. Introduction to the Command line. GNU/Linux at South Wales
 Introduction to the command line slide 1 Introduction to the Command line slide 2 in this module we will examine: tools necessary to develop game engines:gdb, emacs and friends examine how one can integrate
Jackson Marusarz Software Technical Consulting Engineer
 Jackson Marusarz Software Technical Consulting Engineer What Will Be Covered Overview Memory/Thread analysis New Features Deep dive into debugger integrations Demo Call to action 2 Analysis Tools for Diagnosis