Training Linux Debugging
|
|
|
- Beatrice Merritt
- 6 years ago
- Views:
Transcription
1 Training Linux Debugging TRACE32 Online Help TRACE32 Directory TRACE32 Index TRACE32 Training... Training RTOS... Training Linux Debugging... 1 Prolog... 4 Basic Terms on Embedded Linux ) Linux Components 5 The Kernel 5 Kernel Modules 6 Processes and Threads 6 Libraries (Shared Objects) 6 2.) The Linux Awareness 6 3.) Virtual Memory Management in Linux 8 Virtual Address Map of Linux 8 Debugger Memory Access 9 On Demand Paging 12 4.) Run-Mode vs. Stop-Mode Debugging 14 Hardware Based Debuggers 14 Software Based Debuggers 15 5.) Building the Kernel, a Kernel Module and a Simple Demo Application 17 Building the Kernel 17 Building a Kernel Module 17 Building a User Application 18 Setting up a script for Linux-aware debugging ) Capture of commands for a script 19 2.) Linux Setup-Steps and -Commands 20 Debugger Reset for Linux Debugging 20 Debugger Setup 21 Debugger setup for the OMAP4430 target 21 Set Single Step Behavior 24 Target Setup 25 Load Kernel Symbols 25 Download the Kernel 28 Download the File System 30 Set up the Linux Awareness 31 Training Linux Debugging 1
2 Boot Linux 33 3.) Example Linux Setup-Scripts 34 Debugging the Linux Components by TRACE32 Linux menu ) Debugging Linux Components ) The Kernel 37 Kernel Startup 37 Kernel Boot 38 Verifying image and symbols 40 Example: debugging built-in device drivers 40 Example: trapping segmentation violation ) Kernel Modules ) Processes 45 Debugging a process from the start 45 Process Watch System ) Threads ) Libraries 49 2.) Linux specific Windows and Features 51 Display of system resources 51 Task Related Breakpoints 52 Task Related Single Stepping 52 Task Context Display 53 Troubleshooting Linux Trace Overview 56 Example 1: Context ID trace for ARM 56 Example 2: Using the LOGGER for task switch trace 57 Epilog Training Linux Debugging 2


3 Training Linux Debugging Version 06-Nov-2017 Training Linux Debugging 3
4 Prolog This training will have the main subjects: Basic terms on embedded Linux Building the kernel, a kernel module and a simple demo application Setting up a script for Linux-aware debugging Debugging Linux components by TRACE32 Linux menu Troubleshooting Further TRACE32 documents related to Linux Debugging: This is a quick-tutorial. It will not introduce you to all features of the Linux awareness. For a complete description, refer to the RTOS Debugger for Linux - Stop Mode (rtos_linux_stop.pdf). The latest version of the training manual is available for download under: Training Linux Debugging 4
5 Basic Terms on Embedded Linux This part describes essential basics and terms related to Linux and Linux-Debugging. 1. Linux Components 2. The Linux Awareness 3. Virtual Memory Management in Linux 4. Run-Mode vs. Stop-Mode Debugging 1.) Linux Components From the point of view of a debugger, a Linux system consists of the following components: The Linux Kernel Kernel Modules Processes and Threads Libraries (Shared Objects) Moreover, we can talk about two different spaces of executed code: kernel space with privileged rights which includes the kernel and kernel modules and user space with limited rights which includes processes, threads and libraries. Please note that this training does not handle the debugging of bootloaders. The Kernel The Linux kernel is the most important part in a Linux system. It runs in privileged kernel space and takes care of hardware initialization, device drivers, process scheduling, interrupts, memory management... The Linux kernel is generally contained in a statically linked executable in one of the object files supported by Linux (e.g. ELF) called vmlinux. You can also find the kernel in compressed binary format (zimage/uimage). You will see later in this training how to configure the Linux kernel for Linux-aware debugging. Kernel Threads: It is often useful for the kernel to perform operations in the background. The kernel accomplishes this via kernel threads. Kernel threads exist solely in kernel space. The significant difference between kernel threads and processes is that kernel threads operate in kernel space and do not have their own address space. Training Linux Debugging 5
6 Kernel Modules Kernel modules (*.ko) are software packages that are loaded and linked dynamically to the kernel at run time. They can be loaded and unloaded from the kernel within a user shell by the commands insmod and rmmod. Typically kernel modules contain code for device drivers, file systems, etc. Kernel modules run at kernel level with kernel privileges (supervisor). Processes and Threads A process is an application in the midst of execution. It also includes, additionally to executed code, a set of resources such as open files, pending signals, a memory address space with one or more memory mappings... Linux-Processes are encapsulated by memory protection. Each process has its own virtual memory which can only be accessed by this process and the kernel. Processes run in user space with limited privileges. A process could have one or more threads of execution. Each thread includes a unique program counter, process stack and set of process registers. To the Linux kernel, there is no concept of a thread. Linux implements all threads as standard processes. For Linux, a thread is a processes that shares certain resources with other processes. In this training, you will also find the term task which denotes kernel threads, processes and threads. Libraries (Shared Objects) Libraries (shared objects, *.so) are commonly used software packages loaded and used by processes and linked to them at run-time. Libraries run in the context and memory space of the process that loaded them having the same limited privilege as the owning process. Same as processes, also libraries are always loaded and executed as a file through a file system. 2.) The Linux Awareness Debugging an operating system like Linux requires special support from the debugger. We say that the debugger needs to be aware of the operating system. Since TRACE32 supports a wide range of target operating systems, this special support is not statically linked in the debugger software but can be dynamically loaded as an extension depending on which operating system is used. Additional commands, options and displays will be then available and simplify the debugging of the operating system.the set of files providing these operating system debugging capabilities is called here awareness. To be able to read the task list or to allow process or module debugging, the Linux awareness accesses the kernel s internal structures using the kernel symbols. Thus the kernel symbols must always be available otherwise Linux aware debugging will not be possible. The file vmlinux has to be compiled with debugging information enabled as will be shown later. The Linux awareness files can be found in the TRACE32 installation directory under ~~/demo/<arch>/kernel/linux/<linux_version> Training Linux Debugging 6
7 You can check the version of the loaded Linux awareness in the VERSION.SOFTWARE window. This information will only be shown if the Linux awareness is already loaded. You will see later in this training how to load the Linux awareness. Training Linux Debugging 7

8 3.) Virtual Memory Management in Linux Before actually going into the details on how to debug a Linux system with TRACE32, we need to look at the helping features of TRACE32 that make Linux debugging possible. Virtual Address Map of Linux We start by discussing the virtual address map used by a running Linux system. Basically the memory is split into two sections: one section is reserved for the kernel and the second one for the user applications. The kernel runs in Supervisor/Privileged mode and has full access to the whole system. Next to Supervisor/ Privileged mode there is User/Non-Privileged mode which is used for user space processes. While the CPU is in User/Non-Privileged mode, only parts of the memory are visible. Thus the kernel, which runs in Supervisor mode, has full visibility of the whole virtual address map, while the user processes have only a partial visibility. It s the task of the kernel to maintain the virtual address map and also the virtual to physical address translations for each application/ process. The kernel space is exclusively used by the kernel, this means that a logical/virtual address in this section can have, at a given time, one single virtual-to-physical address mapping. On the other hand, the user space is shared by all running processes. Thus a virtual address in the user space can have different mappings depending on the process to which this address belongs. Training Linux Debugging 8

 configurable in the kernel.")
9 The kernel space includes the kernel logical address range which is mapped to a continuous block in the physical memory. The kernel logical addresses and their associated physical addresses differ only by a constant offset. We denote this kernel logical to physical address translation as kernel default translation. The rest of the kernel space includes the kernel virtual addresses which do not have necessarily the linear one-to-one mapping to physical addresses. This includes for instance memory allocated with vmalloc. The split between kernel section and application/process section is at a certain barrier which is (typically) configurable in the kernel. For a 32bit kernel, there is by default a 3G/1G user/kernel split. Which means that there are 3 GigaBytes of virtual memory available for applications and 1 GigaByte virtual memory for the kernel. With this setup, the kernel memory starts at 0xC and ends at 0xFFFFFFFF. Example: kernel logical range from 0xC to 0xCFFFFFFF mapped to the physical memory block starting at 0x Debugger Memory Access With disabled debugger address translation, the debugger accesses the memory virtually (through the core). This way, it is only possible to access memory pages which are currently mapped in the TLBs. Alternatively, you can set up the debugger to access the memory physically. This way, the debugger will have access to all the existing physical memory. However, Linux operates completely in virtual memory space: all functions, variables, pointers etc. work with virtual addresses. Also, the symbols are bound to virtual addresses. Hence, if the user tries to read the value of a variable, the debugger has to find the virtual to physical address translation for this variable and access it using its physical address. Training Linux Debugging 9
10 The debugger holds a local translation list. Translations can be added to this list manually using the TRANSlation.Create command. This local translation list can be viewed using the TRANSlation.List command. If no translation is found in this local list and if the translation table walk is enabled then the debugger will read the target MMU page table(s) to find the virtual to physical address translation. We call this process debugger table walk. Please note that the debugger local translation list has the highest priority in the debugger translation process. In contrast to the CPU address translation, if the virtual to physical address mapping is not found in the page table when performing a debugger table walk, no page fault is generated. It is then not possible for the debugger to access this address. A debugger memory access doesn t modify the MMU page tables. Without further settings, the debugger can only access the current page table generally pointed by a special register (e.g. TTBR0/TTBR1 for ARM). However, each process as well as the kernel, has its own page table. Hence, by walking only through the current page table, it is not possible to find the virtual to physical address mapping of a process which is not the current executing one and as follows it is not possible to access the memory of such a process. But since the Linux kernel manages the switching of the MMU for all processes, kernel structures hold the pointers for the translation pages tables for every process. The debugger just needs to get this information from the kernel data structures to be able to access the memory for any running task in the system. It is the task of the Linux awareness to get the page table descriptors for all running tasks on the system. You can display these descriptors by execution the TRACE32 commands TRANSlation.ScanID and TRANSlation.ListID. To be able to access the kernel logical range at any time, the debugger needs to know the kernel logical to physical address translation. Space IDs Under Linux, different processes may use identical virtual address. To distinguish between those addresses, the debugger uses an additional identifier, the so-called space ID (memory space identifier). It specifies which virtual memory space an address refers to. The space ID is zero for all tasks using the kernel address space (kernel threads). For processes using their own address space, the space ID equals the lower 16bits of the process ID. Threads of a particular process use the memory space of the invoking parent process. Consequently threads have the same space ID as the parent process (main thread). If you enter commands with a virtual address without the TRACE32 space ID, the debugger will access the virtual address space of the current running task. The following command enables the use of space IDs in TRACE32: SYStem.Option MMUSPACES ON Training Linux Debugging 10
.")


11 SYStem.Option MMUSPACES ON doesn t switch on the processor MMU. It just extends the addresses with space IDs. After this command, a virtual address looks like 001E: , which means virtual address 0x with space ID 0x1E (pid = 30.). You can now access the complete memory: Data.dump 0x List 0x2F:0x Data.dump A:0x ; Will show the memory at virtual address ; 0x of the current running task ; Will show a code window at the address ; 0x of the process having the space ; id 0x2F ; Will show the memory at physical address ; 0x Symbols are always bound to a specific space ID. When loading the symbols, you need to specify, to which space ID they should belong. If you load the symbols without specifying the space ID, they will be bound to space ID zero (i.e. the kernel s space ID). See chapter Debugging the Linux Components by TRACE32 Linux menu, page 37 for details. Because the symbols already contain the information of the space ID, you don t have to specify it manually. Data.dump myvariable ; Will show the memory at the virtual ; address of myvariable with the space ID ; of the process holding this variable virtual address of current process 0x141 virtual address of specified process 0xBB9 access to physical address A:0x8048FDD Symbol flags with process 0xBB9 Training Linux Debugging 11
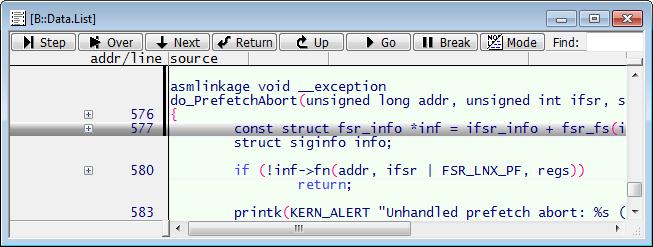
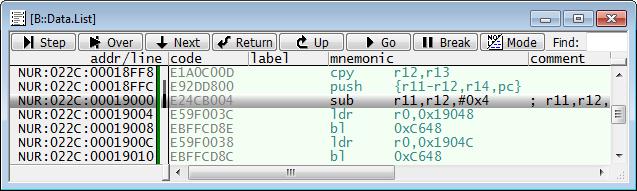
12 If the Linux awareness is enabled, the debugger tries to get the space ID of the current process by accessing the kernel s internal data structures. If this fails e.g. because of wrong symbol information, an access error, or because the kernel s data structures have not been yet initialized (in case you stop the target early in the kernel boot process), the debugger set the current space ID to 0xFFFF and shows the message task error in the status line. You can ignore the task error message as long as the kernel has not yet booted. On Demand Paging Linux is designed for heavy MMU usage with demand paging. Demand paging means that code and data pages of processes (and libraries) are loaded when they are first accessed. If the process tries to access a memory page that is not yet loaded, it creates a page fault. The page fault handler then loads the appropriate page. Only the actually used pages are really loaded. However, this demand paging disturbs the debugger a lot. As a workaround, two patches are available to avoid demand paging while debugging. One is placed in the ELF loader, the other one is placed in the process handler. Please see RTOS Debugger for Linux - Stop Mode (rtos_linux_stop.pdf) for details. The following screen shots show an example of demand paging on an ARM target: the code of the process consists of multiple memory pages. The program counter is at the end of the page (address 0x18FF8). The next page (at address 0x19000) is not yet loaded into physical memory. Therefore the debugger cannot read the memory at these addresses and shows question marks. After a single step, a PABORT exception takes place (address 0xFFFF000C) and then the kernel handler for prefetch abort (do_prefetchabort) is called which loads and maps the page and finally returns to the address which caused the exception (0x19000). Training Linux Debugging 12


13 Training Linux Debugging 13

14 4.) Run-Mode vs. Stop-Mode Debugging There are two main alternatives for debugging a Linux target: hardware based (stop mode) and software based (run mode). This chapter gives a small introduction regarding the differences between stop and run mode debugging which are both supported by TRACE32. Hardware Based Debuggers A hardware-based debugger uses special hardware to access target, processor and memory (e.g. by using the JTAG interface). No software components are required on the target for debugging. This allows debugging of bootstraps (right from the reset vector), interrupts, and any other software. Even if the target application runs into a complete system crash, you are still able to access the memory contents (post mortem debugging). A breakpoint is handled by hardware, too. If it is reached, the whole target system (i.e. the processor) is stopped. Neither the kernel, nor other processes will continue. When resuming the target, it continues at the exact state, as it was halted at the breakpoint. This is very handy to debug interrupts or communications. However, keep in mind that also keep alive routines may be stopped (e.g. watchdog handlers). The debugger is able to access the memory physically over the complete address range, without any restrictions. All software parts residing in physically memory are visible, even if they are not currently mapped by the TLBs. If the debugger knows the address translation of all processes, you gain access to any process data at any time. The on demand paging mechanism used by Linux implies that pages of the application may be physically not present in the system, as long as they are not accessed. The debugger cannot access such pages (including software breakpoints), as long as they are not loaded. Advantages: bootstrap, interrupt or post mortem debugging is possible no software restrictions (like memory protection,...) apply to the debugger the full MMU table and code of all processes alive can be made visible only JTAG is required, no special communication interface as RS232 or Ethernet is needed Training Linux Debugging 14

15 Disadvantages: halts the complete CPU, not only the desired process synchronization and communications to peripherals usually get lost debug HW and a debug interface on the target are needed Software Based Debuggers Software based debuggers, e.g. GDB, usually use a standard interface to the target, e.g. serial line or Ethernet. There is a small program code on the target (called stub or agent ) that waits for debugging requests on the desired interface line and executes the appropriate actions. Of course, this part of the software must run, in order for the debugger to work correctly. This implies that the target must be up and running, and the driver for the interface line must be working. Hence, no bootstrap, interrupt or post mortem debugging is possible. When using such a debugger to debug a process, a breakpoint halts only the desired process. The kernel and all other processes in the target continue to run. This may be helpful, if e.g. protocol stacks need to continue while debugging, but hinders the debugging of inter-process communication. Because the debugging execution engine is part of the target program, all software restrictions apply to the debugger, too. In the case of a gdbserver for example, which is a user application, the debugger can only access the resources of the currently debugged processes. In this case, it is not possible to access the kernel or other processes. Advantages: halts only the desired process synchronization and communications to peripherals usually continue no debugger hardware and no JTAG interface are needed Disadvantages: no bootstrap, interrupt or post mortem debugging is possible all software restrictions apply to the debugger too (memory protection,...) only the current MMU and code of this scheduled process is visible actions from GDB change the state of the target (e.g page faults are triggered) one RS232 or Ethernet interface of the target is blocked Training Linux Debugging 15
16 Software based debugging is less robust and has many limitations in comparison to hardware based debugging. Thus, it is recommended to use JTAG based debugging if possible. Run mode debugging is not covered by this training, for more information please refer to RTOS Debugger for Linux - Run Mode (rtos_linux_run.pdf) and TRACE32 as GDB Front-End (frontend_gdb.pdf). Training Linux Debugging 16

17 5.) Building the Kernel, a Kernel Module and a Simple Demo Application Before going forward with writing Linux TRACE32 scripts and debugging the different Linux components, we will show the important steps when building the kernel, kernel modules and user applications. Building the Kernel To be able to do Linux aware debugging, the vmlinux file must be compiled with debug info enabled. Thus, you need to ensure that CONFIG_DEBUG_INFO is enabled in the kernel configuration. You can find this option under Kernel hacking -> Compile the kernel with debug info (in newer kernel versions under Kernel hacking -> Compile-time checks and compiler options -> Compile the kernel with debug info ). Please also make sure that CONFIG_DEBUG_INFO_REDUCED is not set (Reduce debugging information) Building a Kernel Module The kernel contains all section information if it has been configured with CONFIG_KALLSYMS=y. When configuring the kernel, set the option General Setup -> Configure standard kernel features -> Load all symbols to yes. Without KALLSYMS, no section information is available and debugging kernel modules is not possible. Training Linux Debugging 17
18 Building a User Application When compiling an application, you need to use the -g compiler option to enable debug information: $ gcc -g -o hello hello.c Training Linux Debugging 18
19 Setting up a script for Linux-aware debugging This chapter will tell about the typical steps how to prepare a Linux target and the TRACE32 debugger for convenient Linux-Debugging. The used target for the explanation is a PandaBoard with an OMAP4430 (dual Cortex-A9). The following pages will show the setup by now step by step: 1. Capture of commands for a script 2. Linux Setup-Steps and -Commands 3. Example Linux Setup-Script file 1.) Capture of commands for a script It can be an advantage to record the commands and wanted settings used inside the TRACE32 graphical user interface (GUI) right from the start. So you should open first a LOG-file: LOG.OPEN <file> LOG.CLOSE Create and open a file for the commands to be logged. The default extension for LOG-files is (.log) Close the LOG-file This log file contains all of the TRACE32 actions, including the menu selection and mouse-clicks. Whereas the ClipSTOre and STOre <file> commands save only specific actions like system settings (e.g STOre SYStem). STOre <file> SYStem ClipSTOre SYStem Create a batch to restore the SYStem settings Provide the commands to restore the SYStem settings in the cliptext The HISTory command only samples the commands from the command line. But it offers a quick access to the commands used already. Use the cursor key UP or mouse to select commands form the HISTory list. HISTory.type Display the command history Training Linux Debugging 19
20 2.) Linux Setup-Steps and -Commands To be able to do Linux aware debugging, some configuration needs to be done in TRACE32. The minimal setup includes the following steps: Connect to the target platform Load the Linux kernel symbols Set up the debugger address translation Load the Linux awareness and the Linux menu These are the only needed configuration steps if you want to attach to a running Linux kernel. In case you want to debug the kernel boot, then you additionally need to make sure to stop the execution before the kernel start. Moreover, it is possible to download the kernel image to the RAM using the debugger. We will discuss in this chapter which setup is needed in this case. You can find Linux demo scripts in the TRACE32 installation directory under ~~/demo/<arch>/kernel/linux/board Debugger Reset for Linux Debugging Especially if you restart debugging during a debug session you are not sure about the state the debugger was in. So use command RESet for a complete restart or the specific resets for each debugger function.. RESet ; reset debugger completely The RESet command doesn t reset the target but only the debugger environment. Moreover, it is also good to clear all debugger windows before connecting to the target using the WinCLEAR command. WinCLEAR ; clear all debugger windows Training Linux Debugging 20


21 Debugger Setup First you need to set up the debugger to be able to connect to the target platform. This includes e.g. selecting the appropriated CPU, setting the JTAG clock and selecting target-specific debugger options. Moreover, some additional options related to Linux debugging have to be enabled like address extension. Finally, you need to connect to the target using SYStem.Up or SYStem.Mode Attach. Debugger setup for the OMAP4430 target This tutorial shows the typical command sequence for an OMAP4430 from Texas Instruments. These steps will be similar but not same with other platforms. Consult the manuals specific to your platform for correct settings. Start-up scripts for different target platforms are also available in the TRACE32 demo directory. You can use the TRACE32 menu File -> Search for Scripts.. to find suitable demo scripts for your target board. CPU selection You need to select a CPU to debug your target. You can use the search field in the SYStem.CPU window to find your CPU name. Alternatively, you can use the command line to write the CPU name partially to be completed by pressing the tabulator key on the keyboard. This way also the amount of displayed CPUs is reduced temporarily: SYStem.CPU OMAP4430 ; OMAP4430 target to be debugged JTAG Clock Using the command SYStem.JtagClock you can select an appropriated JTAG clock for you target. This could be necessary if the default clock set by the debugger is for example too high. You can see the selected JTAG clock in the SYStem window. Training Linux Debugging 21


22 For the OMAP4430 we use the clock CTCK 30MHz. SYStem.JtagClock CTCK 30MHz DACR option If you have an ARM target, you need to set the DACR Option to ON to grant write access to all memory domains for the debugger. Because the target MMU usually write protects some memory areas (e.g. code pages). But the debugger needs write access for example to set software breakpoints.. SYStem.Option DACR ON ; give Debugger global write permissions Different targets may need some hardware related settings. Please check the specific Processor Architecture Manual ( debugger_<architecture>.pdf ) for possible options. Onchip Trigger You can configure whether the debugger will halt or not on exceptions. In case of the ARM architecture, TRACE32 halts, by default, on most exceptions. Since Linux uses some of these exceptions, the debugger s detection has to be switched off. TrOnchip.Set DABORT OFF TrOnchip.Set PABORT OFF TrOnchip.Set UNDEF OFF ; used by Linux for data page misses! ; used by Linux for program page misses! ; might be used by Linux for FPU detection Training Linux Debugging 22
. SYStem.Option MMUSPACES ON ; enable space IDs to virtual addresses Remark: Older documentation and TRACE32-SW uses SYStem.")
23 Address extension Switch on the debugger s virtual address extension to use space IDs (needed to differ e.g. several main functions of different processes). The addresses in the List and Data.dump windows will be extended with a space ID (e.g FFFF: ). SYStem.Option MMUSPACES ON ; enable space IDs to virtual addresses Remark: Older documentation and TRACE32-SW uses SYStem.Option MMU ON instead of MMUSPACES. Please use only the new naming. The SYStem.Option MMUSPACES should only be changed if NO debug symbols are loaded! Connect to the target The command SYStem.Up resets the target (if supported by the JTAG interface) and enters debug mode. SYStem.Up ; activates the JTAG communication The command SYStem.Mode Attach attaches to the target without resetting the cores. SYStem.Mode Attach ; attach to the cores Training Linux Debugging 23


24 At this stage the Linux awareness has not yet been enable, so if a problem occurs then it is related to the debugger settings or to a problem on the target. Please check in this case the AREA window for errors and warnings. AREA.view [<area>] Please refer to the Processor Architecture Manual for architecture specific setup and options. Set Single Step Behavior While single stepping, external interrupts may occur. On some architectures, this leads with the next single step into the interrupt handler. This effect normally disturbs during debugging. The following sequence masks external interrupts while executing assembler single steps. Keep interrupts enabled during HLL single steps to allow paging while stepping through source code. SETUP.IMASKASM ON SETUP.IMASKHLL OFF ; suppress interrupts during assembler stepping ; allow interrupts while HLL single stepping If an assembler single step causes a page fault, the single step will jump into the page fault handler, regardless of the above setting. The debugger will restore the interrupt mask to the value before the single step. So it might be wrong at this state and cause an unpredictable behavior of the target. Training Linux Debugging 24
25 Open a Terminal Window You can open a serial terminal window in TRACE32 using the TERM command: TERM.RESet ; reset old and set new definitions TERM.METHOD COM com NONE 1STOP NONE ; for com10 use \\.\com10 TERM.SIZE ; define capacity of the TERM window TERM.SCROLL ON ; scrolling follows to the TERM cursor TERM.Mode VT100 ; or ASCII (default), STRING, HEX... WINPOS 50% 0% 50% 100% term_win ; define next window position and size TERM.view ; open the TERM window SCREEN.ALways ; TERM window always updated You can also use the term.cmm script available in the TRACE32 installation under ~~/demo/etc/terminal/serial which takes two arguments: the COM port and the baud rate e.g. DO ~~/demo/etc/terminal/serial/term.cmm COM Target Setup It is the task of the bootloader to bring the processor in a well-defined state and initialize the system after a target reset. Alternatively, you can instead of using a bootloader initialize the target using a PRACTICE script (*.cmm). Target initialization scripts for the PandaBoard are available in the TRACE32 demo directory under ~~/demo/arm/kernel/linux/board/pandaboard. Load Kernel Symbols Kernel symbols are very important when debugging a Linux system. Without kernel symbols, no Linux aware debugging is possible. You need to load the kernel symbols even if you only debug user applications and do not debug the kernel code. The kernel debug information is included in the file vmlinux. This file has to be compiled with debugging information enabled as already explained. You can load the kernel symbols using the following command: Data.LOAD.Elf vmlinux /NoCODE ; load only kernel debug symbols The option /NOCODE should be used to only load the symbols without kernel code. The symbols of the vmlinux file contain empty structure definitions (forward declarations in the source files). These may confuse the Linux awareness. To remove those structure definitions, execute a symbol.cleanup right after loading the symbols into the debugger. Training Linux Debugging 25
26 Displaying the Source Code If you are not running TRACE32 on the host where you compiled your kernel, the debugger, which uses per default the compile path to find the source files, will not find these files. Thus, the debugger needs to be set up to be able to find the source code. Two options are available in the Data.LOAD command for this purpose: /STRIPPART and /SourcePATH. With the option /STRIPPART you can remove parts of the path stored in the object file. With the option /SourcePATH you can specify a basis directory for the source files. The debugger will take the rest of the compile path (without the stripped part) and will append it to the specified source path. The source path can also be set using the command symbol.sourcepath. For example, if you have compiled your kernel on a Linux machine in the directory /home/user/linuxkernel/linux-3.4 and you are running TRACE32 on a Windows machine where you have the kernel source files tree under C:\Debugging\Linux\Sources\linux-3.4, you can load the kernel symbols with Data.LOAD.Elf vmlinux /NoCODE /STRIPPART "linux-kernel" /SOURCEPATH C:\Debugging\Linux\Sources or Data.LOAD.Elf vmlinux /NoCODE /STRIPPART 4. /SOURCEPATH C:\Debugging\Linux\Sources or Data.LOAD.Elf vmlinux /NoCODE /STRIPPART 4. symbol.sourcepath C:\Debugging\Linux\Sources In our case we get the same result if we use the /STRIPPART option with the parameter linux-kernel or 4. ( / + home/ + user/ + linux-kernel/ ). To look for the source file init/main.c the debugger will here use the path C:\Debugging\Linux\Sources\ + /home/user/linux-kernel/linux-3.4/init/ thus C:\Debugging\Linux\Sources\linux-3.4\init Training Linux Debugging 26


27 1. Data.LOAD.Elf vmlinux /NoCODE 2. Data.LOAD.Elf vmlinux /NoCODE /STRIPPART 4. Training Linux Debugging 27

28 3. symbol.sourcepath C:\Debugging\Linux\Sources If you don t specify the source path, the debugger will append the rest of the stripped path to the local working directory (type PWD in the debugger command line to see the current working directory). You can also instead of using /STRIPPART and /SourcePATH to specify the path to the source file, use the command symbol.sourcepath.translate to translate a compile source path to a host source path. The command would be in our case: symbol.sourcepath.translate "/home/user/linux-kernel" "C:\Linux\Linux\Sources\" Download the Kernel It is normally the task of the bootloader to load the kernel e.g. from the hard drive to the RAM. However, you can also use the debugger to download the kernel to the target memory over JTAG. In this case you need to omit the /NOCODE option in the Data.LOAD.Elf command. We use here the memory class A: (absolute addressing) to download the code on the physical memory: Data.LOAD.Elf vmlinux A:<physical_start>-<logical_start> /NosYmbol Training Linux Debugging 28
29 Since the vmlinux file is mapped to logical addresses, you need to load vmlinux with an offset which is equal the kernel physical start minus the kernel logical start. If we have for instance a 32bit kernel starting at the logical address 0xC and that should be downloaded to the memory at 0x , we should the use the following command: Data.LOAD.Elf vmlinux A:0x xC /NosYmbol Some architectures (e.g. SH and MIPS) use the same virtual and physical start address for the kernel. In this case you can simply download the kernel code and load the symbols using: Data.LOAD.Elf vmlinux When shifting the kernel image from virtual to physical start address (e.g 0x xC ) you have to only load the kernel code without symbols using the option /NoSymbol. Otherwise, the kernel symbols will be loaded on wrong addresses. The symbols are then loaded separately. Sometime, it is also necessary to restrict the download to a RAM area range due to wrong information by some gcc versions in the Elf file: Data.LOAD.Elf vmlinux 0x xC x x1FFFFFFF /NosYmbol Downloading the kernel code at the kernel entry You can set an on-chip breakpoint at the kernel entry point and let the system run. When you stop at the breakpoint, you can then download the kernel to the target memory. In this case, no further settings are needed since everything has already been prepared by the bootloader. For example: Go 0x /Onchip /COUNT 2 WAIT!STATE.RUN() Data.LOAD.Elf vmlinux A:0x xC /NosYmbol Then you can simply continue the execution: Go ; let the kernel boot Training Linux Debugging 29
30 Downloading the Kernel after the Bootloader Target Initialization You can stop the bootloader just after the target initialization and download the kernel. This way, you need to set the values of several registers and to set up the kernel boot parameters manually. The program counter should be set to kernel entry point. Other registers should be set depending on the target architecture. For the ARM architecture, the register R1 should generally be written with a machine type id. On the other hand, R2 should point to an ATAG structure or to a device tree blob. ; Reset all registers: Register.RESet ; set PC on start address of image: Register.Set PC 0x ; Set machine type in R1 (2791.) Register.Set R ; Set R2 to the start of the device tree blob Register.Set R2 0x ; Download the device tree blob Data.LOAD.Binary omap4-panda.dtb 0x /NoClear Download the File System In case you are using a ramdisk image as file system, you can download this image to the target memory using the Data.LOAD.Binary command: Data.LOAD.Binary ramdisk.image.gz 0x /NoClear /NosYmbol Please note that the /NoClear option should be used here, otherwise already loaded debug symbols would be cleared. Set up the Debugger Address Translation The debugger needs to have some information about the format of the MMU tables used by the kernel and the kernel address translation. This is configured using the command MMU.FORMAT MMU.FORMAT LINUX swapper_pg_dir 0xc xc1ffffff 0x The first argument of this command is the format of the MMU tables. Please check RTOS Debugger for Linux - Stop Mode (rtos_linux_stop.pdf) for actual format specifier. The second argument is a kernel symbol pointing to the start of the kernel page table and is usually called swapper_pg_dir If you get the error message invalid combination after the MMU.FORMAT command, check if you have enabled the MMUSPACES. Training Linux Debugging 30
31 Moreover, you need to set the common address range with the command TRANSlation.COMMON. This is actually the common address range for all processes and is everything above the process address range e.g. TRANSlation.COMMON 0xbf xffffffff ;for kernel modules below the ;kernel TRANSlation.COMMON 0xc xffffffff ;for kernel modules above the ;kernel Finally you need to enable the MMU table walk with TRANSlation.TableWalk ON and enable the debugger address translation with the command TRANSlation.ON. TRANSlation.TableWalk ON TRANSlation.ON If the table walk is enabled, when accessing a virtual address which has no mapping in the debugger local address translation list (TRANSlation.List), the debugger tries to access the MMU page tables to get the corresponding physical address and then access the memory physically. Set up the Linux Awareness We need to load now the Linux awarness and Linux menu in TRACE32. For kernel versions 2.x, the Linux awarness is based on the file linux.t32 located under ~~/demo/<arch>/kernel/linux/linux-2.x/ where <arch> is e.g. arm for the ARM architecture. The Linux awarness for kernel versions 3.x is based on the file linux3.t32 located under ~~/demo/<arch>/kernel/linux/linux-3.x/. ; load the awareness for Linux-3.x on ARM TASK.CONFIG ~~/demo/arm/kernel/linux/linux-3.x/linux3.t32 ; load Linux menu: MENU.ReProgram ~~/demo/arm/kernel/linux/linux-3.x/linux.men Training Linux Debugging 31


32 The Linux menu file includes many useful menu items developed for the TRACE32-GUI to ease Linux Debugging. The Linux awareness uses scripts also available under ~~/demo/<arch>/kernel/linux/<linux_version> and that are called by the Linux awareness and the Linux menu file from this directory. You should always load the awareness from the TRACE32 installation directory to avoid compatibility problems between the Linux awareness and the mentioned scripts. If you load the Linux awareness outside the TRACE32 installation, you will get the warning please use awareness files from TRACE32 installation directory Mark the Kernel Address Space For better visibility, you can mark the kernel address space to be displayed with a red bar. GROUP.Create "kernel" 0x0000:0xC xFFFFFFFF /RED Training Linux Debugging 32
.")
33 Boot Linux Everything is set up now. If the kernel is not already running and if you are not interested in debugging the kernel boot, you can let Linux run as long as it needs to boot completely (e.g. 10 seconds). Go WAIT 10.s Break If the kernel boots correctly, you should get a prompt shell in the serial terminal window: Training Linux Debugging 33
34 3.) Example Linux Setup-Scripts You can find demo startup scripts for different target boards in the TRACE32 installation directory under ~~/demo/<arch>/kernel/linux/board. You can also search for the newest scripts in the Lauterbach home page under the following link: The first example script set up Linux aware debugging for a kernel running on the PandaBoard. In this example the kernel is already running on the target. The RAM is located at 0x REset WinCLEAR SYStem.CPU OMAP4430 SYStem.JtagClock CTCK 30MHz SYStem.Option DACR ON ; give Debugger global write permissions TrOnchip.Set DABORT OFF ; used by Linux for page miss! TrOnchip.Set PABORT OFF ; used by Linux for page miss! TrOnchip.Set UNDEF OFF ; may be used by Linux for FPU detection SYStem.Option MMUSPACES ON ; enable space IDs to virtual addresses SYStem.Attach SETUP.IMASKASM ON ; lock interrupts while single stepping ; Open a serial terminal window DO ~~/demo/etc/terminal/serial/term.cmm COM ; Open a Code Window -- we like to see something WinPOS List SCREEN ; Load the Linux kernel symbols Data.LOAD.Elf vmlinux /NOCODE MMU.FORMAT LINUXSWAP3 swapper_pg_dir 0xC xDFFFFFFF 0x TRANSLATION.COMMON 0xBF xFFFFFFFF TRANSLATION.TableWalk ON TRANSlation.ON ; Load Linux awareness and Linux menu PRINT "initializing multi task support..." TASK.CONFIG ~~/demo/arm/kernel/linux/linux-3.x/linux3.t32 MENU.ReProgram ~~/demo/arm/kernel/linux/linux-3.x/linux.men ; Group kernel area to be displayed with red bar GROUP.Create "kernel" 0xC xFFFFFFFF /RED ENDDO Training Linux Debugging 34
35 The second example Linux script is also for the Pandaboard. We connect here to the target with the SYStem.Up command, we use the bootloader to initialize the target, we download the kernel, the ramdisk image and the device tree blob with the debugger and set the initial values for the CPU registers. RESet ; setup of ICD PRINT "initializing..." SYStem.CPU OMAP4430 SYStem.JtagClock CTCK 30MHz SYStem.Option DACR ON TrOnchip.Set DABORT OFF TrOnchip.Set PABORT OFF TrOnchip.Set UNDEF OFF SYStem.Option MMUSPACES ON SYStem.Up ; give Debugger global write permissions ; used by Linux for page miss! ; used by Linux for page miss! ; may be used by Linux for FPU detection ; enable space IDs to virtual addresses ; Open a serial terminal window DO ~~/demo/etc/terminal/serial/term.cmm COM SETUP.IMASKASM ON ; lock interrupts while single stepping ; Let the boot monitor set up the board Go PRINT "target setup..." WAIT 1.s Break ; Load the Linux kernel Data.LOAD.Elf vmlinux 0x xc /GNU /NoSymbol /NoREG Register.RESet ; Set PC on physical start address of the kernel code Register.Set PC 0x ; Set machine type in R1; see arch/arm/tools/mach-types Register.Set R ; Set R2 to the address of the device tree blob Register.Set R2 0x ; Download the device tree blob at 0x Data.LOAD.Binary omap4-panda.dtb 0x /NoClear ; Loading RAM disk Data.LOAD.Binary ramdisk.image.gz 0x /NoClear /NoSymbol ; Load the Linux kernel symbols into the debugger Data.LOAD.Elf vmlinux /GNU /NoCODE /STRIPPART 3. continued on next page. Training Linux Debugging 35
36 continued: ; Open a Code Window -- we like to see something WINPOS Data.List SCREEN PRINT "initializing debugger MMU..." MMU.FORMAT LINUX swapper_pg_dir 0xc xdfffffff 0x TRANSLATION.COMMON 0xbf ffffffff TRANSLATION.TableWalk ON TRANSlation.ON ; Initialize Linux Awareness PRINT "initializing multi task support..." ; loads Linux awareness: TASK.CONFIG ~~/demo/arm/kernel/linux/linux-3.x/linux3.t32 ; loads Linux menu: MENU.ReProgram ~~/demo/arm/kernel/linux/linux-3.x/linux.men Go WAIT 5.s Break ENDDO Training Linux Debugging 36

37 Debugging the Linux Components by TRACE32 Linux menu This chapter will show how to debug the different Linux components explained in the previous chapters. First you will see the easy handling by the special included Linux menu. 1. Debugging Linux Components 2. Linux specific Windows and Features 1.) Debugging Linux Components Each of the components used to build a Linux system needs a different handling for debugging. This chapter describes in detail, how to set up the debugger for the individual components. RTOS Debugger for Linux - Stop Mode (rtos_linux_stop.pdf) gives additional detailed instructions. 1.1) The Kernel Kernel Startup The bootloader jumps into the kernel startup routine. It starts at physical address space, does some initialization and sets up the MMU. Finally the kernel startup switches into virtual address space and does the rest of the initialization. The complete kernel startup is part of the vmlinux image. As a such, its symbols are bound to virtual addresses. So if you load the kernel symbols without specifying any address, you will see no symbol information: To debug the tiny startup sequence running in physical address range, you need to relocate the virtual symbols to the physical addresses: Data.LOAD.Elf vmlinux <phys. start addr>-<virtual start addr> /NoCODE Training Linux Debugging 37


38 E.g., if the kernel runs in virtual address 0xC , and the physical memory starts at 0x , you have to shift the addresses by 0x xC : Data.LOAD.Elf vmlinux 0x xC /NoCODE If the address extension has already been enabled (SYStem.Option MMUSPACES ON), then you need to declare the startup of the kernel as common area in the debugger translation table to be able to see the debug information. However, you have to undo this after the MMU is enabled. TRANSlation.COMMON 0x x8fffffff Now, you can see the symbol information: Please note that as long as the debugger MMU is not set up, it is recommended to use onchip breakpoints: Break.Set rest_init /Onchip Kernel Boot After enabling the MMU, the kernel startup code switches to virtual addresses. From now on, the Linux kernel runs completely in virtual address space. The symbols are all bound to these virtual addresses, so simply load the Linux symbols as they are. As already noted in a previous chapter, some structure information needs to be fixed by a clean-up Data.LOAD.Elf vmlinux /NoCODE symbol.cleanup ; load the kernel symbols ; get rid of useless symbols Training Linux Debugging 38


39 As already explained, the debugger needs to know the MMU translation map for the kernel, the address of the kernel translation table and the MMU format used by the kernel. By declaring the kernel range as COMMON, the loaded symbols will be displayed for all space IDs. MMU.FORMAT Linux swapper_pg_dir 0xC xC1FFFFFF 0x TRANSlation.COMMON 0xC xFFFFFFFF TRANSlation.ON For your convenience, you may mark the complete kernel address space with a red bar: GROUP.Create "kernel" 0xC xFFFFFFFF /RED You can use here software breakpoints since all the kernel code is already loaded and has a translation map: If the kernel does not boot correctly, you can look for the last message in the terminal window and debug the corresponding function. If you have no terminal output because the error happens before the serial console has been initialized or because there is a problem in the serial driver, you can use the TASK.DMESG command to display the kernel log buffer: Training Linux Debugging 39
 and a vmlinux and both files are not from the same build. This can lead to very strange results.")

40 Verifying image and symbols It is very important that the kernel running on the target is from the very same build as the symbol file loaded into the debugger. A typical error is to have a uimage loaded by the bootloader (e.g. from a memory card) and a vmlinux and both files are not from the same build. This can lead to very strange results. You can check if the kernel code matches the loaded symbols using the TASK.CHECK command. First let the kernel boot, stop the target and then execute TASK.CHECK. When the symbols does not match the kernel code, you will get an error message in this window: Example: debugging built-in device drivers Most of the built-in device drivers are registered in the initcall table. You can search for the label initcall_start (in newer Linux kernel versions initcall0_start, initcall1_start,...) in the symbol.browse window and view it as a fixed table: Training Linux Debugging 40


41 You will get a table with the start addresses of the device drivers init functions you can display the names of the functions by checking the symbol item in pointer category:. By selecting Display Memory and then Indirect List, you can display the source code of a specific function in the list: Please note that the kernel generally overwrites this table after booting. Training Linux Debugging 41


42 Example: trapping segmentation violation Segmentation violation happens if the code tries to access a memory location that cannot be mapped in an appropriate way. E.g. if a process tries to write to a read-only area or if the kernel tries to read from an non existent address. A segmentation violation is detected inside the kernel routine do_page_fault. Depending on the kernel version, if the mapping of the page fails, the kernel jumps to the label bad_area or do_user_fault / do_kernel_fault. To trap segmentation violation, we set a breakpoint in our example inside the function do_page_fault before do_user_fault is called and look to the structure regs which contains the complete register set at the location where the fault occurred. The register with the index 15 is the program counter which caused the segmentation violation and the register with the index 14 contains the return address. In out case the segmentation violation is caused by a branch to the address 0x0 which is caused by a zero function pointer. Training Linux Debugging 42


.")


43 1.2) Kernel Modules Kernel modules are loaded and linked into the kernel at run-time. To ease the debugging of kernel modules the enhanced Linux menu offers the item Debug Module on init... which waits until a module is loaded, and loads the symbols if the init function belongs to the wanted module name This Module Debugging menu depends on the autoloader function of the TRACE32 Linux awareness based on the autoloader script ( ~~/demo/<arch>/kernel/linux/<linux_version>/autoload.cmm ).. Remember that the kernel modules are part of the kernel address range and should be covered by TRANSlation.COMMON. Please note that the section addresses (and with them the possibility to debug kernel modules) for Linux kernel version 2.4 are only available under certain circumstances! See RTOS Debugger for Linux - Stop Mode (rtos_linux_stop.pdf), how to set up these prerequisites, and how to debug the initialization routine of a kernel module. Training Linux Debugging 43

44 After loading for example the kernel module demomod.ko by calling insmod demomod.ko entered into a terminal window you will see the code and source of demomod at the address of the modules init function. If you remove a kernel module from the kernel (with rmmod ), you should remove the symbols of the module from the debugger. TASK.sYmbol.DELeteMod "demomod" ; erase obsolete module symbols The demo directory contains a script file called mod_debug.cmm which has the same functionality as the menu item Debug Module on init... : DO ~~/demo/arm/kernel/linux/linux-3.x/mod_debug.cmm demomod Training Linux Debugging 44


45 1.3) Processes Debugging a process from the start You can configure the debugger to debug a process from its start. The Linux menu provides a comfortable way to debug processes from main. The process will be stopped right after the instruction at main is executed. (Due to the page fault handling the needed page could not be available until the CPU wants to execute the instruction at main.) Enter the name of the process to be (without parameters). By checking the send command to TERM window, the process will be started from the TERM window. You can also use the script app_debug.cmm available under ~~/demo/<arch>/kernel/linux/<linux_version> to debug processes on main e.g. DO ~~/demo/arm/kernel/linux/linux-3.x/app_debug.cmm hello Now after this preparation you can wait till the application reaches main of the given process. Internally a conditional software breakpoint is set on a specific kernel function. When this breakpoint is hit, TRACE32 checks if the specified process is already loaded. If so the debugger extracts the space ID and loads the symbols. At this stage, the code of the process has not yet been loaded so we can t set software breakpoints on the process code. We use instead here an onchip breakpoint to the first instruction after main() (e.g. main+4 or main\1). As soon as the process is started, the code will be loaded and executed and the breakpoint will be hit. Training Linux Debugging 45


46 Debugging a process started already You can also load the debug symbols of an already running process using the TRACE32 command TASK.sYmbol.LOAD TASK.sYmbol.LOAD sieve ; load process symbols The process symbols can also be loaded from the TRACE32 Linux menu Process Debugging -> Load Symbols... or per mouse click in the TASK.DTask or TASK.Process window. Training Linux Debugging 46

47 Symbol cleanup after process termination After the process hello exits its symbols are no more valid: You should delete the symbols with the following command: symbol.delete \\hello ; get rid of invalid symbols Training Linux Debugging 47


 Threads Threads are Linux tasks that share the same virtual memory space.")

48 Process Watch System Here is a process watch system available that watches for the creation and termination of specified processes. This watch system then loads and deletes symbols automatically and keeps the MMU in sync. See TASK.Watch in RTOS Debugger for Linux - Stop Mode (rtos_linux_stop.pdf) for details. Use the watch system and the menu to add and remove processes to be observed and synchronized to. Further exiting features of the TRACE32 Linux Awareness are shown in chapter Linux specific Windows and Features. 1.4) Threads Threads are Linux tasks that share the same virtual memory space. The Linux awareness assignes the space ID of the creating process to all threads of this process. Because symbols are bound to a specific space ID, they are automatically valid for all threads of the same process. There is no special handling for threads they are loaded when loading the process symbols. See chapter Processes how to load and handle these symbols. Training Linux Debugging 48


49 1.5) Libraries Libraries are loaded and linked dynamically to processes. Thus, they run in the virtual address space of the process and have dynamic addresses. To debug libraries, you can use the menu Library Debugging : You can also display first the task list by command TASK.DTask and then continue with double or rightclicks: You can also show the internal kernel structure for a selected library by selecting display library struct. Training Linux Debugging 49

50 In case you want to load or delete the symbols of the library and wish to update the MMU automatically by a script you have to use the following commands: TASK.sYmbol.LOADLib "helloloop" "ld so" ; load library symbols TASK.sYmbol.DELeteLib "\\ld so" ; erase library symbols Please remember to configure the autoloader for libraries! Training Linux Debugging 50
 using special TRACE32 commands. Several windows are available to display e.g. the process list. TASK.")

51 2.) Linux specific Windows and Features Display of system resources You can display different Linux resources (list of running tasks, kernel modules...) using special TRACE32 commands. Several windows are available to display e.g. the process list. TASK.PS displays the process table similar to the output of the ps shell command. TASK.DTask give you more detailed information. TASK.Process displays the processes with their threads. You can open all there window from the Linux menu or from the command line. Training Linux Debugging 51

52 Task Related Breakpoints You can set conditional breakpoints on shared code halting only if hit by a specified task Break.Set myfunction /TASK "mytask" If task related breakpoints are not supported by the core, the debugger will always stop on the breakpoint address and resume executing if the current task is not the specified one. Task Related Single Stepping If you debug shared code with HLL single step, which is based on breakpoints, a different task could hit the step-breakpoint. You can avoid this by using the following command: SETUP.StepWithinTask ON Conditional breakpoints on the current task will be then used for step into / step over and you will not leave the task that you want to debug. Training Linux Debugging 52


53 Task Context Display You can display the memory or the registers of a task which is not currently executing. Moreover, you can display the stack frame of any running task on the system. List /TASK "mytask" Register /TASK "mytask" Var.Frame /TASK "mytask" You can additionally virtually switch the context also from the TASK.DTask window by popup menu-item Switch Context : Training Linux Debugging 53
 but the PC where the task")

54 Switch to the helloloop task. It s not the current PC from the target ( main, process helloloop ) but the PC where the task helloloop will be continued! Care for the grey buttons. After the context switch you get the full wanted info. But it s not the current processor state. There is a pseudo PC bar (light red) showing the PC where process helloloop will be continued. Training Linux Debugging 54
55 Troubleshooting Most of the errors in Linux aware debugging are due to a wrong symbol information or to an incorrect setup of the debugger address translation. The loaded vmlinux file must match the kernel binary executed on the target. To verify if this is the case, you can perform the following steps: Load the vmlinux file to the debugger virtual memory (VM:) using the following command. Data.LOAD.Elf vmlinux AVM:0 Display the Linux banner string from the debugger VM or print it to the area window: Data AVM:linux_banner PRINT Data.STRING(AVM:linux_banner) Compare the Linux banner string with the output of the Linux command cat /proc/version. Both strings must be identical including the timestamps. Moreover, you need to make sure that the kernel was configured with CONFIG_DEBUG_INFO enabled and with CONFIG_DEBUG_INFO_REDUCED not set. The next point to check in case you are having trouble is if the debugger address translation is correctly set. Problems due to an incorrect setup of the debugger address translation especially show up when debugging kernel modules or debugging in the user-space. You need to check the following: Is the MMU Format set with the MMU.FORMAT command correct? Is the kernel logical address translation correct? To check this translation, you can use the command MMU.List.PageTable address with the kernel logical start address as parameter when the kernel has already booted e.g. MMU.List PageTable 0xC If you are still having trouble, please select the TRAC32 menu Help -> Support -> Systeminfo..., store your system information to a file and send this file together with your setup scripts as well as the content of the TASK.TEST window to rtoslinux-support@lauterbach.com Training Linux Debugging 55

56 Linux Trace Please note that this chapter does not contain information about general trace configuration and usage. It only points to the needed settings and conditions to achieve task aware trace for a target Linux system. Overview When tracing a system with virtual memory management where a single virtual address can correspond to different physical addresses, the trace tool (which gets from the on-chip trace module only the virtual address of the executed code) needs to know the current memory space for every trace time. If a data trace is available, the debugger ca trace the write accesses to the memory location which contains information about the current Linux task. If however no data trace is available, the debugger needs then a different trace mechanism to be aware of the context switches in the kernel. This is e.g. possible with the ETM Context ID trace for the ARM architecture or the Ownership Trace Messages for the nexus trace. Moreover, some processors have limited or no on-chip trace support. To get some trace information from such systems, it is possible to use kernel tracepoints to send trace data using special channels like dual port memory. Example 1: Context ID trace for ARM Some ARM processors does not have a data trace support. For such processors, the debugger uses the Context ID trace messages for task aware trace. The CONTEXTIDR register have to be written by the kernel on every task switch. Kernel versions older than 3.6 need to be patched to support tracing all Linux tasks. You can find more information about the patch in RTOS Debugger for Linux - Stop Mode (rtos_linux_stop.pdf) Appendix B. For kernels 3.6 and newer, you just need to enable Kernel hacking -> Write the current PID to the CONTEXTIDR register in the kernel configuration: To enable Context ID trace ETM.ContextID 32 and TASK.Option THRCTX have to be set. Training Linux Debugging 56

57 You can then display e.g. the task chart and statistics using the commands Trace.Chart.TASK and Trace.STATistic.TASK: Example 2: Using the LOGGER for task switch trace Some processors do not have any on-chip trace support like the PowerPC P2020. We will write in this example for an SMP Linux running on the P2020 a kernel module that uses the kernel tracepoints and registers a probe function logger_sched_switch on the kernel scheduler tracer. This probe function is called on every task switch and writes the trace data in special TRACE32 format to a buffer. After stopping the debugger reads the buffer and displays the task switches with timing information Kernel module logger.ko. #include <linux/module.h> #include <linux/sched.h> #include <linux/tracepoint.h> #include <trace/events/sched.h> #include <linux/smp.h> volatile int T32_TraceEnable = 0; // will be set by the debugger volatile int T32_Magic[2] = {0, 0}; // will be set by the debugger typedef struct { unsigned long tshigh;/* high part of timestamp and cycle info */ unsigned long tslow; /* low part of timestamp */ unsigned long address; unsigned long data; } T32_loggerData; #define T32_LOGGER_SIZE 1024 extern T32_loggerData T32_LoggerBuffer[]; Training Linux Debugging 57
58 struct { T32_loggerData * ptr; /* pointer to trace data */ long size; /* size of trace buffer */ volatile long index; /* current write pointer */ long tindex; /* index of trigger record */ long iflags; /* incoming flags, Bit 0: ARM, Bit 8: Stack Mode */ long oflags; /* out. flags, Bit 0: Overflow, Bit 8: Trigger, Bit 9: Break */ long reserved1; long reserved2; T32_loggerData buffer[t32_logger_size]; } T32_LoggerStruct; static void T32_LoggerInit(void) { T32_LoggerStruct.ptr = T32_LoggerStruct.buffer; T32_LoggerStruct.size = T32_LOGGER_SIZE; } unsigned long GetTBL(void) { unsigned long tb; asm volatile ("mftb %0": "=r" (tb)); return tb; } void T32_LoggerDataFunc(int cycle, void* addr, unsigned long data, int core) { int index; if (!(T32_LoggerStruct.iflags & 0x01)) return; if (T32_LoggerStruct.index >= T32_LoggerStruct.size) { if (T32_LoggerStruct.iflags & 0x100) return; T32_LoggerStruct.oflags = 0x01; T32_LoggerStruct.index = 0; } } index = T32_LoggerStruct.index++; T32_LoggerStruct.ptr[index].tslow = GetTBL(); T32_LoggerStruct.ptr[index].tshigh = (cycle << 24) (core << 16); T32_LoggerStruct.ptr[index].address = (unsigned long) addr; T32_LoggerStruct.ptr[index].data = data; T32_LoggerStruct.index = index + 1; void T32_LoggerTrigger(void) { if (T32_LoggerStruct.oflags & 0x100) return; T32_LoggerStruct.tindex = T32_LoggerStruct.index; T32_LoggerStruct.oflags = 0x100; } Training Linux Debugging 58
59 static void logger_sched_switch(void *ignore, struct task_struct *prev, struct task_struct *next) { int cpu = smp_processor_id(); if (!T32_TraceEnable) return; } T32_LoggerDataFunc(0x34, (void *)T32_Magic[cpu], (unsigned long)next, cpu); static int init logger_init(void) { T32_LoggerInit(); return register_trace_sched_switch(logger_sched_switch, NULL); } static void exit logger_exit(void) { unregister_trace_sched_switch(logger_sched_switch, NULL); } module_init(logger_init) module_exit(logger_exit) MODULE_LICENSE("GPL"); MODULE_AUTHOR("Khaled Jmal"); MODULE_DESCRIPTION("Logger trace module"); The following scripts then insert the module, enable and configure the trace: IF!RUN() Go TERM.OUT "insmod logger.ko" 10. ; insert the logger module WAIT 1.s Break TASK.SYMBOL.LOADMod "logger" ; load the module symbols MMU.SCAN ALL LOGGER.ADDRESS T32_LoggerStruct LOGGER.Mode E ON Trace.METHOD LOGGER ; select logger as default trace method LOGGER.TimeStamp UP LOGGER.Init CORE.SELECT 1 &magic=task.config(magic) Var T32_Magic[1]=&magic CORE.SELECT 0 &magic=task.config(magic) Var T32_Magic[0]=&magic LOGGER Var T32_TraceEnable=1 ; enable the trace Training Linux Debugging 59

60 We can then display the exact task switches on both cores using the Trace.Chart.TASK command: Training Linux Debugging 60
Training Linux Debugging for Intel x86/x64
 Training Linux Debugging for Intel x86/x64 TRACE32 Online Help TRACE32 Directory TRACE32 Index TRACE32 Training... Training Intel x86/x64... Training Linux Debugging for Intel x86/x64... 1 Prolog... 4
RTOS Debugger for Linux - Run Mode
 RTOS Debugger for Linux - Run Mode TRACE32 Online Help TRACE32 Directory TRACE32 Index TRACE32 Documents... RTOS Debuggers... RTOS Debugger for Linux... RTOS Debugger for Linux - Run Mode... 1 Debugging
Training Android Debugging
 Training Android Debugging TRACE32 Online Help TRACE32 Directory TRACE32 Index TRACE32 Training... Training Android Debugging... Training Android Debugging... 1 Introduction... 2 Basic terms on Android...
RTOS Debugger for QNX - Run Mode
 RTOS Debugger for QNX - Run Mode TRACE32 Online Help TRACE32 Directory TRACE32 Index TRACE32 Documents... RTOS Debuggers... RTOS Debugger for QNX - Run Mode... 1 Basic Concepts... 2 pdebug... 2 Switching
Run Mode Debugging Manual Symbian
 Run Mode Debugging Manual Symbian TRACE32 Online Help TRACE32 Directory TRACE32 Index TRACE32 Documents... OS Awareness Manuals... OS Awareness and Run Mode Debugging for Symbian... Run Mode Debugging
Hypervisor Awareness for Wind River Hypervisor
 Hypervisor Awareness for Wind River Hypervisor TRACE32 Online Help TRACE32 Directory TRACE32 Index TRACE32 Documents... Hypervisor Support... Hypervisor Awareness for Wind River Hypervisor... 1 Overview...
Integration for exdi2 on Windows CE Platform Builder
 Integration for exdi2 on Windows CE Platform Builder TRACE32 Online Help TRACE32 Directory TRACE32 Index TRACE32 Documents... 3rd Party Tool Integrations... Integration for exdi2 on Windows CE Platform
TRACE32 Debugger Getting Started... ICD Tutorial About the Tutorial... 2
 ICD Tutorial TRACE32 Online Help TRACE32 Directory TRACE32 Index TRACE32 Debugger Getting Started... ICD Tutorial... 1 About the Tutorial... 2 Working with the Debugger... 3 Set up the Program Environment
RTOS Debugger for Windows Standard
 RTOS Debugger for Windows Standard TRACE32 Online Help TRACE32 Directory TRACE32 Index TRACE32 Documents... RTOS Debuggers... RTOS Debugger for Windows Standard... 1 Overview... 4 Brief Overview of Documents
OS Awareness Manual OSE Delta
 OS Awareness Manual OSE Delta TRACE32 Online Help TRACE32 Directory TRACE32 Index TRACE32 Documents... OS Awareness Manuals... OS Awareness Manual OSE Delta... 1 History... 3 Overview... 3 Brief Overview
PathFinder-XD for MIPS Powered Devices. Simulator
 v.1.0.6, 15 th January 2013 PathFinder-XD for MIPS Powered Devices Simulator Contents 1. Introduction 2 2. Installation 2 2.1 Windows Installation 2 2.2 Linux Installation 2 3. Using PathFinder-XD with
NEW CEIBO DEBUGGER. Menus and Commands
 NEW CEIBO DEBUGGER Menus and Commands Ceibo Debugger Menus and Commands D.1. Introduction CEIBO DEBUGGER is the latest software available from Ceibo and can be used with most of Ceibo emulators. You will
Hardware OS & OS- Application interface
 CS 4410 Operating Systems Hardware OS & OS- Application interface Summer 2013 Cornell University 1 Today How my device becomes useful for the user? HW-OS interface Device controller Device driver Interrupts
Application Note for the SNOOPer Trace
 Application Note for the SNOOPer Trace TRACE32 Online Help TRACE32 Directory TRACE32 Index TRACE32 Documents... Trace Analysis... Trace Application Notes... Application Note for the SNOOPer Trace... 1
16 Sharing Main Memory Segmentation and Paging
 Operating Systems 64 16 Sharing Main Memory Segmentation and Paging Readings for this topic: Anderson/Dahlin Chapter 8 9; Siberschatz/Galvin Chapter 8 9 Simple uniprogramming with a single segment per
What are Exceptions? EE 457 Unit 8. Exception Processing. Exception Examples 1. Exceptions What Happens When Things Go Wrong
 8. 8.2 What are Exceptions? EE 457 Unit 8 Exceptions What Happens When Things Go Wrong Exceptions are rare events triggered by the hardware and forcing the processor to execute a software handler Similar
Lec 22: Interrupts. Kavita Bala CS 3410, Fall 2008 Computer Science Cornell University. Announcements
 Lec 22: Interrupts Kavita Bala CS 3410, Fall 2008 Computer Science Cornell University HW 3 HW4: due this Friday Announcements PA 3 out Nov 14 th Due Nov 25 th (feel free to turn it in early) Demos and
Contents. Cortex M On-Chip Emulation. Technical Notes V
 _ Technical Notes V9.12.225 Cortex M On-Chip Emulation Contents Contents 1 1 Introduction 2 2 Access Breakpoints 3 3 Trace 5 4 NXP LPC 5 4.1 Boot and Memory Remapping 5 4.2 LPC17xx Startup 5 4.1 LPC11A02/04
Announcement. Exercise #2 will be out today. Due date is next Monday
 Announcement Exercise #2 will be out today Due date is next Monday Major OS Developments 2 Evolution of Operating Systems Generations include: Serial Processing Simple Batch Systems Multiprogrammed Batch
Templates what and why? Beware copying classes! Templates. A simple example:
 Beware copying classes! Templates what and why? class A { private: int data1,data2[5]; float fdata; public: // methods etc. } A a1,a2; //some work initializes a1... a2=a1; //will copy all data of a2 into
CSE 153 Design of Operating Systems
 CSE 153 Design of Operating Systems Winter 19 Lecture 3: OS model and Architectural Support Last time/today Historic evolution of Operating Systems (and computing!) Today: We start our journey in exploring
Debugging uclinux on Coldfire
 Debugging uclinux on Coldfire By David Braendler davidb@emsea-systems.com What is uclinux? uclinux is a version of Linux for CPUs without virtual memory or an MMU (Memory Management Unit) and is typically
Native Process Debugger
 Native Process Debugger TRACE32 Online Help TRACE32 Directory TRACE32 Index TRACE32 Documents... Native Process Debugger... 1 Operation Theory... 3 Quick Start... 4 Starting a new process 4 Attach to a
Chapter 8: Main Memory
 Chapter 8: Main Memory Chapter 8: Memory Management Background Swapping Contiguous Memory Allocation Segmentation Paging Structure of the Page Table Example: The Intel 32 and 64-bit Architectures Example:
EE 457 Unit 8. Exceptions What Happens When Things Go Wrong
 1 EE 457 Unit 8 Exceptions What Happens When Things Go Wrong 2 What are Exceptions? Exceptions are rare events triggered by the hardware and forcing the processor to execute a software handler HW Interrupts
Debugging NMF Applications with TRACE32
 Debugging NMF Applications with TRACE32 TRACE32 Online Help TRACE32 Directory TRACE32 Index TRACE32 Documents... ICD In-Circuit Debugger... Processor Architecture Manuals... MMDSP... MMDSP Application
The Kernel Abstraction
 The Kernel Abstraction Debugging as Engineering Much of your time in this course will be spent debugging In industry, 50% of software dev is debugging Even more for kernel development How do you reduce
Chapter 8: Memory-Management Strategies
 Chapter 8: Memory-Management Strategies Chapter 8: Memory Management Strategies Background Swapping Contiguous Memory Allocation Segmentation Paging Structure of the Page Table Example: The Intel 32 and
TRACE32 Documents... TRACE32 Instruction Set Simulators... Simulator for Z TRACE32 Simulator License Quick Start of the Simulator...
 Simulator for Z80+ TRACE32 Online Help TRACE32 Directory TRACE32 Index TRACE32 Documents... TRACE32 Instruction Set Simulators... Simulator for Z80+... 1 TRACE32 Simulator License... 3 Quick Start of the
15 Sharing Main Memory Segmentation and Paging
 Operating Systems 58 15 Sharing Main Memory Segmentation and Paging Readings for this topic: Anderson/Dahlin Chapter 8 9; Siberschatz/Galvin Chapter 8 9 Simple uniprogramming with a single segment per
Memory management. Last modified: Adaptation of Silberschatz, Galvin, Gagne slides for the textbook Applied Operating Systems Concepts
 Memory management Last modified: 26.04.2016 1 Contents Background Logical and physical address spaces; address binding Overlaying, swapping Contiguous Memory Allocation Segmentation Paging Structure of
CHAPTER 8 - MEMORY MANAGEMENT STRATEGIES
 CHAPTER 8 - MEMORY MANAGEMENT STRATEGIES OBJECTIVES Detailed description of various ways of organizing memory hardware Various memory-management techniques, including paging and segmentation To provide
CS354 gdb Tutorial Written by Chris Feilbach
 CS354 gdb Tutorial Written by Chris Feilbach Purpose This tutorial aims to show you the basics of using gdb to debug C programs. gdb is the GNU debugger, and is provided on systems that
Simulator for H8/300, H8/300H and H8S
 Simulator for H8/300, H8/300H and H8S TRACE32 Online Help TRACE32 Directory TRACE32 Index TRACE32 Documents... TRACE32 Instruction Set Simulators... Simulator for H8/300, H8/300H and H8S... 1 TRACE32 Simulator
Using kgdb and the kgdb Internals
 Using kgdb and the kgdb Internals Jason Wessel jason.wessel@windriver.com Tom Rini trini@kernel.crashing.org Amit S. Kale amitkale@linsyssoft.com Using kgdb and the kgdb Internals by Jason Wessel by Tom
Tracking the Virtual World
 Tracking the Virtual World Synopsys: For many years the JTAG interface has been used for ARM-based SoC debugging. With this JTAG style debugging, the developer has been granted the ability to debug software
Chapter 8: Main Memory. Operating System Concepts 9 th Edition
 Chapter 8: Main Memory Silberschatz, Galvin and Gagne 2013 Chapter 8: Memory Management Background Swapping Contiguous Memory Allocation Segmentation Paging Structure of the Page Table Example: The Intel
Memory Management. Disclaimer: some slides are adopted from book authors slides with permission 1
 Memory Management Disclaimer: some slides are adopted from book authors slides with permission 1 CPU management Roadmap Process, thread, synchronization, scheduling Memory management Virtual memory Disk
Introduction p. 1 Why Linux? p. 2 Embedded Linux Today p. 3 Open Source and the GPL p. 3 Free Versus Freedom p. 4 Standards and Relevant Bodies p.
 Foreword p. xix Preface p. xxi Acknowledgments p. xxvii About the Author p. xxix Introduction p. 1 Why Linux? p. 2 Embedded Linux Today p. 3 Open Source and the GPL p. 3 Free Versus Freedom p. 4 Standards
Chapter 2 Operating-System Structures
 This chapter will discuss the following concepts: 2.1 Operating System Services 2.2 User Operating System Interface 2.3 System Calls 2.4 System Programs 2.5 Operating System Design and Implementation 2.6
Overview. This Lecture. Interrupts and exceptions Source: ULK ch 4, ELDD ch1, ch2 & ch4. COSC440 Lecture 3: Interrupts 1
 This Lecture Overview Interrupts and exceptions Source: ULK ch 4, ELDD ch1, ch2 & ch4 COSC440 Lecture 3: Interrupts 1 Three reasons for interrupts System calls Program/hardware faults External device interrupts
Chapter 8: Main Memory
 Chapter 8: Main Memory Silberschatz, Galvin and Gagne 2013 Chapter 8: Memory Management Background Swapping Contiguous Memory Allocation Segmentation Paging Structure of the Page Table Example: The Intel
RTOS Debugger for CMX
 RTOS Debugger for CMX TRACE32 Online Help TRACE32 Directory TRACE32 Index TRACE32 Documents... RTOS Debuggers... RTOS Debugger for CMX... 1 Overview... 2 Brief Overview of Documents for New Users... 3
CMSC 313 COMPUTER ORGANIZATION & ASSEMBLY LANGUAGE PROGRAMMING LECTURE 09, SPRING 2013
 CMSC 313 COMPUTER ORGANIZATION & ASSEMBLY LANGUAGE PROGRAMMING LECTURE 09, SPRING 2013 TOPICS TODAY I/O Architectures Interrupts Exceptions FETCH EXECUTE CYCLE 1.7 The von Neumann Model This is a general
Recall: Address Space Map. 13: Memory Management. Let s be reasonable. Processes Address Space. Send it to disk. Freeing up System Memory
 Recall: Address Space Map 13: Memory Management Biggest Virtual Address Stack (Space for local variables etc. For each nested procedure call) Sometimes Reserved for OS Stack Pointer Last Modified: 6/21/2004
HCS12 BDM Getting Started V4.3
 HCS12 BDM Getting Started V4.3 Background The term BDM stands for Background Debug Mode. It is used for the system development and FLASH programming. A BDM firmware is implemented on the CPU silicon providing
ECE 598 Advanced Operating Systems Lecture 10
 ECE 598 Advanced Operating Systems Lecture 10 Vince Weaver http://web.eece.maine.edu/~vweaver vincent.weaver@maine.edu 22 February 2018 Announcements Homework #5 will be posted 1 Blocking vs Nonblocking
CHAPTER 8: MEMORY MANAGEMENT. By I-Chen Lin Textbook: Operating System Concepts 9th Ed.
 CHAPTER 8: MEMORY MANAGEMENT By I-Chen Lin Textbook: Operating System Concepts 9th Ed. Chapter 8: Memory Management Background Swapping Contiguous Memory Allocation Segmentation Paging Structure of the
Embedded Linux Architecture
 Embedded Linux Architecture Types of Operating Systems Real-Time Executive Monolithic Kernel Microkernel Real-Time Executive For MMU-less processors The entire address space is flat or linear with no memory
Chapter 8: Memory- Management Strategies. Operating System Concepts 9 th Edition
 Chapter 8: Memory- Management Strategies Operating System Concepts 9 th Edition Silberschatz, Galvin and Gagne 2013 Chapter 8: Memory Management Strategies Background Swapping Contiguous Memory Allocation
Chapter 8 Memory Management
 Chapter 8 Memory Management Da-Wei Chang CSIE.NCKU Source: Abraham Silberschatz, Peter B. Galvin, and Greg Gagne, "Operating System Concepts", 9th Edition, Wiley. 1 Outline Background Swapping Contiguous
Operating Systems CMPSCI 377 Spring Mark Corner University of Massachusetts Amherst
 Operating Systems CMPSCI 377 Spring 2017 Mark Corner University of Massachusetts Amherst Last Class: Intro to OS An operating system is the interface between the user and the architecture. User-level Applications
Booting a LEON system over SpaceWire RMAP. Application note Doc. No GRLIB-AN-0002 Issue 2.1
 Template: GQMS-TPLT-1-1-0 Booting a LEON system over SpaceWire RMAP Application note 2017-05-23 Doc. No Issue 2.1 Date: 2017-05-23 Page: 2 of 11 CHANGE RECORD Issue Date Section / Page Description 1.0
This training session will cover the Translation Look aside Buffer or TLB
 This training session will cover the Translation Look aside Buffer or TLB I will cover: What It is How to initialize it And How TLB exceptions are handled 1 First let me explain what we are dealing with:
TMS320LF240x-A Flash Programming
 TMS320LF240x-A Flash Programming Serial Port Flash Programming Utility Table of Contents 1. Introduction... 4 1.1. Overview... 4 2. Operation... 4 2.1. DSP Controller Initialization... 4 2.2. Kernel Transfer...
Anne Bracy CS 3410 Computer Science Cornell University
 Anne Bracy CS 3410 Computer Science Cornell University The slides were originally created by Deniz ALTINBUKEN. P&H Chapter 4.9, pages 445 452, appendix A.7 Manages all of the software and hardware on the
* What are the different states for a task in an OS?
 * Kernel, Services, Libraries, Application: define the 4 terms, and their roles. The kernel is a computer program that manages input/output requests from software, and translates them into data processing
OS Awareness Manual Sciopta
 OS Awareness Manual Sciopta TRACE32 Online Help TRACE32 Directory TRACE32 Index TRACE32 Documents... OS Awareness Manuals... OS Awareness Manual Sciopta... 1 History... 2 Overview... 2 Brief Overview of
Definition: An operating system is the software that manages resources
 13-1 Operating Systems 13-1 Definition: An operating system is the software that manages resources in a computer. Resources A resource is (usually) hardware that needs to be accessed. There are rules for
TDT 1.2 Release Notes and FAQ March 2002
 TDT 1.2 Release Notes and FAQ March 2002 This document gives additional information about the use of the ARM Trace Debug Tools TDT 1.2 (build 1031) For more information, please see the Trace Debug Tools
Process Description and Control. Chapter 3
 Process Description and Control Chapter 3 Contents Process states Process description Process control Unix process management Process From processor s point of view execute instruction dictated by program
Anne Bracy CS 3410 Computer Science Cornell University
 Anne Bracy CS 3410 Computer Science Cornell University The slides were originally created by Deniz ALTINBUKEN. P&H Chapter 4.9, pages 445 452, appendix A.7 Manages all of the software and hardware on the
CPS221 Lecture: Operating System Functions
 CPS221 Lecture: Operating System Functions Objectives last revised 6/23/10 1. To overview key hardware concepts 2. To iintroduce the process concept 3. To discuss the various kinds of functionality of
Last 2 Classes: Introduction to Operating Systems & C++ tutorial. Today: OS and Computer Architecture
 Last 2 Classes: Introduction to Operating Systems & C++ tutorial User apps OS Virtual machine interface hardware physical machine interface An operating system is the interface between the user and the
RTOS Debugger for RTX-ARM
 RTOS Debugger for RTX-ARM TRACE32 Online Help TRACE32 Directory TRACE32 Index TRACE32 Documents... RTOS Debuggers... RTOS Debugger for RTX-ARM... 1 Overview... 2 Brief Overview of Documents for New Users...
Operating Systems. Operating System Structure. Lecture 2 Michael O Boyle
 Operating Systems Operating System Structure Lecture 2 Michael O Boyle 1 Overview Architecture impact User operating interaction User vs kernel Syscall Operating System structure Layers Examples 2 Lower-level
13-2 EE 4770 Lecture Transparency. Formatted 8:18, 13 March 1998 from lsli
 13-1 13-1 Operating Systems Definition: An operating system is the software that manages resources in a computer. Resources A resource is (usually) hardware that needs to be accessed. There are rules for
ARM Cortex-A9 + FPGA CPU Module Ultra Line. Bora Embedded Linux Kit (BELK) Trace on the Bora AMP (Linux + FreeRTOS) system
 Trace on the Bora AMP (Linux + FreeRTOS) system") ARM Cortex-A9 + FPGA CPU Module Ultra Line Bora Embedded Linux Kit (BELK) AN-BELK-002 Trace on the Bora AMP (Linux + FreeRTOS) system DAVE Embedded Systems www.dave.eu info@dave.eu
ARM Cortex-A9 + FPGA CPU Module Ultra Line Bora Embedded Linux Kit (BELK) AN-BELK-002 Trace on the Bora AMP (Linux + FreeRTOS) system DAVE Embedded Systems www.dave.eu info@dave.eu
ARM CORTEX-R52. Target Audience: Engineers and technicians who develop SoCs and systems based on the ARM Cortex-R52 architecture.
 ARM CORTEX-R52 Course Family: ARMv8-R Cortex-R CPU Target Audience: Engineers and technicians who develop SoCs and systems based on the ARM Cortex-R52 architecture. Duration: 4 days Prerequisites and related
April 4, 2001: Debugging Your C24x DSP Design Using Code Composer Studio Real-Time Monitor
 1 This presentation was part of TI s Monthly TMS320 DSP Technology Webcast Series April 4, 2001: Debugging Your C24x DSP Design Using Code Composer Studio Real-Time Monitor To view this 1-hour 1 webcast
Debugging in AVR32 Studio
 Embedded Systems for Mechatronics 1, MF2042 Tutorial Debugging in AVR32 Studio version 2011 10 04 Debugging in AVR32 Studio Debugging is a very powerful tool if you want to have a deeper look into your
MASSACHUSETTS INSTITUTE OF TECHNOLOGY Computer Systems Engineering: Spring Quiz I Solutions
 Department of Electrical Engineering and Computer Science MASSACHUSETTS INSTITUTE OF TECHNOLOGY 6.033 Computer Systems Engineering: Spring 2011 Quiz I Solutions There are 10 questions and 12 pages in this
Virtual Memory 1. Virtual Memory
 Virtual Memory 1 Virtual Memory key concepts virtual memory, physical memory, address translation, MMU, TLB, relocation, paging, segmentation, executable file, swapping, page fault, locality, page replacement
Virtual Memory 1. Virtual Memory
 Virtual Memory 1 Virtual Memory key concepts virtual memory, physical memory, address translation, MMU, TLB, relocation, paging, segmentation, executable file, swapping, page fault, locality, page replacement
Efficient and Large Scale Program Flow Tracing in Linux. Alexander Shishkin, Intel
 Efficient and Large Scale Program Flow Tracing in Linux Alexander Shishkin, Intel 16.09.2013 Overview Program flow tracing - What is it? - What is it good for? Intel Processor Trace - Features / capabilities
9/19/18. COS 318: Operating Systems. Overview. Important Times. Hardware of A Typical Computer. Today CPU. I/O bus. Network
 Important Times COS 318: Operating Systems Overview Jaswinder Pal Singh and a Fabulous Course Staff Computer Science Department Princeton University (http://www.cs.princeton.edu/courses/cos318/) u Precepts:
The UtePC/Yalnix Memory System
 The UtePC/Yalnix Memory System This document describes the UtePC memory management hardware subsystem and the operations that your Yalnix kernel must perform to control it. Please refer to Handout 3 for
Process Time. Steven M. Bellovin January 25,
 Multiprogramming Computers don t really run multiple programs simultaneously; it just appears that way Each process runs to completion, but intermixed with other processes Process 1 6 ticks Process 2 Process
Training Simulator and Demo Software
 Training Simulator and Demo Software TRACE32 Online Help TRACE32 Directory TRACE32 Index TRACE32 Training... Training Simulator and Demo Software... 1 About the Demo... 2 Starting the TRACE32 Simulator...
ECE 471 Embedded Systems Lecture 5
 ECE 471 Embedded Systems Lecture 5 Vince Weaver http://web.eece.maine.edu/~vweaver vincent.weaver@maine.edu 13 September 2016 HW#2 is due Thursday It is going OK? Announcements 1 Homework #1 Review Characteristics
Windows Interrupts
 Windows 2000 - Interrupts Ausgewählte Betriebssysteme Institut Betriebssysteme Fakultät Informatik 1 Interrupts Software and Hardware Interrupts and Exceptions Kernel installs interrupt trap handlers Interrupt
CS370 Operating Systems
 CS370 Operating Systems Colorado State University Yashwant K Malaiya Spring 2018 L20 Virtual Memory Slides based on Text by Silberschatz, Galvin, Gagne Various sources 1 1 Questions from last time Page
Syscalls, exceptions, and interrupts, oh my!
 Syscalls, exceptions, and interrupts, oh my! Hakim Weatherspoon CS 3410 Computer Science Cornell University [Altinbuken, Weatherspoon, Bala, Bracy, McKee, and Sirer] Announcements P4-Buffer Overflow is
Chapter 4. Enhancing ARM7 architecture by embedding RTOS
 Chapter 4 Enhancing ARM7 architecture by embedding RTOS 4.1 ARM7 architecture 4.2 ARM7TDMI processor core 4.3 Embedding RTOS on ARM7TDMI architecture 4.4 Block diagram of the Design 4.5 Hardware Design
Memory Management. Disclaimer: some slides are adopted from book authors slides with permission 1
 Memory Management Disclaimer: some slides are adopted from book authors slides with permission 1 Recap Paged MMU: Two main Issues Translation speed can be slow TLB Table size is big Multi-level page table
THE PROCESS ABSTRACTION. CS124 Operating Systems Winter , Lecture 7
 THE PROCESS ABSTRACTION CS124 Operating Systems Winter 2015-2016, Lecture 7 2 The Process Abstraction Most modern OSes include the notion of a process Term is short for a sequential process Frequently
RTOS Debugger for LynxOS
 RTOS Debugger for LynxOS TRACE32 Online Help TRACE32 Directory TRACE32 Index TRACE32 Documents... RTOS Debuggers... RTOS Debugger for LynxOS... 1 Overview... 3 Brief Overview of Documents for New Users...
Section 1: Tools. Contents CS162. January 19, Make More details about Make Git Commands to know... 3
 CS162 January 19, 2017 Contents 1 Make 2 1.1 More details about Make.................................... 2 2 Git 3 2.1 Commands to know....................................... 3 3 GDB: The GNU Debugger
1 Do not confuse the MPU with the Nios II memory management unit (MMU). The MPU does not provide memory mapping or management.
. The MPU does not provide memory mapping or management.") Nios II MPU Usage March 2010 AN-540-1.0 Introduction This application note covers the basic features of the Nios II processor s optional memory protection unit (MPU), describing how to use it without the
Nios II MPU Usage March 2010 AN-540-1.0 Introduction This application note covers the basic features of the Nios II processor s optional memory protection unit (MPU), describing how to use it without the
The Early System Start-Up Process. Group Presentation by: Tianyuan Liu, Caiwei He, Krishna Parasuram Srinivasan, Wenbin Xu
 The Early System Start-Up Process Group Presentation by: Tianyuan Liu, Caiwei He, Krishna Parasuram Srinivasan, Wenbin Xu 1 Boot Process Booting is the initialization of a computerized system In Linux,
B. V. Patel Institute of Business Management, Computer &Information Technology, UTU
 BCA-3 rd Semester 030010304-Fundamentals Of Operating Systems Unit: 1 Introduction Short Answer Questions : 1. State two ways of process communication. 2. State any two uses of operating system according
CS 326: Operating Systems. Process Execution. Lecture 5
 CS 326: Operating Systems Process Execution Lecture 5 Today s Schedule Process Creation Threads Limited Direct Execution Basic Scheduling 2/5/18 CS 326: Operating Systems 2 Today s Schedule Process Creation
Protection and System Calls. Otto J. Anshus
 Protection and System Calls Otto J. Anshus Protection Issues CPU protection Prevent a user from using the CPU for too long Throughput of jobs, and response time to events (incl. user interactive response
TRACE32 Documents... ICD In-Circuit Debugger... Processor Architecture Manuals... TriCore... TriCore Monitor... 1
 TriCore Monitor TRACE32 Online Help TRACE32 Directory TRACE32 Index TRACE32 Documents... ICD In-Circuit Debugger... Processor Architecture Manuals... TriCore... TriCore Monitor... 1 Brief Overview of Documents
ECE 550D Fundamentals of Computer Systems and Engineering. Fall 2017
 ECE 550D Fundamentals of Computer Systems and Engineering Fall 2017 The Operating System (OS) Prof. John Board Duke University Slides are derived from work by Profs. Tyler Bletsch and Andrew Hilton (Duke)
CSE 153 Design of Operating Systems Fall 18
 CSE 153 Design of Operating Systems Fall 18 Lecture 2: OS model and Architectural Support Last time/today l Historic evolution of Operating Systems (and computing!) l Today: We start our journey in exploring
GDB Tutorial. A Walkthrough with Examples. CMSC Spring Last modified March 22, GDB Tutorial
 A Walkthrough with Examples CMSC 212 - Spring 2009 Last modified March 22, 2009 What is gdb? GNU Debugger A debugger for several languages, including C and C++ It allows you to inspect what the program
File Systems. OS Overview I/O. Swap. Management. Operations CPU. Hard Drive. Management. Memory. Hard Drive. CSI3131 Topics. Structure.
 File Systems I/O Management Hard Drive Management Virtual Memory Swap Memory Management Storage and I/O Introduction CSI3131 Topics Process Management Computing Systems Memory CPU Peripherals Processes
Memory Management. Disclaimer: some slides are adopted from book authors slides with permission 1
 Memory Management Disclaimer: some slides are adopted from book authors slides with permission 1 Demand paging Concepts to Learn 2 Abstraction Virtual Memory (VM) 4GB linear address space for each process
18-349: Introduction to Embedded Real-Time Systems
 18-349: Introduction to Embedded Real-Time Systems Embedded Real-Time Systems Lecture 6: Timers and Interrupts Anthony Rowe Electrical and Computer Engineering Carnegie Mellon University Embedded Real-Time