Syed RH Rizvi.
|
|
|
- Bernadette Loren Haynes
- 5 years ago
- Views:
Transcription

1 Community Tools: gen_be Syed RH Rizvi National Center For Atmospheric Research NCAR/ESSL/MMM, Boulder, CO-80307, USA 0
2 Talk overview What is gen_be? How it works? Some technical details Important namelist options scripts and graphics gen_be diagnostics for CON200 and T8 domain 1
3 What is gen_be? It computes different components of background error (BE) statistics for WRF-ARW model It may produce BE both for WRFDA and GSI It is designed to work either for NMC or Ensemble (ENS) method It is available with WRFDA package and resides in gen_be subdirectory under its main directory 2
4 How gen_be works? After configuring wrfda, all the desired executables may be built using./compile all_wrfvar command It works in three stages (stage0, stage1 and stage2) These three stages needs to be executed in the same order Each stage has its own corresponding parallel script which is executed via a suitable wrapper script 3
5 gen_be Stage0: It executes gen_be_stage0_gsi.f90 code Main function: Process WRF-ARW forecasts and output the desired info about the domain configuration Convert horizontal wind components (U,V) to stream function and velocity potential (Ψ,χ) Forms desired perturbations depending on whether NMC or ENS method to be used 4
6 gen_be Stage1: It executes gen_be_stage1_gsi.f90 code Its main function is to remove the temporal mean for NMC method 5
7 gen_be Stage2: It executes gen_be_stage2_gsi.f90 code Its main function is to compute the following: Regression coefficients for velocity potential (χ), temperature (t) and surface pressure (ps) Unbalanced parts of χ, t and ps Variance of all the control variables Horizontal and vertical length-scales of the control variables Variance of relative humidity (rh) in 5% bins of mean rh 6
8 Some technical details about gen_be Horizontal length-scale (L) are computed following Wan Shu et al. (MWR, 2002) L = 8 *Variance(X) Variance{ 2 (X)} 1 4 For each sigma level (l), vertical length-scale (VL) is computed using vertical error covariance (vcor) for each sigma level level with adjacent level just below this level as follows: 1 VL(l) = abs[2 vcor(l) vcor(l + 1)] Regression coefficients for χ are latitude dependent. However for t and ps, it does not vary with latitude Vertical length-scales do not vary with latitude. Horizontal length-scales and variance varies with latitude 1/2 7
9 Important namelist options Variable Name Type Default Option Description BE_METHOD Character NMC Method of computing BE statistics NMC or ENS, the ensemble based POISSON_METHOD Integer 1 Method for Poisson solver 1 Spectral 2 Relaxation FFT_METHOD Integer 2 Fast Fourier Transform 1 - Cosine 2 - Sine FSTAT Logical False Includes the contribution of coriolis parameter effect for temperature and psi regression coefficients LAT_BINS_IN_DEG Real 1.0 Width of Latitude bins in degrees LESS_Q_FROM_TOP Integer 0 Number of top model sigma levels to eliminate moisture BE statistics Debug options Integer 0 Flag for debugging the code 8
10 Scripts and graphics A top level script gen_be_gsi.ksh executes various stages of gen_be. This is executed via a suitable wrapper stage0 has its own separate script gen_be_stage0_gsi.ksh. It is called by the top level script, if it is desired to run this stage Thus to run gen_be, only a wrapper script needs to be developed which includes information about domain configuration, location of forecast output files, initial and final dates, desired namelist options etc. Successful execution produces the desired background error statistics file as wrf-arw-gsi_be in RUN_DIR directory To display the contents of wrf-arw-gsi_be, the NCL script plot_gsi_be.ncl may be run via a suitable wrapper script 9
11 A sample wrapper to run gen_be #! /bin/ksh -aeu # # Script gen_be_wrapper.ksh ## Author : Syed RH Rizvi, MMM/ESSL/NCAR, Date:04/15/2009 # Purpose: Calculates WRF-ARW background error statistics for GSI # export WRFVAR_DIR=/mmm/users/rizvi/code/trunk_mbe export SCRIPTS_DIR=/mmm/users/rizvi/code/WRFDA_scripts/var/scripts export GRAPHICS_DIR=/mmm/users/rizvi/code/WRFDA_scripts/var/graphics/ncl export NUM_WE=44 # 1 point less than stagger points in WE export NUM_SN=44 export NUM_LEVELS=27 export LESS_Q_FROM_TOP=0 export LAT_BINS_IN_DEG=5.0 export DEBUG=0 export REGION=con200 export DAT_DIR=/ptmp/rizvi/data export REG_DIR=$DAT_DIR/$REGION # 1 point less than stagger points in SN # 1 point less than stagger point in vertical # Exclude levels from top for moisture statistics # Lat bins (in deg) for BE stats export EXPT=run_gsi_be_lat_bin_size_${LAT_BINS_IN_DEG}_lnps export RUN_DIR=$REG_DIR/$EXPT export FC_DIR=$REG_DIR/novar/fc export RUN_GEN_BE_GSI_STAGE0=true export RUN_GEN_BE_GSI_STAGE1=true export RUN_GEN_BE_GSI_STAGE2=true export START_DATE= # the first perturbation valid date export END_DATE= # the last perturbation valid date export INTERVAL=12 ${SCRIPTS_DIR}/gen_be/gen_be_gsi.ksh 10
12 A sample wrapper to display BE #! /bin/ksh -aeu # # Script : wrapper_gen_be_gsi_plot.ksh # Author: Syed RH Rizvi, UCAR/NCAR/ESSL/MMM/DAG Date: 08/12/2009 # Purpose: Wrapper for the display of background error statistics for GSI # export SCRIPTS_DIR=/mmm/users/rizvi/code/WRFDA_scripts/var/scripts export GRAPHICS_DIR=/mmm/users/rizvi/code/WRFDA_scripts/var/graphics/ncl export GRAPHIC_WORKS=pdf export NUM_WE=44 export NUM_SN=44 export NUM_LEVELS=27 export REGION=con200 export PLOT_CORRELATION=true export DAT_DIR=/ptmp/rizvi/data export REG_DIR=$DAT_DIR/$REGION export EXPT=run_gsi_be export RUN_DIR=$REG_DIR/$EXPT ncl ${GRAPHICS_DIR}/gen_be/plot_gsi_be.ncl # if $PLOT_CORRELATION ; then # Plot Correlation: # 1 point less than stagger points in WE ncl ${GRAPHICS_DIR}/gen_be/gsi_correlation.ncl fi # 1 point less than stagger points in SN # 1 point less than stagger point in vertical 11

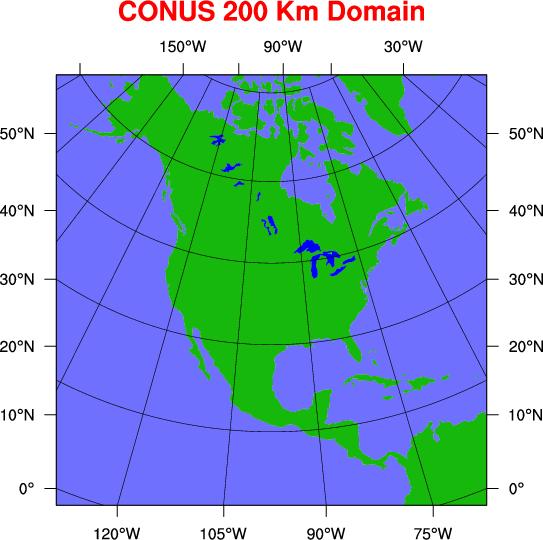
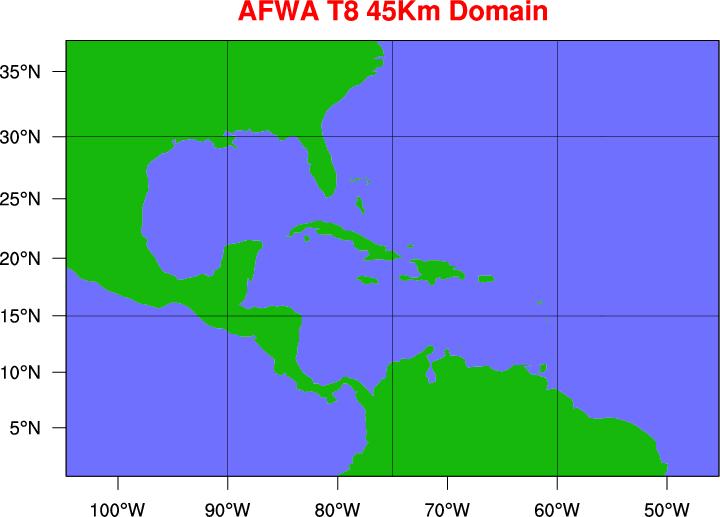
13 BE diagnostics Grid: 140 x 94 x 57 Grid: 45 x 45 x 28 12
14 WRF-ARW BE diagnostics -- balanced fields CONUS, 200 Km Domain T8, 45 Km Domain 13
15 WRF-ARW BE diagnostics -- Variance CONUS, 200 Km Domain T8, 45 Km Domain 14
16 BE diagnostics -- Horizontal Length-scales CONUS, 200 Km Domain T8, 45 Km Domain 15
17 BE diagnostics -- Vertical Length-scales CONUS, 200 Km Domain T8, 45 Km Domain 16


18 BE diagnostics -- Regression coeff CONUS, 200 Km Domain T8, 45 Km Domain 17


19 Single Obs test for CONUS 200 Km domain U - Observation T - Observation 18
Generation of WRF-ARW Background Errors (BE) For GSI
 For GSI") Generation of WRF-ARW Background Errors (BE) For GSI 1. Introduction: Syed RH Rizvi, Zhiquan Liu and Xiang-Yu Huang NCAR/ESSL/MMM, Boulder, CO Currently NCEP global background errors are used for running
Generation of WRF-ARW Background Errors (BE) For GSI 1. Introduction: Syed RH Rizvi, Zhiquan Liu and Xiang-Yu Huang NCAR/ESSL/MMM, Boulder, CO Currently NCEP global background errors are used for running
GSI fundamentals (4): Background Error Covariance and Observation Error
: Background Error Covariance and Observation Error") 27 GSI Community Tutorial July 2, 27, College Park, MD GSI fundamentals (4): Background Error Covariance and Observation Error Ming Hu Developmental Testbed Center Outline GSI fundamentals (): Setup and
27 GSI Community Tutorial July 2, 27, College Park, MD GSI fundamentals (4): Background Error Covariance and Observation Error Ming Hu Developmental Testbed Center Outline GSI fundamentals (): Setup and
EnKF Fundamentals (2b): Applications
: Applications") 2015 EnKF Community Tutorial August 13-14, 2015. Boulder, CO EnKF Fundamentals (2b): Applications Kathryn Newman Ming Hu, and Chunhua Zhou Developmental Testbed Center (DTC) Outline EnKF fundamentals (1):
2015 EnKF Community Tutorial August 13-14, 2015. Boulder, CO EnKF Fundamentals (2b): Applications Kathryn Newman Ming Hu, and Chunhua Zhou Developmental Testbed Center (DTC) Outline EnKF fundamentals (1):
GSI Setup, Run and Namelist
 GSI Setup, Run and Namelist Hui Shao GSI Community Tutorial, June 28-30, 2010, Boulder, CO Observation Error Observation Observation processing and assimilation PrepBUFR and BUFR processing: 06/29, Tue
About the SPEEDY model (from Miyoshi PhD Thesis):
:") SPEEDY EXPERIMENTS. About the SPEEDY model (from Miyoshi PhD Thesis): The SPEEDY model (Molteni 2003) is a recently developed atmospheric general circulation model (AGCM) with a spectral primitive-equation
SPEEDY EXPERIMENTS. About the SPEEDY model (from Miyoshi PhD Thesis): The SPEEDY model (Molteni 2003) is a recently developed atmospheric general circulation model (AGCM) with a spectral primitive-equation
EnKF Fundamentals (1): Configuration and Run
: Configuration and Run") 2017 Joint DTC-EMC-JCSDA GSI-EnKF Tutorial July 11-14, 2017, NCWCP, College Park, MD EnKF Fundamentals (1): Configuration and Run Chunhua Zhou * Kathryn Newman * and Ming Hu ** Developmental Testbed Center
2017 Joint DTC-EMC-JCSDA GSI-EnKF Tutorial July 11-14, 2017, NCWCP, College Park, MD EnKF Fundamentals (1): Configuration and Run Chunhua Zhou * Kathryn Newman * and Ming Hu ** Developmental Testbed Center
WRF-NMM Standard Initialization (SI) Matthew Pyle 8 August 2006
 Matthew Pyle 8 August 2006") WRF-NMM Standard Initialization (SI) Matthew Pyle 8 August 2006 1 Outline Overview of the WRF-NMM Standard Initialization (SI) package. More detailed look at individual SI program components. SI software
WRF-NMM Standard Initialization (SI) Matthew Pyle 8 August 2006 1 Outline Overview of the WRF-NMM Standard Initialization (SI) package. More detailed look at individual SI program components. SI software
GSI Fundamentals (5): Review and Applications
: Review and Applications") 27 GSI/EnKF Community Tutorial July -4, 27, College Park, MD GSI Fundamentals (5): Review and Applications Jeff Beck, Ming Hu, Hui Shao2, Chunhua Zhou2, and Kathryn Newman2 Developmental Testbed Center
27 GSI/EnKF Community Tutorial July -4, 27, College Park, MD GSI Fundamentals (5): Review and Applications Jeff Beck, Ming Hu, Hui Shao2, Chunhua Zhou2, and Kathryn Newman2 Developmental Testbed Center
Paralleliza(on Challenges for Ensemble Data Assimila(on
 Paralleliza(on Challenges for Ensemble Data Assimila(on Helen Kershaw Institute for Mathematics Applied to Geophysics, National Center for Atmospheric Research Email: hkershaw@ucar.edu What am I going
GSI Fundamentals (2) Run and Namelist
 Run and Namelist") 2 GSI Community Tutorial June 29-July, 2, Boulder, CO GSI Fundamentals (2) Run and Namelist Ming Hu and Hui Shao Developmental Testbed Center Outlines GSI fundamentals (): Setup and Compilation GSI fundamentals
2 GSI Community Tutorial June 29-July, 2, Boulder, CO GSI Fundamentals (2) Run and Namelist Ming Hu and Hui Shao Developmental Testbed Center Outlines GSI fundamentals (): Setup and Compilation GSI fundamentals
WRF Data Assimilation System: Software and Compilation
 WRF Data Assimilation System: Software and Compilation Michael Kavulich, Jr. July 24 July 26, 2017 National Center for Atmospheric Research Boulder, CO 1 WRFDA System Outline Introduction Compiling the
MET+ MET+ Unified Package. Python wrappers around MET and METViewer: Python wrappers
 MET+ Overview MET+ Unified Package Python wrappers around MET and METViewer: 2 Simple to set-up and run Automated plotting of 2D fields and statistics Initial system - Global deterministic with plans to
RegCM-ROMS Tutorial: Introduction to ROMS Ocean Model
 RegCM-ROMS Tutorial: Introduction to ROMS Ocean Model Ufuk Utku Turuncoglu ICTP (International Center for Theoretical Physics) Earth System Physics Section - Outline Outline Introduction Grid generation
Stat Analysis Tool. Filtering Summarizing Aggregating. of Grid-Stat, Point-Stat, & Wavelet-Stat output
 Stat Analysis Tool Filtering Summarizing Aggregating of Grid-Stat, Point-Stat, & Wavelet-Stat output Presenter: Tara Jensen What can Stat Analysis do for you? Can I get Q: Overall statistics for all gridded
WRF-Var System. WRF-Var Tutorial July 21-22, Xin Zhang and Syed RH Rizvi. Michael Duda
 System Tutorial July 21-22, 2008 Xin Zhang and Syed RH Rizvi Michael Duda Outline in the WRF Modeling System Software Code Overview 1 in the WRF Modeling System 2 in the WRF Modeling System Blue --> Supported
Introduction to MODE
 Introduction to MODE Verifying with Objects Presenter: Tara Jensen copyright 2017, UCAR, all rights reserved MODE Object Identification Source: Davis 2006 (Intensity presented as vertical dimension) Smoothing
Fathom Dynamic Data TM Version 2 Specifications
 Data Sources Fathom Dynamic Data TM Version 2 Specifications Use data from one of the many sample documents that come with Fathom. Enter your own data by typing into a case table. Paste data from other
Gridded Data Speedwell Derived Gridded Products
 Gridded Data Speedwell Derived Gridded Products Introduction Speedwell Weather offers access to a wide choice of gridded data series. These datasets are sourced from the originating agencies in their native
RK-Time Integration and High-Order Spatial Discretization a New Dynamical Core for the LMK
 RK-Time Integration and High-Order Spatial Discretization a New Dynamical Core for the LMK Jochen Förstner Deutscher Wetterdienst, Kaiserleistraße 35, 63067 Offenbach am Main jochen.foerstner@dwd.de COSMO
HYSPLIT model description and operational set up for benchmark case study
 HYSPLIT model description and operational set up for benchmark case study Barbara Stunder and Roland Draxler NOAA Air Resources Laboratory Silver Spring, MD, USA Workshop on Ash Dispersal Forecast and
ARPS-3dvar Program. 1. Introduction
 1. Introduction The ARPS variational data assimilation program 3dvar is designed to assimilate the observation data to ARPS model. The program takes an ARPS forecast as background, and surface data, multi-level
Data Analysis and Solver Plugins for KSpread USER S MANUAL. Tomasz Maliszewski
 Data Analysis and Solver Plugins for KSpread USER S MANUAL Tomasz Maliszewski tmaliszewski@wp.pl Table of Content CHAPTER 1: INTRODUCTION... 3 1.1. ABOUT DATA ANALYSIS PLUGIN... 3 1.3. ABOUT SOLVER PLUGIN...
DRAFT. ATMET Technical Note. Common Customizations for RAMS v6.0. Number 2. Prepared by: ATMET, LLC PO Box Boulder, Colorado
 DRAFT ATMET Technical Note Number 2 Common Customizations for RAMS v60 Prepared by: ATMET, LLC PO Box 19195 Boulder, Colorado 80308-2195 October 2006 Table of Contents 1 Adding Array Space to the Model
Simulation and visualization of simple leapfrog advection scheme. ATMO 558 Term Project Koichi Sakaguchi
 Simulation and visualization of simple leapfrog advection scheme ATMO 558 Term Project Koichi Sakaguchi Outline 1. Motivation 2. Method 2D a) Equations b) Model domain & grid setup c) Initial condition
ARW WRF Graphical Packages ARWpost & NCL. Cindy Bruyère
 ARW WRF Graphical Packages ARWpost & NCL Cindy Bruyère ARWpost Converter, creates GrADS (.dat) and (.ctl) files, or Vis5D input files download ARWpost From wrf-model.org web site (ARWpost.tar): http://www.mmm.ucar.edu/wrf/users/
Moving Weather Model Ensembles To A Geospatial Database For The Aviation Weather Center
 Moving Weather Model Ensembles To A Geospatial Database For The Aviation Weather Center Presented by Jeff Smith April 2, 2013 NOAA's Earth System Research Lab in Boulder, CO Background -1 NCEP is NOAA
NaysEddy ver 1.0. Example MANUAL. By: Mohamed Nabi, Ph.D. Copyright 2014 iric Project. All Rights Reserved.
 NaysEddy ver 1.0 Example MANUAL By: Mohamed Nabi, Ph.D. Copyright 2014 iric Project. All Rights Reserved. Contents Introduction... 3 Getting started... 4 Simulation of flow over dunes... 6 1. Purpose of
KAshima RAy-Tracing Service (KARATS)
") KAshima RAy-Tracing Service (KARATS) Fast ray-tracing algorithms through numerical weather models for real-time positioning applications in East Asia T. Hobiger, R. Ichikawa, Y. Koyama, T. Kondo Overview
KAshima RAy-Tracing Service (KARATS) Fast ray-tracing algorithms through numerical weather models for real-time positioning applications in East Asia T. Hobiger, R. Ichikawa, Y. Koyama, T. Kondo Overview
Instituting an observation database (ODB) capability in the GSI
 capability in the GSI") Instituting an observation database (ODB) capability in the GSI Jeff Whitaker, Scott Gregory, and Tom Hamill NOAA / ESRL Physical Sciences Division Presentation to Blueprints for Next-Generation Data Assimilation
Instituting an observation database (ODB) capability in the GSI Jeff Whitaker, Scott Gregory, and Tom Hamill NOAA / ESRL Physical Sciences Division Presentation to Blueprints for Next-Generation Data Assimilation
McIDAS-V Tutorial Displaying Gridded Data updated January 2016 (software version 1.5)
") McIDAS-V Tutorial Displaying Gridded Data updated January 2016 (software version 1.5) McIDAS-V is a free, open source, visualization and data analysis software package that is the next generation in SSEC's
McIDAS-V Tutorial Displaying Gridded Data updated January 2016 (software version 1.5) McIDAS-V is a free, open source, visualization and data analysis software package that is the next generation in SSEC's
GSI Setup, Run and Namelist
 GSI Setup, Run and Namelist Hui Shao GSI Community Tutorial, June 28-30, 2010, Boulder, CO Outline Installing GSI Running GSI Basic runtime options This talk is tailored based on GSI Community Release
STATS PAD USER MANUAL
 STATS PAD USER MANUAL For Version 2.0 Manual Version 2.0 1 Table of Contents Basic Navigation! 3 Settings! 7 Entering Data! 7 Sharing Data! 8 Managing Files! 10 Running Tests! 11 Interpreting Output! 11
Introduction to the ClimValDiagTool
 Introduction to the ClimValDiagTool K. Gottschaldt & V. Eyring, 13. 2. 2013 1. General Info 2. Access miklip.dkrz.de 3. Get the code 4. Prepare data 5. Walk through an example 6. Modify the example 7.
ITACS : Interactive Tool for Analysis of the Climate System
 Contents 1 2 3 4 ITACS : Interactive Tool for Analysis of the Climate System Features of the ITACS Atmospheric Analysis Data, Outgoing Longwave Radiation (by NOAA), SST, Ocean Analysis Data, etc. Plain
Flow Visualisation 1
 Flow Visualisation Visualisation Lecture 13 Institute for Perception, Action & Behaviour School of Informatics Flow Visualisation 1 Flow Visualisation... so far Vector Field Visualisation vector fields
Predicting Atmospheric Parameters using Canonical Correlation Analysis
 Predicting Atmospheric Parameters using Canonical Correlation Analysis Emmett J Ientilucci Digital Imaging and Remote Sensing Laboratory Chester F Carlson Center for Imaging Science Rochester Institute
Minitab 17 commands Prepared by Jeffrey S. Simonoff
 Minitab 17 commands Prepared by Jeffrey S. Simonoff Data entry and manipulation To enter data by hand, click on the Worksheet window, and enter the values in as you would in any spreadsheet. To then save
OBAN Class Homework Assignment No. 4 Distributed on November 3, Due Thursday, December 1, 2016
 OBAN Class Homework Assignment No. 4 Distributed on November 3, 2016 Due Thursday, December 1, 2016 Original document on ANALAB was written by Huang, Gustafsson and Robertson (2000), and can be found in
The inclusion of cloudy radiances in the NCEP GSI analysis system
 he inclusion of cloudy radiances in the NCEP GSI analysis system 1,2,3 Min-Jeong Kim 1 Fuzhong Weng and 2 John Derber 1.NOAA/NESDIS/SAR 2. Joint Center for Satellite Data Assimilation (JCSDA) 3. CIRA,
McIDAS-V Tutorial Displaying Gridded Data updated June 2015 (software version 1.5)
") McIDAS-V Tutorial Displaying Gridded Data updated June 2015 (software version 1.5) McIDAS-V is a free, open source, visualization and data analysis software package that is the next generation in SSEC's
McIDAS-V Tutorial Displaying Gridded Data updated June 2015 (software version 1.5) McIDAS-V is a free, open source, visualization and data analysis software package that is the next generation in SSEC's
Post-processing Tools
 Post-processing Tools Cindy Bruyère 1 Graphical Packages NCL Graphical package UG: 9-2 VAPOR Converter and graphical package Support: VAPOR UG: 9-50 ARWpost Converter (GrADS & vis5d) UG: 9-28 UG: 9-19
A Test Suite for GCMs: An Intercomparison of 11 Dynamical Cores
 A Test Suite for GCMs: An Intercomparison of 11 Dynamical Cores Christiane Jablonowski 1, Peter Lauritzen 2, Mark 3 Taylor, Ram Nair 2 1 University of Michigan, 2 National Center for Atmospheric Research,
Overview Trajectory Details
 Overview The new trajectory code tracks three dimensional variables, with an XZY ordering, from a specified starting point along a lagrangian trajectory. Along any trajectory there may be up to 100 defined
AHW Post Processing. Cindy Bruyère. WRF Tutorial for Hurricanes Mesoscale & Microscale Meteorological Division / NCAR
 AHW Post Processing Cindy Bruyère 1 Processing AHW data ARW output Which packages can read this data Moving nests How do we deal with moving nest data Hurricane tracking Generating and plotting hurricane
WRF-Hydro hydro.namelist File with Description of Options for use with WRF-Hydro V5
 WRF-Hydro hydro.namelist File with Description of Options for use with WRF-Hydro V5 Below is an annotated hydro.namelist file. Annotations follow what is being described, indicated with
IPhone App for. Numerical Prediction of Oil Slick Movement in Arabian Gulf and Kuwait Waters For IPhone Mobile. KOil Apps
 IPhone App for Numerical Prediction of Oil Slick Movement in Arabian Gulf and Kuwait Waters For IPhone Mobile KOil Apps Developed By Khaled AL-Salem 2011 www.hceatkuwait.net Kuwait, Tell:+965 99016700,
ESMValTool v2.0 Technical Overview
 ESMValTool v2.0 Technical Overview Mattia Righi Version 16.11.2018 www.dlr.de Folie 2 Outline Structure Installation Configuration Running ESMValTool Output directory structure Backend (aka preprocessor)
Online Trajectory Module in COSMO - A short user guide
 Online Trajectory Module in COSMO - A short user guide Document version: 1.0 (as of June 2014) Annette K. Miltenberger, Stephan Pfahl, Anne Roches, Heini Wernli IAC and C2SM, ETH Zurich Contact: stephan.pfahl@env.ethz.ch
WinADCP User s Guide. P/N (November 2001) RD Instruments Acoustic Doppler Solutions
 RD Instruments Acoustic Doppler Solutions") WinADCP User s Guide P/N 957-6158-00 (November 2001) RD Instruments Acoustic Doppler Solutions Table of Contents 1 Introduction... 1 1.1 System Requirements...1 1.2 Software Installation...2 2 Using WinADCP...
WinADCP User s Guide P/N 957-6158-00 (November 2001) RD Instruments Acoustic Doppler Solutions Table of Contents 1 Introduction... 1 1.1 System Requirements...1 1.2 Software Installation...2 2 Using WinADCP...
QstatLab: software for statistical process control and robust engineering
 QstatLab: software for statistical process control and robust engineering I.N.Vuchkov Iniversity of Chemical Technology and Metallurgy 1756 Sofia, Bulgaria qstat@dir.bg Abstract A software for quality
PyNGL & PyNIO Geoscience Visualization & Data IO Modules
 PyNGL & PyNIO Geoscience Visualization & Data IO Modules SciPy 08 Dave Brown National Center for Atmospheric Research Boulder, CO Topics What are PyNGL and PyNIO? Quick summary of PyNGL graphics PyNIO
Each of the sections has an explanation followed with the option to select the parameters.
 A)Introduction to DTDM (the code, input control file, how to run) 1)The code for DTDM (Dynamics and Thermodynamics Demonstration Model) was developed in Fortran 77 by Rob Fovell. We have installed the
PC APPLICATION SOFTWARE WEATHER OS (MODEL: WMR100 / WMR200 / WMRS200 / I300 / I600 / EMS100 / RMS300 / RMS600) USER GUIDE IMPORTANT: LAUNCH SOFTWARE
 USER GUIDE IMPORTANT: LAUNCH SOFTWARE") PC APPLICATION SOFTWARE WEATHER OS (MODEL: WMR100 / WMR200 / WMRS200 / I300 / I600 / EMS100 / RMS300 / RMS600) USER GUIDE CONTENTS Launch Software...1 Installation...1 Select language...1 Select cities
PC APPLICATION SOFTWARE WEATHER OS (MODEL: WMR100 / WMR200 / WMRS200 / I300 / I600 / EMS100 / RMS300 / RMS600) USER GUIDE CONTENTS Launch Software...1 Installation...1 Select language...1 Select cities
3-D Wind Field Simulation over Complex Terrain
 3-D Wind Field Simulation over Complex Terrain University Institute for Intelligent Systems and Numerical Applications in Engineering Congreso de la RSME 2015 Soluciones Matemáticas e Innovación en la
Breeze - Segmentation guide
 Breeze - Segmentation guide This guide will show how to use other type of segmentation than Sample model in Breeze. Note. It s recommended to first go through Powder Quantification Tutorial Table of content
GEOG 4110/5100 Advanced Remote Sensing Lecture 4
 GEOG 4110/5100 Advanced Remote Sensing Lecture 4 Geometric Distortion Relevant Reading: Richards, Sections 2.11-2.17 Review What factors influence radiometric distortion? What is striping in an image?
User's Guide for the NMM Core of the Weather Research and Forecast (WRF) Modeling System Version 3. Chapter 3: WRF Preprocessing System (WPS)
 Modeling System Version 3. Chapter 3: WRF Preprocessing System (WPS)") User's Guide for the NMM Core of the Weather Research and Forecast (WRF) Modeling System Version 3 Chapter 3: WRF Preprocessing System (WPS) Table of Contents Introduction Function of Each WPS Program
User's Guide for the NMM Core of the Weather Research and Forecast (WRF) Modeling System Version 3 Chapter 3: WRF Preprocessing System (WPS) Table of Contents Introduction Function of Each WPS Program
INSTED /CFD Post-Processor. Post-Processor. Chapter 5 INSTED /CFD (2D) Post-Processor
 Post-Processor") INSTED /CFD Chapter 5 INSTED /CFD (2D) The part of INSTED/CFD (2D) plots lines or filled contours of variables such as velocities, temperature, pressure, scalars, and stream function. The program also
INSTED /CFD Chapter 5 INSTED /CFD (2D) The part of INSTED/CFD (2D) plots lines or filled contours of variables such as velocities, temperature, pressure, scalars, and stream function. The program also
RF Tutorial. Rhys Hawkins January This document gives a tutorial introduction to using the RF software.
 RF Tutorial Rhys Hawkins January 2014 1 Introduction This document gives a tutorial introduction to using the RF software. 2 The Tutorial Data The following files should exist in the data directory: RF
Testing Random- Number Generators
 Testing Random- Number Generators Raj Jain Washington University Saint Louis, MO 63131 Jain@cse.wustl.edu These slides are available on-line at: http://www.cse.wustl.edu/~jain/cse574-06/ 27-1 Overview
Vertical and Horizontal Translations
 SECTION 4.3 Vertical and Horizontal Translations Copyright Cengage Learning. All rights reserved. Learning Objectives 1 2 3 4 Find the vertical translation of a sine or cosine function. Find the horizontal
Converging Remote Sensing and Data Assimilation through Data Fusion
 Converging Remote Sensing and Data Assimilation through Data Fusion Benjamin T. Johnson, Ph.D. AER @ NOAA/STAR/JCSDA benjamin.t.johnson@noaa.gov The Team: Sid Boukabara Kevin Garrett Eric Maddy Ling Liu
MODELED MESOSCALE GRAVITY WAVES: CONTINUOUS SPECTRUM AND ENERGY CASCADE Chungu Lu 1, Steven Koch, Fuqing Zhang, and Ning Wang
 P6.5 MODELED MESOSCALE GRAVITY WAVES: CONTINUOUS SPECTRUM AND ENERGY CASCADE Chungu Lu 1, Steven Koch, Fuqing Zhang, and Ning Wang NOAA Research-Forecast Systems Laboratory, Boulder, Colorado [In collaboration
GrADS for Beginners. Laura Mariotti
 GrADS for Beginners Laura Mariotti mariotti@ictp.it Outline n What is GrADS and how do I get it? n GrADS essentials n Getting started n Gridded data sets n Displaying data n Script language n Saving your
Automatic subsetting of WRF derived climate change scenario forcings
 6 email will be send to specified address user email including location of processed data on Graham "ctl-wrf-wca", 4 # name of the product "user id": "julemai", # your user name on Graham "request id":
Mass-flux parameterization in the shallow convection gray zone
 Mass-flux parameterization in the shallow convection gray zone LACE stay report Toulouse Centre National de Recherche Meteorologique, 15. September 2014 26. September 2014 Scientific supervisor: Rachel
Interpolation of gridded data using Geostrophic Balance. Lennon O Naraigh *
 Interpolation of gridded data using Geostrophic Balance Lennon O Naraigh * Date: 6 th September 2004 Abstract: In this report, a method of interpolating data from the grid of a global climate model (GCM)
Instituting an observation database
 Instituting an observation database capability in the NCEP GSI Tom Hamill, Jeff Whitaker, Scott Gregory NOAA / ESRL Physical Sciences Division Presentation to DAOS, Exeter England, April 2016 Our intent:
CH5: CORR & SIMPLE LINEAR REFRESSION =======================================
 STAT 430 SAS Examples SAS5 ===================== ssh xyz@glue.umd.edu, tap sas913 (old sas82), sas https://www.statlab.umd.edu/sasdoc/sashtml/onldoc.htm CH5: CORR & SIMPLE LINEAR REFRESSION =======================================
File Formats and Pre-Processing
 File Formats and Pre-Processing File Formats Pre-processing Tools Useful Links Presenter: Tara Jensen Supported File Formats Forecasts GRIB GRIdded Binary file format (*version 1) NetCDF MET specific network
Simulation of Brightness Temperatures for the Microwave Radiometer (MWR) on the Aquarius/SAC-D Mission. Salman S. Khan M.S. Defense 8 th July, 2009
 on the Aquarius/SAC-D Mission. Salman S. Khan M.S. Defense 8 th July, 2009") Simulation of Brightness Temperatures for the Microwave Radiometer (MWR) on the Aquarius/SAC-D Mission Salman S. Khan M.S. Defense 8 th July, 2009 Outline Thesis Objective Aquarius Salinity Measurements
Simulation of Brightness Temperatures for the Microwave Radiometer (MWR) on the Aquarius/SAC-D Mission Salman S. Khan M.S. Defense 8 th July, 2009 Outline Thesis Objective Aquarius Salinity Measurements
Clouds in global models are variable
 Clouds in global models are variable There s explicit variability within grid columns: Vertical structure ( overlap ) + fractional cloudiness = internally variable columns Let s take a look at how overlap
DMT-CCN instrument droplet growth simulations manual
 DMT-CCN instrument droplet growth simulations manual T. Raatikainen (tomi.raatikainen@eas.gatech.edu) and A. Nenes (athanasios.nenes@gatech.edu) January 18, 2012 1. Introduction Obtaining the latest version
Ocean Simulations using MPAS-Ocean
 Ocean Simulations using MPAS-Ocean Mark Petersen and the MPAS-Ocean development team Los Alamos National Laboratory U N C L A S S I F I E D Slide 1 Progress on MPAS-Ocean in 2010 MPAS-Ocean is a functioning
Weather Research and Forecasting Model 2.2 Documentation: A Step-by-step guide of a Model Run
 Weather Research and Forecasting Model 2.2 Documentation: A Step-by-step guide of a Model Run Technical Report FIU-SCIS-2007-09-02 August 2007 Faculty Advisor: S. Masoud Sadjadi Graduate Students: Javier
CDAA No. 4 - Part Two - Multiple Regression - Initial Data Screening
 CDAA No. 4 - Part Two - Multiple Regression - Initial Data Screening Variables Entered/Removed b Variables Entered GPA in other high school, test, Math test, GPA, High school math GPA a Variables Removed
HWRF: Setup and Run. Shaowu Bao CIRES/CU and NOAA/ESRL/GSD. WRF For Hurricanes Tutorial Boulder, CO April
 HWRF: Setup and Run Shaowu Bao CIRES/CU and NOAA/ESRL/GSD WRF For Hurricanes Tutorial Boulder, CO April 28 2011 Source structure and executables ${HOME}/HWRF/src comgsi_ v2.5 pomtc WRFV3 WPS WPPV3 gfdlvortextracker
CSU RAMS. Procedures for Common User Customizations of the Model. Updated by:
 CSU RAMS Procedures for Common User Customizations of the Model This document contains a list of instructions and examples of how to customize this model. This includes the addition of new scalar and scratch
Projections for use in the Merced River basin
 Instructions to download Downscaled CMIP3 and CMIP5 Climate and Hydrology Projections for use in the Merced River basin Go to the Downscaled CMIP3 and CMIP5 Climate and Hydrology Projections website. 1.
Information Content of Limb Radiances from MIPAS
 Information Content of Limb Radiances from MIPAS Anu Dudhia Atmospheric, Oceanic and Planetary Physics University of Oxford, Oxford, UK 1 Introduction 1.1 Nadir v. Limb Spectra Fig. 1 illustrates the main
CLM4.5 Tutorial: Running for Single- Point/ Regional Cases
 CLM4.5 Tutorial: Running for Single- Point/ Regional Cases Objectives for This Session 1. Make you sick of the four steps to run CLM/CESM! (really make you familiar enough with it that you comfortable
Geographic Information System and its Application in Hydro-Meteorology Exercises using SavGIS
 Geographic Information System and its Application in Hydro-Meteorology Exercises using SavGIS Jothiganesh Shanmugasundaram Decision Support Tool Development Specialist COPY DATABASE FOLDER BHUTAN in to
Global non-hydrostatic modelling using Voronoi meshes: The MPAS model
 Global non-hydrostatic modelling using Voronoi meshes: The MPAS model William C. Skamarock, Joseph B. Klemp, Michael Duda, Laura Fowler and Sang-Hun Park National Center for Atmospheric Research Boulder,
MEA 716 WRF Homework, Data Case Spring WRF Real-Data Case Study Simulation
 MEA 716 WRF Homework, Data Case Spring 2016 Assigned: Tuesday 2/2/16 Due: Tuesday, 2/9/16 WRF Real-Data Case Study Simulation This assignment takes students through the process of obtaining initial and
Part I, Chapters 4 & 5. Data Tables and Data Analysis Statistics and Figures
 Part I, Chapters 4 & 5 Data Tables and Data Analysis Statistics and Figures Descriptive Statistics 1 Are data points clumped? (order variable / exp. variable) Concentrated around one value? Concentrated
Practice Test (page 391) 1. For each line, count squares on the grid to determine the rise and the run. Use slope = rise
 1. For each line, count squares on the grid to determine the rise and the run. Use slope = rise") Practice Test (page 91) 1. For each line, count squares on the grid to determine the rise and the. Use slope = rise 4 Slope of AB =, or 6 Slope of CD = 6 9, or Slope of EF = 6, or 4 Slope of GH = 6 4,
Practice Test (page 91) 1. For each line, count squares on the grid to determine the rise and the. Use slope = rise 4 Slope of AB =, or 6 Slope of CD = 6 9, or Slope of EF = 6, or 4 Slope of GH = 6 4,
EMEP MSC-W Model Training Course at met.no, Oslo, Norway Room: Braavo, IT Building, MET Forskningsparken
 EMEP MSC-W Model Training Course at met.no, Oslo, Norway Room: Braavo, IT Building, MET Forskningsparken Basic Exercises 1. Base Run: A simple run for a particular year with the given meteorology and input
Math 144 Activity #4 Connecting the unit circle to the graphs of the trig functions
 144 p 1 Math 144 Activity #4 Connecting the unit circle to the graphs of the trig functions Graphing the sine function We are going to begin this activity with graphing the sine function ( y = sin x).
Magics support in CDO
 Magics support in CDO Creating of contour, vector and graph plots January 2016 Kameswarrao Modali, Ralf Müller, Uwe Schulzweida Max Planck Institute for Meteorology Contents 1 Introduction 3 2 Building
FODAVA Partners Leland Wilkinson (SYSTAT & UIC) Robert Grossman (UIC) Adilson Motter (Northwestern) Anushka Anand, Troy Hernandez (UIC)
 Robert Grossman (UIC) Adilson Motter (Northwestern) Anushka Anand, Troy Hernandez (UIC)") FODAVA Partners Leland Wilkinson (SYSTAT & UIC) Robert Grossman (UIC) Adilson Motter (Northwestern) Anushka Anand, Troy Hernandez (UIC) Visually-Motivated Characterizations of Point Sets Embedded in High-Dimensional
FODAVA Partners Leland Wilkinson (SYSTAT & UIC) Robert Grossman (UIC) Adilson Motter (Northwestern) Anushka Anand, Troy Hernandez (UIC) Visually-Motivated Characterizations of Point Sets Embedded in High-Dimensional
George H. Bryan, Richard Rotunno, National Center for Atmospheric Research, Boulder, Colorado, USA
 8C.7 THE EFFECTS OF TURBULENCE ON HURRICANE INTENSITY George H. Bryan, Richard Rotunno, National Center for Atmospheric Research, Boulder, Colorado, USA and Yongsheng Chen York University, Toronto, Ontario,
LAB 1 INSTRUCTIONS DESCRIBING AND DISPLAYING DATA
 LAB 1 INSTRUCTIONS DESCRIBING AND DISPLAYING DATA This lab will assist you in learning how to summarize and display categorical and quantitative data in StatCrunch. In particular, you will learn how to
The Power and Sample Size Application
 Chapter 72 The Power and Sample Size Application Contents Overview: PSS Application.................................. 6148 SAS Power and Sample Size............................... 6148 Getting Started:
newfasant US User Guide
 newfasant US User Guide Software Version: 6.2.10 Date: April 15, 2018 Index 1. FILE MENU 2. EDIT MENU 3. VIEW MENU 4. GEOMETRY MENU 5. MATERIALS MENU 6. SIMULATION MENU 6.1. PARAMETERS 6.2. DOPPLER 7.
SST Retrieval Methods in the ESA Climate Change Initiative
 ESA Climate Change Initiative Phase-II Sea Surface Temperature (SST) www.esa-sst-cci.org SST Retrieval Methods in the ESA Climate Change Initiative Owen Embury Climate Change Initiative ESA Climate Change
Supplement of The generic MESSy submodel TENDENCY (v1.0) for process-based analyses in Earth system models
 for process-based analyses in Earth system models") Supplement of Geosci. Model Dev., 7, 1573 1582, 2014 http://www.geosci-model-dev.net/7/1573/2014/ doi:10.5194/gmd-7-1573-2014-supplement Author(s) 2014. CC Attribution 3.0 License. Supplement of The generic
Supplement of Geosci. Model Dev., 7, 1573 1582, 2014 http://www.geosci-model-dev.net/7/1573/2014/ doi:10.5194/gmd-7-1573-2014-supplement Author(s) 2014. CC Attribution 3.0 License. Supplement of The generic
Overview of the CohortMethod package. Martijn Schuemie
 Overview of the CohortMethod package Martijn Schuemie CohortMethod is part of the OHDSI Methods Library Estimation methods Cohort Method New-user cohort studies using large-scale regression s for propensity
Real-time Vibration Analyzer Software
 Real-time Vibration Analyzer Software POWERFUL AND VERSATILE ANALYSIS TOOL The AS-410 Vibration Analyzer software merges the best features of real-time machinery analyzer, dynamic signal analyzer, transient
Introduction to Data Assimilation
 Introduction to Data Assimilation Eric Kostelich and David Kuhl MSRI Climate Change Summer School July 21, 2008 Introduction The goal of these exercises is to familiarize you with LETKF data assimilation.
c Fluent Inc. May 16,
 Tutorial 1. Office Ventilation Introduction: This tutorial demonstrates how to model an office shared by two people working at computers, using Airpak. In this tutorial, you will learn how to: Open a new