San Francisco State University
|
|
|
- Baldwin Arnold
- 5 years ago
- Views:
Transcription
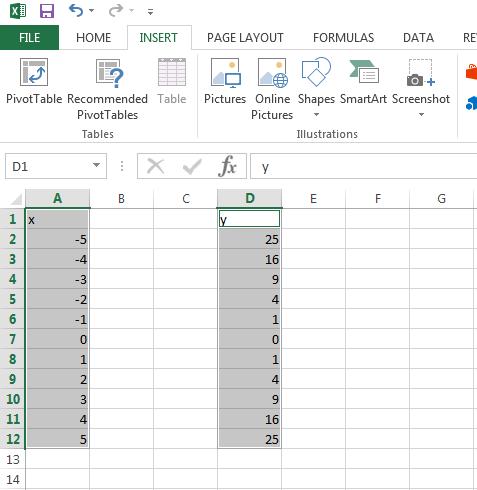
1 San Francisco State University Michael Bar Instructions for Excel 1. Plotting analytical function. 2 Suppose that you need to plot the graph of a function f ( x) = x on the interval [ 5,5]. Step 1: make titles for the x-axis and the y-axis. Excel understands that the left column is the horizontal axis (x-axis) and the right column is the vertical axis (y-axis). Step 2: provide values for the x variable (-5, -4,, 4, 5). You don t have to type all the points. Start by typing the first two points, then select (highlight) the cells with -5 and -4: 1
2 Then point with the cursor on the right bottom corner of the cell with 4 and drag down until you get 2
3 Step 3: define the formula for the y-column. Suppose that the cell with 5 is A2. Write Step 4: apply the formula to all the points in the x-column by dragging down the right bottom corner of the cell containing =A2^2. The result is 3
4 Step 5: highlight all the cells with the variables and the titles. Put the cursor on the cell containing x title and drag down to the cell with 25. The result is 4

5 Step 6: From the main menu choose the INSERT and then Scatter. You will see the stepby-step guide window. 5
6 Step 7: You can add chart title and axis labels by clicking the + in the top right corner of the chart window. Remark: If the data is not in adjacent columns, press Ctrl and use mouse to highlight the x- axis, and then, keep pressing Ctrl and highlight the y axis. 6
7 7
8 2. Plotting several graphs on the same diagram. Suppose you want to plot the graphs of the following functions on the same diagram: 2 f ( x) = x and g ( x) = x , both defined on the interval [-5,5]. Step 1: make titles and provide formulas Step 4: scroll the formulas to apply to all x values 8

9 Step 5: highlight the three columns, including the titles, choose the INSERT and then Scatter. The result should be: 9
10 Chart Title f(x) g(x) 3. Graphing typed-in data. Suppose that you have data that you typed in Excel spreadsheet Year GDP C First, suppose that you need to plot the graph of GDP against time. Step 1: Click with the mouse on the leftmost cell (the one with the title Year ) and highlight the cells containing the two columns Years and GDP (including the titles). To highlight, start with the leftmost cell with the title Years and drag the mouse while pressing the left button, to the last cell, with 35. You should get the following result Year GDP C Step 2: From the main menu choose the INSERT and then Scatter. Now you can choose a chart sub-type from the right window. You can choose whether you want a smooth graph and if you want the data points to be emphasized. For this example I have chosen the non-smooth graph with the data points emphasized with markers. Click Next. 10
11 Step 3: The next window asks if the data is in rows or columns, when the default is columns, since it s longer. Click Next. Choose titles for the axis. Click next. Choose the location to be in Sheet1. Click Finish. The result is Example 1 Real GDP GDP Years There are many ways to modify this graph, but you ll just have to experiment and see what happens. Now, suppose you want to make a scatter plot of GDP and consumption. Step 1: Highlight the two relevant series like before. The result is Year GDP C Step 2: Click with the mouse on the toolbar icon called Chart Wizard (it s the one with the blue, yellow and red columns. Choose the chart type to be SCATTER. Now you can choose a chart sub-type from the right window. You can choose whether you want a smooth graph and if you want the data points to be emphasized. For this example I have chosen the non-connected data points. Step 3: The next window asks if the data is in rows or columns, when the default is columns, since it s longer. Click Next. Choose titles for the axis. Click next. Choose the location to be in Sheet1. Click Finish. The result is 11
12 Example 2 C GDP C We can add trend-line by clicking on one of the points with the right button of the mouse and choosing Add Trendline and then Linear. The result is Example 2 C GDP C Linear (C) 12
Technology Assignment: Scatter Plots
 The goal of this assignment is to create a scatter plot of a set of data. You could do this with any two columns of data, but for demonstration purposes we ll work with the data in the table below. You
Pre-Lab Excel Problem
 Pre-Lab Excel Problem Read and follow the instructions carefully! Below you are given a problem which you are to solve using Excel. If you have not used the Excel spreadsheet a limited tutorial is given
KINETICS CALCS AND GRAPHS INSTRUCTIONS
 KINETICS CALCS AND GRAPHS INSTRUCTIONS 1. Open a new Excel or Google Sheets document. I will be using Google Sheets for this tutorial, but Excel is nearly the same. 2. Enter headings across the top as
Chemistry 30 Tips for Creating Graphs using Microsoft Excel
 Chemistry 30 Tips for Creating Graphs using Microsoft Excel Graphing is an important skill to learn in the science classroom. Students should be encouraged to use spreadsheet programs to create graphs.
Introduction to Excel Workshop
 Introduction to Excel Workshop Empirical Reasoning Center June 6, 2016 1 Important Terminology 1. Rows are identified by numbers. 2. Columns are identified by letters. 3. Cells are identified by the row-column
Models for Nurses: Quadratic Model ( ) Linear Model Dx ( ) x Models for Doctors:
 Linear Model Dx ( ) x Models for Doctors:") The goal of this technology assignment is to graph several formulas in Excel. This assignment assumes that you using Excel 2007. The formula you will graph is a rational function formed from two polynomials,
The goal of this technology assignment is to graph several formulas in Excel. This assignment assumes that you using Excel 2007. The formula you will graph is a rational function formed from two polynomials,
= 3 + (5*4) + (1/2)*(4/2)^2.
 + (1/2)*(4/2)^2.") Physics 100 Lab 1: Use of a Spreadsheet to Analyze Data by Kenneth Hahn and Michael Goggin In this lab you will learn how to enter data into a spreadsheet and to manipulate the data in meaningful ways.
Physics 100 Lab 1: Use of a Spreadsheet to Analyze Data by Kenneth Hahn and Michael Goggin In this lab you will learn how to enter data into a spreadsheet and to manipulate the data in meaningful ways.
Getting Started With Excel
 Chapter 1 Getting Started With Excel This chapter will familiarize you with various basic features of Excel. Specific features which you need to solve a problem will be introduced as the need arises. When
Math 1525 Excel Lab 1 Introduction to Excel Spring, 2001
 Math 1525 Excel Lab 1 Introduction to Excel Spring, 2001 Goal: The goal of Lab 1 is to introduce you to Microsoft Excel, to show you how to graph data and functions, and to practice solving problems with
Total Number of Students in US (millions)
") The goal of this technology assignment is to graph a formula on your calculator and in Excel. This assignment assumes that you have a TI 84 or similar calculator and are using Excel 2007. The formula you
The goal of this technology assignment is to graph a formula on your calculator and in Excel. This assignment assumes that you have a TI 84 or similar calculator and are using Excel 2007. The formula you
INSTRUCTIONS FOR USING MICROSOFT EXCEL PERFORMING DESCRIPTIVE AND INFERENTIAL STATISTICS AND GRAPHING
 APPENDIX INSTRUCTIONS FOR USING MICROSOFT EXCEL PERFORMING DESCRIPTIVE AND INFERENTIAL STATISTICS AND GRAPHING (Developed by Dr. Dale Vogelien, Kennesaw State University) ** For a good review of basic
Introduction to Excel Workshop
 Introduction to Excel Workshop Empirical Reasoning Center September 9, 2016 1 Important Terminology 1. Rows are identified by numbers. 2. Columns are identified by letters. 3. Cells are identified by the
Candy is Dandy Project (Project #12)
") Candy is Dandy Project (Project #12) You have been hired to conduct some market research about M&M's. First, you had your team purchase 4 large bags and the results are given for the contents of those
Candy is Dandy Project (Project #12) You have been hired to conduct some market research about M&M's. First, you had your team purchase 4 large bags and the results are given for the contents of those
Years after US Student to Teacher Ratio
 The goal of this assignment is to create a scatter plot of a set of data. You could do this with any two columns of data, but for demonstration purposes we ll work with the data in the table below. The
addition + =5+C2 adds 5 to the value in cell C2 multiplication * =F6*0.12 multiplies the value in cell F6 by 0.12
 BIOL 001 Excel Quick Reference Guide (Office 2010) For your lab report and some of your assignments, you will need to use Excel to analyze your data and/or generate graphs. This guide highlights specific
Introduction to Microsoft Excel
 Chapter A spreadsheet is a computer program that turns the computer into a very powerful calculator. Headings and comments can be entered along with detailed formulas. The spreadsheet screen is divided
How to use Excel Spreadsheets for Graphing
 How to use Excel Spreadsheets for Graphing 1. Click on the Excel Program on the Desktop 2. You will notice that a screen similar to the above screen comes up. A spreadsheet is divided into Columns (A,
Data Should Not be a Four Letter Word Microsoft Excel QUICK TOUR
 Toolbar Tour AutoSum + more functions Chart Wizard Currency, Percent, Comma Style Increase-Decrease Decimal Name Box Chart Wizard QUICK TOUR Name Box AutoSum Numeric Style Chart Wizard Formula Bar Active
Scientific Graphing in Excel 2013
 Scientific Graphing in Excel 2013 When you start Excel, you will see the screen below. Various parts of the display are labelled in red, with arrows, to define the terms used in the remainder of this overview.
Excel Simulations - 1
 Excel Simulations - [] We are going to look at a number of ways Excel can be used to create worksheet simulations that help students visualize concepts. The first type of simulation we will create will
Microsoft Excel Using Excel in the Science Classroom
 Microsoft Excel Using Excel in the Science Classroom OBJECTIVE Students will take data and use an Excel spreadsheet to manipulate the information. This will include creating graphs, manipulating data,
Charting Progress with a Spreadsheet
 Charting Progress - 1 Charting Progress with a Spreadsheet We shall use Microsoft Excel to demonstrate how to chart using a spreadsheet. Other spreadsheet programs (e.g., Quattro Pro, Lotus) are similarly
Three-Dimensional (Surface) Plots
 Plots") Three-Dimensional (Surface) Plots Creating a Data Array 3-Dimensional plots (surface plots) are often useful for visualizing the behavior of functions and identifying important mathematical/physical features
Three-Dimensional (Surface) Plots Creating a Data Array 3-Dimensional plots (surface plots) are often useful for visualizing the behavior of functions and identifying important mathematical/physical features
Separate Text Across Cells The Convert Text to Columns Wizard can help you to divide the text into columns separated with specific symbols.
 Chapter 7 Highlights 7.1 The Use of Formulas and Functions 7.2 Creating Charts 7.3 Using Chart Toolbar 7.4 Changing Source Data of a Chart Separate Text Across Cells The Convert Text to Columns Wizard
MOVING FROM CELL TO CELL
 VCAE: EXCEL Lesson 1 Please send comments to Author: Zahra Siddiqui at zed_ess@hotmail.com Concepts Covered: Cell Address; Cell Pointer; Moving across Cells Constants: Entering, Editing, Formatting Using
Making Tables and Graphs with Excel. The Basics
 Making Tables and Graphs with Excel The Basics Where do my IV and DV go? Just like you would create a data table on paper, your IV goes in the leftmost column and your DV goes to the right of the IV Enter
Scientific Graphing in Excel 2007
 Scientific Graphing in Excel 2007 When you start Excel, you will see the screen below. Various parts of the display are labelled in red, with arrows, to define the terms used in the remainder of this overview.
Excel Spreadsheets and Graphs
 Excel Spreadsheets and Graphs Spreadsheets are useful for making tables and graphs and for doing repeated calculations on a set of data. A blank spreadsheet consists of a number of cells (just blank spaces
Excel 2013 Charts and Graphs
 Excel 2013 Charts and Graphs Copyright 2016 Faculty and Staff Training, West Chester University. A member of the Pennsylvania State System of Higher Education. No portion of this document may be reproduced
Better Histograms Using Excel. Michael R. Middleton School of Business and Management, University of San Francisco
 Better s Using Excel Michael R. Middleton School of Business and Management, University of San Francisco A histogram is usually shown in Excel as a Column chart type (vertical bars). The labels of a Column
Spreadsheet and Graphing Exercise Biology 210 Introduction to Research
 1 Spreadsheet and Graphing Exercise Biology 210 Introduction to Research There are many good spreadsheet programs for analyzing data. In this class we will use MS Excel. Below are a series of examples
Graphing on Excel. Open Excel (2013). The first screen you will see looks like this (it varies slightly, depending on the version):
. The first screen you will see looks like this (it varies slightly, depending on the version):") Graphing on Excel Open Excel (2013). The first screen you will see looks like this (it varies slightly, depending on the version): The first step is to organize your data in columns. Suppose you obtain
Graphing on Excel Open Excel (2013). The first screen you will see looks like this (it varies slightly, depending on the version): The first step is to organize your data in columns. Suppose you obtain
Basic tasks in Excel 2013
 Basic tasks in Excel 2013 Excel is an incredibly powerful tool for getting meaning out of vast amounts of data. But it also works really well for simple calculations and tracking almost any kind of information.
STAT 311 (3 CREDITS) VARIANCE AND REGRESSION ANALYSIS ELECTIVE: ALL STUDENTS. CONTENT Introduction to Computer application of variance and regression
 VARIANCE AND REGRESSION ANALYSIS ELECTIVE: ALL STUDENTS. CONTENT Introduction to Computer application of variance and regression") STAT 311 (3 CREDITS) VARIANCE AND REGRESSION ANALYSIS ELECTIVE: ALL STUDENTS. CONTENT Introduction to Computer application of variance and regression analysis. Analysis of Variance: one way classification,
STAT 311 (3 CREDITS) VARIANCE AND REGRESSION ANALYSIS ELECTIVE: ALL STUDENTS. CONTENT Introduction to Computer application of variance and regression analysis. Analysis of Variance: one way classification,
Dealing with Data in Excel 2013/2016
 Dealing with Data in Excel 2013/2016 Excel provides the ability to do computations and graphing of data. Here we provide the basics and some advanced capabilities available in Excel that are useful for
Activity: page 1/10 Introduction to Excel. Getting Started
 Activity: page 1/10 Introduction to Excel Excel is a computer spreadsheet program. Spreadsheets are convenient to use for entering and analyzing data. Although Excel has many capabilities for analyzing
Microsoft Office Excel
 Microsoft Office 2007 - Excel Help Click on the Microsoft Office Excel Help button in the top right corner. Type the desired word in the search box and then press the Enter key. Choose the desired topic
Beginner s Guide to Microsoft Excel 2002
 Beginner s Guide to Microsoft Excel 2002 Microsoft Excel lets you create spreadsheets, which allow you to make budgets, track inventories, calculate profits, and design charts and graphs. 1. Open Start
Open a new Excel workbook and look for the Standard Toolbar.
 This activity shows how to use a spreadsheet to draw line graphs. Open a new Excel workbook and look for the Standard Toolbar. If it is not there, left click on View then Toolbars, then Standard to make
Physics 251 Laboratory Introduction to Spreadsheets
 Physics 251 Laboratory Introduction to Spreadsheets Pre-Lab: Please do the lab-prep exercises on the web. Introduction Spreadsheets have a wide variety of uses in both the business and academic worlds.
Open Excel by following the directions listed below: Click on Start, select Programs, and the click on Microsoft Excel.
 Candy is Dandy Grading Rubric You have been hired to conduct some market research about M&M's. First, you had your team purchase 4 large bags and the results are given for the contents of those bags. You
Microsoft Excel 2007
 Microsoft Excel 2007 1 Excel is Microsoft s Spreadsheet program. Spreadsheets are often used as a method of displaying and manipulating groups of data in an effective manner. It was originally created
Excel tutorial Introduction
 Office button Excel tutorial Introduction Microsoft Excel is an electronic spreadsheet. You can use it to organize your data into rows and columns. You can also use it to perform mathematical calculations
Spreadsheet Warm Up for SSAC Geology of National Parks Modules, 2: Elementary Spreadsheet Manipulations and Graphing Tasks
 University of South Florida Scholar Commons Tampa Library Faculty and Staff Publications Tampa Library 2009 Spreadsheet Warm Up for SSAC Geology of National Parks Modules, 2: Elementary Spreadsheet Manipulations
MIS 0855 Data Science (Section 006) Fall 2017 In-Class Exercise (Day 18) Finding Bad Data in Excel
 Fall 2017 In-Class Exercise (Day 18) Finding Bad Data in Excel") MIS 0855 Data Science (Section 006) Fall 2017 In-Class Exercise (Day 18) Finding Bad Data in Excel Objective: Find and fix a data set with incorrect values Learning Outcomes: Use Excel to identify incorrect
MIS 0855 Data Science (Section 006) Fall 2017 In-Class Exercise (Day 18) Finding Bad Data in Excel Objective: Find and fix a data set with incorrect values Learning Outcomes: Use Excel to identify incorrect
2. create the workbook file
 2. create the workbook file Excel documents are called workbook files. A workbook can include multiple sheets of information. Excel supports two kinds of sheets for working with data: Worksheets, which
Excel. Spreadsheet functions
 Excel Spreadsheet functions Objectives Week 1 By the end of this session you will be able to :- Move around workbooks and worksheets Insert and delete rows and columns Calculate with the Auto Sum function
Excel Primer CH141 Fall, 2017
 Excel Primer CH141 Fall, 2017 To Start Excel : Click on the Excel icon found in the lower menu dock. Once Excel Workbook Gallery opens double click on Excel Workbook. A blank workbook page should appear
Chapter 3: Rate Laws Excel Tutorial on Fitting logarithmic data
 Chapter 3: Rate Laws Excel Tutorial on Fitting logarithmic data The following table shows the raw data which you need to fit to an appropriate equation k (s -1 ) T (K) 0.00043 312.5 0.00103 318.47 0.0018
EXCEL 98 TUTORIAL Chemistry C2407 fall 1998 Andy Eng, Columbia University 1998
 Created on 09/02/98 11:58 PM 1 EXCEL 98 TUTORIAL Chemistry C2407 fall 1998 Andy Eng, Columbia University 1998 Note for Excel 97 users: All features of Excel 98 for Macintosh are available in Excel 97 for
Excel Lesson 1 Microsoft Excel Basics
 Microsoft Excel Basics Microsoft Office 2010 Introductory 1 Objectives Define the terms spreadsheet and worksheet. Identify the parts of a worksheet. Start Excel, open an existing workbook, and save a
How to stay connected. Stay connected with DIIT
 Google Level 1 1 How to stay connected Stay connected with DIIT Google Sheets 3 Create a Google Sheet For this session open: SAMPLE DATA SHEET Yes, Make a Copy From Your Drive: New>>Google Sheets Or 4
Contents. Group 2 Excel Handouts 2010
 Contents Styles... 2 Conditional Formatting... 2 Create a New Rule... 4 Format as Table... 5 Create your own New Table Style... 8 Cell Styles... 9 New Cell Style... 10 Merge Styles... 10 Sparklines...
MICROSOFT EXCEL TUTORIAL HANDOUT
 MICROSOFT EXCEL TUTIAL HANDOUT Opening Microsoft Excel 1. Click on the START button. 2. Click on PROGRAMS. 3. Click on MICROSOFT EXCEL. The Excel Screen Formula Bar Minimize Buttons Restore Buttons Close
Chemistry Excel. Microsoft 2007
 Chemistry Excel Microsoft 2007 This workshop is designed to show you several functionalities of Microsoft Excel 2007 and particularly how it applies to your chemistry course. In this workshop, you will
Microsoft Word for Report-Writing (2016 Version)
") Microsoft Word for Report-Writing (2016 Version) Microsoft Word is a versatile, widely-used tool for producing presentation-quality documents. Most students are well-acquainted with the program for generating
Microsoft Word for Report-Writing (2016 Version) Microsoft Word is a versatile, widely-used tool for producing presentation-quality documents. Most students are well-acquainted with the program for generating
Scottish Improvement Skills
 Scottish Improvement Skills Creating a run chart on MS Excel 2007 Create and save a new Excel worksheet. Some of the details of steps given below may vary slightly depending on how Excel has been used
lab MS Excel 2010 active cell
 MS Excel is an example of a spreadsheet, a branch of software meant for performing different kinds of calculations, numeric data analysis and presentation, statistical operations and forecasts. The main
Intermediate Microsoft Excel (Demonstrated using Windows XP) Using Spreadsheets in the Classroom
 Using Spreadsheets in the Classroom") (Demonstrated using Windows XP) Using Spreadsheets in the Classroom Adapted from Taskstream Word Tutorial (2003) < http://www.taskstream.com > Updated 4/05 by Dr. Bruce Ostertag What Can Microsoft Excel
(Demonstrated using Windows XP) Using Spreadsheets in the Classroom Adapted from Taskstream Word Tutorial (2003) < http://www.taskstream.com > Updated 4/05 by Dr. Bruce Ostertag What Can Microsoft Excel
Data Management Project Using Software to Carry Out Data Analysis Tasks
 Data Management Project Using Software to Carry Out Data Analysis Tasks This activity involves two parts: Part A deals with finding values for: Mean, Median, Mode, Range, Standard Deviation, Max and Min
CONTENTS. 2 DRAG AND DROP DATA FROM FLEX APPS. 4 LINKING CALCULATORS WITH EIKON EXCEL. 7 RETRIEVE DATA USING INSERT FUNCTION.
 CONTENTS CONTENTS... 2 DRAG AND DROP DATA FROM FLEX APPS... 4 LINKING CALCULATORS WITH EIKON EXCEL... 7 RETRIEVE DATA USING INSERT FUNCTION... 8 EDITING AND MODIFYING YOUR DATA USING INSERT FUNCTION...
Introduction to the workbook and spreadsheet
 Excel Tutorial To make the most of this tutorial I suggest you follow through it while sitting in front of a computer with Microsoft Excel running. This will allow you to try things out as you follow along.
Introduction to CS graphs and plots in Excel Jacek Wiślicki, Laurent Babout,
 MS Excel 2010 offers a large set of graphs and plots for data visualization. For those who are familiar with older version of Excel, the layout is completely different. The following exercises demonstrate
Select the Points You ll Use. Tech Assignment: Find a Quadratic Function for College Costs
 In this technology assignment, you will find a quadratic function that passes through three of the points on each of the scatter plots you created in an earlier technology assignment. You will need the
Appendix A OPENING AN EXCEL SPREADSHEET: To start working with a blank Excel spreadsheet, you should: 1. Log on to your station s computer.
 Appendix A INTRODUCTION: Microsoft Excel is a popular software package that combines spreadsheet accounting, graphing, and database functions into one program. One can enter data, modify it, and then the
3/31/2016. Spreadsheets. Spreadsheets. Spreadsheets and Data Management. Unit 3. Can be used to automatically
 MICROSOFT EXCEL and Data Management Unit 3 Thursday March 31, 2016 Allow users to perform simple and complex sorting Allow users to perform calculations quickly Organizes and presents figures that can
Technology Assignment: Limits at Infinity
 The goal of this technology assignment is to find the location of the horizontal asymptote for your model from Technology Assignment: Rational Model. You will produce a graph similar to the one below.
Day : Date : Objects : Open MS Excel program * Open Excel application. Select : start. Choose: programs. Choose : Microsoft Office.
 Day : Date : Objects : Open MS Excel program * Open Excel application. Select : start Choose: programs Choose : Microsoft Office Select: Excel *The interface of Excel program - Menu bar. - Standard bar.
Agenda. Spreadsheet Applications. Spreadsheet Terminology A workbook consists of multiple worksheets. By default, a workbook has 3 worksheets.
 Agenda Unit 1 Assessment Review Progress Reports Intro to Excel Learn parts of an Excel spreadsheet How to Plan a spreadsheet Create a spreadsheet Analyze data Create an embedded chart in spreadsheet In
Troubleshooting in Microsoft Excel 2002
 Page 1 of 8 Troubleshooting in Microsoft Excel 2002 Result: To understand how to work with the Excel software to enter data, navigate the page, and print materials. Tabs Look at the tabs at the bottom
Using Excel This is only a brief overview that highlights some of the useful points in a spreadsheet program.
 Using Excel 2007 This is only a brief overview that highlights some of the useful points in a spreadsheet program. 1. Input of data - Generally you should attempt to put the independent variable on the
Microsoft Excel 2007 Creating a XY Scatter Chart
 Microsoft Excel 2007 Creating a XY Scatter Chart Introduction This document will walk you through the process of creating a XY Scatter Chart using Microsoft Excel 2007 and using the available Excel features
Name: Dr. Fritz Wilhelm Lab 1, Presentation of lab reports Page # 1 of 7 5/17/2012 Physics 120 Section: ####
 Name: Dr. Fritz Wilhelm Lab 1, Presentation of lab reports Page # 1 of 7 Lab partners: Lab#1 Presentation of lab reports The first thing we do is to create page headers. In Word 2007 do the following:
Excel R Tips. is used for multiplication. + is used for addition. is used for subtraction. / is used for division
 Excel R Tips EXCEL TIP 1: INPUTTING FORMULAS To input a formula in Excel, click on the cell you want to place your formula in, and begin your formula with an equals sign (=). There are several functions
Step 3: Type the data in to the cell
 Simple Instructions for using Microsoft Excel The goal of these instructions is to familiarize the user with the basics of Excel. These directions will cover data entry, formatting, formulas and functions,
Gloucester County Library System EXCEL 2007
 Gloucester County Library System EXCEL 2007 Introduction What is Excel? Microsoft E x c e l is an electronic s preadsheet program. I t is capable o f performing many diff e r e n t t y p e s o f c a l
3. Saving Your Work: You will want to save your work periodically, especially during long exercises.
 Graphing and Data Transformation in Excel ECON 285 Chris Georges This is a brief tutorial in Excel and a first data exercise for the course. The tutorial is written for a novice user of Excel and is not
BioFuel Graphing instructions using Microsoft Excel 2003 (Microsoft Excel 2007 instructions start on page mei-7)
") BioFuel Graphing instructions using Microsoft Excel 2003 (Microsoft Excel 2007 instructions start on page mei-7) Graph as a XY Scatter Chart, add titles for chart and axes, remove gridlines. A. Select
BioFuel Graphing instructions using Microsoft Excel 2003 (Microsoft Excel 2007 instructions start on page mei-7) Graph as a XY Scatter Chart, add titles for chart and axes, remove gridlines. A. Select
Microsoft Excel 2007 Lesson 7: Charts and Comments
 Microsoft Excel 2007 Lesson 7: Charts and Comments Open Example.xlsx if it is not already open. Click on the Example 3 tab to see the worksheet for this lesson. This is essentially the same worksheet that
The Menu and Toolbar in Excel (see below) look much like the Word tools and most of the tools behave as you would expect.
 look much like the Word tools and most of the tools behave as you would expect.") Launch the Microsoft Excel Program Click on the program icon in Launcher or the Microsoft Office Shortcut Bar. A worksheet is a grid, made up of columns, which are lettered and rows, and are numbered.
Launch the Microsoft Excel Program Click on the program icon in Launcher or the Microsoft Office Shortcut Bar. A worksheet is a grid, made up of columns, which are lettered and rows, and are numbered.
Y8 IT in Science Using Forces
 Y8 IT in Science Using Forces IT in Science Information Technology can be used in all subjects but is very useful for Science. We can use Information Technology in Science to help us with all these things:
PART ONE 1. LAYOUT. A file in Excel is called a Workbook. Each Workbook is made up of Worksheets (usually three but more can be added).
.") PART ONE 1. LAYOUT A file in Excel is called a Workbook. Each Workbook is made up of Worksheets (usually three but more can be added). The work area is where the data and formulae are entered. The active
PART ONE 1. LAYOUT A file in Excel is called a Workbook. Each Workbook is made up of Worksheets (usually three but more can be added). The work area is where the data and formulae are entered. The active
Math 2524: Activity 1 (Using Excel) Fall 2002
 Fall 2002") Math 2524: Activity 1 (Using Excel) Fall 22 Often in a problem situation you will be presented with discrete data rather than a function that gives you the resultant data. You will use Microsoft Excel
Math 2524: Activity 1 (Using Excel) Fall 22 Often in a problem situation you will be presented with discrete data rather than a function that gives you the resultant data. You will use Microsoft Excel
Training Guide. Microsoft Excel 2010 Advanced 1 Using Conditional and Custom Formats. Applying Conditional Formatting
 Microsoft Excel 2010 Advanced 1 Using Conditional and Custom Formats Applying Conditional Formatting Excel lets you quickly apply Conditional Formatting to help you explore and analyze data visually, detect
To be able to create charts that graphically represent your worksheet data, you will: Create column charts on chart sheets by using the F11 key.
 L E S S O N 1 Creating charts Suggested teaching time 55-65 minutes Lesson objectives To be able to create charts that graphically represent your worksheet data, you will: a b c Create column charts on
Lab 5 Excel Spreadsheet Introduction
 Lab 5 Excel Spreadsheet Introduction Step 1 Start Excel Under Start, select All Programs the Microsoft Office then Excel. Select the File tab and save your file as lab5 on your network drive. Step 2 Spreadsheet
MICROSOFT EXCEL BIS 202. Lesson 1. Prepared By: Amna Alshurooqi Hajar Alshurooqi
 MICROSOFT EXCEL Prepared By: Amna Alshurooqi Hajar Alshurooqi Lesson 1 BIS 202 1. INTRODUCTION Microsoft Excel is a spreadsheet application used to perform financial calculations, statistical analysis,
Charts in Excel 2003
 Charts in Excel 2003 Contents Introduction Charts in Excel 2003...1 Part 1: Generating a Basic Chart...1 Part 2: Adding Another Data Series...3 Part 3: Other Handy Options...5 Introduction Charts in Excel
EXCEL 2007 TIP SHEET. Dialog Box Launcher these allow you to access additional features associated with a specific Group of buttons within a Ribbon.
 EXCEL 2007 TIP SHEET GLOSSARY AutoSum a function in Excel that adds the contents of a specified range of Cells; the AutoSum button appears on the Home ribbon as a. Dialog Box Launcher these allow you to
Designed by Jason Wagner, Course Web Programmer, Office of e-learning NOTE ABOUT CELL REFERENCES IN THIS DOCUMENT... 1
 Excel Essentials Designed by Jason Wagner, Course Web Programmer, Office of e-learning NOTE ABOUT CELL REFERENCES IN THIS DOCUMENT... 1 FREQUENTLY USED KEYBOARD SHORTCUTS... 1 FORMATTING CELLS WITH PRESET
Tricking it Out: Tricks to personalize and customize your graphs.
 Tricking it Out: Tricks to personalize and customize your graphs. Graphing templates may be used online without downloading them onto your own computer. However, if you would like to use the templates
You can retrieve the chart by inputting the symbol of stock, warrant, index futures, sectoral
 Chart Menu Chart menu displays graphical data with histories and 16 major technical analysis tools and Trend Line. You can click at the tool you like. Chart will be changed according to your selection.
0 Graphical Analysis Use of Excel
 Lab 0 Graphical Analysis Use of Excel What You Need To Know: This lab is to familiarize you with the graphing ability of excels. You will be plotting data set, curve fitting and using error bars on the
1. Setup Everyone: Mount the /geobase/geo5215 drive and add a new Lab4 folder in you Labs directory.
 L A B 4 E X C E L For this lab, you will practice importing datasets into an Excel worksheet using different types of formatting. First, you will import data that is nicely organized at the source. Then
KIN 147 Lab Practical Mid-term: Tibial Acceleration Data Analysis Excel analyses work much better on PCs than on Macs (especially older Macs)
") KIN 147 Lab Practical Mid-term: Tibial Acceleration Data Analysis Excel analyses work much better on PCs than on Macs (especially older Macs) Your goal is to correctly analyze accelerometer data Analyzing
KIN 147 Lab Practical Mid-term: Tibial Acceleration Data Analysis Excel analyses work much better on PCs than on Macs (especially older Macs) Your goal is to correctly analyze accelerometer data Analyzing
Introduction to Spreadsheets Part 1. The Quick and Easy guide to using Openoffice Calc
 Introduction to Spreadsheets Part 1 The Quick and Easy guide to using Openoffice Calc By the end of the lesson, you will be able to say I know what a spreadsheet is, I can enter simple data into a spreadsheet,
Excel Basics. TJ McKeon
 Excel Basics TJ McKeon What is Excel? Electronic Spreadsheet in a rows and columns layout Can contain alphabetical and numerical data (text, dates, times, numbers) Allows for easy calculations and mathematical
Project 11 Graphs (Using MS Excel Version )
") Project 11 Graphs (Using MS Excel Version 2007-10) Purpose: To review the types of graphs, and use MS Excel 2010 to create them from a dataset. Outline: You will be provided with several datasets and will
Project 11 Graphs (Using MS Excel Version 2007-10) Purpose: To review the types of graphs, and use MS Excel 2010 to create them from a dataset. Outline: You will be provided with several datasets and will
J. La Favre Calibrating Sharp Distance Sensors July 18, 2018
 GEAR has a number of Sharp brand IR distance sensors that can be used to determine distance to a target object. This type of sensor can be useful for maze robot projects as well as others. Sharp offers
Reference and Style Guide for Microsoft Excel
 Reference and Style Guide for Microsoft Excel TABLE OF CONTENTS Getting Acquainted 2 Basic Excel Features 2 Writing Cell Equations Relative and Absolute Addresses 3 Selecting Cells Highlighting, Moving