Report Designer Report Types Table Report Multi-Column Report Label Report Parameterized Report Cross-Tab Report Drill-Down Report Chart with Static
|
|
|
- Reynard Ramsey
- 5 years ago
- Views:
Transcription
1 Table of Contents Report Designer Report Types Table Report Multi-Column Report Label Report Parameterized Report Cross-Tab Report Drill-Down Report Chart with Static Series Chart with Dynamic Series Master-Detail Report (Subreports) Master-Detail Report (Detail Report Bands) Master-Detail Report Creating Reports Basic Operations Providing Data Shaping Data Appearance Customization Report Navigation and Interactivity Add Details about a Report Scripting Report Elements Report Controls Report Bands Interface Elements Design Surface Field List Main Toolbar Menu Properties Panel Query Builder Report Explorer Toolbox
2 Custom SQL Editor Expression Editor Filter Editor Format String Editor Master-Detail Relation Editor Script Editor Wizards SQL Data Source Wizard Report Wizard Document Preview Preview Toolbar Export Options Panel Search Panel Document Map Panel Preview Parameters Panel

3 Report Designer This section of the documentation describes the basic principles of creating reports with Web Report Designer. The Web Report Designer allows you to create new reports from scratch, bind them to data, display a report's Print Preview and send its output to a printer or export it to a file on a disk. The Web Report Designer's main features: a JavaScript/HTML5 engine that provides a responsive user interface for in-browser reporting on the client; an integrated Property Grid, a Quick Access panel for editing commonly used options, a Data Explorer and Parameters panels; a rich set of report controls (see the Toolbox document for a complete list of available controls); cross-browser compatibility. Different aspects of using the Web Report Designer are covered in the following documentation sections. Report Types Creating Reports Report Elements Interface Elements Wizards Document Preview
4 Report Types The tutorials in this section provide you detailed instructions on how to create reports of different types with the Web Report Designer. Table Report Multi-Column Report Label Report Master-Detail Report Parameterized Report Cross-Tab Report Drill-Down Report Chart with Static Series Chart with Dynamic Series
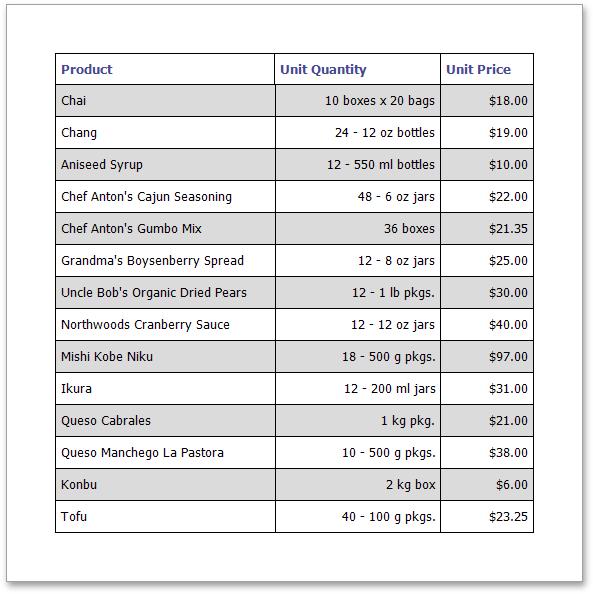
5 Table Report This tutorial describes the steps to create a table report, which means that the report's data is arranged into a table-like layout. This feature should not be confused with the master-detail report or cross-tab report. To create a table report, follow the steps below. 1. Create a new report and bind it to a data source. 2. To add a Page Header to the report, switch to the Properties Panel, expand the Actions category and click Insert Page Header Band. 3. Now, add two Table controls to the report's Page Header and Detail band. To do this, drag the Table report control from the Toolbox and drop it onto the Page Header band. Then, add a table to the Detail band in the same way. One table will be used as a header, and the other one - for the report's detail information. 4. Type the headers into the upper table's cells, and bind the corresponding cells in the detail section to the appropriate data fields. To do this, select a table cell and set its Data Binding property to the required data field.

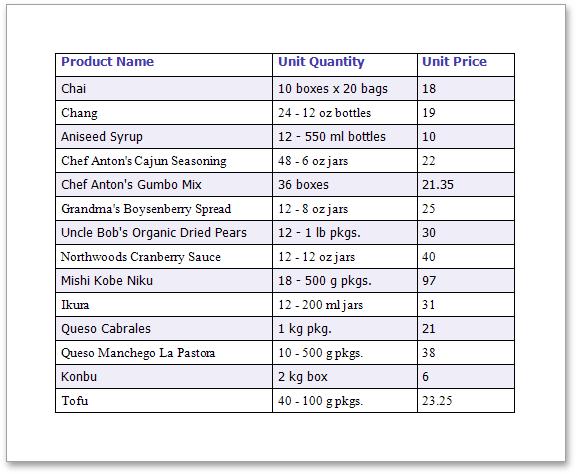
6 5. Finally, you can customize various properties of the tables to improve their appearance. For example, in the Appearance category of the Properties Panel, you can define the Borders property, as well as the Background Color property. To customize cell text options, specify the Font property. A noteworthy feature is the capability to specify odd-even styles for the detail table. The table report is now ready. Switch your report to the Preview mode and view the result.
7

8 Multi-Column Report This tutorial describes the steps to create a multi-column report, meaning that each page of the report document is laid out in a specified number of columns. To demonstrate the multi-column feature, we'll use a report with grouping, similar to the one created in the Grouping Data tutorial. 1. Select the Detail band, and in the Properties Panel, expand the Actions or Behavior category. Then, expand the Multi-Column Options section and set the required Mode. It determines whether the number of columns is manually specified or if it depends on the fixed column width. 2. Then, if you've chosen to Use Column Count, set the Column Count to 2, and Column Spacing to 10. The Layout determines the order in which records of the same group are processed.


9 3. Now, on the Detail band's surface, a grey area appears, delimiting the available column's width. Adjust the controls width, so that they fit within the effective borders. The multi-column report is now ready. Switch your report to the Preview mode, and view the result.


10 Label Report This tutorial describes the steps to create a label report containing employee badges. To accomplish this task, do the following. 1. In the Menu, click New via Wizard. 2. Next, the Wizard will guide you through the process of creating a label report. For detailed instructions on wizard steps, refer to Label Report. 3. After performing the above steps you will see that the report's Detail band is divided into three different areas. The first area at the left-hand side indicates the actual available band area for controls to be placed within it. The gray area at the righthand side is intended for the columns in which labels will be displayed, so it cannot be occupied by controls. Finally, the white area specifies an indent between the available and reserved areas. 4. Bind the report to data containing information about employees. You can use an existing data source or create a new one using the SQL Data Source Wizard. 5. Then, drop the required fields from the Field List onto the available Detail band's area, and adjust the layout.

11 The label report is now ready. Switch your report to the Preview mode and view the result.

 to expand the properties list.")
12 Parameterized Report This tutorial describes the steps to create a report with parameters. In this example, we will create two date-time parameters to filter out orders that don't fall in the specified range from the report. To add parameters and filter your report based on their values, follow the steps below. 1. First, create a new report and bind it to a data source. 2. In the Field List panel, select the Parameters node and click the Add parameter button to the right. 3. Click the Edit button ( ) to expand the properties list. Specify the Name and Description of the created parameter, and make sure to set its Type to an appropriate value. To display this parameter in the Preview Parameters Panel, enable its Visible property. N o t e In the Document Preview, the report's document is not generated until you have submitted values of all the parameters with enabled Visible property. 4. To assign a list of values to this report parameter, specify the Look-Up Settings Type property. Set this property to the Dynamic List to obtain parameter values from a data source. In this case, you should specify a parameter's data source, data member, value member and display member. The value member defines a data field that provides values to the parameter. The display member defines a data field that provides display names for parameter values (how these values appear in the user interface available in a Print Preview).


13 Set this property to Static list to manually fill the list of parameter values. Each parameter value has an individual description (specifying how this value appears in the Preview Parameters Panel). Then, repeat the previous steps to create the second parameter, so that every time your report is previewed, you will be asked to specify two dates. The following instructions explain how to use parameters to filter your report's data. 5. Switch to the Properties Panel and click the ellipsis button for the report's Filter String property. Then, in the invoked Filter Editor, construct an expression where a data field is compared with the created parameters. To add a parameter to an expression, expand the drop-down menu for a value placeholder and select the Parameter item. This will convert the value placeholder into a parameter placeholder. Next, click the placeholder to choose the parameter.

14 Click Save to exit the Filter Editor. The parameterized report is now ready. Switch the report to the Preview mode, and in the Preview Parameters Panel, define the required values and click Submit.


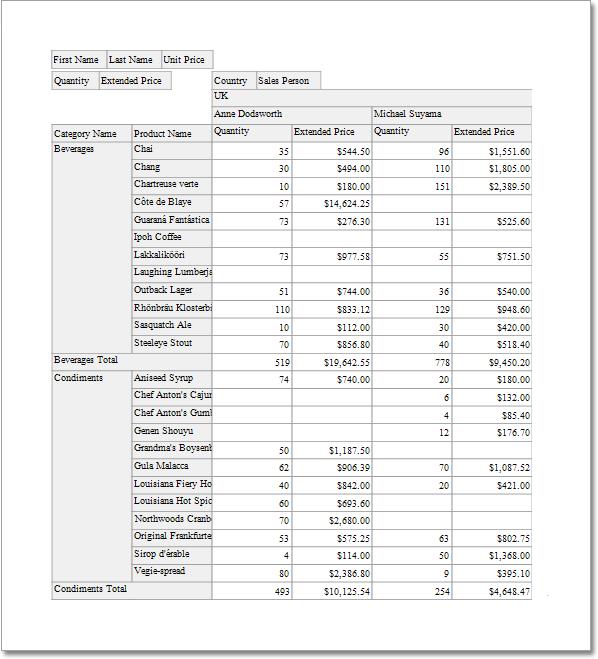
15 Cross-Tab Report This tutorial describes the steps to create a cross-tab report using a Pivot Grid that calculates automatic summaries and grand totals across a large number of grouped rows and columns. This feature should not be confused with the master-detail report or table report. To create a cross-tab report, do the following. 1. Create a new report and bind it to a data source. 2. Drop the Pivot Grid control from the Toolbox onto the report's Detail band. 3. To bind the Pivot Grid to a data source, in the Properties Panel, expand the Actions or Data category and specify the Data Source and Data Member properties. The Data Member property defines from which table or view of your dataset the grid obtains its data. N o t e Since you have placed the Pivot Grid in the Detail band, the report's Data Source property should be set to None. Otherwise, the Pivot Grid will repeated at the preview as many times as there are records in the data source.

16 4. To add a field to the particular grid area, expand the Actions category and click one of the following buttons. ICON D ES CR IPTION Adds a field to the Column Header area. This field's values will represent column headers. Adds a field to the Row Header area. This field's values will represent row headers. Adds a field to the Data Header area. The summaries will be calculated for all the cells, each cell is identified by a specific column and row. Adds a field to the Filter Header area. This field is available for further customizations. Add two column fields, two row fields and two data fields, using these buttons. You can also add several filter fields. The image below illustrates the updated grid, which reflects the newly added fields. 5. To adjust a Pivot Grid field, switch to the Properties Panel, expand the Report Controls drop-down list and select the required grid field. In the Data category, specify the Data Column Name property to bind a grid field to a data source field.


17 You can also specify the field position, using the Area property or change the order of fields within their area, specifying the Area Index property. If required, it is possible to customize many other properties for the Pivot Grid and its fields. 6. On the last step, you can set your report's Vertical Content Splitting option to Smart. This will split the grid's columns precisely by their borders in the Print Preview. The cross-tab report is now ready. Switch your report to the Preview mode and view the result.
18


19 Drill-Down Report This tutorial describes the steps required to create a drill-down report. Drill-down reports represent data partially - some data is hidden and not printed on report pages. Hidden data can be accessed in the Preview mode by clicking a designated element, such as label or image. To create a drill-down report, do the following. 1. Create a master-detail report using Detail Report bands. 2. To create a link for showing/hiding the detail report, drag the Label report control from the Toolbox and drop it onto the report's Detail band. Switch to the Properties Panel and change the label's Text property to Show/Hide Details, and Name to lblshowhide. 3. Select the Detail Report band and expand the drop-down list for the band's DrillDownControl property in the Properties Panel. This list displays all report controls available on the report band that is one level above the current band in the report bands hierarchy. Select the lblshowhide label on the list. This will make the label expand or collapse the Detail Report band when clicked in the Preview mode.

20 You can also specify the band's DrillDownExpanded property to define whether or not the band is initially expanded. By default, this property is enabled. The drill-down report is now ready. Switch your report to the Preview mode and view the result.
21 Chart with Static Series This document describes how to create a report with a Chart control that displays products and their prices for a selected category. In this example, series data has a single data source, but you can use different data sources for different series if required. To adjust a Chart by manually creating its series, do the following: 1. Create a new report and bind it to a data source. 2. Drop the Chart control from the Toolbox onto the report's Detail band. 3. To bind the Chart to a data source, in the Properties Panel, expand the Data category and specify the Data Source property. N o t e Set the report's Data Source property to None after placing the Chart in the Detail band. Otherwise, the Chart repeats at the preview as many times as there are records in the data source.

22 4. Select the Chart control once again and click the Run Designer button displayed over it. 5. In the invoked Chart Designer, add a new series to the Chart control. To do this, locate the Series element in the Chart Structure tree and click the plus button. In the invoked list of series types, select the required type (for example, Bar).

23 6. To populate the created series with points, select it in the tree and switch Properties panel at the right of the Designer's window. Assign the required data fields to the Argument Data Member and Value Data Members properties to define coordinates for series points. 7. To filter series data, expand the Data Filters category, create and adjust filtering criteria as demonstrated below. 8. Create one more series with the same settings, but this time, select the Point view type. 9. To improve your Chart's appearance, you can make the following adjustments: Remove the Chart's legend as it shows the same data for both series by selecting the Lagend item in the Chart Structure and setting its Visibility property to False. The point labels for Series1 are unnecessary, so set the Labels Visibility property to False. Rotate the X-axis labels for better readability. To do this, select the Primary Axis X node in the tree and adjust properties for its labels (using the Label property). For instance, set the Angle property to 20 and the Enable Antialiasing property to True. It is also possible to customize other Chart properties. The chart is now ready. Switch your report to the Preview mode and view the result.
24


25 Chart with Dynamic Series This document describes how to create a report with a Chart control bound to data so that all series are automatically created based on a common template, which specifies universal options for all series. To adjust a Chart with automatically created series, do the following: 1. Create a new report and bind it to a data source. 2. Drop the Chart control from the Toolbox onto the report's Detail band. 3. To bind the Chart to a data source, in the Properties Panel, expand the Data category and specify the Data Source property. N o t e Set the report's Data Source property to None after placing the Chart in the Detail band. Otherwise, the Chart repeats at the preview as many times as there are records in the data source.
26 4. Select the Chart control once again and click the Run Designer button displayed over it. 5. In the invoked Chart Designer, select the Chart node in the Chart Structure tree and switch to the Properties panel. Use the Series Data Member property to specify the data field that should provide data for the series names (so that it creates a new series for each record in that data field). 6. Expand the Series Template option and use the Argument Data Member and Value Data Members properties to define from where to obtain data for point arguments and values.

27 At this step, the chart's data options are completely defined. It is also possible to customize other Chart properties. Switch your report to the Preview mode to view the result.
.")


28 Master-Detail Report (Subreports) This tutorial describes the steps to create a master-detail report using the Subreport control. For an alternative approach, refer to Master-Detail Report (Detail Report Bands). To create a master-detail report using the subreport controls, do the following. Create a Master Report Create and Customize a Detail Report Configure Subreport Parameter Bindings Get the Result Create a Master Report 1. Create a new report and bind it to a data source. In the Report Wizard, select the data table that will be used as the master table. 2. Drop the required fields from the Field List onto the Detail band. In this tutorial, we'll use the following report layout. 3. Drag the Subreport control from the Toolbox and drop it onto the Detail band.


29 Double-click the added subreport to open the detail report. To switch between master and detail reports, click the corresponding tab in the bottom left corner of the Design Surface. Create and Customize the Detail Report 1. Bind the detail report to a data source using the Report Wizard. In the Report Wizard, select the data table that will be used as the detail table. 2. Drop the required fields from the Field List onto the Detail band. In this tutorial, we'll use the following layout for the detail report. 3. To add a parameter to the report, in the Field List, select the Parameters node and click Add parameter. 4. Then, specify properties of this parameter as shown below.


30 5. To filter the detail report data, switch to the Properties Panel and click the ellipsis button for the report's Filter String property. Then, in the invoked Filter Editor, construct an expression where the CategoryID data field is compared to the CatID parameter. To add a parameter to an expression, expand the drop-down menu for a value placeholder and select the Parameter item. This will convert the value placeholder into a parameter placeholder. Next, click the placeholder to choose the parameter. Click Save to exit the Filter Editor.


31 6. Invoke the menu of the Web Report Designer and click Save to save the detail report to the server-side report storage. In the invoked Save Report dialog, specify the report name and click Save. N o t e You can utilize the Subreport control to re-use an already existing report in the server-side report storage as a detail report. To do this, drop the Subreport control onto a report band, expand the drop-down list for the subreport's Report Source Url property and select the required report.


32 Configure Subreport Parameter Bindings Switch back to the master report and bind the subreport's CatID parameter used as a filtering criterion to the master report's CategoryID data field, which will serve as a source of the parameter value. To do this, select the subreport, expand the Data category on the Properties Panel, select the Parameter Bindings section and add a new parameter binding. In the binding properties list, specify the data field to which you want to bind a subreport parameter and the name of the parameter that you want to bind. Get the Result The master-detail report is now ready. Switch the master report to the Preview mode to view the result.
33
34 Master-Detail Report (Detail Report Bands) This tutorial describes how to create a master-detail report with hierarchically linked data using the Detail Report band. For an alternative approach, refer to Master-Detail Report (Subreports). The topic consists of the following sections. Create a Report and Bind It to Data Design a Master-Detail Report View the Result Create a Report and Bind It to Data This document section describes how to create a new report and bind it to a data source containing a master-detail relationship between instances. 1. Create a new blank report by clicking New in the Designer's menu. 2. To create a new data source, invoke the Designer's menu once again and click Add SQL Data Source. 3. The first page of the invoked SQL Data Source Wizard allows you to select a data connection that provides necessary information to connect to a database.
35 Click Next to proceed to the next wizard page. 4. On the following page, you can choose which tables, views and/or stored procedures from your data source to display in the report. To create a master-detail report, select two or more tables and click Next. 5. On the next wizard page, define a master-detail relationship between queries by specifying their corresponding keys. To do this, click the plus button next to the master query, choose the detail query to add a new relationship and specify the relationship condition as shown in the following image.

36 Click Finish to complete the wizard. The hierarchy of the created data source will be reflected in the Field List. Design a Master-Detail Report To construct the layout of a master-detail report, do the following. 1. Select a report and switch to the Properties Panel. Expand the Actions category and click Insert Detail Report Band.
. 3.")


37 2. Set the Data Member property of the master report to the master query (in this example, it is the Categories query). 3. To generate the detail report properly, set its Data Member property to the name of the master-detail relationship (e.g., CategoriesProducts in this tutorial). 4. Then, drop the required data fields from the Field List onto the report bands. For the detail report, take fields from the

38 master-detail relationship (the CategoriesProducts section). View the Result The master-detail report is now ready. Switch your report to the Preview mode and view the result.
39 Master-Detail Report A report is usually called Master-Detail if it is used to display data from a hierarchical data source. There are two main approaches for creating a master-detail report in XtraReports. The first approach is based upon using the Detail Report band. The second approach is to create two different reports, and incorporate the detail report into the master report as a subreport. To see a detailed step-by-step demonstration of how detail report bands and subreports are used to create a master-detail report, refer to the following tutorials. Master-Detail Report (Detail Report Bands) Master-Detail Report (Subreports)
40 Creating Reports With the Web Report Designer, you can edit existing reports, as well as create your own reports from scratch. The following sections contain tutorials providing step-by-step instructions on basic and advanced report customization. Basic Operations Providing Data Shaping Data Appearance Customization Report Navigation and Interactivity Add Details about a Report Scripting
41 Basic Operations The topics in this section cover the basics of working with reports in the Web Report Designer. This section consists of the following topics. Create a New Report Create Report Elements Change Measurement Units of a Report Adjust Page Layout Settings Adjust the Layout of Report Elements

42 Create a New Report This topic explains how to create a new blank report in the Report Designer. To create a new report, do one of the following. Create a New Blank Report In the designer menu, click New. The newly created report will be opened in a separate designer tab. By default, the created report contains three bands - a Page Header, Detail band, and Page Footer. Create a New Report Using the Report Wizard In the main menu, click New via Wizard.
43 For more information about this option, refer to Report Wizard.

44 Create Report Elements This topic describes how to add report controls and bands to a report using the Web Report Designer. This document consists of the following sections. Create Report Controls Create Report Bands Create Report Controls All available report controls are listed in the Toolbox. To add a control to the currently opened report, drag and drop it onto an appropriate report band. Report controls of appropriate types are created automatically, after you drag items from the Field List and drop them onto the report surface. Create Report Bands To add a new band of a particular type, switch to the Properties Panel, select the report or an existing band in the Report Controls drop-down list. Then, expand the Actions category and click one the available buttons.
45 B U T TON D ES CR IPTION Inserts a Top Margin band. Inserts a Report Header band. Inserts a Page Header band. Inserts a Group Header band. Inserts a Detail band. Inserts a Detail Report band. Inserts a Group Footer band. Inserts a Page Footer band. Inserts a Report Footer band. Inserts a Bottom Margin band. Inserts a Sub-Band. Select an existing band to enable this button. After creating a report element, you can bind it to data, customize element layout and appearance. For more information, see the following topics. Bind Report Controls to Data Adjust the Layout of Report Elements Appearance Customization

46 Change Measurement Units of a Report For your report, you can choose its global Measure Units, which can be set to Hundredths of an Inch, Tenths of a Millimeter, or to Pixels. To specify the Measure Units property, switch to the Properties Panel and select the report in the Report Controls drop-down list. Then, expand the Actions or Behavior category and set this property to the required value. This defines the basic measurement unit for all the unit-related options of a report and its bands and controls (such as location, size, border width, etc.). And this determines the measurement unit of the report's Snap Grid.


47 Adjust the Layout of Report Elements This document describes how to customize the layout of a report element after it is created. To move and resize an element or align it within the current report, perform one the following actions. Select Report Elements Move and Resize Report Elements Align and Position Report Elements Select Report Elements To select a report control or a band, click it. For multiple controls selection, click report controls while holding the CTRL key down. Alternatively, click on a blank space and drag the mouse to create a selection frame. When the mouse button is released, all controls within the selection frame's boundaries will be selected. In this case, the previous selection is cleared. Move and Resize Report Elements To move a report control, select it, and drag the control to the new location. To move it using the keyboard, press the arrow keys. To resize a control using the mouse, select it, and then drag a rectangle drawn on its edge or corner. You can also move and resize multiple selected report controls in the same way as individual controls. To resize a report band, drag its bottom border. After moving and resizing report elements, you may notice red warning marks, indicating that the controls overlap or go beyond the page margins.


48 Align and Position Report Elements The Web Report Designer allows you to establish the distance between report elements and precisely align them to each other. To align the selected control or multiple selected controls, switch to the Properties Panel, expand the Actions category, and click an appropriate button. To quickly align and resize a control to the report's Snap Grid, click the following buttons. B U T TON D ES CR IPTION Aligns a control to the Snap Grid. Resizes a control to the Snap Grid. You can also adjust the Snap Grid Size, which is measured in the measurement units set for your report. To center the selected controls within a band, use the following buttons.
49 B U T TON D ES CR IPTION Horizontally centers a control within a band. Vertically centers a control within a band. To position and align the multiple report controls to each other, select the primary control that is taken as a sample, then select the control(s) to be adjusted and click one of the following buttons. B U T TONS D ES CR IPTION Specify the horizontal (Left, Center or Right) and vertical (Top, Middle or Bottom) control alignment. Make the selected controls have the same size. Make equal horizontal and vertical spaces between the selected controls. Increase horizontal and vertical spacing between the selected controls. Decrease horizontal and vertical spacing between the selected controls. Remove all horizontal and vertical spacing between the selected controls. In addition, to copy, paste and delete controls simultaneously, you can place them within the Panel.

50 Adjust Page Layout Settings In the Web Report Designer, you can change page layout settings before you print a report. To specify the report's page settings, switch to the Properties Panel, and in the Report Controls drop-down list, select the report. Expand the Page Settings category and adjust the following page settings. Paper Kind You can select one the predefined paper sizes or specify a custom paper size. To create your own paper size, set the Paper Kind property to Custom, and then specify the Page Width and Page Height properties. Margins To modify page margins, specify the Margins property or move sliders on the horizontal and vertical ruler in the report's Design Surface.
51 The margin values are expressed in the report's measurement units. Roll Paper If this flag is enabled, the document is supposed to be printed on a roll of paper (i.e., as a single uninterrupted page). This setting will affect the corresponding page options (such as the page number values), as well as disable page-specific commands in the Print Preview (i.e., the Navigation and Multipage Mode options). Landscape This flag determines whether the page orientation is Landscape (when enabled) or Portrait (when disabled).
52 Providing Data The topics in this section highlight the basic concepts of providing data for reports and their elements (such as calculated fields and parameters) in the Web Report Designer. Bind a Report to Data Bind Report Controls to Data Report Parameters Query Parameters Calculated Fields
53 Bind a Report to Data The Web Report Designer is primarily designed to work with data-aware reports, which means that a report obtains its general (dynamic) data from an external data source. This document describes how to bind a report to a data source. The document consists of the following sections. Use an Existing Data Source Create a New Data Source Use an Existing Data Source Since the Web Report Designer allows you to work with the currently opened report, you can recreate this report and bind it to data, using an existing data source. To do this, run the Report Wizard. The Report Wizard includes several steps, and depending on how many steps are completed (you don't necessarily have to go through all the pages), you can bind a report to data, apply data grouping, display totals, etc. The Report Wizard topic provides you with information about the steps of the wizard. Create a New Data Source You can also create a new data source and configure it, using the SQL Data Source Wizard.


54 Note that the SQL Data Source Wizard is only available if your software provider explicitly enabled this functionality by supplying the Web Report Designer with a set of default data connections. For more information on how to use the SQL Data Source Wizard, see the SQL Data Source Wizard topic. After binding a report to data, the Field List shows the structure of the report's data source. Fields from the Field List can be dropped onto the report to create data-aware controls of the appropriate type. When a bound data source contains more than one data table, you can specify the data table from which your report obtains its data. To do this, specify the report's Data Member property.
55 Bind Report Controls to Data This topic describes how report controls can be bound to data fields, and explains how controls are rendered on different report bands. This document consists of the following sections. Controls Binding Controls Unbinding Control Behavior on Different Bands Controls Binding A report control can be bound to a data field available in the report's data source. And a control can also be bound to a calculated field or parameter. You can provide data to elements of the report in the following ways. Create a Data-Aware Element The Web Report Designer allows you to add a new bound report control using the Field List. To create a data-aware element, switch to the Field List panel, click the desired field item, and then drag and drop it onto the report band. After this, a control that is bound to the selected data field will appear. Bind an Element to Data To bind an existing report element to a data member, select this element, switch to the Properties Panel, and in the Actions category, specify the Data Bindings property.


56 Or in the Properties Panel, expand the Data category, then expand the Data Bindings section, and choose the property you want to bind. After that, you can also specify a format for output values. For details, refer to Formatting Data. Controls Unbinding To unbind a control's property, switch to the Properties Panel, and set the Data Bindings property to None. Control Behavior on Different Bands When binding a control to a data field, its rendering depends on the band type where the control resides. For example, if a control is placed in the Detail band, every single record in the data source will be returned and displayed in the control. Bound controls in grouping bands show data by dividing all data into groups.

57 And bound controls in remaining bands display data from the record which is current when the band they are in is being printed/displayed. This is illustrated in the following images. R EPOR T D ES IG NER R EPOR T PR EVIE W

58 Report Parameters This document describes the main concepts of using parameters in the Web Report Designer and provides information on how to create parameters and pass their values. The document consists of the following sections. Using Parameters Create Parameters Pass Parameter Values Using Parameters Report parameters provide the capability to pass data of a certain type to a report and are commonly used to achieve the following goals. Filtering Probably one of the most common scenarios of using parameters is to filter report data according to the current parameter value by specifying the report's Filter String. For more information, see the Filtering Data topic. Data Binding To show a parameter's value in a report, drag the parameter from the Field List panel and drop it onto the required band. This creates a Label bound to the parameter, as with an ordinary data field. For more information, see the Bind Report Controls to Data topic. Calculated Fields Parameters can participate in constructing expressions for calculated fields, as well as standard data fields. The only difference is that the data field is inserted into the expression's text using its name in [square brackets], while a parameter is inserted using the "Parameters." prefix before its name. Cascading Parameters You can filter parameter values by specifying the filtering expression that can also include other parameter values. To construct this filtering expression, set the parameter's Look-Up Settings Type property to Static List or Dynamic List and then specify its Filter String property.

59 Multi-Value Parameters If a parameter is bound to a collection of standard values, it is possible to store more than one value in it. To do this, enable the parameter's MultiValue property. Create Parameters To create a new report parameter, do the following. 1. Switch to the Field List panel, select the Parameters node and click the Add parameter button. 2. Click the Edit button (the 'pencil' icon ) to expand the property list and specify the parameter's Name, Description, Type and the parameter's default Value.

. D ynamic List If you choose this item, you can specify a parameter's data source, data adapter and data member.")
60 Enable the Visible property to make the parameter visible in the Print Preview and allows modifying its value before report creation. In this example, keep the Look-Up Settings property set to No Look-Up. To provide a list of pre-defined values for the parameter, set the Look-Up Settings property to a Static List or Dynamic List. Static List If you choose this item, you can manually fill the list of parameter values with each value having an individual description (specifying how this value appears in the user interface available in a Print Preview). D ynamic List If you choose this item, you can specify a parameter's data source, data adapter and data member. The value member defines a data field that provides values to the parameter. The display member defines a data field that provides display names for parameter values (how these values appear in the user interface available in a Print Preview).

61 The specified data member should conform to the data type specified for the parameter. 3. To define a filtering criteria for the report, switch to the Properties Panel, and in the Actions or Data category, click the ellipsis button for the report's Filter String property. In the invoked Filter Editor, construct the filtering expression. To access parameters, expand the drop-down menu for a value placeholder and select the Parameter item. This will convert the value placeholder into a parameter placeholder. Click this placeholder to insert the required parameter. Pass Parameter Values To view the resulting report in the Web Report Designer, click the Preview button of the Main Toolbar and specify the values of the required report parameters and data source parameters in the Preview Parameters Panel.
62
63 Query Parameters A query parameter holds an external value that is inserted into an SQL statement before query execution. This value can be either static or dynamically generated by an associated expression. In the Web Report Designer, a query parameter can be used to filter resulting report data at the data source level. To access the parameters of a query and include it in an SQL query, do the following. 1. Invoke the SQL Data Source Wizard. To run the wizard to customize an existing data source, switch to the Field List panel, and do one of the following. To add a new query to an existing SQL data source, select the data source and click the Add query button. To edit an existing query of a SQL data source, select the query and click the Edit query button. 2. On this wizard page, you can construct an SQL query to obtain data from the database or select a stored procedure. Select the Query option and click Run Query Builder... to create an SQL query. 3. In the invoked Query Builder, construct the query. To filter resulting data at the data source level, specify the filtering expression. To do this, click the ellipsis button for the Filter property, and in the invoked Filter Editor, construct a filter expression. To add a query parameter to a filtering expression, expand the drop-down menu for a value placeholder and select the Parameter item.
64 This will convert the value placeholder into a parameter placeholder. Click the placeholder to create a new query parameter or insert an existing one. Click Save to exit the Filter Editor, click OK to exit the Query Builder. 4. The newly constructed SQL query appears in the string form on this page of the wizard. The query parameter is passed to the WHERE part of the SQL string and has the "@QueryParameterName" form. Then, click Next to proceed to the next wizard page. 5. The next page provides access to query parameters and allows you to add, configure and remove it.
65 For every query parameter, the following properties are available. Name - specifies the name used to refer to a parameter. Type - specifies the data type of the parameter's value. Value - determines the actual value of a query parameter. If the parameter type is set to Expression, the actual parameter value is produced dynamically by calculating an associated expression, which is particularly useful when you need to map the query parameter value to the value of a report parameter. Click Finish in the SQL Data Source Wizard to exit the wizard.
 over data fields based on a specific expression.")
66 Calculated Fields This document describes how calculated fields can be used in your report. The main purpose of calculated fields is to perform pre-calculations (of virtually any level of complexity) over data fields based on a specific expression. So, using calculated fields allows you to apply complex expressions to one or more data fields that are obtained from your report's underlying data source. In the Web Report Designer, a calculated field is similar to an ordinary data field (e.g., you can bind controls to it, and group, sort and filter your report against it). To add a calculated field to your report, follow the instructions below. 1. Create a calculated field. To do this, switch to the Field List panel, click a data table and the click Add calculated field button. 2. To specify calculated field properties, click the Edit button (the 'pencil' icon ) for this calculated field. Among its options, make sure to change the Field Type property to an appropriate value. 3. The value of a calculated field is obtained by evaluating its expression, which is specified by its Expression property. To create an expression for the calculated field, click the ellipsis button for the Expression property. Then, construct the required expression in the invoked Expression Editor.

67 To add a data field or report parameter to this expression, double-click the required name in the Fields list. A data field is inserted into the expression's text using its name in [square brackets], and parameters are inserted using the "Parameters." prefix before their names. To add operators between field names, use the toolbar or Operators list. To perform different string, date-time, logical, and math operations over data, use standard functions from the Functions list. 4. Now, you can use the calculated field as a typical data field, e.g., drop it from the Field List to create a Label control bound to this field, or even group, sort and filter your report against it. For example, create the following report. 5. The report with a calculated field is now ready. Switch your report to the Preview mode and view the result.
68
69 Shaping Data The topics in this section illustrate how to shape data in reports in various ways, using the Web Report Designer. Grouping Data Sorting Data Filtering Data Calculating Summaries Formatting Data


70 Grouping Data This topic provides a sample that illustrates how to group report data. Grouping allows you to split data into groups based on identical values in a field or fields. Note that grouping can only be applied to bound reports. To group records in a report, do the following. 1. Create a new report and bind it to a data source. This tutorial starts with the following report. 2. Switch to the Properties Panel and add a Group Header band to the report by clicking the corresponding button in the Actions category. 3. Select the Group Header band and expand the Actions or Behavior category. Then, in the Group Fields section, click the Add button to add a new grouping. 4. Next, choose a data member across which the report is to be grouped. Note that grouping across calculated fields is supported as well.

71 To manage the sorting order of the group's items, use the corresponding arrow button. The and icons indicate the ascending and descending sorting order, respectively. To disable sorting in grouped data, click this button until it is marked with the icon. 5. Drop the data field, which is specified as the grouping criterion, from the Field List panel onto the Group Header band. Now, this data field will be displayed as a header for each group. 6. You can also calculate a total across the group by placing a Label onto the Group Footer band, and specify its Summary properties in the following way.

72 Note also that value formatting is applied to a summary independently of general formatting and has a greater priority. The grouping is now applied. Switch your report to the Preview mode and view the result.


73 Sorting Data This document demonstrates how to sort data within a report's detail area and within groups. Note that as with data grouping, sorting can be performed only if a report is bound to a data source. In this example, we'll use the report created in the following tutorial: Grouping Data. To sort records in a data-aware report, do the following. 1. Select the Detail Band and expand the Actions category. Then, in the Sort Fields section, click the Add button to add a new sorting. 2. Now, choose a data member across which the report is to be sorted. Note that sorting across calculated fields is supported as well. 3. To manage the sorting order, use the arrow button for the Sort By drop-down list. The and icons indicate the ascending and descending sorting order, respectively. To disable sorting, click this button until it is marked with the icon.
74 If multiple sorting criteria are specified, you can define the priority for each one, using the Move Up buttons. and Move Down Sorting is now applied. Switch your report to the Preview mode and view the result.
75 Filtering Data If the data source bound to your report contains far more data rows than are necessary for processing report creation, you can exclude excessive or undesired data. To accomplish this, construct a filtering expression, using single or multiple data fields. This document describes two approaches to filtering data with the Web Report Designer. Filter Data at the Report Level Filter Data at the Data Source Level Filter Data at the Report Level To filter report data, switch to the Properties Panel, and in the Actions or Data category, click the ellipsis button for the report's Filter String property. In the invoked Filter Editor, construct the filtering expression. In every filter condition, the left part contains either the data field name, or the name of the calculated field, which exists in this data source at the same level. The right part of the condition contains either a certain numerical or string value, or the name of the report parameters. To access parameters, expand the drop-down menu for a value placeholder and select the Parameter item.
76 This will convert the value placeholder into a parameter placeholder. Click this placeholder to insert the required parameter. Filter Data at the Data Source Level To filter data at the report data source level, do the following. 1. Invoke the SQL Data Source Wizard. To run the wizard to customize an existing query, switch to the Field List panel, select the required SQL query and click the Edit query button. 2. On this wizard page, click Run Query Builder... to edit the SQL query. 3. In the invoked Query Builder, specify a filtering expression that will be used to filter resulting data at the data source level. To do this, click the ellipsis button for the Filter property, and in the invoked Filter Editor, construct an expression.
77 Note that it is possible to embed query parameters into the expression.
 To calculate summaries (totals) within a report, follow the instructions below. 1.")


78 Calculating Summaries With Report Designer, you can force a data-bound control to calculate one of the standard summary functions (Average, Sum, Count, Max, Min, etc.) To calculate summaries (totals) within a report, follow the instructions below. 1. Create a new report and bind it to a data source. In this tutorial, we'll start with the following report layout. 2. To display a summary at the bottom of the report, add a Report Footer band. 3. Switch to the Field List panel, select the field for which a summary will be calculated and drop it onto the created Report Footer band. 4. Now, switch to the Properties Panel, select the newly created Label and expand the Actions or Data category. In the Summary section, specify the arithmetic function and the report area, for which this arithmetic function is calculated.

79 Set the Func property to Sum. Note that in addition to a simple summary, you can choose among numerous built-in functions (such as Count and Average). Set the Running property to Report, so that the sum is calculated for the entire report. Select the Ignore Null Values checkbox, so that if a dataset contains such records, they will not affect the sum. You can also define a summary function's Format String. Note that value formatting is applied to a summary independent of general formatting and has priority over it too. Switch your report to the Preview mode to view the result.
80
81 Formatting Data This topic describes how to change the value formatting of report elements in the Web Report Designer. For instance, you can format a numeric value as a currency, display a date/time value in one of the standard forms depending on the culture, etc. To apply value formatting for a data-bound control's content, locate this control and switch to the Properties Panel. Then, expand the Actions or Data category, and in the Data Binding section, click the ellipsis button for the Format String property. The invoked FormatString Editor contains numerous built-in formatting presets grouped by categories. Select a required format or create a custom one, and click OK. In a similar way, you can apply formatting to a control's Bookmark, Navigation URL and Tag properties. Note that the set of bindable properties depends on the control type.
82 When a summary function is applied to a control's dynamic content, value formatting is specified separately as described in the Calculating Summaries document. Independently from the general and summary value formatting, you can specify a native XSLX format string, which is to be preserved when the report is being exported to XLSX. You can do this using a control's Xlsx Format String property.
83 Appearance Customization The Web Report Designer allows you to customize the appearance of a report or any of its elements using specific appearance options (as well as fonts, colors, paddings, text alignment, etc.), visual styles and conditional formatting. The documents in this section illustrate how to shape data in reports in various ways. Understanding Style Concepts Use Odd and Even Styles Conditionally Change a Control's Appearance Conditionally Change a Label's Text Conditionally Hide Bands

.")
84 Understanding Style Concepts This document describes how you can provide a professional look to your reports, by effectively adjusting the appearance of its elements. This document consists of the following sections. The Appearance Properties Styles Priority and Inheritance The Appearance Properties In the Web Report Designer, a report and each of its elements (bands and controls) has a complete set of appearance options (such as Background Color, Borders, Font, Foreground Color, Text Alignment, etc.). By default, these properties aren't specified, meaning that their real values are obtained from a control's (or band's) parent, which is the report itself. So, the appearance specified for a report is distributed to all its child elements. Similarly, the appearance of a band is translated to the controls it contains. In turn, a control's appearance can be adjusted independently from its parent. When it is required to reset a value assigned to a control's appearance property in the Properties Panel, click the Advanced Options button for this property and then click Reset. The control will be restored to the appearance of its parent.


85 Styles Priority and Inheritance In addition to the capability to specify appearance property values for every control and band, you can create comprehensive styles, and they can be assigned to individual elements. To assign a particular style to a control, select this control and in the Properties Panel, expand the Styles category. Then, invoke the drop-down list for the Style property and click Create New Style or select an existing style. N o t e A style that is assigned to a band applies to controls that the band contains. To access the style collection, you can also use the Report Explorer, which allows you to add, edit or delete a style.


86 To apply a style or formatting rule to a report control, drag it from the Report Explorer onto the required report control. When both styles and individual appearance settings are assigned to an element, the priority is required to decide which of the properties to use. By default, a style's appearance property has a higher priority than an element's appearance property. The Advanced Options button for this appearance property is highlighted in blue.


87 To assign a higher priority to an element's appearance property, click the Advanced Options button and then click Style Priority. It highlights the Advanced Options button in white. To revert a higher priority to a style's appearance property, click the Advanced Options button and then, click Style Priority. The same principles are applied to the odd-even styles feature, which allows you to alternate the appearance of consecutive data rows in your report. For details on this, refer to Use Odd and Even Styles. N o t e When conditional formatting is applied to an element, its appearance definition has the highest priority.

88 Use Odd and Even Styles This document describes how to apply odd and even styles to report controls, e.g., to alternate the background color for each record. To utilize odd and even styles, do the following. 1. Create a table report. 2. Select the detail table and in the Properties Panel, expand the Styles category. Then, invoke the drop-down list for the Even Style property and click Create New Style. This will create a style and assign it to the control's Even Style. 3. Now, expand the Even Style section and adjust the required options of the newly created style (e.g. specify the Font and Background Color properties).

 and in the invoked popup menu select Reset.")
89 If required, perform the same steps, to create and assign an odd style, as well. To reset all style properties of a report control to their default values, select the control, click the Advanced Options button for the required style (marked with the 'square' icon) and in the invoked popup menu select Reset. Switch your report to the Preview mode, and view the result.
90

91 Conditionally Change a Control's Appearance This document describes the steps needed to conditionally change a control's appearance (e.g., make a Label's text red if its value exceeds a certain threshold). Thanks to the formatting rules feature, no scripts are required to achieve this, so you shouldn't write any code. To conditionally change a control's appearance, do the following. 1. Create a new report and bind it to a data source. 2. Switch to the Properties Panel, expand the Appearance category and then expand the Formatting Rules section. Add a new formatting rule by clicking the button. 3. Expand the newly added rule, specify its name and formatting options (e.g., Foreground Color). You can also specify the Data Source and Data Member properties. These properties define the list containing data fields that can participate in constructing the Boolean condition.
.")
92 4. Then, click the ellipsis button for the Condition property. In the invoked Expression Editor, define the required Boolean condition (which means that its result is returned as either true or false). In this tutorial, we will format fields if the UnitPrice value is greater than 30.

93 To save the condition and close the dialog, click Save. 5. A formatting rule can be applied to any number of report elements within the same report. To apply a rule to a control, select the required report control and enable the checkbox for the required rule. If multiple rules are applied, it is possible to customize their precedence by using the and buttons. So the rules are applied in the same order that they appear in the list, and the last rule in the list has the highest priority. Switch your report to the Preview mode and view the result.
94

95 Conditionally Change a Label's Text In this tutorial, you will learn how to change a label's text if a certain condition is met, without using scripts. To conditionally change a label's text, do the following. 1. Create a new report and bind it to a data source. 2. Now, add a new calculated field. To do this, switch to the Field List panel, click a data table and click Add calculated field button. 3. Click the Edit button (the 'pencil' icon ) for the calculated field and set the Field Type property to String. Then, click the ellipsis button for its Expression property and in the invoked Expression Editor, define the required logical condition for the calculated field (e.g., Iif([UnitsOnOrder] == 0, 'None', [UnitsOnOrder]), which means that if the UnitsOnOrder data field's value is equal to 0, the control's text will be replaced with None). 4. Finally, drop the required data fields (and the created calculated field as well) from the Field List onto the report's Detail band.

96 The report is now ready. Switch your report to the Preview mode and view the result.


97 Conditionally Hide Bands This document provides the sample, illustrating how to hide bands if a certain logical condition is met. Note that no scripts are required to accomplish this task. To demonstrate this feature, use a report with grouping, similar to the one created in the following tutorial: Grouping Data. To conditionally hide bands in a report, do the following. 1. Select the Group Header band and in the Properties Panel, expand the Appearance category. Then, expand the Formatting Rules section and add a new formatting rule. 2. Expand the newly created rule and set the Visible property to False. Click the ellipsis button for the rule's Condition property to specify the logical condition, which will define band visibility. 3. In the invoked Expression Editor, construct the required logical expression (e.g., [CategoryID] < 2) and click Save.

98 4. Apply the formatting rule to the Group Header band by enabling the checkbox for this rule. Then, apply the same formatting rule to the report's Detail band. Switch your report to the Preview mode and view the result.
99
100 Report Navigation and Interactivity The topics in this section explain how to establish navigation through a report in different ways and enable editing reports in Print Preview. This section consists of the following topics. Create a Document Map with Bookmarks Create a Table of Contents Create Hyperlinks Add a Cross-Reference Enable Content Editing in Print Preview

101 Create a Document Map with Bookmarks This document describes the steps to create a report with bookmarks (a so-called Document Map). This feature allows you to easily navigate through the report during Print Preview. To demonstrate the Document Map feature, use a report with grouping, similar the one created in the following tutorial: Grouping Data. To create a report with bookmarks, do the following. 1. Select the Label in the Report Header band, and in the Properties Panel, expand the Navigation category and set the Bookmark property to the same value as the Label's text (i.e., Products by Categories). 2. Now, select the Label, which is placed in the report's Group Header band. As this control is bound to data, we will bind its Bookmark property to the same data field. To do this, in the Data category, expand the Data Bindings section and specify the Bookmark property.
102 Note that as with other bindable properties, you also can apply value formatting to the Bookmark property. To do this, set the Format String property to Category {0}. 3. To define the document map's hierarchy, expand the Navigation category and set the Parent Bookmark property to the Report Header's label.
103 The report with bookmarks is now ready. Switch your report to the Preview mode and view the result.
104 Create a Table of Contents This topic describes how to provide a report with a table of contents that displays page numbers for bookmarked report elements at different nesting levels, and thus makes it possible to quickly navigate to a specific document page by clicking the corresponding entry. To demonstrate this feature, use a report with specified bookmarks similar to the one created in the following tutorial: Create a Document Map with Bookmarks. To create a table of contents in a report, do the following. 1. Drop the Table of Contents control from the Toolbox onto the Report Header Band. If the report does not contain this band, it will be created automatically. 2. Double-click the title of the table of contents and specify its text. 3. To customize title appearance, switch to the Properties Panel, expand the Behavior category and use the Level Title option's settings.


105 4. To customize the appearance of all other levels, use the Level Default option's settings in the Behavior category. 5. To customize a specific level individually, add a corresponding item to the Levels collection of the table of contents. After adding a new level, you can access and customize its properties.

106 The table of contents is now ready. Switch your report to the Preview mode and view the result.

107 Create Hyperlinks This tutorial demonstrates how to embed a hyperlink into your report. Note that a label will behave as a hyperlink both in a report's Print preview and when the report is exported to PDF, HTML, MHT, RTF, XLS and XLSX. To insert a hyperlink into your report, do the following. 1. Create a new report. 2. Drop a Label onto a report band, and in the Properties Panel, change its Text to the one required for the link. In addition, to make the Label look like a typical link, you can change its appearance appropriately (e.g., make it blue and underlined). 3. Now, in the Navigation section, set its Navigation Target to the required value (_blank, _parent, _search, _self, or _top) and define the required Navigation URL. Your report with the hyperlink is now ready. Switch the report to the Preview mode and view the result.

108 Add a Cross-Reference This document describes how to add a cross-reference to your report. A cross-reference is simply a link whose target is located within the current document, which allows you to establish easy navigation through a report. In this example, we place a link at the bottom of each group, leading to the beginning of the report. To demonstrate this feature, use a report with grouping similar to the one created in the following tutorial: Grouping Data. To create a report with cross-references, do the following. 1. Select the Report Controls in the Report Header band, and in the Properties Panel, expand the Design category and set the Name property to reporttop. 2. To accompany the existing Group Header with the corresponding Footer, add a Group Footer band. 3. Then, drop a label onto the Group Footer band. As it will be the link, change its Text to Top of Report, and apply the desired formatting to it (e.g., the blue color and underlined text). Expand the Navigation section and set the Navigation Target property to _self and the Navigation URL property to reporttop. The report with cross-references is now ready. Switch your report to the Preview mode and view the result.
109
110 Enable Content Editing in Print Preview This document describes how to enable editing the content of specific controls in Print Preview. This topic consists of the following sections. Text Editing Check Box Editing Text Editing The Label, Table Cell and Character Comb report controls can be assigned editors to customize their content in Print Preview. To enable content editing for a specific control, do the following. 1. Select a control that you want to become editable in Print Preview and switch to the Properties Panel. In the Behavior category, expand the Edit Options property and set the Enabled property to Yes. 2. To provide a mask for editing integer values, set the Editor Name property to Integer Positive to assign the required editor with a corresponding mask.

111 Switch the report to the Preview mode. To highlight all editing fields available in the document, click the Editing Fields button in the Print Preview toolbar. Clicking a field will invoke the appropriate editor. Check Box Editing In addition to editing text, you can enable switching Check Box states in Print Preview. When two or more check boxes have identical Group ID values, the corresponding editors belong to a single logical group (i.e., only one option can be selected within a group at a time).

112 N o t e The changes made to a control's content in Print Preview have no effect on other parts of the document (e.g., the related summary results, grouping, sorting, bookmarks and other settings that have already been processed before generating the document).
113 Add Details about a Report This document lists topics that describe how to add technical information about a report to a generated document. This information includes the report's creation date, the author's name, as well as text and/or image watermarks. This section consists of the following examples. Add Page Numbers and System Information to a Report Create or Modify Watermarks of a Report
114 Add Page Numbers and System Information to a Report This document describes how to insert page numbers or other system information (e.g., current date and time, user name, etc.) into a report, using the Web Report Designer. Generally, this auxiliary information is displayed within the Page Header and Footer or Page Margin bands. To add page numbers or system information to your report, drop the Page Info control from the Toolbox onto a band. Then, follow the instructions below for your specific task. Add Page Numbers Add System Date and Time Add the User Name Add Page Numbers 1. Select the Page Info control, switch to the Properties Panel, expand the Actions or Behavior category and specify the Page Information property.
; RomHiNumber (the current page number is written in uppercase Roman letters); Total (displays the total number of pages).")
115 You can choose one of the following formats for displaying page numbers: Number (displays the current page number only); NumberOfTotal (displays the current page number with total pages); RomLowNumber (the current page number is written in lowercase Roman letters); RomHiNumber (the current page number is written in uppercase Roman letters); Total (displays the total number of pages). 2. To format the control's text, specify the Format property (e.g., Page {0} of {1}). You can also specify the starting page number. Your report with page numbers is now ready. Switch it to the Preview mode to view the result. Add System Date and Time Select the Page Info control, and in the Properties Panel, expand the Actions or Behavior category. Then, expand the drop-down list for the Page Information property and select DateTime.
.")
116 To format the control's text, click the ellipsis button for the Format property, and in the invoked Format String Editor, specify a date and time format string (e.g., dddd, MMMM dd, yyyy). Switch your report to the Preview mode to view the result.

.")
117 Add the User Name Select the Page Info control, and in the Properties Panel, expand the Actions or Behavior category. Expand the drop-down list for the Page Information property and select UserName. To format the control's text, specify the Format property (e.g., Current User: {0}). Switch your report to the Preview mode to view the result.
118
, do the following. 1.")

119 Create or Modify Watermarks of a Report This topic describes how to add a text watermark in a report or turn a picture into a report's background. Note that watermarks are visible only in the Preview mode. To create a new watermark in a report (or to modify the existing one), do the following. 1. In the Properties Panel, expand the Report Controls drop-down list and select the report. 2. In the Appearance category, expand the Watermark section. To adjust text watermark settings, specify the watermark's text as well as direction, transparency, and the color of this text. 3. For a picture watermark, you need to specify an image. To do this, click the ellipsis button for the Image property. In the invoked dialog, select the file containing the image that you wish to use as a watermark and click Open. Next, define the picture's properties, such as Transparency, Tiling, Alignment and View Mode. For both types of watermarks, you can also adjust a watermark position behind the document content by enabling the

120 Show Behind flag, and specify the page range in which the watermark will be printed. Additionally, it is possible to use both textual and image watermarks simultaneously. The report with watermark is now ready. Switch your report to the Preview mode and view the result.

121 Scripting This document describes the basic principles of scripting, which can be performed by handling the events of a report, and its bands and controls. This documents consists of the following sections. Scripting Overview Maintaining Scripts Example: Custom Summary Scripting Overview Scripts are program commands, placed within the event handlers of the required report elements. And when the corresponding event occurs (e.g., a mouse click), the script code runs. Scripting is made available to extend the standard functionality as far as may be required. You can write scripts for a report or any of its elements (bands and controls) to be executed when the report is being previewed, printed or exported. The Web Report Designer allows you to write scripts using the Script Editor. This editor supports C#, Visual Basic.NET and JScript.NET scripting languages. This means that the scripting language is independent from the language used to create the report. The language is specified by the Script Language property of a report. The selected scripting language must be the same for all scripts used in a report. Note that JScript.NET is not installed with the.net framework installation, by default, so you should make sure it is present before writing code in it. Maintaining Scripts Every report element has a set of script events, which are individual for each element type. To handle an event of a report element, do the following. 1. Select the required report element. In the Properties Panel, expand the Behavior category and then expand the Scripts section which lists available events.
 located on the End-User Report Designer's Main Toolbar. In the displayed Script Editor, specify the report control and its event by the toolbar.")
. If an error is found, the string containing this error is marked with an the text of the error is displayed. icon.")
122 2. Click the ellipsis button for an event (e.g., the Before Print, which is the most used). This will switch to the Script Editor, which allows you to manage and edit all the report scripts. Alternatively, you can click the Scripts button ( ) located on the End-User Report Designer's Main Toolbar. In the displayed Script Editor, specify the report control and its event by the toolbar. After the event is specified, a code template is generated in the language specified with the Script Language property of the report. 3. To check for errors in the report's script, click the Validate button ( ). If an error is found, the string containing this error is marked with an the text of the error is displayed. icon. When a mouse pointer hovers over this icon, Example: Custom Summary In this example, we will display the total number of product unit packs in a group. To perform this, execute steps similar to the ones described in the Calculating Summaries topic, except that for the summary field, you should set the Function property to Custom.


123 Then, the additional events are added to the label's Scripts property. You can handle these events in the following way. C#
124 // Declare a summary and a pack. double totalunits = 0; double pack = 15; private void label1_summaryreset(object sender, System.EventArgs e) { // Reset the result each time a group is printed. totalunits = 0; } private void label1_summaryrowchanged(object sender, System.EventArgs e) { // Calculate a summary. totalunits += Convert.ToDouble(GetCurrentColumnValue("UnitsOnOrder")); } private void label1_summarygetresult(object sender, DevExpress.XtraReports.UI.SummaryGetResultEventArgs e) { // Round the result, so that a pack will be taken into account // even if it contains only one unit. e.result = Math.Ceiling(totalUnits / pack); e.handled = true; } VB.NET Switch to Print Preview and view the result.
125 Report Elements A report is built from controls (text labels, images, zip codes, charts, etc.) spread across report sections called bands (various headers, footers and content sections). The main interface elements helping you manage these building blocks are Toolbox, Field List and Properties Panel. These elements allow you add controls to your report, bind them to data and change their appearance and behavior settings, respectively. To learn more about these report elements used in the Web Report Designer, see the following topics. Report Controls Report Bands
126 Report Controls In general, report controls allow you to present information of different kinds (e.g., simple or formatted text, pictures, tables, etc.) in your static and dynamic reports, and to adjust your report's layout (by organizing controls within panels, and inserting page breaks at the required positions). The following table lists the available controls (in the same order as in the Toolbox). ICON D ES CR IPTION The most basic Label control is intended to display text in your report. It can represent static or dynamic text or both. In addition, it can be used to calculate standard summary functions across a data field. The Label's text can only be formatted as a whole. So if you need to differently format different parts of text, use the Rich Text control. The Check Box control is intended to display True/False or Checked/Unchecked/Indeterminate states in a report by displaying (or not) a check mark, which can be accompanied by a text description. The Rich Text control allows you to display formatted text in your report. It can represent static or dynamic text or both. You can load content to the Rich Text from an external TXT or RTF file (which can also contain images) and then format any part of it. The Picture Box control is intended to display images of numerous formats in a report. An image can be loaded from an external file, from a bound data source, or from a web location using the specified URL. The Panel control is a container that frames separate report controls to allow them to be easily moved, copied and pasted, and visually unite them in the report's preview (with borders or a uniform color background). The Table control is designed to arrange information in a tabular layout. It may contain any number of rows comprised of individual cells. Both rows and cells can be selected and customized individually. In most aspects, a cell is similar to a Label, but can also contain other controls (e.g., Picture Box or Rich Text). The Character Comb control displays text so that each character is printed in an individual cell. The Line control draws a line of a specified direction, style, width and color. It can be used for both decoration and visual separation of report sections. The Line cannot cross report bands, as opposed to the Cross-band Line control. The Shape control allows you to embed simple graphic objects into your report. You can choose one of the multiple predefined shapes (e.g., rectangles, ellipses, arrows, polygons, crosses and brackets of various kinds). The Bar Code control transforms its content into a bar code of the specified type. Multiple standard bar code symbologies are supported. The Zip Code control renders a numeric postal code that is used to identify the mail address in some countries. This control is not related to the Zone Improvement Plan (ZIP) code used by the United States Postal Service. The Chart is a sophisticated control used to embed graphs into your report. It graphically represents a series of points using numerous 2D or 3D chart types. A Chart can be populated with points both manually (by specifying arguments and values for each point) and dynamically (by connecting it to the report's data source or binding it to a separate one). The Gauge control provides you with the capability to embed graphical gauges into your report. The Sparkline control displays a compact chart that is commonly used to reflect the flow of data for every row in a report.
127 ICON D ES CR IPTION The Pivot Grid control represents dynamic data (obtained from an underlying data source) in a cross-tabulated form to create cross-tab reports, similar to Pivot Tables in Microsoft Excel. Column headers display unique values from one data field, and row headers - from another field. Each cell displays a summary for the corresponding row and column values. By specifying different data fields, you can see different totals. This allows you to get a compact layout for a complex data analysis. The Subreport control allows you to include other reports in your current report. To learn more, see Master-Detail Report (Subreports). The Table of Contents control generates a table of contents based on bookmarks specified for report elements. The Page Info control is intended to add page numbers and system information (the current date and time or the current user name) into your report. As with many other controls, you can format this control's content. The Page Break control's sole purpose is to insert a page delimiter at any point within a report. The Cross-band Line control allows you to draw a line through several report bands. This can be useful if you need to visually emphasize a section consisting of multiple band areas. In other aspects, it is similar to a regular Line. The Cross-band Box control allows you to draw a rectangle through several report bands. This can be useful if you need to visually encompass a section consisting of multiple band areas. To learn how to create report controls and change their layout, refer to Create Report Elements and Adjust the Layout of Report Elements.

128 Report Bands A Report Band represents a specific area on a report page, where report controls are contained. A band is used to define how to render report controls that belong to it. In the Web Report Designer, every report consists of a number of bands, each of a different type. This document consists of the following sections. Adding Bands Available Bands Positions of Band Types Adding Bands To add a new band to a report, select the report or any of its bands in the Properties panel and click an appropriate item in the Actions category. Available Bands The following table lists the band types. ICON D ES CR IPTION The Top Margin band represents the top page margin. It is intended for displaying page numbers, or some sort of supplementary information (e.g. current system time or the user name). The Report Header is located at the beginning of a report. This band is intended to display some introductory information, e.g., a cover page for a report (the report's name, company logo, date of creation and user name, etc.) And, if you plan to add a Chart that visualizes the report's data, place this control onto this band. The Page Header band is located at the top of every page, below the Top Margin or Report Header band. This band is intended to display page numbers or a table header, continued from the previous page. The Group Header band is located at the beginning of every group or at the top of the page if it is split across pages. This band specifies grouping criteria and is used to display information at the beginning of a group of records. To learn more, refer to Grouping Data. The Detail band is located on a page between all other bands. This band cannot be deleted - the present report structure includes the Detail band in its core. In a data-bound report, the contents of the Detail band are repeated for every data entry. And, if static data is also present in the Detail band, it is repeated with each new entry in the resulting report. For more information about data binding, refer to Providing Data.
.")
129 ICON D ES CR IPTION The Detail Report Band is located below the Detail band and is intended to hold the detail report when creating a master-detail report. There can be an unlimited number of Detail Report bands nested inside one another. To learn more about detail reports, refer to Master-Detail Report (Detail Report Bands). The Group Footer band is located at the end of every group or at the bottom of the page if this group is split across pages. This band is primarily intended to show summary information for a group. The Report Footer finalizes the informative part of the report. It is placed before the Page Footer and Bottom Margin on the report's last page. This band is intended to display some final information, e.g., report totals. The Page Footer band is located at the bottom of every page, below the Report Footer and above the Bottom Margin band. This band is intended to display page numbers or a table footer, which is continued on the following page. The Bottom Margin band represents the bottom page margin. It is intended for displaying page numbers, or some sort of supplementary information (e.g., current system time or the user name). The Sub-Band provides a functional copy of the source band below which it is located. A sub-band's behavior, as well as its position within the report band hierarchy, is dictated by the source band type. Any number of sub-bands can be added to the report band of any type, except for the Top Margin and Bottom Margin bands and the sub-band itself. Positions of Band Types The following image illustrates the relative positions of different band types, and how many times they are rendered in a report. The Page Header, Page Footer, Top Margin and Bottom Margin bands are rendered in the report preview on every page.
130 The Report Header and Report Footer bands are rendered in the report preview only once. The Group Header and Group Footer bands are rendered for every group of records in a report. The number of times the Detail band is rendered in a report depends upon the number of records returned from the bound data source - one band per record. To learn how to create a report band and change its layout, refer to Create Report Elements and Adjust the Layout of Report Elements.
131 Interface Elements The following main elements make up the user interface of the Web Report Designer. Design Surface Field List Main Toolbar Menu Properties Panel Query Builder Report Explorer Toolbox The following editors are available in the Web Report Designer. Custom SQL Editor Expression Editor Filter Editor Format String Editor Master-Detail Relation Editor Script Editor


132 Design Surface The Design Surface displays a report that is being edited in the Web Report Designer. The Design Surface includes the following principal elements. Rulers Band Captions In-Place Editor Rulers The horizontal and vertical rulers display tickmarks in the measure units specified for your report. Click an element to evaluate its size and location using the rulers. The horizontal ruler also allows you to modify report side margins by moving the left and right sliders on the ruler. The vertical ruler shows resizing rectangles for every report band, which you can move to change the band height. Band Captions In the Report Designer, each report band carries a caption, the tab title and color, which depends on the band kind. These captions are not printed in the resultant report document and are only visible at design time.
133 You can expand or collapse band content at design time by clicking the tab at the left side of the band. To access the properties of a band, select the band by clicking its caption, and then switch to the Properties Panel. To learn more, see the Report Bands topic. In-Place Editor Allows you to edit the content of a text-oriented Report Controls (Bar Code, Check Box, Label, Rich Text, or Zip Code) by doubleclicking it. N o t e The current Web Report Designer version does not support the in-place editing of rich text in the Rich Text control. Only plain text editor is available for this report control. To toggle between the Design and Preview mode of a report, use the corresponding buttons of the Main Toolbar.
134 Field List This document describes the Field List panel that enables you to explore and manage report data sources and parameters. This document consists of the following sections. Manage Report Data Sources Manage Report Parameters Manage Report Data Sources The Field List lists available report data sources and displays their structure. Dragging a field from the Field List onto the Design Surface creates a new Label bound to that data field. The following actions are available in the Field List for data source customization. B U T TON D ES CR IPTION Removes the selected data source. Invokes the Master-Detail Relation Editor. Invokes the Create a Query or Select a Stored Procedure wizard page. Adds a new calculated field to the data source. The following actions are available for query customization.

135 B U T TON D ES CR IPTION Removes the selected query. Invokes the Create a Query or Select a Stored Procedure wizard page. Adds a new calculated field to the query. Manage Report Parameters To access the collection of report parameters, expand the corresponding category in the Field List. The following actions are available for parameter customization. B U T TON D ES CR IPTION Creates a new report parameter. Removes the selected parameter. Enables customization of the selected parameter. For more information on report parameters, see Report Parameters.
136 Main Toolbar The Main Toolbar provides quick access to the report editing commands in the Web Report Designer. The Main Toolbar commands are divided into the following sections. Clipboard Commands Edit Commands View Commands Mode Commands Scripting Commands Clipboard Commands Use these commands to place the selected elements to the clipboard and paste them onto the required report bands. COMMAND ICON D ES CR IPTION Cut Cuts the selected control to the clipboard. Copy Copies the selected control to the clipboard. Paste Pastes a control from the clipboard to the selected report band. Edit Commands Use the following commands to delete report elements and cancel previous actions. COMMAND ICON D ES CR IPTION Undo Redo Delete Cancels the last change made to the document. Reverses the results of the last undo action. Deletes the selected control. View Commands Use the following commands to adjust the report zoom factor. COMMAND ICON D ES CR IPTION Zoom In Zoom Out Increases a document's current zoom factor by 1 percent. Decreases a document's current zoom factor by 1 percent.
137 COMMAND ICON D ES CR IPTION Zoom Factor Zooms to a specific zoom factor selected from the dropdown list. Mode Commands Use the following command to toggle between the Design and Preview mode of a report. COMMAND ICON D ES CR IPTION Preview Displays the current report. Scripting Commands Use the following command to invoke the Script Editor. COMMAND ICON D ES CR IPTION Preview Invokes the Script Editor.
138 Menu The Web Report Designer menu is invoked by clicking the menu button in the upper-left corner of the designer's user interface. The menu contains the following commands. COMMAND ICON D ES CR IPTION New Creates a report and opens it in a new tab. New via Wizard Open Design in Report Wizard Add SQL Data Source Invokes the Report Wizard to create a new report and generate the report layout. Invokes the Open Report dialog to retrieve a report from the server-sider report storage and open it in a new tab. Invokes the Report Wizard to edit the current report and generate the report layout. Invokes the SQL Data Source Wizard to create a new data source and configure it. Save Saves the current report to the report storage. Save As Exit Invokes the Save Report dialog to save the current report to the report storage under a new URL. Closes the Web Report Designer.

139 Properties Panel The Properties panel allows you to access and edit the settings of a report and its elements. This topic consists of the following section. Select a Report Element Set Property Values Reset Property Values Use Actions Select a Report Element To select a report element and show its settings in the Properties panel, do one of the following. Select a required element in the drop-down list at the top of the Properties panel. Click a required element in the Design Surface and invoke the Properties panel by clicking the Select a required element in the Report Explorer and click the button. button. Set Property Values

140 In this panel, the properties of a currently selected report element are arranged in categories. To set a property value, expand the corresponding category by clicking its header and specify the necessary value using the property editor. Specific properties can contain nested properties, which can be accessed by clicking the corresponding property header. Reset Property Values To restore the default value of a property, click the Reset. button to the right of the editor, and in the invoked popup menu, select Use Actions The context-sensitive Actions category at the top of the Properties panel displays the most commonly used actions corresponding to the selected report element or a report. If a report is selected, this category allows you to add new bands of particular types.

141 If you select a table element, this category provides actions to manage cells, rows and columns. For elements of other types and for multiple selected report elements, you can use actions to align and position these elements (e.g., align and resize elements to the snap grid, specify the horizontal and vertical alignments, etc.)
142 Query Builder The Query Builder can be invoked from the SQL Data Source Wizard. It provides a visual editor to create custom queries and enables you to solve a variety of tasks. Select Tables Join Tables Filter Data Shape Data Preview Results Select Tables To include a specific table into a query result set, drag and drop it onto the Query Builder design surface. The Query Builder provides a toolbar with the following commands. ICON D ES CR IPTION Removes the selected table or view from the query. Reverses the most recent action. Performs the action that has previously been undone. For each table or view that has been added, you can select which specific columns to include into the query result set by using the corresponding check boxes.

143 Join Tables To join separate tables and/or views, connect their corresponding columns (key fields) using drag and drop. The connected columns must have identical data types. Clicking the data relation will display the corresponding properties that define the join type (Inner or Left Outer) and applied logical operator.

144 A left outer join returns all the values from an inner join along with all values in the "left" table that do not match to the "right" table, including rows with NULL (empty) values in the key field. When the left outer join is selected, the relationship line displays an arrow pointing at the "right" table of the join clause. After executing the query, it will return a "flat" table composed of data records selected based on the specified join options. N o t e Although joining different tables within a single query may be required in some scenarios, creating hierarchical data sources generally results in better performance (in general, master-detail reports are generated faster than similar-looking reports created by grouping "flat" data sources).


145 Filter Data Clicking the Query Builder surface will display the query options. The following options are available. Name Specifies a custom query name (alias). Filter Runs the Filter Editor where you can specify filter criteria against which the query result set should be narrowed down. Select All (*) Specifies whether or not the query result set should include all columns from the selected tables and/or views, regardless of their individual settings. This option is set to No by default. Shape Data Clicking a data column of a selected table or view will display the data column options. The following options are available. Name Indicates the column name by which it is referred to in the database.
146 Type Indicates the type of data contained in the column. String columns are provided with information about the maximum string length. Alias Specifies a custom column name (alias). This option is available only for columns that are included into a query. Output Specifies whether or not the column is included into the query result set. Sort Type Specifies whether to preserve the original order of data records within the column, or sort them (in an ascending or descending order). Sort Order This option becomes available after applying sorting to the data column's records. It defines the priority in which sorting is applied to multiple columns (the less this number is, the higher the priority). For example, if column A has the sort order set to 1 and column B has it set to 2, the query will be first sorted by column A and then by the column B. Changing this setting for one column automatically updates the sort order of other columns to avoid conflict of priorities. Group By Specifies whether or not the query result set should be grouped by this column. N o t e Grouping and/or aggregation can only be applied to each of the selected columns. Aggregate Specifies whether or not the column's data records should be aggregated. The following aggregate functions are supported: Count, Max, Min, Avg, Sum. Applying any of these functions to a column will discard individual data records from the query result set, which will only include the aggregate function result. N o t e Grouping and/or aggregation can only be applied to each of the selected columns. Preview Results You can test a query at any time on a limited subset of the actual data by clicking the Preview Results button. This will open the Data Preview screen displaying the query result set limited by the first 100 data records.
147


148 Report Explorer This document describes the Report Explorer panel that shows a report's structure providing quick access to report elements, styles and formatting rules. This document consists of the following sections. Manage Report Elements Manage Report Styles and Formatting Rules Manage Report Elements The Report Explorer displays all report controls and bands in a tree-like form and allows you to easily manage them. The following actions are available for report element customization. B U T TON D ES CR IPTION Removes the selected report element. This button is not available for the Detail, TopMargin and BottomMargin bands. Switches to the Properties Panel where you can adjust the settings of the selected report element or a report itself. Manage Report Styles and Formatting Rules To access the collection of report styles or formatting rules, expand the corresponding category in the Report Explorer. To apply a style or formatting rule to a report control, drag it from the Report Explorer onto the required report control.
149 The following actions are available in the Report Explorer for customization styles and formatting rules. B U T TON D ES CR IPTION Creates a new style or formatting rule. Removes the selected style or formatting rule. Switches to the Properties Panel where you can adjust the settings of the selected style or formatting rule.
150 Toolbox The Toolbox contains elements (report controls) that can be added to a report being edited in the Web Report Designer. Different controls correspond to various kinds of data that can be displayed in a report. To add a new control to the report, drag the corresponding item from the Toolbox and drop it onto the required report band. The available report controls can be divided into the following categories. General Content Extended Data Report Layout Document Statistics General Content The following controls are most commonly used to display data in a report. ICON CONTR OL NAME Barcode Check Box Gauge Label Character Comb Picture Box Rich Text Table Zip Code Extended Data The following controls are connected to data individually, without accessing a report's data source. ICON CONTR OL NAME Chart Pivot Grid Sparkline
151 Report Layout The following controls allow you to draw shapes in a report and customize the report layout. ICON CONTR OL NAME Cross-Band Line Cross-Band Box Line Page Break Panel Shape Subreport Document Statistics The dynamic content of the following controls is not obtained from a data source. ICON CONTR OL NAME Page Info Table of Contents
152 Custom SQL Editor If custom SQL editing is enabled by your software provider, the Custom SQL Editor can be invoked on the Create a Query or Select a Stored Procedure wizard page. The default query validation mechanism only allows custom queries containing SELECT statements.
153 Expression Editor The Expression Editor provides the capability for constructing expressions in the Web Report Designer. This topic consists of the following section. Expression Editor Overview Expression Syntax Using the Expression Editor Expression Editor Overview The Expression Editor's visual interface allows you to type an expression manually or select predefined functions, operators and operands. The editor supports a variety of aggregate, date-time, logical, math and string functions. You can also use logical and arithmetic operators and fields of a data source to which a report is bound. After you finish constructing an expression, click Save. If an expression contains any errors, the expression should be rewritten. Expression Syntax The following syntax conventions should be taken into account when using the Expression editor. icon appears meaning that the A data field is referenced in the expression by enclosing its name in square brackets (e.g., [ProductName]). Report parameters are inserted using the "Parameters." prefix before their names (e.g., [Parameters.parameter1]). String values are denoted with apostrophes. To embed an apostrophe into an expression's text, type a double apostrophe (e.g., 'It''s sample text').
![Date-time constants should be enclosed with hashtags (e.g., [OrderDate] >= #1/1/2016#).](/docs-images/88/115623312/images/154-0.jpg "To specify a null reference (one that does not refer to any object), use a question mark (e.g., [Region]!=?). If an expression involves the use of different types, you can convert them to the same type using dedicated functions (e.")
154 Date-time constants should be enclosed with hashtags (e.g., [OrderDate] >= #1/1/2016#). To specify a null reference (one that does not refer to any object), use a question mark (e.g., [Region]!=?). If an expression involves the use of different types, you can convert them to the same type using dedicated functions (e.g., Max(ToDecimal([Quantity]),[UnitPrice])). Using the Expression Editor Expressions can be used for calculating query parameters and calculated fields values as well as for specifying conditions of formatting rules. To edit an expression for a calculated field, access its settings in the Field List and click the ellipsis button for the Expression property. To specify an expression for a query parameter, in the Configure Query Parameters wizard page, set the parameter type to Expression and click the ellipsis button for the Value property. To construct a condition for a formatting rule, access its settings in the Properties panel and click the ellipsis button for the

155 Condition property. If the specified expression does not return a Boolean value, the error icon appears on an attempt to save the condition.
156 Filter Editor The Filter Editor provides a visual interface for constructing filter criteria of any complexity with an unlimited number of filter conditions combined by logical operators. To invoke this editor to filter report data, expand the Actions or Data category in the Properties Panel panel and click the ellipsis button for the report's Filter String property. The Filter Editor displays filter criteria as a tree where individual nodes specify simple filter conditions. Specific conditions can be arranged into groups with And, Or, Not And, and Not Or operators. The root node is the logical operator combining all conditions. The image below shows the filter expression that contains two groups combined by the Or logical operator. Any filter condition consists of three parts. The name of a field of a data source to which a report is bound. Criteria operator, such as Equals, Is less than, Is between, etc. Operand value. You can also compare a data field with another data field or a report parameter. To do this, expand the drop-down menu for a value placeholder and select Value or Parameter.
157 This will convert the value placeholder into a field placeholder or parameter placeholder, respectively. Then, click the placeholder and select the required item.
158 Format String Editor The Format String Editor provides the capability to apply the required formatting for report elements to display their incoming data. It allows you to easily select one of the built-in formats or create your own. For instance, you can format a numeric value as currency, display a date/time value in one of the standard forms depending on the culture, etc. This topic consists of the following section. Use Standard Formats Use General Formats Create Custom Formats Run the Format String Editor Use Standard Formats The Format String Editor contains numerous built-in formatting presets grouped by categories. All categories are displayed in the Category list on the left side. The Types list on the right side contains formats available within the selected category. The editor also allows you to see the preview of the selected format in the Preview section. Use General Formats In the General category, you can enter the Prefix and Suffix specifying custom text that will be added before and after the output value, respectively.
159 Create Custom Formats To create a custom format, enter the format string in the dedicated editor and click Add. The format will be added to the end of the Types list and automatically selected.
160 You can then remove a custom format by clicking the corresponding Run the Format String Editor button. You can invoke the Format String Editor to format values of a control's bindable properties (not the control's static content) and summary values. Basic Formatting It is common to format a label's Text property. To do this, expand the Actions or Data category, and in the Data Binding section, click the ellipsis button for the Format String property. In a similar way, you can also apply formatting to the Navigation URL (for example, to add the prefix to the link's contents), Tag and Bookmark properties. Note that the set of bindable properties depends on the control type. Formatting Summaries When a summary function is applied to a control's dynamic content, value formatting is specified separately. To do this, expand the Actions or Data category. Then, in the Summary section, click the ellipsis button for the Format String property.

161 The summary format has priority over the general value format.

162 Master-Detail Relation Editor When a data source contains two or more queries, clicking the Editor. button in the Field List will invoke the Master-Detail Relation Using this editor, you can define master-detail relationships between queries by specifying their corresponding key fields. This allows you to create hierarchical data sources that are used to create nested master-detail reports. N o t e Although it is also possible to join different tables within a single query, creating hierarchical data sources is preferred in most cases to provide better performance (in general, master-detail reports are generated faster than similar-looking reports created by grouping "flat" data sources).


163 Script Editor The Script Editor allows end-users to write code for specific event handlers in the End-User Report Designer to adjust the behavior of report controls, bands, or a report itself. This topic describes the basic principles of using scripts in XtraReports, the Script Editor interface, and shows how scripting can be used in a report. This document consists of the following sections. Overview Maintaining Scripts Overview The Script Editor provides end-users with the capability to write and execute scripts at runtime when a report is generated. Note that although it's possible to add scripts in both the Visual Studio IDE and in the End-User Report Designer, this feature is primarily intended to be used by advanced end-users who want to slightly customize a report in the End-User Report Designer. The Script Editor supports C#, Visual Basic.NET and JScript.NET scripting languages. This means that the scripting language is independent from the language used to create the report. The language is specified by the Script Language property of a report. The selected scripting language must be the same for all scripts used in a report. The Script Editor supports intelligent code completion that makes it easier and faster for you to write scripts. Context-aware hints are displayed on pressing CTRL+spacebar. This feature is only supported for the C# and Visual Basic.NET script languages. Maintaining Scripts Each report element has its own set of events that can be handled by the Script Editor. To handle an event of a report element, do the following. 1. Click the Scripts button ( ) located on the End-User Report Designer's Main Toolbar. 2. In the displayed Script Editor, specify the report control and its event by the toolbar. The toolbar contains all scripts written for all report elements, and allows you to quickly navigate through them by choosing the required report element in the corresponding drop-down list and by specifying one of its available events in another menu.
.")
164 After the event is specified, a code template is generated in the current scripting language. 3. To check for errors in the report's script, click the Validate button ( ). If an error is found, the string containing this error is marked with an the text of the error is displayed. icon. When a mouse pointer hovers over this icon,
165 Wizards The Web Report Designer provides the following two kinds of wizards that enable you to create new reports and bind them to data. Report Wizard SQL Data Source Wizard
166 SQL Data Source Wizard Two different SQL Data Source Wizard versions are available, one to create a new data source and the other to edit an existing one. Adding a New Data Source To run the SQL Data Source Wizard to create a new data source, use the corresponding option in the Report Designer Menu. This menu command is only available if any data connections were explicitly provided to the Web Report Designer by your software vendor. The following is a complete list of wizard pages that may be required to create a new SQL data source. Choose a Data Connection Create a Query or Select a Stored Procedure Configure Query Parameters Configure Master-Detail Relationships Editing an Existing Data Source To run the SQL Data Source Wizard to edit an existing data source, do one of the following. To add a new query to an existing data source, select the data source and click the Add Query button in the Field List.


167 To edit an existing query of a data source, select the query and click the Edit Query button in the Field List. The following is a complete list of wizard pages that may be required to edit an existing SQL data source. Create a Query or Select a Stored Procedure Configure Query Parameters
168 Adding a New Data Source The following is a complete list of wizard pages that may be required to create a new SQL data source. Choose a Data Connection Create a Query or Select a Stored Procedure Configure Query Parameters Configure Master-Detail Relationships
169 Choose a Data Connection On this wizard page, you are required to select a data connection that provides necessary information to connect to a database. Select a data connection and click Next to proceed to the next wizard page: Create a Query or Select a Stored Procedure.
170 Create a Query or Select a Stored Procedure On this wizard page, you can choose which tables, views and/or stored procedures from your data source to display in the report. When you are required to shape the query data at the level of a data source, you can create custom queries by expanding the Queries category and clicking the button. If custom SQL editing is disabled by your software provider, clicking this button will invoke the Query Builder where you can create complex queries by joining multiple tables, filtering, sorting and grouping their data, as well as calculating various aggregate functions. If custom SQL editing is enabled by your software provider, clicking this button will invoke a context menu where you can choose whether to run the Query Builder or Custom SQL Editor. To customize an existing query using the Query Builder, click the button on this wizard page. To delete a query, click the button. You can stop the wizard at this step by clicking Finish. To continue report customization, select at least one item and click Next to proceed to the next wizard page. N o t e If any custom queries and/or parameterized stored procedures are selected on this wizard page, you will be asked to customize parameters on the next wizard page: Configure Query Parameters. If two or more tables and/or views are selected on this wizard page (and no custom queries), you will be asked to specify the data relationships on the next wizard page: Configure Master-Detail Relationships. When invoking the SQL Data Source Wizard to edit an existing data source, another version of this page is displayed. This version is also shown if your software vendor switched the SQL Data Source Wizard to single-query mode.
171 Configure Query Parameters This page is displayed if any custom queries and/or parameterized stored procedures were selected on the previous wizard page. On this page, you can manage parameters that are used in queries and/or stored procedures and specify parameter values. To add a new parameter, select a query and click the button. To delete a parameter, click the button. To customize an existing parameter, click the button. Next, you can specify the parameter name, type and value. When the parameter type is set to Expression, the value editor displays the ellipsis button, and clicking on it invokes the
172 Expression Editor. To link a query parameter to an existing report parameter, type the report parameter name using the following syntax: [parameters.parameter1]. Click Next to proceed to the next wizard page: Configure Master-Detail Relationships. N o t e When invoking the SQL Data Source Wizard to edit an existing data source, another version of this page is displayed. This version is also shown if your software vendor switched the SQL Data Source Wizard to the single-query mode.

173 Configure Master-Detail Relationships This page is displayed if two or more tables and/or views are selected on a previous wizard page: Create a Query or Select a Stored Procedure. On this page, you can define master-detail relationships between two or more queries by specifying their corresponding key fields. On clicking Finish, the new data source will be added to the report and displayed in the Field List. To use the created data source in a report, assign this data source to the report's Data Source property and set the Data Member property to a required query name.
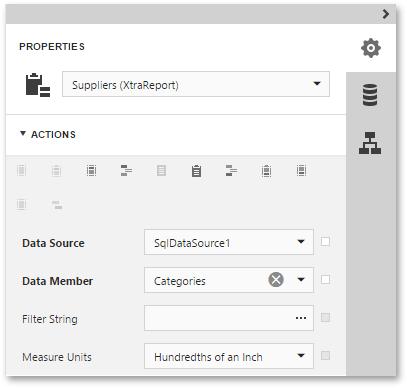
174
175 Editing an Existing Data Source The following is a complete list of wizard pages that may be required to customize an existing SQL data source. Create a Query or Select a Stored Procedure Configure Query Parameters
176 Create a Query or Select a Stored Procedure On this page, you can run the Query Builder to create a new query, specify custom SQL (if this option is enabled by your software vendor) or select a stored procedure. If a custom query or stored procedure selected on this wizard page does not contain any parameters, you can stop the wizard at this step by clicking Finish. Otherwise, you will be asked to specify parameter values on the next wizard page: Configure Query Parameters.
177 Configure Query Parameters This page is displayed if any query parameters were created on the previous wizard page. On this page, you can manage query or stored procedure parameters and specify their values. To add a new query parameter or remove an existing one, use the Add and Remove buttons. You can customize the name, type and value of an existing parameter. When the parameter type is set to Expression, the value editor displays the ellipsis button, and clicking on it invokes the Expression Editor.
178 To link a query parameter to an existing report parameter, type the report parameter name using the following syntax: [parameters.parameter1]. Clicking Finish will close the wizard and apply the changes to the data source.
179 Report Wizard The Report Wizard is a tool that allows you to easily create reports based on built-in templates and generate their layout from scratch. Using this tool, you can do the following. Create a new report from scratch In the menu, select New via Wizard. Edit an existing report In the menu, select Design in Report Wizard. The following is a complete list of pages that may be available in the Report Wizard. Choose a Report Type Empty Report Data-bound Report Choose a Data Source Choose a Table or View Choose Columns Create Groups Choose Summary Options Choose a Report Layout Choose a Report Style Specify the Report Title Label Report Choose the Label Type Specify the Label's Parameters
180 Choose a Report Type On this wizard page, you can choose the kind of a report you want to create. The following report types are available. Empty Report Choose this option to create a new blank report that is not bound to data and doesn't contain any report controls. Data-bound Report This option allows you to easily create a report bound to data and generate its layout from scratch. While setting up the report, you can group and sort data, add totals, apply one of the predefined report styles, etc. Label Report Select this report type if you need to print out labels. In the Label Report Wizard, simply choose the required paper supplier and label type, and the report is adjusted automatically. After completing the wizard, you get an empty report that clearly indicates label boundaries and properly positions labels within paper sheets.

181 Empty Report Selecting this option on the Choose a Report Type wizard page will create a new blank report that is not bound to any data source. The following image illustrates the created report layout. To provide data to the created report, use the SQL Data Source Wizard.
.")
182 Data-bound Report Selecting this option on the Choose a Report Type wizard page will proceed to the Report Wizard that enables you to select the data to display in a report and define the report layout. The Report Wizard includes the following pages (only the first two pages are necessary and you can finish the wizard on any other page). Choose a Data Source Choose a Table or View Choose Columns Create Groups Choose Summary Options Choose a Report Layout Choose a Report Style Specify the Report Title
183 Choose a Data Source On this page, you can select the report data source from the list of the available data sources. Click Next to proceed to the next wizard page: Choose a Table or View
184 Choose a Table or View On this page, select a data table or view that will provide data to your report. Click Next to proceed to the next wizard page: Choose Columns.
185 Choose Columns On this page, you can choose fields whose data will be displayed in your report. The selected fields and corresponding captions will be automatically added to the report body. N o t e To continue or finish report creation, you must select at least one field. You can stop the wizard at this step by clicking Finish. If you want to customize your report further, click Next to proceed to the next wizard page: Create Groups.
186 Create Groups This page allows you to group data in your report. If you don't need to group your data, simply click Next on this page to skip this step. Nested grouping and grouping against multiple fields are fully supported. The following image illustrates all basic grouping types. The list on the left-hand side displays data fields that can be used to group data. To apply grouping, select columns and click the right arrow (>) button. Note that grouping fields on the right-hand side can be selected by clicking them. This is useful if you need to remove them or change their order. To accomplish the latter, use the up arrow ( ) and down arrow ( ) buttons. You can stop the wizard on this step by clicking Finish. If you want to customize your report further, click Next. If data grouping has been applied on this page, you'll proceed to the Choose Summary Options page. If you haven't grouped your data, skip the Summaries step and go to the Choose a Report Layout page.
187 Choose Summary Options Use this page to specify totals to be displayed for each data group and grand totals for the entire report. For instance, you may need to display the sum of values in a particular field, the average value, etc. Specified totals will be displayed after corresponding groups and in the report footer. This page displays all available numerical and date-time fields that aren't used to group data. Using the check box table, you can specify which functions should be calculated for these fields. Sometimes, data fields can contain empty values (this is different from zero in a numeric field). If you don't want to take these values into account when calculating totals, check Ignore NULL values. Otherwise, these values will be treated as zeros for numeric fields and the earliest system date for date-time fields. You can stop the wizard at this step by clicking Finish. If you want to customize your report further, click Next to proceed to the next wizard page: Choose a Report Layout.

188 Choose a Report Layout This page allows you to specify the layout of elements in your report. If you haven't applied data grouping, you can specify how data field values are arranged - into a table, one under another, etc. If report data is grouped, you can choose one of the available indentation styles for nested elements. Additionally, this page allows you to specify the page orientation for your report. The following options are available if data grouping has been applied. If data hasn't been grouped, you will see the following report layout options. You can stop the wizard at this step by clicking Finish. If you want to customize your report further, click Next to proceed to the next wizard page: Choose a Report Style.
189 Choose a Report Style On this page, you can specify a visual style for the for the report. You can stop the wizard at this step by clicking Finish. If you want to customize your report further, click Next to proceed to the next wizard page: Specify the Report Title.
190 Specify the Report Title On this page, specify the title for the report and click Finish to exit the wizard.

191 Label Report Selecting this option on the Choose a Report Type wizard page will proceed to the Label Wizard that enables you to create labels of a required type. The Label Wizard includes the following pages. Choose the Label Type Specify the Label's Parameters After completing the Label Report Wizard, you will get a blank report that generates labels of a particular size. The report designer will indicate the label boundaries and properly position labels on paper sheets. You can then populate the label area with the required content and print out your labels.
192 Choose the Label Type This wizard page is intended to select one of the numerous predefined label types. On this page, you can choose the proper supplier from the Label Product combo box and a particular product from the Product Number list. The selected type defines the label's size and layout, as well as the default page type for this label. Click Next to proceed to the next wizard page: Specify the Label's Parameters.

193 Specify the Label's Parameters This wizard page is intended to manually adjust label settings that were automatically specified in the previous step based on the selected supplier and product. Editors on this page allow you to choose the Page Size and freely customize label parameters. The pane on the right-hand side provides a label dimensions preview. Click Finish to complete report creation. The following image illustrates the created report layout. To learn how to provide content for the labels, see Label Report.

194 Document Preview The documents in this section describe the Document Preview that is built into the Web Report Designer. To display a preview for the report currently being opened in the Web Report Designer, click the Preview Designer Toolbar. button on the The Document Preview provides a Preview Toolbar, as well as the following panels that become available depending on the document content. ICON ELEMENT Export Options Panel Search Panel Document Map Panel Preview Parameters Panel N o t e To learn more about the options available in the preview mode, refer to the HTML5 Document Viewer section of this documentation.
195 Preview Toolbar The Preview Toolbar provides quick access to the commands related to report viewing and publishing. The Preview Toolbar commands are divided into the following sections by their intended use. Navigation Commands View Commands Interaction Commands Print and Export Commands Search Command Mode Command Navigation Commands The commands in this section are used to navigate through the resulting report. COMMAND ICON D ES CR IPTION Previous page Next page First page Last page Switches to the previous report page. Switches to the next report page. Switches to the first report page. Switches to the last report page. Page factor Navigates to a specific page. View Commands The commands in this section are used to adjust the view in the Web Report Designer. COMMAND ICON D ES CR IPTION Zoom In Zoom Out Increases the document's current zoom factor by 1 percent. Decreases the document's current zoom factor by 1 percent. Zoom Factor Zooms to a specific zoom factor from the drop-down list. Toggle Multipage mode Displays several report pages together in the multipage mode. Interaction Commands The only command in this section is used to maintain the interactive capabilities of previewed reports.
196 COMMAND ICON D ES CR IPTION Highlight Editing Fields Highlights all editing fields to quickly discover which of the document elements are editable. Print and Export Commands The commands in this section are used to print an entire report or its current page, and export a report into one of the supported third-party formats. COMMAND ICON D ES CR IPTION Print Initiates report printing. Print Page Initiates printing of a report's current page. Export to Exports a report into one of the supported third-party formats. Search Command The command in this section is used to show the Search panel. COMMAND ICON D ES CR IPTION Search Shows the Search panel, which allows users to find a specified text throughout a document. Mode Command The command in this section is used for switching the Web Report Designer operation mode. COMMAND ICON D ES CR IPTION Design Activates the Design mode.


197 Export Options Panel The Export Options panel allows you to view and edit format-specific options required for exporting a report to one of the supported third-party formats. The options are allocated in groups by an export format to which they are applied. To customize export options, expand the required options group by clicking on its header, and specify the required options.

198 Search Panel The Search Panel enables you to find specific text in a document with specified search options. Once occurrences of the specified string are found, they are listed in the search results. Clicking a search result will navigate you to the corresponding entry in the document. When the Document Map is available, it is filtered to display only those document sections that contain the found entries.

199 Document Map Panel The Document Map Panel is available in the Document Preview of the Web Report Designer when any bookmarks are assigned to the report elements. The Document Map displays the hierarchy of bookmarks assigned to report elements. Clicking a specific entry in the Document Map will navigate you to the corresponding element in the document.

200 Preview Parameters Panel The Preview Parameters Panel is available in the Document Preview if any visible parameters exist in the current report. Using this panel, you can specify and submit new report parameters values, which will recreate the document with the new values taken into account. The following actions are available on this panel. To update the document after customizing parameter values, click Submit. To restore the default parameter values, click Reset.
Management Reports Centre. User Guide. Emmanuel Amekuedi
 Management Reports Centre User Guide Emmanuel Amekuedi Table of Contents Introduction... 3 Overview... 3 Key features... 4 Authentication methods... 4 System requirements... 5 Deployment options... 5 Getting
P3e REPORT WRITER CREATING A BLANK REPORT
 P3e REPORT WRITER CREATING A BLANK REPORT 1. On the Reports window, select a report, then click Copy. 2. Click Paste. 3. Click Modify. 4. Click the New Report icon. The report will look like the following
Stamina Software Pty Ltd. TRAINING MANUAL Viságe Reporter
 Stamina Software Pty Ltd TRAINING MANUAL Viságe Reporter Version: 2 21 st January 2009 Contents Introduction...1 Assumed Knowledge...1 Pre Planning...1 Report Designer Location...2 Report Designer Screen
User Guide. Web Intelligence Rich Client. Business Objects 4.1
 User Guide Web Intelligence Rich Client Business Objects 4.1 2 P a g e Web Intelligence 4.1 User Guide Web Intelligence 4.1 User Guide Contents Getting Started in Web Intelligence 4.1... 5 Log into EDDIE...
SmartView. User Guide - Analysis. Version 2.0
 SmartView User Guide - Analysis Version 2.0 Table of Contents Page i Table of Contents Table Of Contents I Introduction 1 Dashboard Layouts 2 Dashboard Mode 2 Story Mode 3 Dashboard Controls 4 Dashboards
CounselLink Reporting. Designer
 CounselLink Reporting Designer Contents Overview... 1 Introduction to the Document Editor... 2 Create a new document:... 2 Document Templates... 3 Datasets... 3 Document Structure... 3 Layout Area... 4
Access: Printing Data with Reports
 Access: Printing Data with Reports Reports are a means for displaying and summarizing data from tables or queries. While forms are primarily for on-screen viewing, reports are for presenting your data
Quick Reference Card Business Objects Toolbar Design Mode
 Icon Description Open in a new window Pin/Unpin this tab Close this tab File Toolbar New create a new document Open Open a document Select a Folder Select a Document Select Open Save Click the button to
Table of Contents. Table of Contents
 Powered by 1 Table of Contents Table of Contents Dashboard for Windows... 4 Dashboard Designer... 5 Creating Dashboards... 5 Printing and Exporting... 5 Dashboard Items... 5 UI Elements... 5 Providing
Microsoft How to Series
 Microsoft How to Series Getting Started with EXCEL 2007 A B C D E F Tabs Introduction to the Excel 2007 Interface The Excel 2007 Interface is comprised of several elements, with four main parts: Office
Complete Quick Reference Summary
 Microsoft Access 2010 Complete Quick Reference Summary Microsoft Access 2010 Quick Reference Summary Advanced Filter/Sort, Use AC 153 Advanced button (Home tab Sort & Filter, Advanced Filter/Sort) All
Table of Contents. Windows Interface Elements (Home Page) Contents. Select Chart... Elements
 Contents. Select Chart... Elements") Contents Table of Contents Windows Interface Elements (Home Page) 1 Charting... 8 Chart Wizard... 9 Chart Type... Page 11 Appearance... Page 12 Series Page... 14 Data Page... 16 Chart Page... 19 Diagram
Contents Table of Contents Windows Interface Elements (Home Page) 1 Charting... 8 Chart Wizard... 9 Chart Type... Page 11 Appearance... Page 12 Series Page... 14 Data Page... 16 Chart Page... 19 Diagram
DEVELOPING DATABASE APPLICATIONS (INTERMEDIATE MICROSOFT ACCESS, X405.5)
") Technology & Information Management Instructor: Michael Kremer, Ph.D. Database Program: Microsoft Access Series DEVELOPING DATABASE APPLICATIONS (INTERMEDIATE MICROSOFT ACCESS, X405.5) Section 5 AGENDA
Technology & Information Management Instructor: Michael Kremer, Ph.D. Database Program: Microsoft Access Series DEVELOPING DATABASE APPLICATIONS (INTERMEDIATE MICROSOFT ACCESS, X405.5) Section 5 AGENDA
IHS Enerdeq Desktop International Training Guide
 IHS > Decision Support Tool IHS Enerdeq Desktop International Training Guide May 2009 Version 1.5.2 2009 IHS, All Rights Reserved. All trademarks belong to IHS or its affiliated and subsidiary companies,
Creating Reports in Access 2007 Table of Contents GUIDE TO DESIGNING REPORTS... 3 DECIDE HOW TO LAY OUT YOUR REPORT... 3 MAKE A SKETCH OF YOUR
 Creating Reports in Access 2007 Table of Contents GUIDE TO DESIGNING REPORTS... 3 DECIDE HOW TO LAY OUT YOUR REPORT... 3 MAKE A SKETCH OF YOUR REPORT... 3 DECIDE WHICH DATA TO PUT IN EACH REPORT SECTION...
Reference Services Division Presents. Microsoft Word 2
 Reference Services Division Presents Microsoft Word 2 This handout covers the latest Microsoft Word 2010. This handout includes instructions for the tasks we will be covering in class. Basic Tasks Review
Creating a Spreadsheet by Using Excel
 The Excel window...40 Viewing worksheets...41 Entering data...41 Change the cell data format...42 Select cells...42 Move or copy cells...43 Delete or clear cells...43 Enter a series...44 Find or replace
InDesign CS Basics. To learn the tools and features of InDesign CS to create publications efficiently and effectively.
 InDesign CS Basics InDesign Basics Training Objective To learn the tools and features of InDesign CS to create publications efficiently and effectively. What you can expect to learn from this class: How
Excel Select a template category in the Office.com Templates section. 5. Click the Download button.
 Microsoft QUICK Excel 2010 Source Getting Started The Excel Window u v w z Creating a New Blank Workbook 2. Select New in the left pane. 3. Select the Blank workbook template in the Available Templates
SPARK. User Manual Ver ITLAQ Technologies
 SPARK Forms Builder for Office 365 User Manual Ver. 3.5.50.102 0 ITLAQ Technologies www.itlaq.com Table of Contents 1 The Form Designer Workspace... 3 1.1 Form Toolbox... 3 1.1.1 Hiding/ Unhiding/ Minimizing
Copyright 2010, Oracle. All rights reserved.
 Agenda Interactive Dashboards Master-Detail Linking New Prompt Controls Pivot Table Interactions Enhanced Dashboard Builder Analysis Editor Overview Working with the analysis editor step by step Praxisteil
Advanced Excel. Click Computer if required, then click Browse.
 Advanced Excel 1. Using the Application 1.1. Working with spreadsheets 1.1.1 Open a spreadsheet application. Click the Start button. Select All Programs. Click Microsoft Excel 2013. 1.1.1 Close a spreadsheet
Microsoft Excel 2010 Tutorial
 1 Microsoft Excel 2010 Tutorial Excel is a spreadsheet program in the Microsoft Office system. You can use Excel to create and format workbooks (a collection of spreadsheets) in order to analyze data and
When you pass Exam : Access 2010, you complete the requirements for the Microsoft Office Specialist (MOS) - Access 2010 certification.
 - Access 2010 certification.") Appendix 1 Microsoft Office Specialist: Access Certification Introduction The candidates for Microsoft Office Specialist certification should have core-level knowledge of Microsoft Office Access 2010.
Appendix 1 Microsoft Office Specialist: Access Certification Introduction The candidates for Microsoft Office Specialist certification should have core-level knowledge of Microsoft Office Access 2010.
Microsoft Access 5: Reports & Other Useful Functions
 Microsoft Access 5: Reports & Other Useful Functions You can print out simple records of your data by using the Office menu. However, if you want to create a customized report from one or more tables or
Quick Start Guide. Version R94. English
 Custom Reports Quick Start Guide Version R94 English December 12, 2016 Copyright Agreement The purchase and use of all Software and Services is subject to the Agreement as defined in Kaseya s Click-Accept
Sending image(s) to report Click Send Snapshot on any screen in Dolphin3D and choose the Send to Report option
 to report Click Send Snapshot on any screen in Dolphin3D and choose the Send to Report option") Dolphin 3D Reports Sending image(s) to report Click Send Snapshot on any screen in Dolphin3D and choose the Send to Report option Creating a report step by step 1. Generate the desired images in Dolphin3D
Dolphin 3D Reports Sending image(s) to report Click Send Snapshot on any screen in Dolphin3D and choose the Send to Report option Creating a report step by step 1. Generate the desired images in Dolphin3D
Numbers Basics Website:
 Website: http://etc.usf.edu/te/ Numbers is Apple's new spreadsheet application. It is installed as part of the iwork suite, which also includes the word processing program Pages and the presentation program
Introducing Gupta Report Builder
 Business Reporting Chapter 1 Introducing Gupta Report Builder You can use Report Builder to design reports. This chapter describes: Our approach to building reports. Some of the reports you can build.
CHRIST THE KING BOYS MATRIC HR. SEC. SCHOOL, KUMBAKONAM CHAPTER 2 TEXT FORMATTING
 CHAPTER 2 TEXT FORMATTING 1. Explain how to create a Bulleted and Numbered List in Star Office Writer? One way to create a list of points or topics in a document is to create a bulleted list. A bullet
Microsoft Office Training Skills 2010
 Microsoft Office Training Skills 2010 Lesson 5 Working with pages, Tables, Shapes and Securing Documents Adding Page color Add color to the background of one or several pages in the document. 1. Click
Microsoft Office PowerPoint 2013 Courses 24 Hours
 Microsoft Office PowerPoint 2013 Courses 24 Hours COURSE OUTLINES FOUNDATION LEVEL COURSE OUTLINE Using PowerPoint 2013 Opening PowerPoint 2013 Opening a Presentation Navigating between Slides Using the
Configuring Ad hoc Reporting. Version: 16.0
 Configuring Ad hoc Reporting Version: 16.0 Copyright 2018 Intellicus Technologies This document and its content is copyrighted material of Intellicus Technologies. The content may not be copied or derived
ActiveReports 12 Server 1
 ActiveReports 12 Server 1 Table of Contents Table of Contents 1-2 ActiveReports 12 Server Designer User Guide 3 Report Portal 3-7 Mobile Report Portal 7-11 Get Started with ActiveReports Web Designer 11-12
Chapter 4. Microsoft Excel
 Chapter 4 Microsoft Excel Topic Introduction Spreadsheet Basic Screen Layout Modifying a Worksheet Formatting Cells Formulas and Functions Sorting and Filling Borders and Shading Charts Introduction A
FrontPage 2000 Tutorial -- Advanced
 FrontPage 2000 Tutorial -- Advanced Shared Borders Shared Borders are parts of the web page that share content with the other pages in the web. They are located at the top, bottom, left side, or right
Creating & Modifying Tables in Word 2003
 Creating & Modifying Tables in Word 2003 This bookl LaTonya Motley Trainer / Instructional Technology Specialist Staff Development 660-6452 Table of Contents Overview... 1 Inserting Tables... 1 Using Pre-Set
Database Design Practice Test JPSFBLA
 1. You see field names, data types, and descriptions in: a. Datasheet View c. Form View b. Design View d. Property View 2. The data type for insurance policy numbers, such as 0012-M-340-25 or 43F33-7805,
GraphWorX64 Productivity Tips
 Description: Overview of the most important productivity tools in GraphWorX64 General Requirement: Basic knowledge of GraphWorX64. Introduction GraphWorX64 has a very powerful development environment in
Microsoft Excel 2010 Part 2: Intermediate Excel
 CALIFORNIA STATE UNIVERSITY, LOS ANGELES INFORMATION TECHNOLOGY SERVICES Microsoft Excel 2010 Part 2: Intermediate Excel Spring 2014, Version 1.0 Table of Contents Introduction...3 Working with Rows and
Using Microsoft Office 2003 Intermediate Word Handout INFORMATION TECHNOLOGY SERVICES California State University, Los Angeles Version 1.
 Using Microsoft Office 2003 Intermediate Word Handout INFORMATION TECHNOLOGY SERVICES California State University, Los Angeles Version 1.2 Summer 2010 Table of Contents Intermediate Microsoft Word 2003...
Working with PDF s. To open a recent file on the Start screen, double click on the file name.
 Working with PDF s Acrobat DC Start Screen (Home Tab) When Acrobat opens, the Acrobat Start screen (Home Tab) populates displaying a list of recently opened files. The search feature on the top of the
Table of Contents 1-4. User Guide 5. Getting Started 6. Report Portal 6. Creating Your First Report Previewing Reports 11-13
 Table of Contents Table of Contents 1-4 User Guide 5 Getting Started 6 Report Portal 6 Creating Your First Report 6-11 Previewing Reports 11-13 Previewing Reports in HTML5 Viewer 13-18 Report Concepts
MS Word Professional Document Alignment
 MS Word Professional Document Alignment Table of Contents CHARACTER VS. PARAGRAPH FORMATTING...5 Character formatting...5 Paragraph Formatting...5 USING SHOW/HIDE TO REVEAL NON-PRINTING CHARACTERS...5
Unit D Lecture Notes Word 2003
 Unit D Lecture Notes Word 2003 Objectives: In this project you will learn: Set document margins Divide a document into sections Insert page breaks Insert page numbers Add headers and footers Edit headers
Specification Manager
 Enterprise Architect User Guide Series Specification Manager How to define model elements simply? In Sparx Systems Enterprise Architect, use the document-based Specification Manager to create elements
VHSE - COMPUTERISED OFFICE MANAGEMENT MODULE III - Communication and Publishing Art - PageMaker
 INTRODUCTION : It is one Adobe PageMaker 7.0 software is the ideal page layout program for business, education, and small- and home-office professionals who want to create high-quality publications such
The American University in Cairo. Academic Computing Services. Excel prepared by. Maha Amer
 The American University in Cairo Excel 2000 prepared by Maha Amer Spring 2001 Table of Contents: Opening the Excel Program Creating, Opening and Saving Excel Worksheets Sheet Structure Formatting Text
Desktop Studio: Charts. Version: 7.3
 Desktop Studio: Charts Version: 7.3 Copyright 2015 Intellicus Technologies This document and its content is copyrighted material of Intellicus Technologies. The content may not be copied or derived from,
Getting started with Ms Access Getting Started. Primary Key Composite Key Foreign Key
 Getting started with Ms Access 2007 Getting Started Customize Microsoft Office Toolbar The Ribbon Quick Access Toolbar Navigation Tabbed Document Window Viewing Primary Key Composite Key Foreign Key Table
OX Documents Release v Feature Overview
 OX Documents Release v7.8.4 Feature Overview 1 Objective of this Document... 3 1.1 The Purpose of this Document... 3 2 General Improvements... 4 2.1 Security First: Working with Encrypted Files (OX Guard)...
Let s create another simple report from one of our queries available: Author Age query.
 Microsoft Access 6: Reports & Other Useful Functions This can be a very quick way to build a report, especially if you plan to put only a few fields on your report. When you click on the Blank Report button,
Working with the RTF Generator
 Using EA Working with the RTF Generator by Dermot O Bryan All material Sparx Systems 2008 Sparx Systems 2008 Page 1 Trademarks Microsoft, Microsoft Word are trademarks or registered trademarks of the Microsoft
Excel 2007 New Features Table of Contents
 Table of Contents Excel 2007 New Interface... 1 Quick Access Toolbar... 1 Minimizing the Ribbon... 1 The Office Button... 2 Format as Table Filters and Sorting... 2 Table Tools... 4 Filtering Data... 4
Chapter 4 Printing and Viewing a Presentation Using Proofing Tools I. Spell Check II. The Thesaurus... 23
 PowerPoint Level 1 Table of Contents Chapter 1 Getting Started... 7 Interacting with PowerPoint... 7 Slides... 7 I. Adding Slides... 8 II. Deleting Slides... 8 III. Cutting, Copying and Pasting Slides...
Keynote 08 Basics Website:
 Website: http://etc.usf.edu/te/ Keynote is Apple's presentation application. Keynote is installed as part of the iwork suite, which also includes the word processing program Pages and the spreadsheet program
Links to Activities ACTIVITY 4.1. Links to Activities Links to Activities
 ACCESS SUMMARIZING DATA AND CALCULATING IN FORMS AND REPORTS Section 4 Skills Use functions in a query to calculate statistics Summarize data in a crosstab query Summarize data in a PivotTable Summarize
Band Editor User Guide Version 1.3 Last Updated 9/19/07
 Version 1.3 Evisions, Inc. 14522 Myford Road Irvine, CA 92606 Phone: 949.833.1384 Fax: 714.730.2524 http://www.evisions.com/support Table of Contents 1 - Introduction... 4 2 - Report Design... 7 Select
Index COPYRIGHTED MATERIAL. Symbols and Numerics
 Symbols and Numerics ( ) (parentheses), in functions, 173... (double quotes), enclosing character strings, 183 #...# (pound signs), enclosing datetime literals, 184... (single quotes), enclosing character
EtatRequete.book Page 1 Mardi, 6. avril :01 15 Reports and Queries
 Reports and Queries WinDev 15 - WebDev 15 - WinDev Mobile 15 Documentation version 15(1) - 0410 Remember to visit our Web site (www.windev.com) on a regular basis to find out whether upgraded versions
Labels and Envelopes in Word 2013
 Labels and Envelopes in Word 2013 Labels... 2 Labels - A Blank Page... 2 Selecting the Label Type... 2 Creating the Label Document... 2 Labels - A Page of the Same... 3 Printing to a Specific Label on
Tutorial 5: Working with Excel Tables, PivotTables, and PivotCharts. Microsoft Excel 2013 Enhanced
 Tutorial 5: Working with Excel Tables, PivotTables, and PivotCharts Microsoft Excel 2013 Enhanced Objectives Explore a structured range of data Freeze rows and columns Plan and create an Excel table Rename
NOBLE INSTITUTE OF COMPUTER ACCOUNTANCY
 1 The ability to combine name and addressed with a standard document is called a. document formatting b. database management c. mail merge d. form letters 2. Which enables us to send the same letter to
If you have questions or need assistance in any way, please contact MicroEdge Technical Support.
 AngelPoints Advanced Reporting Users Guide 2017 Advanced Reporting leverages existing technologies current employed in GIFTS Online to provide AngelPoints users with a new and more robust environment to
WINDEV 23 - WEBDEV 23 - WINDEV Mobile 23 Documentation version
 WINDEV 23 - WEBDEV 23 - WINDEV Mobile 23 Documentation version 23-1 - 04-18 Summary Part 1 - Report editor 1. Introduction... 13 2. How to create a report... 23 3. Data sources of a report... 43 4. Describing
Document Editor Basics
 Document Editor Basics When you use the Document Editor option, either from ZP Toolbox or from the Output option drop-down box, you will be taken to the Report Designer Screen. While in this window, you
Report Generator for DPOPWR
 Online Help Report Generator for DPOPWR Adapted from the Report Generator for DPOPWR Online Help www.tektronix.com Copyright Tektroni x. All rights reserved. Licensed software products are owned by Tektronix
Microsoft Access 2010
 2013\2014 Microsoft Access 2010 Tamer Farkouh M i c r o s o f t A c c e s s 2 0 1 0 P a g e 1 Definitions Microsoft Access 2010 What is a database? A database is defined as an organized collection of data
User Guide Product Design Version 1.7
 User Guide Product Design Version 1.7 1 INTRODUCTION 3 Guide 3 USING THE SYSTEM 4 Accessing the System 5 Logging In Using an Access Email 5 Normal Login 6 Resetting a Password 6 Logging Off 6 Home Page
Access 2003 Introduction to Report Design
 Access 2003 Introduction to Report Design TABLE OF CONTENTS CREATING A REPORT IN DESIGN VIEW... 3 BUILDING THE REPORT LAYOUT... 5 SETTING THE REPORT WIDTH... 5 DISPLAYING THE FIELD LIST... 5 WORKING WITH
Desktop Studio: Charts
 Desktop Studio: Charts Intellicus Enterprise Reporting and BI Platform Intellicus Technologies info@intellicus.com www.intellicus.com Working with Charts i Copyright 2011 Intellicus Technologies This document
WORD Creating Objects: Tables, Charts and More
 WORD 2007 Creating Objects: Tables, Charts and More Microsoft Office 2007 TABLE OF CONTENTS TABLES... 1 TABLE LAYOUT... 1 TABLE DESIGN... 2 CHARTS... 4 PICTURES AND DRAWINGS... 8 USING DRAWINGS... 8 Drawing
Chapter 4: Single Table Form Lab
 Chapter 4: Single Table Form Lab Learning Objectives This chapter provides practice with creating forms for individual tables in Access 2003. After this chapter, you should have acquired the knowledge
Introduction to Excel
 Office Button, Tabs and Ribbons Office Button The File menu selection located in the upper left corner in previous versions of Excel has been replaced with the Office Button in Excel 2007. Clicking on
Quick Reference Summary
 Microsoft Excel 2010 Quick Reference Summary Microsoft Excel 2010 Quick Reference Summary 3-D Chart, Rotate EX 462 3-D Rotation button (Chart Tools Layout tab Background, change rotation (Format Chart
ICDL & OOo BASE. Module Five. Databases
 ICDL & OOo BASE Module Five Databases BASE Module Goals taken from the Module 5 ICDL Syllabus Module 5 Database requires the candidate to understand some of the main concepts of databases and demonstrates
WebIntelligence. Creating Documents
 Creating Documents This page is intentionally left blank. 2 WIC110904 Table of Contents Lesson Objective... 5 For Assistance...6 Introduction... 7 Document Editor... 7 Designing a Query Flowchart... 9
Reference Services Division Presents. Microsoft Word 2
 Reference Services Division Presents Microsoft Word 2 Welcome to Word 2. This handout includes step-by-step instructions for each of the tasks we will be covering in class. Changes to Word 2007 There are
PowerPoint 2016 Building a Presentation
 PowerPoint 2016 Building a Presentation What is PowerPoint? PowerPoint is presentation software that helps users quickly and efficiently create dynamic, professional-looking presentations through the use
Frequency tables Create a new Frequency Table
 Frequency tables Create a new Frequency Table Contents FREQUENCY TABLES CREATE A NEW FREQUENCY TABLE... 1 Results Table... 2 Calculate Descriptive Statistics for Frequency Tables... 6 Transfer Results
Access: Using Forms for Data Entry and Editing
 Access: Using Forms for Data Entry and Editing Viewing and Entering Data with Forms A form is the most convenient layout for entering, changing, and viewing records from a database table or query and are
Administrative Training Mura CMS Version 5.6
 Administrative Training Mura CMS Version 5.6 Published: March 9, 2012 Table of Contents Mura CMS Overview! 6 Dashboard!... 6 Site Manager!... 6 Drafts!... 6 Components!... 6 Categories!... 6 Content Collections:
Microsoft PowerPoint 2016 Basics Unit 9 Final Review - Student Notes Directions: Fill in the blanks.
 Directions: Fill in the blanks. 1. PowerPoint Window Layout 2. File Tab When clicked, opens - automatically opens the Info option by default Holds the following options: - Info - New - Open - Save - Save
Introduction Accessing MICS Compiler Learning MICS Compiler CHAPTER 1: Searching for Data Surveys Indicators...
 Acknowledgement MICS Compiler is a web application that has been developed by UNICEF to provide access to Multiple Indicator Cluster Survey data. The system is built on DevInfo technology. 3 Contents Introduction...
Data Should Not be a Four Letter Word Microsoft Excel QUICK TOUR
 Toolbar Tour AutoSum + more functions Chart Wizard Currency, Percent, Comma Style Increase-Decrease Decimal Name Box Chart Wizard QUICK TOUR Name Box AutoSum Numeric Style Chart Wizard Formula Bar Active
Microsoft Word 2007 on Windows
 1 Microsoft Word 2007 on Windows Word is a very popular text formatting and editing program. It is the standard for writing papers and other documents. This tutorial and quick start guide will help you
Using SymPrint to Make Overlays, Templates & More...
 Welcome to SymPrint SymPrint is an easy-to-use tool for creating communication overlays, worksheets, classroom activities and more using a modern toolbar and common-sense interface modeled after the programs
Code Finix Label Designer V 1.0 User Guide
 Code Finix Label Designer V 1.0 User Guide Introduction Welcome, Code Finix Label Designer is a family of professional labeling software products that brings a complete barcode printing solution for desktop
Word Select New in the left pane. 3. Select Blank document in the Available Templates pane. 4. Click the Create button.
 Microsoft QUICK Word 2010 Source Getting Started The Word Window u v w x z Opening a Document 2. Select Open in the left pane. 3. In the Open dialog box, locate and select the file you want to open. 4.
ABOUT THIS COURSE... 3 ABOUT THIS MANUAL... 4 LESSON 1: MANAGING LISTS... 5
 Table of Contents ABOUT THIS COURSE... 3 ABOUT THIS MANUAL... 4 LESSON 1: MANAGING LISTS... 5 TOPIC 1A: SORT A LIST... 6 Sort a list in A-Z or Z-A Order... 6 TOPIC 1B: RENUMBER A LIST... 7 Renumber a List
7. Apply a Range of Table Features
 Word Processing 5N1358 7. Apply a Range of Table Features Contents Apply a Range of Table Features Including: 1. Creating Tables... 1 2. Resizing... 4 3. Merging Cells... 5 4. Inserting or Deleting columns
Understanding Word Processing
 Understanding Word Processing 3.0 Introduction In this chapter you are going to learn how to create a simple memo or note or a complex and complicated multi column business document using word processing
Kendo UI Builder by Progress : Using Kendo UI Designer
 Kendo UI Builder by Progress : Using Kendo UI Designer Notices 2016 Telerik AD. All rights reserved. November 2016 Last updated with new content: Version 1.1 3 Notices 4 Contents Table of Contents Chapter
Corel Ventura 8 Introduction
 Corel Ventura 8 Introduction Training Manual A! ANZAI 1998 Anzai! Inc. Corel Ventura 8 Introduction Table of Contents Section 1, Introduction...1 What Is Corel Ventura?...2 Course Objectives...3 How to
SharePoint List Booster Features
 SharePoint List Booster Features Contents Overview... 5 Supported Environment... 5 User Interface... 5 Disabling List Booster, Hiding List Booster Menu and Disabling Cross Page Queries for specific List
Microsoft Excel 2002 M O D U L E 2
 THE COMPLETE Excel 2002 M O D U L E 2 CompleteVISUAL TM Step-by-step Series Computer Training Manual www.computertrainingmanual.com Copyright Notice Copyright 2002 EBook Publishing. All rights reserved.
Excel 2003 Tutorial II
 This tutorial was adapted from a tutorial by see its complete version at http://www.fgcu.edu/support/office2000/excel/index.html Excel 2003 Tutorial II Charts Chart Wizard Chart toolbar Resizing a chart
BusinessObjects Frequently Asked Questions
 BusinessObjects Frequently Asked Questions Contents Is there a quick way of printing together several reports from the same document?... 2 Is there a way of controlling the text wrap of a cell?... 2 How
DEVELOPING DATABASE APPLICATIONS (INTERMEDIATE MICROSOFT ACCESS, X405.5)
") Technology & Information Management Instructor: Michael Kremer, Ph.D. Database Program: Microsoft Access Series DEVELOPING DATABASE APPLICATIONS (INTERMEDIATE MICROSOFT ACCESS, X405.5) Section 6 AGENDA
Technology & Information Management Instructor: Michael Kremer, Ph.D. Database Program: Microsoft Access Series DEVELOPING DATABASE APPLICATIONS (INTERMEDIATE MICROSOFT ACCESS, X405.5) Section 6 AGENDA
Excel 2010 Level 1: The Excel Environment
 Excel 2010 Level 1: The Excel Environment Table of Contents The Excel 2010 Environment... 1 The Excel Window... 1 File Tab... 1 The Quick Access Toolbar... 4 Access the Customize the Quick Access Toolbar