ICL02: Security Analytics: Discover More in your Endpoint Protection Dashboard Hands-On Lab
|
|
|
- Kristin Haynes
- 5 years ago
- Views:
Transcription

1 ICL02: Security Analytics: Discover More in your Endpoint Protection Dashboard Hands-On Lab Description In this lab you will learn how to install and create custom reports and dashboards using IT Analytics At the end of this lab, you should be able to Describe what IT Analytics is and how it easy it is to explore and navigate data in the console Create Custom Reports Notes LAB Environment: IT Analytics: Win-i78ifho09t1 SQL Server: Win-i78ifho09t1 ITMS Server: Win-i78ifho09t1 Product SQL Server DB Name Username Password CSP Wini78ifho09t1 SCSPDB sa Symc4now! Lab Exercise 1: Installation Topic 1: Install IT Analytics In this exercise, you will practice installing IT Analytics using a simulation tool 5 Minutes 1. On the desktop, launch the ITA Installation Simulation tool and follow the instructions Lab Exercise 2: Exploring Data


2 Topic 1: Using the Cube Browser Using the ad-hoc data mining capabilities of IT Analytics, you will build ad-hoc reports to access data to answer the following question: How many clients are Online/Offline by Group? 10 Minutes 1. Open Internet Explorer 2. On the Management Console Tool Bar, Click the Reports menu item, All Reports 3. Under Reports, Navigate through the tree to expand, IT Analytics. 4. Expand the Cubes folder. 5. Expand KPI Labs Folder 6. Select the Symantec Endpoint Protection Clients Cube. 7. Click anywhere in the PivotTable window to display the Field List. Clicking on this icon in the toolbar will also cause the field list to be displayed. 8. Drag and drop the Client Count measure into the Totals pane 9. Drag and drop the Group System attribute into the Rows pane 10. Drag and drop the Client - Online Status attribute into the Columns pane: 11. Click the dropdown icon next to Client - Online Status to view all of the available statuses. Uncheck All and check Offline and click the OK button. 12. Drag and drop the Last CheckIn Date - Date attribute immediately to the right of the Group attribute. Clicking the plus sign next to a Group will expand to display 2 of 14


3 the Last Checked In date breakdown for that Group. 13. Right click on the Last Client Checkin Date - Date field to enable sorting and other features: 14. On the Right Click Menu, click Subtotals to remove the check: 15. Finally you can save this report by clicking this icon in the toolbar. a. Select the Save as new view radio button and name it appropriately. b. You may also check the Available to all users checkbox in the event that you would like this report to be available to all users. Leaving this unchecked will make this a private view only available to you. 3 of 14


4 16. Refresh the Console by clicking the refresh button in the Browser. This will bring you back to the initial Asset Cube screen. 17. To open the view you just saved, click this icon in the toolbar and select the report you just created in the dropdown list. Note that the report is loaded exactly as you left it. Topic 2: Configure a Pivot Chart report Using the Same Cube from exercise 1, we will create a Chart that will help us to compare the number of Clients by OS that have been over the last few quarters 5 Minutes 1. Select the Symantec Endpoint Protection Clients Cube. 2. Click this icon in the toolbar. 3. Click inside the Pivot Chart to display the Field List. Drag and drop the Client Count measure into the middle of the Pivot Chart 4. Now drag the drop the Computer - Operating System attribute into the Category Fields pane. 4 of 14

5 5. Drag and drop the Computer Service Pack attribute to the Series Fields 6. Click this icon in the toolbar to launch the Commands and Options window. 7. In the Commands and Options window select the Chart Workspace value from the dropdown list. 8. Click this icon to add a Chart Title. 9. Now select Title in the dropdown list 10. Select the Format tab and update the following: a. Change the font size from 12 to 14. b. Update the Caption text box at the bottom to read SEP Client OS added by Quarter or another appropriate title. 11. Click the icon to alter the group by Column/Row 5 of 14


6 Lab Exercise 3: IT Analytics Configuration (Optional) Topic 1: CSP Cube Install In this exercise, you will configure IT Analytics to collect data from CSP 10 Minutes 1. On the Management Console Toolbar, Select Settings, Notification Server, IT Analytics Settings 2. Under the IT Analytics Settings Tree, Expand Connections and Select 3. In the Symantec Critical System Protection Tab, supply the following information Password: Symc4now! 6 of 14


7 4. Click on apply 5. Under the IT Analytics Settings Tree, select cubes 6. In the Cubes Tab, Select available 7. Check each CSP Cube to be installed 8. Click Save Changes and confirm 9. Once the cubes install has completed, click close 10. Under the IT Analytics Settings Tree, select Reports 7 of 14


8 11. In the Reports Tab, Select available 12. Check each CSP Report to be installed 13. Click Save Changes and confirm 14. Once the Reports install has completed, click close 15. Under the IT Analytics Settings Tree, select Processing 16. In the Processing Tab, Deselect all cubes except for the CSP Cubes 17. Click Save Changes 18. Click Run Now 8 of 14


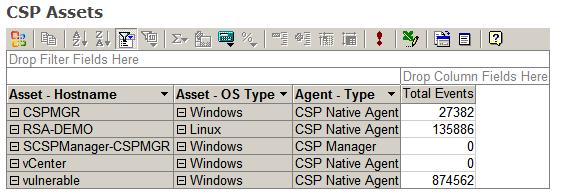
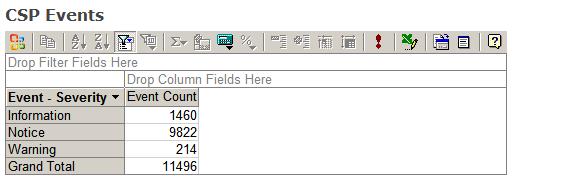
9 19. Once the Processing has completed, click close Topic 2: Verify the CSP Cubes In this exercise, you will configure verify that you are able to see CSP data 5 Minutes 1. On the Management Console Tool Bar, Click the Reports menu item, All Reports 2. Under Reports, Navigate through the tree to expand, IT Analytics. 3. Expand the Cubes folder 4. The CSP Cubes should be listed 5. Based on the CSP Assets Cube, Answer the Following Questions: a. How Many Hosts are there? b. How Many Operating Systems exist? c. How Many Agents exist? d. How Many CSP Managers exist? 6. Based on the CSP Events Cube, Answer the Following Questions: a. How Many Events are there? b. How Events were Warnings? Answers: 9 of 14
10 10 of 14


11 Lab Exercise 4: Key Performance Indicators (Optional) Configure a Key Performance Indicator for SEP In this exercise, you will create a Key Performance Indicator for SEP 10 Minutes 1. Select the SEP Clients Cube. 2. Click anywhere inside the cube to display the Field List. 3. Drag Client Count totals into the data pane. 4. Drag and drop the Client Firewall Status attribute into the rows pane. 11 of 14


12 5. Right click on the cell in the cube that represents the number of clients with their firewall enabled and select Use as KPI Value. 6. Right click on the cell in the cube that represents Grand Total and select Use as KPI Goal. 7. In the New Key Performance Indicator section, verify that KPI Value and KPI Goal are defined and that the type of goal is set to Dynamic. 12 of 14

13 8. Click the Create KPI button. 9. In the Key Performance Indicator Window type "Percent of SEP Clients with Firewall Enabled" in the KPI Name textbox. 10. Verify that the following boxes are correctly filled out: a. Database Name - This box should be the name of the Analysis Services database that IT Analytics Solution is configured to use. b. Cube Name - This box should already be set to the SEP Clients cube. c. Associated Measure Group - This box should already be set to Client. 13 of 14

14 d. Value Expression - This box should already be populated with the MDX code that represents the measure that was selected for the KPI Value. e. Goal Expression - This box should already be populated with the MDX code that represents the measure that was selected for the KPI Goal. 11. Under Status Expression select Percentage of Goal. 12. Under Status Graphic select Gauge Ascending. 13. Click the Save KPI button. 14. Verify the window returns and displays a message that the KPI has been saved successfully: 15. Click the Close button. 16. Click OK on the Windows Message box to reload the page. 17. Click the Key Performance Indicator item from the left tree navigation. 18. The new KPI should now display in the list with the current value and goal already defined. 14 of 14
UP L11 Using IT Analytics as an Alternative Reporting Platform Hands-On Lab
 UP L11 Using IT Analytics as an Alternative Reporting Platform Hands-On Lab Description IT Analytics has a diverse and powerful way of displaying data to your users. In this lab, you will learn how to
IS L02-MIGRATING TO SEP 12.1
 IS L02-MIGRATING TO SEP 12.1 Description Migrating to Symantec Endpoint Protection (SEP)? Want to upgrade to the latest SEP technology? In this Lab, see how to upgrade a multi-site Symantec Endpoint Protection
IC L17 Strategic Understanding using Symantec Protection Center Hands-On Lab
 IC L17 Strategic Understanding using Symantec Protection Center Hands-On Lab Description In this session, the attendee will have the opportunity to install SPC Enterprise, configure external data connections,
Hands-On Lab. Lab: Developing BI Applications. Lab version: Last updated: 2/23/2011
 Hands-On Lab Lab: Developing BI Applications Lab version: 1.0.0 Last updated: 2/23/2011 CONTENTS OVERVIEW... 3 EXERCISE 1: USING THE CHARTING WEB PARTS... 5 EXERCISE 2: PERFORMING ANALYSIS WITH EXCEL AND
UP L12: Still on SEP 11? Let us show you how to simplify migration to SEP.
 UP L12: Still on SEP 11? Let us show you how to simplify migration to SEP. Description Migrating to Symantec Endpoint Protection (SEP)? Want to upgrade to the latest SEP technology? In this Lab, see how
Excel Tables & PivotTables
 Excel Tables & PivotTables A PivotTable is a tool that is used to summarize and reorganize data from an Excel spreadsheet. PivotTables are very useful where there is a lot of data that to analyze. PivotTables
Customizing and Administering Project Server Access
 WEB Customizing and Administering Project Server Access In this chapter Creating and Deleting Users from Project Server 2 Managing User Groups Project Server User Security 4 Using Categories to Control
Introduction to Cognos Participants Guide. Table of Contents: Guided Instruction Overview of Welcome Screen 2
 IBM Cognos Analytics Welcome to Introduction to Cognos! Today s objectives include: Gain a Basic Understanding of Cognos View a Report Modify a Report View a Dashboard Request Access to Cognos Table of
Admissions & Intro to Report Editing Participants Guide
 IBM Cognos Analytics Admissions & Intro to Report Editing Participants Guide Welcome to Cognos - Admissions and Introduction to Report Editing! Today s objectives include: Gain a Basic Understanding of
Hands-On Lab. Developing BI Applications. Lab version: Last updated: 2/23/2011
 Hands-On Lab Developing BI Applications Lab version: 1.0.0 Last updated: 2/23/2011 CONTENTS OVERVIEW... 3 EXERCISE 1: USING THE CHART WEB PART... 4 Task 1 Add the Chart Web Part to the page... 4 Task 2
Getting Started With. A Step-by-Step Guide to Using WorldAPP Analytics to Analyze Survey Data, Create Charts, & Share Results Online
 Getting Started With A Step-by-Step Guide to Using WorldAPP Analytics to Analyze Survey, Create Charts, & Share Results Online Variables Crosstabs Charts PowerPoint Tables Introduction WorldAPP Analytics
[ Getting Started with Analyzer, Interactive Reports, and Dashboards ] ]
![[ Getting Started with Analyzer, Interactive Reports, and Dashboards ] ]](/thumbs/88/117545107.jpg "[ Getting Started with Analyzer, Interactive Reports, and Dashboards ] ]") Version 5.3 [ Getting Started with Analyzer, Interactive Reports, and Dashboards ] ] https://help.pentaho.com/draft_content/version_5.3 1/30 Copyright Page This document supports Pentaho Business Analytics
Version 5.3 [ Getting Started with Analyzer, Interactive Reports, and Dashboards ] ] https://help.pentaho.com/draft_content/version_5.3 1/30 Copyright Page This document supports Pentaho Business Analytics
File Name: Data File Pivot Tables 3 Hrs.xlsx
 File Name: Data File Pivot Tables 3 Hrs.xlsx Lab 1: Create Simple Pivot Table to Explore the Basics 1. Select the tab labeled Raw Data Start and explore the data. 2. Position the cursor in Cell A2. 3.
Maximo Self Service Center
 Maximo Self Service Center Once you have received an email regarding your registration approval, go to the following web address: https://maximo.mysodexo.com Log in to the Self Service Center: Your User
Implementing and Maintaining Microsoft SQL Server 2005 Analysis Services
 Implementing and Maintaining Microsoft SQL Server 2005 Analysis Services Introduction Elements of this syllabus are subject to change. This three-day instructor-led course teaches students how to implement
Lab - Remote Desktop in Windows 8
 Lab - Remote Desktop in Windows 8 Introduction In this lab, you will remotely connect to another Windows 8 computer. Recommended Equipment The following equipment is required for this exercise: Two Windows
Lab - Task Manager in Windows 7 and Vista
 Lab - Task Manager in Windows 7 and Vista Introduction In this lab, you will explore Task Manager and manage processes from within Task Manager. Recommended Equipment The following equipment is required
What s New in Cognos. Cognos Analytics Participant s Guide
 What s New in Cognos Cognos Analytics Participant s Guide Welcome to What s New in Cognos! Illinois State University has undergone a version upgrade of IBM Cognos to Cognos Analytics. All functionality
IT Essentials v6.0 Windows 10 Software Labs
 IT Essentials v6.0 Windows 10 Software Labs 5.2.1.7 Install Windows 10... 1 5.2.1.10 Check for Updates in Windows 10... 10 5.2.4.7 Create a Partition in Windows 10... 16 6.1.1.5 Task Manager in Windows
Lab - Task Manager in Windows 8
 Lab - Task Manager in Windows 8 Introduction In this lab, you will explore Task Manager and manage processes from within Task Manager. Recommended Equipment The following equipment is required for this
Quick Guide for Excel 2015 Data Management November 2015 Training:
 http://pfw.edu Quick Guide for Excel 2015 Data Management November 2015 Training: http://pfw.edu/training Excel 2016 Data Management AutoFill and Custom Lists AutoFill 1. Select the range that contains
Copyright 2012 Pulse Systems, Inc. Page 1 of 64
 The Pulse IQ data cubes in combination with Excel Pivot Tables provide an excellent resource for compiling and presenting information for the financial and appointment data housed in the PulsePro PRMS
Creating Basic Custom Monitoring Dashboards by
 Creating Basic Custom Monitoring Dashboards by Antonio Mangiacotti, Stefania Oliverio, Randy Allen & Lanny Short v1.2 1 Contents Contents... 2 Introduction... 3 ITM and DASH Configuration... 4 ITM TEPS
eschoolplus+ Cognos Query Studio Training Guide Version 2.4
 + Training Guide Version 2.4 May 2015 Arkansas Public School Computer Network This page was intentionally left blank Page 2 of 68 Table of Contents... 5 Accessing... 5 Working in Query Studio... 8 Query
IM L07 Configuring Enterprise Vault Data Classification Services
 IM L07 Configuring Enterprise Vault Data Classification Services Description This lab will enable you to configure Data Classification Services (DCS) to work with Enterprise Vault. See how DCS can help
Day 1 Agenda. Brio 101 Training. Course Presentation and Reference Material
 Data Warehouse www.rpi.edu/datawarehouse Brio 101 Training Course Presentation and Reference Material Day 1 Agenda Training Overview Data Warehouse and Business Intelligence Basics The Brio Environment
CalPlan. Creating a Unit Plan Navigating CalPlan Workbook 1/25/18
 CalPlan Creating a Unit Plan Workbook 1/25/18 Table of Contents Exercise 1: Log into the Workspace & Run a CalPlan Report... 3 Exercise 2: Launching CalPlan and Setting Your Entity... 10 Exercise 3: Actualized
The following instructions cover how to edit an existing report in IBM Cognos Analytics.
 IBM Cognos Analytics Edit a Report The following instructions cover how to edit an existing report in IBM Cognos Analytics. Navigate to Cognos Cognos Analytics supports all browsers with the exception
Budget Process Tools: Smart View Ad Hoc Basics
 Budget Process Tools: Smart View Ad Hoc Basics 2 6.21.17 CalPlan HCP (Human Capital Planning) CalRptg HCPRptg Smart View 1 Agenda 1 2 3 4 5 6 Smart View Ad Hoc Basics 1 Homework Review Creating Multiple
User Guide. Web Intelligence Rich Client. Business Objects 4.1
 User Guide Web Intelligence Rich Client Business Objects 4.1 2 P a g e Web Intelligence 4.1 User Guide Web Intelligence 4.1 User Guide Contents Getting Started in Web Intelligence 4.1... 5 Log into EDDIE...
EML10 Best Practces for Implementing Deployment Solution Hands-On Lab
 EML10 Best Practces for Implementing Deployment Solution Hands-On Lab Description This hands-on lab demonstrates the steps necessary to configure and use the latest version of Deployment Solution. You
Designing SQL Server 2012 Analysis Services Cubes using Samsclub_Star Dataset
 Designing SQL Server 2012 Analysis Services Cubes using Samsclub_Star Dataset Updated May 18, 2012 Edited by G. Davis (RMU) February 16, 2016 Using Microsoft s Business Intelligence Suite to Design Cubes
Quality Gates User guide
 Quality Gates 3.3.5 User guide 06/2013 1 Table of Content 1 - Introduction... 4 2 - Navigation... 5 2.1 Navigation tool bar... 5 2.2 Navigation tree... 5 2.3 Folder Tree... 6 2.4 Test history... 7 3 -
SPS Commerce Dashboards & Alerts User Guide
 SPS Commerce Dashboards & Alerts User Guide 1 Table of Contents Introduction... 3 Additional Resources... 3 Logging In... 4 Changing your password... 4 The Portal Homepage... 5 Administration... 5 My Reports...
Lab - Remote Desktop in Windows 7 and Vista
 Lab - Remote Desktop in Windows 7 and Vista Introduction In this lab, you will remotely connect to another Windows 7 or Vista computer. Recommended Equipment The following equipment is required for this
Query Studio Training Guide Cognos 8 February 2010 DRAFT. Arkansas Public School Computer Network 101 East Capitol, Suite 101 Little Rock, AR 72201
 Query Studio Training Guide Cognos 8 February 2010 DRAFT Arkansas Public School Computer Network 101 East Capitol, Suite 101 Little Rock, AR 72201 2 Table of Contents Accessing Cognos Query Studio... 5
HP ALM Overview. Exercise Outline. Administration and Customization Lab Guide
 HP ALM 11.00 Administration and Customization Lab Guide Overview This Lab Guide contains the exercises for Administration and Customization of HP ALM 11 Essentials training. The labs are designed to enhance
IC121-End-to-End Virtual Security Hands-On Lab
 IC121-End-to-End Virtual Security Hands-On Lab Description Many of us fear zero day exploits especially if they could impact our dynamic virtual systems. Learn how you can leverage CCS VSM to quickly lock
Mathematical Operators for Excel
 EXCEL ADVANCED 1 Mathematical Operators for Excel < > = >=
Policy Commander Console Guide - Published February, 2012
 Policy Commander Console Guide - Published February, 2012 This publication could include technical inaccuracies or typographical errors. Changes are periodically made to the information herein; these changes
SmartView. User Guide - Analysis. Version 2.0
 SmartView User Guide - Analysis Version 2.0 Table of Contents Page i Table of Contents Table Of Contents I Introduction 1 Dashboard Layouts 2 Dashboard Mode 2 Story Mode 3 Dashboard Controls 4 Dashboards
User Guide. Avery Dennison Web Ordering Solution for Steinmart
 User Guide Avery Dennison Web Ordering Solution for Steinmart March 2012 Copyright 2012 A very Dennison The information in this document is subject to change without notice and should not be construed
PM4 + Partners Knowledge Articles
 PM4 + Partners Knowledge Articles Customizing your PM4+ user experience r 1 November 30, 2108 PM4+ Partners Workspace - customize your experience Page 2 Contents Customizing Your Workspace... 1 Customizing
Dashboard 8.0. User Guide
 Dashboard 8.0 User Guide Table of Contents Dashboard User Reference Guide Table of Contents...2 Basic Navigation...3 Content Section...3 Filter Frame...4 Table Types...5 The Drilling Process...6 The Metric
Learn how to login to Sitefinity and what possible errors you can get if you do not have proper permissions.
 USER GUIDE This guide is intended for users of all levels of expertise. The guide describes in detail Sitefinity user interface - from logging to completing a project. Use it to learn how to create pages
Getting Started Guide. ProClarity Analytics Platform 6. ProClarity Professional
 ProClarity Analytics Platform 6 ProClarity Professional Note about printing this PDF manual: For best quality printing results, please print from the version 6.0 Adobe Reader. Getting Started Guide Acknowledgements
Implementing and Maintaining Microsoft SQL Server 2008 Analysis Services
 Course 6234A: Implementing and Maintaining Microsoft SQL Server 2008 Analysis Services Course Details Course Outline Module 1: Introduction to Microsoft SQL Server Analysis Services This module introduces
XLCubed Version 9 QuickStart
 XLCubed Version 9 QuickStart 1 P a g e Contents Welcome... 3 Connecting to your data... 3 XLCubed for Pivot Table users... 3 Adding a Grid, and the Report Designer... 5 Working with Grids... 7 Grid Components...
Microsoft Excel Pivot Tables
 Microsoft Excel Pivot Tables General instructions with exercises on BI4Dynamics data 1 1 PREFACE 3 1.1 How to use this document 3 1.2 BI4Dynamics 3 2 INTRODUCTION 4 2.1 Understanding dimensions and cubes
Filtering, Sorting and Ranking
 Filtering, Sorting and Ranking Content: THE PRINCIPLES FILTERING/RANKING/SORTING... 2 EXAMPLE... 3 Step 1: Simple Filtering... 3 Step 2: Sorting on a different dimension... 5 Step 3: Combining Ranking,
Installing SQL Server Developer Last updated 8/28/2010
 Installing SQL Server Developer Last updated 8/28/2010 1. Run Setup.Exe to start the setup of SQL Server 2008 Developer 2. On some OS installations (i.e. Windows 7) you will be prompted a reminder to install
CollabNet TeamForge 5.3 Evaluator s Guide
 CollabNet TeamForge 5.3 Evaluator s Guide Thank you for evaluating CollabNet TeamForge 5.3. This Evaluator s Guide will help you experience the key features of CollabNet TeamForge by walking you through
Crystal Reports Compiled by Christopher Dairion
 Crystal Reports Compiled by Christopher Dairion Not for customer distribution! When you install Crystal Reports 9, the Excel and Access Add-In are added automatically. A Crystal Report Wizard 9 menu option
DSS User Guide. End User Guide. - i -
 DSS User Guide End User Guide - i - DSS User Guide Table of Contents End User Guide... 1 Table of Contents... 2 Part 1: Getting Started... 1 How to Log in to the Web Portal... 1 How to Manage Account Settings...
Introduction to IBM Rational HATS For IBM System i (5250)
") Introduction to IBM Rational HATS For IBM System i (5250) Introduction to IBM Rational HATS 1 Lab instructions This lab teaches you how to use IBM Rational HATS to create a Web application capable of transforming
Introduction to IBM Rational HATS For IBM System i (5250) Introduction to IBM Rational HATS 1 Lab instructions This lab teaches you how to use IBM Rational HATS to create a Web application capable of transforming
Altiris IT Analytics Solution 7.1 from Symantec User Guide
 Altiris IT Analytics Solution 7.1 from Symantec User Guide Altiris IT Analytics Solution 7.1 from Symantec User Guide The software described in this book is furnished under a license agreement and may
SM L04 Veritas Operations Manager Advanced 4.0 RU1: Optimize Your Heterogeneous Storage Environment Hands-On Lab Description
 SM L04 Veritas Operations Manager Advanced 4.0 RU1: Optimize Your Heterogeneous Storage Environment Hands-On Lab Description Veritas Operations Manager Advanced (VOM Advanced) is a comprehensive discovery
Creating Automated Dashboard Excel 2013 Contents
 Creating Automated Dashboard Excel 2013 Contents Summarize Data Using Pivot Table... 2 Constructing Report Summary... 2 Create a PivotTable from worksheet data... 2 Add fields to a PivotTable... 2 Grouping
OBIEE. Oracle Business Intelligence Enterprise Edition. Rensselaer Business Intelligence Finance Author Training
 OBIEE Oracle Business Intelligence Enterprise Edition Rensselaer Business Intelligence Finance Author Training TABLE OF CONTENTS INTRODUCTION... 1 USER INTERFACE... 1 HOW TO LAUNCH OBIEE... 1 TERMINOLOGY...
Web-based Configuration. First, setup motion detection windows in the web-based configuration of the camera.
 How do I record motion using IP surveillance? To schedule video recording with motion detection, you must first enable this feature on the Internet camera. This can serve as a security device by recording
Patricia Andrada Quick Guide Excel 2010 Data Management-July 2011 Page 1
 Patricia Andrada Quick Guide Excel 2010 Data Management-July 2011 Page 1 Excel 2010 Data Management AutoFill and Custom Lists AutoFill 1. Select the range that contains the initial value(s) of the series
Pivots and Queries Intro
 Workshop: Pivots and Queries Intro An overview of the Pivot, Query and Alert functions in Multiview as a refresher for the experienced or new user, we will go over how to format an inquiry screen, create
Altiris IT Management Suite 7.1 from Symantec Enhanced Console Views Getting Started Guide. Version 7.1
 Altiris IT Management Suite 7.1 from Symantec Enhanced Console Views Getting Started Guide Version 7.1 Contents Section 1 Chapter 1 Altiris IT Management Suite 7.1 from Symantec Enhanced Console Views
Microsoft Excel Pivot Tables & Pivot Table Charts
 Microsoft Excel 2013 Pivot Tables & Pivot Table Charts A pivot table report allows you to analyze and summarize a million rows of data in Excel 2013 without entering a single formula. Pivot Tables let
Kaspersky Security Center Web-Console
 Kaspersky Security Center Web-Console User Guide CONTENTS ABOUT THIS GUIDE... 5 In this document... 5 Document conventions... 7 KASPERSKY SECURITY CENTER WEB-CONSOLE... 8 SOFTWARE REQUIREMENTS... 10 APPLICATION
IRA Basic Running Financial Reports
 IRA Basic Running Financial Reports Updated 6-7-2013 1 Training Index Part I Introduction to the IRA Reporting Tool IRA Resources (3) Logging onto the system (4) Navigating the Dashboard (5-9) Running
Market Insight Excelsior 2 Module Training Manual v2.0
 Market Insight Excelsior 2 Module Training Manual v2.0 Excelsior 2 Module Manual Version: 2.0 Software Release: Data Set: 2016 Q4 Training (US) Excel Version: Office 365 D&B Market Insight is powered by
End User Manual. December 2014 V1.0
 End User Manual December 2014 V1.0 Contents Getting Started... 4 How to Log into the Web Portal... 5 How to Manage Account Settings... 6 The Web Portal... 8 How to Upload Files in the Web Portal... 9 How
Institutional Reporting and Analysis (IRA) For help, blitz "Financial Reports", or
 For help, blitz Financial Reports, or") Institutional Reporting and Analysis (IRA) 1 Training Agenda Introduction to the IRA Reporting Tool Logging onto the system (4-5) Navigating the Dashboard (6-10) Running Reports (11-12) Working with Reports
Institutional Reporting and Analysis (IRA) 1 Training Agenda Introduction to the IRA Reporting Tool Logging onto the system (4-5) Navigating the Dashboard (6-10) Running Reports (11-12) Working with Reports
IBM DB2 Web Query for IBM i. Version 2 Release 2
 IBM DB2 Web Query for IBM i Version 2 Release 2 Active Technologies, EDA, EDA/SQL, FIDEL, FOCUS, Information Builders, the Information Builders logo, iway, iway Software, Parlay, PC/FOCUS, RStat, Table
Navigate to Cognos Cognos Analytics supports all browsers with the exception of Microsoft Edge.
 IBM Cognos Analytics Create a List The following instructions cover how to create a list report in IBM Cognos Analytics. A list is a report type in Cognos that displays a series of data columns listing
Using the Prime Performance Manager Web Interface
 3 CHAPTER Using the Prime Performance Manager Web Interface The following topics provide information about using the Cisco Prime Performance Manager web interface: Accessing the Prime Performance Manager
 Page 1 of 6 Procedures > Pages > Procedures Use -the-system > MI-generate-report MI - Generate Report I Like It Tags & Notes MI - Generate Report This is an explanation of how to access, view and filter
GETTING STARTED. A Step-by-Step Guide to Using MarketSight
 GETTING STARTED A Step-by-Step Guide to Using MarketSight Analyze any dataset Run crosstabs Test statistical significance Create charts and dashboards Share results online Introduction MarketSight is a
IC L19 - Consolidate Information from across your Infrastructure to create a custom report for PCI DSS Hands-On Lab
 IC L19 - Consolidate Information from across your Infrastructure to create a custom report for PCI DSS Hands-On Lab Description How to implement external data connectors for data relevant to PCI and map
Griffin Training Manual Grif-WebI Introduction (For Analysts)
") Griffin Training Manual Grif-WebI Introduction (For Analysts) Alumni Relations and Development The University of Chicago Table of Contents Chapter 1: Defining WebIntelligence... 1 Chapter 2: Working with
Griffin Training Manual Grif-WebI Introduction (For Analysts) Alumni Relations and Development The University of Chicago Table of Contents Chapter 1: Defining WebIntelligence... 1 Chapter 2: Working with
Point of Sale Analytics POS Analytics Website Guide
 Point of Sale Analytics POS Analytics Website Guide Retailers are counting on suppliers to understand and help manage their own products performance at the store level. To enable this, an increasing number
Cityworks Analytics By Azteca Systems Inc.
 Cityworks Analytics 2014 By Azteca Systems Inc. COPYRIGHT INFORMATION Copyright 2014 by Azteca Systems Inc. All rights reserved. Azteca Systems Inc. 11075 S. State St., Suite 24 Sandy, UT, 84070, U.S.A.
THE POWER OF PIVOT TABLES
 THE POWER OF PIVOT TABLES To fully understand the power of a PivotTable, one must first consider what is a PivotTable and what makes them powerful? Following are the main properties that define a Pivot
Excel Tips for Compensation Practitioners Weeks Pivot Tables
 Excel Tips for Compensation Practitioners Weeks 23-28 Pivot Tables Week 23 Creating a Pivot Table Pivot tables are one of the most amazing and powerful tools in Excel, but many users do not know how to
Immotec Systems, Inc. SQL Server 2008 Installation Document
 SQL Server Installation Guide 1. From the Visor 360 installation CD\USB Key, open the Access folder and install the Access Database Engine. 2. Open Visor 360 V2.0 folder and double click on Setup. Visor
Adobe Marketing Cloud Report Builder
 Adobe Marketing Cloud Report Builder Contents Adobe Report Builder Help...6 What's New in Report Builder...7 Report Builder 5.6...7 Report Builder 5.5...7 Report Builder 5.4...7 Report Builder 5.3...8
User Guide. Version Exago Inc. All rights reserved.
 User Guide Version 2016.2 2016 Exago Inc. All rights reserved. Exago Reporting is a registered trademark of Exago, Inc. Windows is a registered trademark of Microsoft Corporation in the United States and
Primo Analytics Workshop. BIBSYS Konferansen 20 March 2018
 Primo Analytics Workshop BIBSYS Konferansen 20 March 2018 Objectives By the end of this session, you will: Understand what is Primo Analytics and OBI. Have a high-level view of how Primo Analytics is working.
Introduction & Navigation
 Introduction & Navigation Logging In to Marketing Cloud 1. Open a tab in either the Chrome or Firefox web browser. 2. Place your cursor in the URL bar then type mc.exacttarget.com. 3. Strike the Enter
Pivot Tables, Lookup Tables and Scenarios
 Introduction Format and manipulate data using pivot tables. Using a grading sheet as and example you will be shown how to set up and use lookup tables and scenarios. Contents Introduction Contents Pivot
User Guide. v7.5. September 4, For the most recent version of this document, visit kcura's Documentation Site.
 User Guide v7.5 September 4, 2013 For the most recent version of this document, visit kcura's Documentation Site. Table of Contents 1 User guide overview 4 2 Relativity objects 4 3 Workspace 6 3.1 Workspaces
2015 Arkansas Department of Education Data & Reporting Conference. Cognos Query Studio
 2015 Arkansas Department of Education Data & Reporting Conference Cognos Query Studio SMS Workshop August 7, 2015 Arkansas Public School Computer Network CREATING REPORTS USED TO GENERATE DATA FILES 1.
SAS Job Monitor 2.2. About SAS Job Monitor. Overview. SAS Job Monitor for SAS Data Integration Studio
 SAS Job Monitor 2.2 About SAS Job Monitor Overview SAS Job Monitor is a component of SAS Environment Manager that integrates information from SAS Data Integration Studio, DataFlux Data Management Server,
Microsoft Excel Pivot Tables & Pivot Table Charts
 Microsoft Excel 2007 Pivot Tables & Pivot Table Charts A pivot table report allows you to analyze and summarize a million rows of data in Excel 2007 without entering a single formula. Pivot Tables let
CCRS Quick Start Guide for Program Administrators. September Bank Handlowy w Warszawie S.A.
 CCRS Quick Start Guide for Program Administrators September 2017 www.citihandlowy.pl Bank Handlowy w Warszawie S.A. CitiManager Quick Start Guide for Program Administrators Table of Contents Table of Contents
FileZilla FTP Instructions. FileZilla FTP Instructions
 FileZilla FTP Instructions 1 EMS FileZilla FTP Instructions 1, FileZilla Installation 2, Opening FileZilla 3, FileZilla Settings 4, Downloading Your Website 5, Uploading Your Website 6, More Help EMS Internet
Using the IMS Universal Drivers and QMF to Access Your IMS Data Hands-on Lab
 Using the IMS Universal Drivers and QMF to Access Your IMS Data Hands-on Lab 1 Overview QMF for Workstation is an Eclipse-based, rich client desktop Java application, that uses JDBC to connect to data
Web Console Setup & User Guide. Version 7.1
 Web Console Setup & User Guide Version 7.1 1 Contents Page Number Chapter 1 - Installation and Access 3 Server Setup Client Setup Windows Client Setup Mac Client Setup Linux Client Setup Interoperation
SPARK. User Manual Ver ITLAQ Technologies
 SPARK Forms Builder for Office 365 User Manual Ver. 3.5.50.102 0 ITLAQ Technologies www.itlaq.com Table of Contents 1 The Form Designer Workspace... 3 1.1 Form Toolbox... 3 1.1.1 Hiding/ Unhiding/ Minimizing
Business Insight Authoring
 Business Insight Authoring Getting Started Guide ImageNow Version: 6.7.x Written by: Product Documentation, R&D Date: August 2016 2014 Perceptive Software. All rights reserved CaptureNow, ImageNow, Interact,
User Manual instantolap
 User Manual instantolap Version 2.7.0 15.12.2010 Page 2 / 213 instantolap User Manual 2.7.0 instantolap User Manual 2.7.0 Page 3 / 213 Copyright Copyright (C) 2002-2010 Thomas Behrends Softwareentwicklung
Integrate Sophos Enterprise Console. EventTracker v8.x and above
 Integrate Sophos Enterprise Console EventTracker v8.x and above Publication Date: September 22, 2017 Abstract This guide provides instructions to configure Sophos Enterprise Console to send the events
Azure 209x Practical Exercises Overview
 Azure 209x Practical Exercises Overview This course includes optional exercises where you can try out the techniques demonstrated in the course for yourself. This guide lists the steps for the individual
IBM Infrastructure Suite for z/vm and Linux: Introduction IBM Tivoli OMEGAMON XE on z/vm and Linux
 IBM Infrastructure Suite for z/vm and Linux: Introduction IBM Tivoli OMEGAMON XE on z/vm and Linux August/September 2015 Please Note IBM s statements regarding its plans, directions, and intent are subject