Contents. The basics. Filling Cells A cell can contain: Text, Numbers or formulas
|
|
|
- John Young
- 5 years ago
- Views:
Transcription

1 Contents The basics... 1 Filling Cells... 1 Basic Equations... 1 Equation Priorities... 1 Range Formulas... 2 Logical Operators... 2 Conditions (IF)... 2 Formatting cells... 3 Conditional Formatting... 3 Building Charts... 9 Quick Customization Databases in Excel Creating a Pivot Chart The basics Filling Cells A cell can contain: Text, Numbers or formulas Basic Equations Addition: = A1 + B1 Multiplication: = A1 * B1 Subtraction: = A1 B1 Division: = A1 / B1 Exponent: = A1 ^ 2 Equation Priorities ^, * and / have precedence over + and -. This is why you need to use () to prioritize specific parts of the equation over other: = (A1 + B1) * 2
2 Range Formulas Sum: = sum(a1:a100) Average: =average(a1:b10) Maximum: =max(a1:c10) Minimum: =min(a1:c10) Standard Deviation: StDev(A1:A10) Number of cells containing numeric values: Count(A1:A100) Number of non-empty cells (cells containing numbers or strings): CountA(A1:A9) Logical Operators Equal: = Greater than: > Smaller than: < Greater or equal: >= Smaller or equal: <= Different than: <> And (both equations should be true): AND(A1>10,B1>10) Or (one or both equations are true): OR(A1>10,B1>10) Conditions (IF) Syntax: = IF ( condition, do if true, do if false ) Example: IF A1 is equal or greater than 10, put the word success in the cell, if not, put the word fail : = IF(A1>=10, success, fail ) IF A1 is greater than 1000, subtract 10% from A1 and place it in this cell, else copy A1 in this cell: =IF(A1>1000,A1*90%,A1) You can also use: =IF(A1>1000,A1-10%*A1,A1) Or: IF(A1>1000,A1-0.1*A1,A1) Copying cells and formulas: Naming cells Define name for a cell or a range of cells


3 Double click to insert the name (or type it) Name manager Formatting cells Conditional Formatting Data Bars


4 Color Scales Value = Shade Icons (Directional) icons (shapes and indicators)
5 icons (ratings) Customized rules Creating 2 simples rules : Less than 5 in green More than 5 in red


6 Tops Above and below average


7 Managing rules Removing all rules


8 Advanced Rules


9 Building Charts

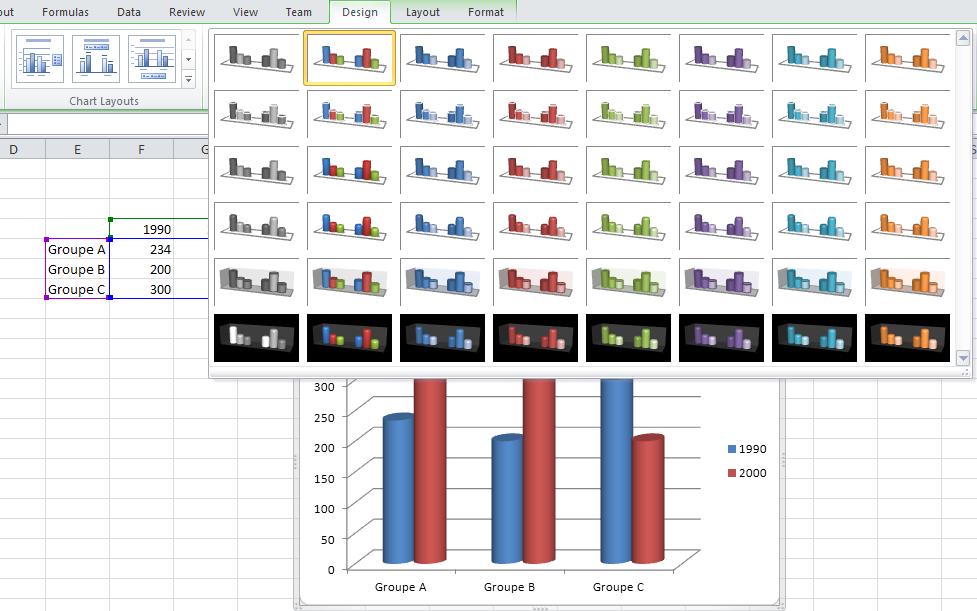
10 Quick Customization Colors Layout


11 Switch Row/Column


12 Advanced Customization 2 separated clicks on any title to change it one click on any column select the series for this column


13

14 Fill and Transparency Solid Fill Gradient Fill


15 Texture Fill Image Fill use stack, stretch or scale to optimize your layout (scale is linked to the units on the Y axis). Border Color and Styles Picture with no fill and large blue border
.")
16 3D and Special Effects Modifying only one column Click on a column (selects the whole series). Click again (Select one column from the series).


17 Pie Slices Click on a slice twice to select the slice only (not the whole pie) and move the slice to separate it from the other slices. More Customization
, place the cursor in A1 and filter the table.")


18 Databases in Excel Creating databases in Excel is fairly easy, just fill in a table (see screenshot), place the cursor in A1 and filter the table. When you do this, a dropdown arrow will appear next to each column title. Filtering values You can at any moment filter values in one or more column. In the example below, we are deciding to show sales of Davolio and Dodsworth only. All other rows will be hidden (and made visible back again when we release the filter).


19 Note the rows in blue and the filter symbol next to the salesperson title to show that data is being filter. Releasing filters When a filter is no longer needed, you can release it using the clear filter option in the filter dropdown. Another option is to select all from the same dropdown.


20 Combining Filters You can combine one or more filters. For example, if we need to show only sales in the USA for Davolio and Dodsworth, we could apply another filter, this time for the country column: Advanced filters So far, we have seen filters based on a value. What if we need names starting with D or orders above $2,000? This can be done using text or number filters:


21 Note other filter types: contains, does not contain, ends with, etc. The same applies to numbers columns to which more options are available like top 10, above average, between, etc. Custom Filters You can also apply two filters to the same column using Sorting columns It is often useful to sort data in columns: alphabetical order, from smallest to largest number, etc. This can also be done using the filter dropdown. Note the sort smallest to largest in the picture above. Note you can sort on more than one column:
. Notice that an arrow will appear next to the dropdown of any filtered column.")
. For a better view, you can group rows and hide details by clicking on the 2 or 1 signs.")
22 In the screenshot above, columns are sorted by country first and, in each country, salespersons are sorted in alphabetical order. Sorting is useful to calculating subtotals (next section). Notice that an arrow will appear next to the dropdown of any filtered column. Calculating Subtotals Using the subtotals button from the Data tab, we can (for example) sum all the orders by country: An outline section will appear on the left with numbers (1,2,3). For a better view, you can group rows and hide details by clicking on the 2 or 1 signs. You can also group individual countries using the - and + signs in the outline section.


23 Removing Subtotals Note the Remove All button. Grouping Grouping can be useful to hide and show a group of columns or rows. After grouping, you will be able to expand or collapse the group using the + and - buttons:

: Pivot Tables")
24 The ungroup button cancels the grouping. Removing Duplicates Sometimes, redundant data may be entered by mistake or unnecessary. In Excel, you can remove this redundant data based on all or some of the fields (you may need to remove all USA entries except for the first one, or remove all entries that are exactly similar on all fields): Pivot Tables Pivot tables help you analyze your data without going through manual and complex calculations:


25 We are going to insert a pivot table in a new worksheet. After that, it is mostly a matter of dragging and droping:
.")

26 The above shows the total of sales per country (note that you can change the title Row Labels manually from the formula bar). The following is slightly more complex, showing the sales by person with an optional filter by country: Note that you can sort the amounts using the pivot table options toolbar:
.")
: Grouping in Pivot Table You can group dates by months, quarters,")
27 You can also filter data (in case you don t want your report to include sales for one or more person). This can be done by clicking on the small arrow to the right of a select field (in this case, salesperson ): Grouping in Pivot Table You can group dates by months, quarters, year, etc. First of all, create a simple pivot table for sales per month:


28 Click on Order Date, Go to PivotTable Tools > Options, and choose Group > Group Field. Select Quarter.


29 Comparing Data Sometimes you ll need to compare values of the same column. This can be done using the Value Field Settings. Right click on a field to access the contextual menu:


30 Adding Calculated Fields It is often useful to add special calculations and formulas to your pivot table. This can be done from the Pivot Table Tools > Options Toolbar > Fields, Items & Sets. Creating a Pivot Chart


31 Freeze Panes Hide to unhide, select surrounding columns or rows and unhide.


32 Protect a Sheet Protect a sheet except for specified cells Right click on the cell, format cells, clear the Locked check box. Protect the worksheet
Excel 2007 New Features Table of Contents
 Table of Contents Excel 2007 New Interface... 1 Quick Access Toolbar... 1 Minimizing the Ribbon... 1 The Office Button... 2 Format as Table Filters and Sorting... 2 Table Tools... 4 Filtering Data... 4
Starting Excel application
 MICROSOFT EXCEL 1 2 Microsoft Excel: is a special office program used to apply mathematical operations according to reading a cell automatically, just click on it. It is called electronic tables Starting
Excel 2013 Intermediate
 Excel 2013 Intermediate Quick Access Toolbar... 1 Customizing Excel... 2 Keyboard Shortcuts... 2 Navigating the Spreadsheet... 2 Status Bar... 3 Worksheets... 3 Group Column/Row Adjusments... 4 Hiding
Using Tables, Sparklines and Conditional Formatting. Module 5. Adobe Captivate Wednesday, May 11, 2016
 Slide 1 - Using Tables, Sparklines and Conditional Formatting Using Tables, Sparklines and Conditional Formatting Module 5 Page 1 of 27 Slide 2 - Lesson Objectives Lesson Objectives Explore the find and
COURSE CONTENT EXCEL BASIC ONE DAY
 COURSE CONTENT EXCEL BASIC ONE DAY SOME OF THE BENEFITS OF USING A SPREADSHEET STARTING EXCEL GETTING YOURSELF ORIENTATED WITH THE EXCEL SCREEN THE OFFICE BUTTON/FILE TAB THE TITLE BAR THE RIBBONS GROUPS
Creating Automated Dashboard Excel 2013 Contents
 Creating Automated Dashboard Excel 2013 Contents Summarize Data Using Pivot Table... 2 Constructing Report Summary... 2 Create a PivotTable from worksheet data... 2 Add fields to a PivotTable... 2 Grouping
Microsoft Excel 2010 Tutorial
 1 Microsoft Excel 2010 Tutorial Excel is a spreadsheet program in the Microsoft Office system. You can use Excel to create and format workbooks (a collection of spreadsheets) in order to analyze data and
Tutorial 5: Working with Excel Tables, PivotTables, and PivotCharts. Microsoft Excel 2013 Enhanced
 Tutorial 5: Working with Excel Tables, PivotTables, and PivotCharts Microsoft Excel 2013 Enhanced Objectives Explore a structured range of data Freeze rows and columns Plan and create an Excel table Rename
Excel Tables & PivotTables
 Excel Tables & PivotTables A PivotTable is a tool that is used to summarize and reorganize data from an Excel spreadsheet. PivotTables are very useful where there is a lot of data that to analyze. PivotTables
Excel Level 1
 Excel 2016 - Level 1 Tell Me Assistant The Tell Me Assistant, which is new to all Office 2016 applications, allows users to search words, or phrases, about what they want to do in Excel. The Tell Me Assistant
EXCEL 2003 DISCLAIMER:
 EXCEL 2003 DISCLAIMER: This reference guide is meant for experienced Microsoft Excel users. It provides a list of quick tips and shortcuts for familiar features. This guide does NOT replace training or
Data Should Not be a Four Letter Word Microsoft Excel QUICK TOUR
 Toolbar Tour AutoSum + more functions Chart Wizard Currency, Percent, Comma Style Increase-Decrease Decimal Name Box Chart Wizard QUICK TOUR Name Box AutoSum Numeric Style Chart Wizard Formula Bar Active
Quick Guide for Excel 2015 Data Management November 2015 Training:
 http://pfw.edu Quick Guide for Excel 2015 Data Management November 2015 Training: http://pfw.edu/training Excel 2016 Data Management AutoFill and Custom Lists AutoFill 1. Select the range that contains
The Menu and Toolbar in Excel (see below) look much like the Word tools and most of the tools behave as you would expect.
 look much like the Word tools and most of the tools behave as you would expect.") Launch the Microsoft Excel Program Click on the program icon in Launcher or the Microsoft Office Shortcut Bar. A worksheet is a grid, made up of columns, which are lettered and rows, and are numbered.
Launch the Microsoft Excel Program Click on the program icon in Launcher or the Microsoft Office Shortcut Bar. A worksheet is a grid, made up of columns, which are lettered and rows, and are numbered.
DESCRIPTION 1 TO DEFINE A NAME 2. USING RANGE NAMES 2 Functions 4 THE IF FUNCTION 4 THE VLOOKUP FUNCTION 5 THE HLOOKUP FUNCTION 6
 Table of contents The use of range names 1 DESCRIPTION 1 TO DEFINE A NAME 2 USING RANGE NAMES 2 Functions 4 THE IF FUNCTION 4 THE VLOOKUP FUNCTION 5 THE HLOOKUP FUNCTION 6 THE ROUND FUNCTION 7 THE SUMIF
Excel Tables and Pivot Tables
 A) Why use a table in the first place a. Easy to filter and sort if you only sort or filter by one item b. Automatically fills formulas down c. Can easily add a totals row d. Easy formatting with preformatted
Excel 2013 PivotTables and PivotCharts
 Excel 2013 PivotTables and PivotCharts PivotTables... 1 PivotTable Wizard... 1 Creating a PivotTable... 2 Groups... 2 Rows Group... 3 Values Group... 3 Columns Group... 4 Filters Group... 5 Field Settings...
Tips & Tricks: MS Excel
 Tips & Tricks: MS Excel 080501.2319 Table of Contents Navigation and References... 3 Layout... 3 Working with Numbers... 5 Power Features... 7 From ACS to Excel and Back... 8 Teacher Notes: Test examples
2013 ADVANCED MANUAL
 2013 ADVANCED MANUAL C B C H O U S E 2 4 C A N N I N G S T R E E T E D I N B U R G H E H 3 8 E G 0 1 3 1 2 7 2 2 7 9 0 W W W. I T R A I N S C O T L A N D. C O. U K I N F O @ I T R A I N S C O T L A N D.
1. What is a PivotTable? What is a Cross Tab Report?
 Data Analysis & Business Intelligence Made Easy with Excel Power Tools Excel Data Analysis Basics = E-DAB Notes for Video: E-DAB-04: Summary Reports with Standard PivotTables & Slicers Objectives of Video:
2013 INTERMEDIATE MANUAL
 C B C H O U S E 2 4 C A N N I N G S T R E E T E D I N B U R G H E H 3 8 E G 0 1 3 1 2 7 2 2 7 9 0 W W W. I T R A I N S C O T L A N D. C O. U K I N F O @ I T R A I N S C O T L A N D. C O. U K CONTENTS CHAPTER
New Perspectives on Microsoft Excel Module 5: Working with Excel Tables, PivotTables, and PivotCharts
 New Perspectives on Microsoft Excel 2016 Module 5: Working with Excel Tables, PivotTables, and PivotCharts Objectives, Part 1 Explore a structured range of data Freeze rows and columns Plan and create
File Name: Pivot Table Labs.xlsx
 File Name: Pivot Table Labs.xlsx Lab Session 1: Create Simple Pivot Table with a Date Grouping Note: Instructions for the first lab are very detailed because it might be the first time you have created
ABOUT PIVOTTABLES TABLE OF CONTENTS
 University of Southern California Academic Information Services Excel 2007 - PivotTables ABOUT PIVOTTABLES PivotTables provide an excellent means of analyzing data stored in database format by rearranging
ADD A 3-D PIE CHART TO THE WORKBOOK
 ADD A 3-D PIE CHART TO THE WORKBOOK A pie chart is an easy way to show the relationship of items to the whole. In this exercise, you will be creating a Pie Chart that will show the relationship between
Microsoft Office Excel 2010: Basic. Course Overview. Course Length: 1 Day. Course Overview
 Microsoft Office Excel 2010: Basic Course Length: 1 Day Course Overview This course teaches the basic functions and features of Excel 2010. After an introduction to spreadsheet terminology and Excel's
Excel Foundation Quick Reference (Windows PC)
") Excel Foundation Quick Reference (Windows PC) See https://staff.brighton.ac.uk/is/training/pages/excel/foundation.aspx for videos and exercises to accompany this quick reference card. Structure of a spreadsheet
Excel Foundation Quick Reference (Windows PC) See https://staff.brighton.ac.uk/is/training/pages/excel/foundation.aspx for videos and exercises to accompany this quick reference card. Structure of a spreadsheet
2) Excel Basics 5: Power of PivotTables to Create Reports with Various Calculations & Layouts. Page 1 of 21
 Excel Basics 5: Power of PivotTables to Create Reports with Various Calculations & Layouts. Page 1 of 21") Office 2016 Excel Basics 20 Video/Class Project #32 Excel Basics 20: PivotTable Power: 14 Amazing PivotTable Reporting Tricks from Slicers to Show Values As! Goal in video # 20: Learn about how to create
Office 2016 Excel Basics 20 Video/Class Project #32 Excel Basics 20: PivotTable Power: 14 Amazing PivotTable Reporting Tricks from Slicers to Show Values As! Goal in video # 20: Learn about how to create
Pivot Tables in Excel Contents. Updated 5/19/2016
 Pivot Tables in Excel 2010 Updated 5/19/2016 Contents Setup a Pivot Table in Excel 2010... 2 General Field List Features... 4 Summing and Counting Together... 6 Grouping Date Data... 7 Grouping Non-Date
Table of Contents. 1. Creating a Microsoft Excel Workbook...1 EVALUATION COPY
 Table of Contents Table of Contents 1. Creating a Microsoft Excel Workbook...1 Starting Microsoft Excel...1 Creating a Workbook...2 Saving a Workbook...3 The Status Bar...5 Adding and Deleting Worksheets...6
Creating a Pivot Table
 Contents Introduction... 1 Creating a Pivot Table... 1 A One-Dimensional Table... 2 A Two-Dimensional Table... 4 A Three-Dimensional Table... 5 Hiding and Showing Summary Values... 5 Adding New Data and
Contents. Group 2 Excel Handouts 2010
 Contents Styles... 2 Conditional Formatting... 2 Create a New Rule... 4 Format as Table... 5 Create your own New Table Style... 8 Cell Styles... 9 New Cell Style... 10 Merge Styles... 10 Sparklines...
Formulas, LookUp Tables and PivotTables Prepared for Aero Controlex
 Basic Topics: Formulas, LookUp Tables and PivotTables Prepared for Aero Controlex Review ribbon terminology such as tabs, groups and commands Navigate a worksheet, workbook, and multiple workbooks Prepare
EXCEL Using Excel for Data Query & Management. Information Technology. MS Office Excel 2007 Users Guide. IT Training & Development
 Information Technology MS Office Excel 2007 Users Guide EXCEL 2007 Using Excel for Data Query & Management IT Training & Development (818) 677-1700 Training@csun.edu TABLE OF CONTENTS Introduction... 1
Microsoft Excel Microsoft Excel
 Excel 101 Microsoft Excel is a spreadsheet program that can be used to organize data, perform calculations, and create charts and graphs. Spreadsheets or graphs created with Microsoft Excel can be imported
Quick Reference Summary
 Microsoft Excel 2010 Quick Reference Summary Microsoft Excel 2010 Quick Reference Summary 3-D Chart, Rotate EX 462 3-D Rotation button (Chart Tools Layout tab Background, change rotation (Format Chart
MICROSOFT EXCEL Working with Charts
 MICROSOFT EXCEL 2010 Working with Charts Introduction to charts WORKING WITH CHARTS Charts basically represent your data graphically. The data here refers to numbers. In Excel, you have various types of
Review Ch. 15 Spreadsheet and Worksheet Basics. 2010, 2006 South-Western, Cengage Learning
 Review Ch. 15 Spreadsheet and Worksheet Basics 2010, 2006 South-Western, Cengage Learning Excel Worksheet Slide 2 Move Around a Worksheet Use the mouse and scroll bars Use and (or TAB) Use PAGE UP and
Application of Skills: Microsoft Excel 2013 Tutorial
 Application of Skills: Microsoft Excel 2013 Tutorial Throughout this module, you will progress through a series of steps to create a spreadsheet for sales of a club or organization. You will continue to
Creating a Spreadsheet by Using Excel
 The Excel window...40 Viewing worksheets...41 Entering data...41 Change the cell data format...42 Select cells...42 Move or copy cells...43 Delete or clear cells...43 Enter a series...44 Find or replace
Intermediate Excel 2016
 Intermediate Excel 2016 Relative & Absolute Referencing Relative Referencing When you copy a formula to another cell, Excel automatically adjusts the cell reference to refer to different cells relative
1. Math symbols Operation Symbol Example Order
 Excel 2 Microsoft Excel 2013 Mercer County Library System Brian M. Hughes, County Executive Excel s Order of Calculation 1. Math symbols Operation Symbol Example Order Parentheses ( ) =(4+2)*8 1st Exponents
Spreadsheet Concepts: Creating Charts in Microsoft Excel
 Spreadsheet Concepts: Creating Charts in Microsoft Excel lab 6 Objectives: Upon successful completion of Lab 6, you will be able to Create a simple chart on a separate chart sheet and embed it in the worksheet
Patricia Andrada Quick Guide Excel 2010 Data Management-July 2011 Page 1
 Patricia Andrada Quick Guide Excel 2010 Data Management-July 2011 Page 1 Excel 2010 Data Management AutoFill and Custom Lists AutoFill 1. Select the range that contains the initial value(s) of the series
EXCEL 2007 TIP SHEET. Dialog Box Launcher these allow you to access additional features associated with a specific Group of buttons within a Ribbon.
 EXCEL 2007 TIP SHEET GLOSSARY AutoSum a function in Excel that adds the contents of a specified range of Cells; the AutoSum button appears on the Home ribbon as a. Dialog Box Launcher these allow you to
Excel Intermediate. Click in the name column of our Range of Data. (Do not highlight the column) Click on the Data Tab in the Ribbon
 Click on the Data Tab in the Ribbon") Custom Sorting and Subtotaling Excel Intermediate Excel allows us to sort data whether it is alphabetic or numeric. Simply clicking within a column or row of data will begin the process. Click in the name
Custom Sorting and Subtotaling Excel Intermediate Excel allows us to sort data whether it is alphabetic or numeric. Simply clicking within a column or row of data will begin the process. Click in the name
INTRODUCTION... 1 UNDERSTANDING CELLS... 2 CELL CONTENT... 4
 Introduction to Microsoft Excel 2016 INTRODUCTION... 1 The Excel 2016 Environment... 1 Worksheet Views... 2 UNDERSTANDING CELLS... 2 Select a Cell Range... 3 CELL CONTENT... 4 Enter and Edit Data... 4
Introduction to the workbook environment
 L E S S O N 7 Introduction to the workbook environment Lesson objectives Suggested teaching time To begin using the three-dimensional aspect of the Excel workbook, you will: 60-70 minutes a b c d Work
Microsoft Excel > Shortcut Keys > Shortcuts
 Microsoft Excel > Shortcut Keys > Shortcuts Function Keys F1 Displays the Office Assistant or (Help > Microsoft Excel Help) F2 Edits the active cell, putting the cursor at the end* F3 Displays the (Insert
Part I - WORKING WITH ABSOLUTE REFERENCES
 INTRODUCTION TO COMPUTER CONCEPTS CSIT 100 LAB: MORE WORK with MS EXCEL Part I - WORKING WITH ABSOLUTE REFERENCES This is an implementation of a spreadsheet program. It contains 1,048,576 rows, and 16,384
Microsoft Office Excel
 Microsoft Office 2007 - Excel Help Click on the Microsoft Office Excel Help button in the top right corner. Type the desired word in the search box and then press the Enter key. Choose the desired topic
Basic tasks in Excel 2013
 Basic tasks in Excel 2013 Excel is an incredibly powerful tool for getting meaning out of vast amounts of data. But it also works really well for simple calculations and tracking almost any kind of information.
Workbooks & Worksheets. Getting Started. Formatting. Formulas & Functions
 1 Getting Started Cells Workbooks & Worksheets Formatting Formulas & Functions Chart Printing 2 Getting Started Start a spreadsheet program Recognize the spreadsheet screen layout Use the ribbon,quick
Cheltenham Courseware Microsoft Excel 2007 Intermediate Level
 Cheltenham Courseware www.cheltenhamcourseware.com Microsoft Excel 2007 Intermediate Level Excel 2007 Intermediate - Page 2 1995-2008 Cheltenham Courseware Pty. Ltd. All trademarks acknowledged. E&OE.
CHAPTER TWO: SPREADS HEETS WITH EXCEL 1
 CHAPTER TWO: SPREADS HEETS WITH EXCEL 1 CHAPTER 2 SPREADSHEETS WITH EXCEL TOPIC Create Pivot Tables Create and Modify Charts Sort and Filter CHAPTER TWO: SPREADS HEETS WITH EXCEL 2 CREATE AND MODIFY CHARTS
Excel Tutorials - File Size & Duration
 Get Familiar with Excel 46.30 2.96 The Excel Environment 4.10 0.17 Quick Access Toolbar 3.10 0.26 Excel Ribbon 3.10 0.26 File Tab 3.10 0.32 Home Tab 5.10 0.16 Insert Tab 3.10 0.16 Page Layout Tab 3.10
Formatting Spreadsheets in Microsoft Excel
 Formatting Spreadsheets in Microsoft Excel This document provides information regarding the formatting options available in Microsoft Excel 2010. Overview of Excel Microsoft Excel 2010 is a powerful tool
1. Managing Information in Table
 1. Managing Information in Table Spreadsheets are great for making lists (such as phone lists, client lists). The researchers discovered that not only was list management the number one spreadsheet activity,
Microsoft Excel 2013/2016 Pivot Tables
 Microsoft Excel 2013/2016 Pivot Tables Creating PivotTables PivotTables are powerful data analysis tools. They let you summarize data in various ways and instantly change the view you use. A PivotTable
GO! with Microsoft Excel 2016 Comprehensive
 GO! with Microsoft Excel 2016 Comprehensive First Edition Chapter 7 Creating PivotTables and PivotCharts Learning Objectives Create a PivotTable Report Use Slicers and Search Filters Modify a PivotTable
M i c r o s o f t E x c e l A d v a n c e d. Microsoft Excel 2010 Advanced
 Microsoft Excel 2010 Advanced 0 Working with Rows, Columns, Formulas and Charts Formulas A formula is an equation that performs a calculation. Like a calculator, Excel can execute formulas that add, subtract,
File Name: Data File Pivot Tables 3 Hrs.xlsx
 File Name: Data File Pivot Tables 3 Hrs.xlsx Lab 1: Create Simple Pivot Table to Explore the Basics 1. Select the tab labeled Raw Data Start and explore the data. 2. Position the cursor in Cell A2. 3.
How to insert table in Excel?
 What is Table in Excel? Tables allow you to analyze your data in Excel quickly and easily. How to insert table in Excel? To insert a table, execute the following steps. 1. Click any single cell inside
Excel. Excel Options click the Microsoft Office Button. Go to Excel Options
 Excel Excel Options click the Microsoft Office Button. Go to Excel Options Templates click the Microsoft Office Button. Go to New Installed Templates Exercise 1: Enter text 1. Open a blank spreadsheet.
The HOME Tab: Cut Copy Vertical Alignments
 The HOME Tab: Cut Copy Vertical Alignments Text Direction Wrap Text Paste Format Painter Borders Cell Color Text Color Horizontal Alignments Merge and Center Highlighting a cell, a column, a row, or the
Microsoft Office Excel 2007: Basic. Course Overview. Course Length: 1 Day. Course Overview
 Microsoft Office Excel 2007: Basic Course Length: 1 Day Course Overview This course teaches the basic functions and features of Excel 2007. After an introduction to spreadsheet terminology and Excel's
European Computer Driving Licence. Advanced Spreadsheet Software BCS ITQ Level 3. Syllabus Version 2.0
 ECDL Advanced European Computer Driving Licence Advanced Spreadsheet Software BCS ITQ Level 3 Using Microsoft Excel 2010 Syllabus Version 2.0 This training, which has been approved by BCS, The Chartered
WHY USE EXCEL? KEY EXCEL TERMINOLOGY
 WHY USE EXCEL? Excel allows users to organize, format, and calculate data with formulas using a spreadsheet system broken up by rows and columns. Excel allows us the ability to create templates with multiple
Getting Started Guide
 Getting Started Guide Sage MAS Intelligence 90/200 Table of Contents Getting Started Guide... 1 Login Properties... 1 Standard Reports Available... 2 Financial Report... 2 Financial Trend Analysis... 3
Excel 2010 Tutorials - Video File Attributes
 Get Familiar with Excel 2010 42.30 2.70 The Excel 2010 Environment 4.10 0.18 Quick Access Toolbar 3.10 0.27 Excel 2010 Ribbon 3.10 0.26 File Tab 3.10 0.28 Home Tab 5.10 0.17 Insert Tab 3.10 0.18 Page Layout
To complete this workbook, you will need the following file:
 CHAPTER 4 Excel More Skills 13 Create PivotTable Reports A PivotTable report is an interactive, cross-tabulated Excel report used to summarize and analyze data. PivotTable reports are used to ask questions
Copyright & License Notes 3 Introduction 13 Chapter 1 - Excel Basics 14. Chapter 2 - Working with Data 32
 TABLE OF CONTENTS Copyright & License Notes 3 Introduction 13 Chapter 1 - Excel Basics 14 Creating an Excel Workbook 14 Examining the Excel Environment 15 Opening an Existing Workbook 19 Navigating a Worksheet
Teach yourself... PivotTables and PivotCharts. with. Microsoft Excel Easy to follow Step-by-step instructions Written in plain English
 Easy Way Teach yourself... PivotTables and PivotCharts with Microsoft Excel 2013 Easy to follow Step-by-step instructions Written in plain English A Cheryl Price Publication Easy Way PivotTables and PivotCharts
Microsoft Excel 2016 / 2013 Basic & Intermediate
 Microsoft Excel 2016 / 2013 Basic & Intermediate Duration: 2 Days Introduction Basic Level This course covers the very basics of the Excel spreadsheet. It is suitable for complete beginners without prior
CHAPTER 4: MICROSOFT OFFICE: EXCEL 2010
 CHAPTER 4: MICROSOFT OFFICE: EXCEL 2010 Quick Summary A workbook an Excel document that stores data contains one or more pages called a worksheet. A worksheet or spreadsheet is stored in a workbook, and
EXCEL TUTORIAL.
 EXCEL TUTORIAL Excel is software that lets you create tables, and calculate and analyze data. This type of software is called spreadsheet software. Excel lets you create tables that automatically calculate
Working with Microsoft Excel. Touring Excel. Selecting Data. Presented by: Brian Pearson
 Working with Microsoft Excel Presented by: Brian Pearson Touring Excel Menu bar Name box Formula bar Ask a Question box Standard and Formatting toolbars sharing one row Work Area Status bar Task Pane 2
Excel 2007/2010. Don t be afraid of PivotTables. Prepared by: Tina Purtee Information Technology (818)
") Information Technology MS Office 2007/10 Users Guide Excel 2007/2010 Don t be afraid of PivotTables Prepared by: Tina Purtee Information Technology (818) 677-2090 tpurtee@csun.edu [ DON T BE AFRAID OF
Information Technology MS Office 2007/10 Users Guide Excel 2007/2010 Don t be afraid of PivotTables Prepared by: Tina Purtee Information Technology (818) 677-2090 tpurtee@csun.edu [ DON T BE AFRAID OF
Intermediate Microsoft Excel 2010
 P a g e 1 Intermediate Microsoft Excel 2010 ABOUT THIS CLASS This class is designed to continue where the Microsoft Excel 2010 Basics class left off. Specifically, we will cover additional ways to organize
Creating Charts and PivotTables
 10 Creating Charts and PivotTables LESSON SKILL MATRIX Skill Exam Objective Objective Number Building Charts Create charts based on worksheet data. 6.1 Formatting a Chart with a Quick Style Formatting
Basic Excel 2010 Workshop 101
 Basic Excel 2010 Workshop 101 Class Workbook Instructors: David Newbold Jennifer Tran Katie Spencer UCSD Libraries Educational Services 06/13/11 Why Use Excel? 1. It is the most effective and efficient
SBCUSD IT Training Program. MS Excel ll. Fill Downs, Sorting, Functions, and More
 SBCUSD IT Training Program MS Excel ll Fill Downs, Sorting, Functions, and More Revised 4/16/2019 TABLE OF CONTENTS Number Formats...4 Auto Fill and Flash Fill...5 Simple Repeat...5 Fill Down Common Series...5
Microsoft Office Excel 2016 for Mac
 Microsoft Office Excel 2016 for Mac Introduction to Charts University Information Technology Services Learning Technologies, Training & Audiovisual Outreach Copyright 2016 KSU Division of University Information
Microsoft Certified Application Specialist Exam Objectives Map
 Microsoft Certified Application Specialist Exam s Map This document lists all Microsoft Certified Application Specialist exam objectives for (Exam 77-602) and provides references to corresponding coverage
Excel Level 3 - Advanced
 Excel Level 3 - Advanced Introduction This document covers some of the more advanced features of Excel. Spreadsheets can be used in such a multiplicity of ways that it cannot hope to even touch on all
COMP1000 / Spreadsheets Week 2 Review
 / Spreadsheets Week 2 Review Plot chart Column chart/bar chart/pie chart Customize chart Chart style/labels/titles Add trendline Create table Create table/apply different style/print table Sort/filter
GAZIANTEP UNIVERSITY INFORMATICS SECTION SEMETER
 GAZIANTEP UNIVERSITY INFORMATICS SECTION 2010-2011-2 SEMETER Microsoft Excel is located in the Microsoft Office paket. in brief Excel is spreadsheet, accounting and graphics program. WHAT CAN WE DO WITH
Gloucester County Library System EXCEL 2007
 Gloucester County Library System EXCEL 2007 Introduction What is Excel? Microsoft E x c e l is an electronic s preadsheet program. I t is capable o f performing many diff e r e n t t y p e s o f c a l
EXCEL 2013 FDLRS SUNRISE
 EXCEL 2013 FDLRS SUNRISE Goal: Participants will create a spreadsheet and graph to document student progress. Objectives: Participants will create a spreadsheet which includes basic formulas. Participants
Excel 2010: A Case Approach
 THE O'LEARY SERIES COMPLETE EDITION Excel 2010: A Case Approach Timothy J. O'Leary Professor Emeritus, Arizona State University Linda I. O'Leary Mc Learn Succeed' ar ) Connect # Introduction to Microsoft
1. Click in cell A2, and then drag to cell D5 to select the data in those four rows and columns.
 Training Chart work EXERCISE 1: CREATE A CHART 1. Click in cell A2, and then drag to cell D5 to select the data in those four rows and columns. 2. On the ribbon, click the Insert tab. In the Charts group,
WAAT-PivotTables Accounting Seminar
 WAAT-PivotTables-08-26-2016-Accounting Seminar Table of Contents What does a PivotTable do?... 2 How to create PivotTable:... 2 Add conditions to the PivotTable:... 2 Grouping Daily Dates into Years, Quarters,
Learning Map Excel 2007
 Learning Map Excel 2007 Our comprehensive online Excel tutorials are organized in such a way that it makes it easy to obtain guidance on specific Excel features while you are working in Excel. This structure
MS Office for Engineers
 MS Office for Engineers Lesson 4 Excel 2 Pre-reqs/Technical Skills Basic knowledge of Excel Completion of Excel 1 tutorial Basic computer use Expectations Read lesson material Implement steps in software
Excel 2010: Getting Started with Excel
 Excel 2010: Getting Started with Excel Excel 2010 Getting Started with Excel Introduction Page 1 Excel is a spreadsheet program that allows you to store, organize, and analyze information. In this lesson,
MICROSOFT EXCEL KEYBOARD SHORCUTS
 MICROSOFT EXCEL KEYBOARD SHORCUTS F1 Displays the Office Assistant or (Help > Microsoft Excel Help) F2 Edits the active cell, putting the cursor at the end F3 Displays the (Insert > Name > Paste) dialog
EXCEL ADVANCED Linda Muchow
 EXCEL ADVANCED 2016 Alexandria Technical and Community College Customized Training Technology Specialist 1601 Jefferson Street, Alexandria, MN 56308 320-762-4539 Linda Muchow lindac@alextech.edu 1 Table
Microsoft Excel Keyboard Shortcuts
 Microsoft Excel Keyboard Shortcuts Here is a complete list of keyboard shortcuts for Microsoft Excel. Most of the shortcuts will work on all Excel versions on Windows based computer. Data Processing Shortcuts
Excel 2010 Charts - Intermediate Excel 2010 Series The University of Akron. Table of Contents COURSE OVERVIEW... 2
 Table of Contents COURSE OVERVIEW... 2 DISCUSSION... 2 COURSE OBJECTIVES... 2 COURSE TOPICS... 2 LESSON 1: MODIFY CHART ELEMENTS... 3 DISCUSSION... 3 FORMAT A CHART ELEMENT... 4 WORK WITH DATA SERIES...
Chapter 4. Microsoft Excel
 Chapter 4 Microsoft Excel Topic Introduction Spreadsheet Basic Screen Layout Modifying a Worksheet Formatting Cells Formulas and Functions Sorting and Filling Borders and Shading Charts Introduction A