SA+ Spreadsheets. Fig. 1
|
|
|
- Emma Chandler
- 5 years ago
- Views:
Transcription
1 SongSeq User Manual 1- SA+ Spreadsheets 2- Make Template And Sequence a. Template Selection b. Syllables Identification: Using One Pair of Features c. Loading Target Files d. Viewing Results e. Identification Using Two Pairs of Features f. Modified Template Spreadsheet 3- Load Template And Sequence 4- View Scatter Plots 5- View Sequenced Files 6- Clustering Test 7- Delete Clusters Test
. It s very crucial for SongSeq NOT to alter the format of the spreadsheets that are generated by SA+. Fig. 1 below shows a screenshot for a typical SA+ spreadsheet.")
2 SA+ Spreadsheets The input to SongSeq is the Microsoft Excel spreadsheets generated by Sound Analysis Pro (SA+) software, which can be downloaded from ( It s very crucial for SongSeq NOT to alter the format of the spreadsheets that are generated by SA+. Fig. 1 below shows a screenshot for a typical SA+ spreadsheet. Notice that the first column starts at B and the first row of data starts at row 5. This is how SA+ generates its data and it is very important to keep all the spreadsheets that are to be simulated by SongSeq in this same format. Fig. 1 It s preferred to have the Excel spreadsheets saved in.xls format rather than.xlsx. This could be done in MS. Excel by saving the.xlsx spreadsheet as Excel Workbook.

3 Make Template and Sequence a- Template Selection The sequencing process starts by choosing the Make Template and Sequence menu item (Fig. 2). Fig. 2 The next step is designating a single spreadsheet as the template. This spreadsheet is a typical SA+ spreadsheet containing the acoustic variables. This is done by browsing for the spreadsheet on your computer. After that, select two acoustic features from the template as shown in Fig. 3. The acoustic features drop down menu lists all the features that SA+ generates. Fig. 3
4 b- Syllables Identification: Using One Pair of Features Once the template and the two features are selected, you can move to the next step by clicking on Move to Step 2 button (Fig. 3). This will pull up a window showing the 2D scatter plot of the template with the two features data points extracted from the spreadsheet as illustrated below (Fig. 4). Fig. 4 also shows two tabbed panes on the right side that will be discussed below. Fig. 4 The next step is using the graphical tools to associate the syllable clusters in Fig. 4 with syllable labels. To add the first syllable (say A ), enter its name in the text box on the right hand side, choose a color for it from the drop down menu of colors, and then click ADD. The syllable will be added as a syllable node to the tree on the lower right corner of Fig. 4. SongSeq prevents adding the same syllable name twice and it prevents choosing the same color for more than one syllable. After the syllable is added, paint using mouse clicks onto the 2D scatter plot over the area that represents the syllable. Each mouse click paints a box onto the scatter plot and adds a child node under the syllable node in the tree, and this child node lists the dimensions of the two features covered under the 2D painted box. You can control the size of the painted boxes under the Box Size tabbed pane. This is illustrated in Fig. 5. You can choose a variety of box sizes while painting the same syllable. Also, if you mistakenly painted a box over the wrong region, you can undo the last box painted by clicking the Undo Last Box button. Continuous clicking of this button keeps removing the last painted box for the last syllable undergoing painting.


5 Fig. 5 After you define the dimensions of the first syllable, repeat the same for the remaining syllables. Fig. 6 shows the 2D scatter plot painted for all syllables. Notice, the tree on the right side shows a list of all syllables, along with their associated colors and the number of boxes painted to define their boundaries. In order to see the dimensions of each of those boxes, press on the (+) sign near the syllable name on the tree. Fig. 6

6 The painted boxes are transparent. However, if you hover the mouse outside the scatter plot region and then hover it back inside the scatter plot region, the transparency of the boxes decreases. To return to the initial transparency level, minimize the SongSeq window, after that maximize it and then hover the mouse inside the scatter plot region. If all syllables are easily identified with one pair of features, move next by clicking on Move to Step 3. However, it may happen that some syllables are not easily identified with one pair of features (discussed later), and they can be better identified with a second pair of features. If this case happens, move next by clicking on Add Another Dimension & Move to Step 3. Both cases will be illustrated below. Click on the Move to Step 3 button. This shows a panel similar to Fig. 7 below. c- Loading Target Files Fig. 7 The next step is choosing the target files (typical SA+ spreadsheets). This is done by clicking on the Add New Excel File button. The file chooser box that pops up allows you to select multiple excel files at once as illustrated in Fig. 8. We prefer to add the excel files in the same order as the chronological order of events that they represent. For instance, if file Post1.xls represents the first day after surgery and file Post2.xls represents the second day after surgery, it is better to upload Post1.xls before Post2.xls. This is better and more convenient for reporting analysis at the end.


7 Fig. 8 Fig. 9 shows the upload of one pre-surgery and 13 post-surgery spreadsheets. If one or more target files are uploaded mistakenly, they can be removed by marking their corresponding rows on the third column of the table, then clicking Delete Marked. Fig. 9
.")
8 The next step is uniquely identifying each target file uploaded by a unique name or ID. This is done by clicking on the second column of the table and typing in the corresponding row its unique name or ID (Fig. 10). The name or ID is totally up to the user, but no two target files can share the same name, and each target file must be designated by a name or ID. To fasten the labeling process, pressing the Enter on the keyboard moves the cursor from one row to another (this is instead of clicking the mouse on each corresponding row). Fig. 10 Next, the typical transitions are chosen by marking them from the checkboxes in the lower left panel of Fig. 10. SongSeq lists all possible combinations of syllable transitions based on the syllable names entered in the first step. For this particular example, the typical transitions chosen are I-I, I-A, A-I, A-B, B-C, C-D, D-E and E-A (Fig. 11). When the typical transitions are chosen, sequencing the target files can start by clicking Start Sequencing button. The text area under the Start Sequencing button shows the progress of the sequencing process by writing the name of the target file currently being simulated. This is illustrated in Fig. 11 (the screenshot was taken after SongSeq finished running files Pre, P1, P2 and P3, while P4 was being simulated).
. Initially, the window is empty showing no results.")

9 Fig. 11 d- Viewing Results Once SongSeq finishes sequencing all the target files, a window that aims at summarizing the results appears (Fig. 12). Initially, the window is empty showing no results. However, a drop down menu at the top shows the names for all the target files sequenced. The results for each of those target files can be accessed by choosing the target file name from the drop down menu. Fig. 12
.")
10 Fig. 13 shows the results for the selected Pre day. The table lists all the encountered transitions, the number of occurrences of each transition and the corresponding probability of each transition. Fig. 13 A bar chart of all the transitions can be viewed by clicking Open Bar Chart (Fig. 14). The blue bars represent the typical transitions, that is, the transitions chosen by the user in the step of Fig. 11. The yellow bars represent atypical transitions, that is, transitions involving syllables the bird sung but not specified as typical by the user. These transitions have the form X-X where X can be any syllable name, but where X-X is not a user-specified typical transition. Finally, the red bars represent NMS transitions. These transitions involve the data points that are not painted by the user (the red dots on the scatter plot). NMS transitions have the forms X-N, N-X or N-N where X can be any syllable name and N represents NEW or NMS syllable. Notice that the transitions listed in the table of Fig. 13 occur in the same order as the transitions in the bar chart of Fig. 14. Results can also be shown in a pie chart by clicking Open Pie Chart (Fig. 15).

11 Fig. 14 Fig. 15
.")

12 Linearity, consistency, and stereotypy scores for the target file selected can be visualized under the Show Scores button (Fig. 16). For every.wav file in the spreadsheet of day 12, the number of transitions is calculated as well as the number of transition types (the number of different transitions). Corresponding linearity, consistency and stereotypy scores are then generated based on these values. For any score that is larger than 0.85, the entry in the table is colored red, indicating that the song for this.wav file is highly stereotyped. Average linearity, consistency and stereotypy scores are then calculated and shown at the top. Fig. 16 All of the above results are written onto the target file s spreadsheet. This can be seen by clicking Open Excel File button. Fig. 17 shows a screen shot of the Pre day target excel spreadsheet after the simulation. The screenshot captures only its internal spreadsheets names. SongSeq creates multiple spreadsheets within the target spreadsheet. A spreadsheet is created for each syllable entered by the user, along with a spreadsheet for the NEW or NMS syllables. Next these syllable spreadsheets are merged into a final Sequenced spreadsheet that is created to contain all the notes in the order they were sung. This allows for the analysis of syllable transition probabilities. Fig. 17


13 The transition probabilities shown in Fig 13, 14 and 15 are written under the Probabilities spreadsheet (Fig. 18). In the same order as in the table of Fig. 13, the data are written onto their corresponding rows and columns in the spreadsheet. This enables user manipulation of the data on Excel apart from SongSeq. The typical transitions are written first, then atypical transitions followed by NMS transitions. Fig. 18 Similarly, the scores (Fig. 16) are written under the spreadsheet labeled Scores as shown in Fig. 19 below. Fig. 19

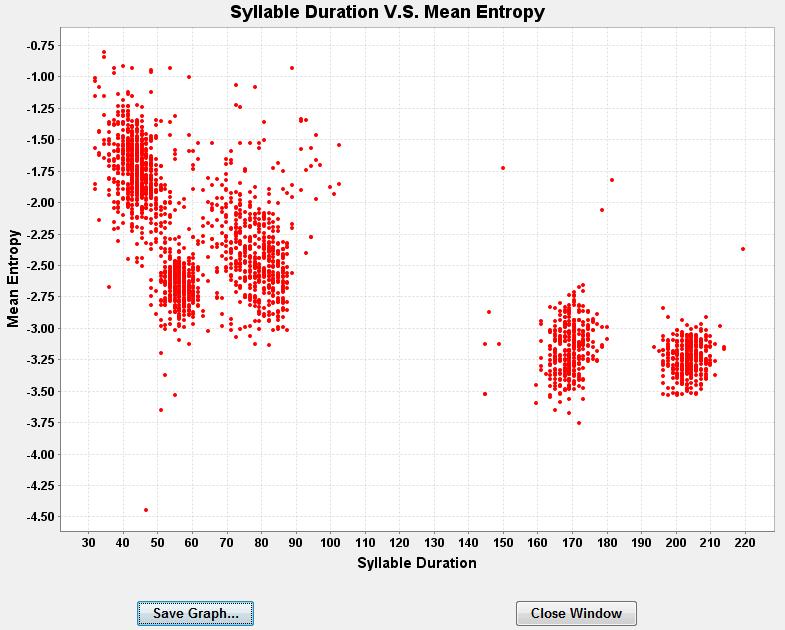
14 The generated spreadsheets described above should be left unaltered by the user; this is required for other modules in SongSeq to operate successfully. One can create a copy of the spreadsheets in a separate file and manipulate the data externally. The KL analysis, entropy analysis and the average scores for all the target files simulated can be seen by pressing on the buttons Show K-L Analysis, Show Entropies and Show All Scores buttons respectively (Fig. 13). The details of this analysis are explained in Daou et al (2012). e- Identification using Two Pairs of Features In Fig. 6, notice that syllables B (blue) and I (magenta) are very close to each other, and thereby not very efficiently discriminated. If such a situation occurs, there can be a better identification of the syllables with a second pair of features. In order to explore that, click on Add Another Dimension and Move to Step 3 button. This brings a window similar to Fig. 20. One can identify the first set of syllables using one feature pair, then move to a second feature pair to improve the identification of the remaining syllables. In this process, and after all the syllables are identified with the first 2 acoustic features, two new acoustic features are chosen along with a subset of the previously added syllables. Only this chosen subset of syllables (which can include all syllables) can be painted again in the new 2D feature space. Fig. 20 shows the selection of syllable duration versus mean entropy acoustic features. It also shows the selection of B and I since their clusters in Fig. 6 are not well isolated, and as we will see shortly syllable duration versus mean entropy pulls B and I apart. Syllables A, C, D and E are not chosen here because they are discriminated nicely with the first two acoustic features. Fig. 20
 in the scatter plot of Fig.")
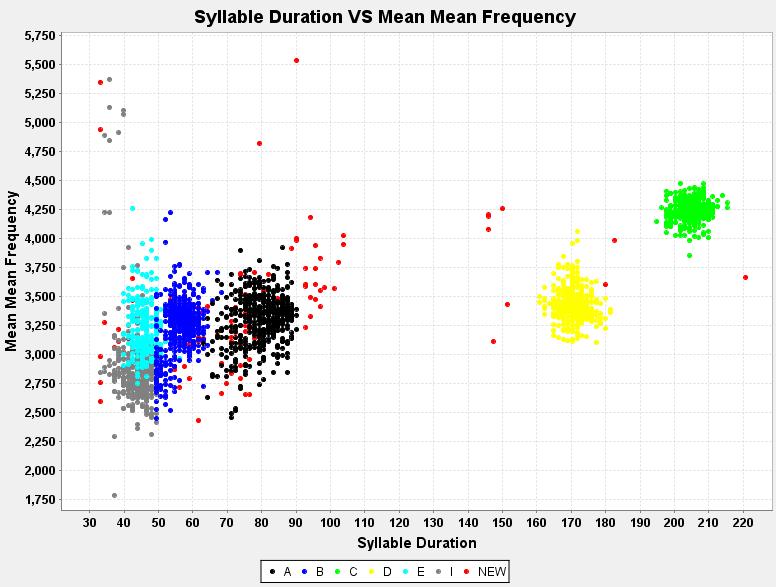
15 Once the second pair of features is chosen, a new 2D scatter plot appears. The data points are now color coded according to the first step of identification (Fig. 21). For instance, any data points that were within the black boxes defining the borders of syllable A in the scatter plot of Fig. 6, will be painted in the same color (black) in the scatter plot of Fig. 21. In Fig. 21 we see that the data points for B (blue) and I (magenta) are pulled apart in the new 2D feature space, and it is clear that some data points previously misidentified as B actually cluster better with I (blue points in the bottom right of the magenta cluster). Syllables A (black), C (green) and D (yellow) remain well isolated, but syllable E (gray) has a very similar mean entropy as the introductory notes and therefore their corresponding clusters overlap. Fig. 21 Next, the user paints in the same way as before onto the new scatter plot, but now only for the syllables (B and I) that were specified for this second round of discrimination (Fig. 22). For these specified syllables, a data point is considered as syllable X if and only if either of the following two conditions hold: (1) it belongs to one of the boxes defining syllable X in the first 2D scatter plot AND it belongs to one of the boxes defining syllable X in the second 2D scatter plot, (2) it belongs to one of the boxes defining syllable X in the second 2D scatter plot BUT is not a data point of a non-specified syllable (that is, a data point that is colored with black (A), green (C), yellow (D) or gray (E)). Although the clusters for E and I overlap in the second scatter plot, the points originally labeled as E retain that identification since E was not selected for repainting.


16 Fig. 22 The next step in choosing the target files and visualizing the results follows the same as previously discussed (Figs 7 through 19). f- Modified Template Spreadsheet Just as SongSeq modifies each of the target files spreadsheets as described above, the template spreadsheet is also modified, but in a different way. Fig. 23 shows a screenshot of the template spreadsheet after simulation, zoomed at the spreadsheet s taskbar showing its internal generated spreadsheets. Three spreadsheets are generated by SongSeq, named Syllable Dimensions, Typical Transitions and Axis Ranges. Fig. 23
 contains information of syllable names, the colors used to paint each syllable onto the scatter plot, the dimensions of the pair of features defined by each painted box, and other information")
17 The Syllable Dimensions spreadsheet (Fig. 24) contains information of syllable names, the colors used to paint each syllable onto the scatter plot, the dimensions of the pair of features defined by each painted box, and other information required for JAVA processing in the Load Template & Sequence section described later, particularly the location on the screen (in pixels) of each mouse click used to paint a box and the width of the box painted. Fig. 24 The typical transitions are written onto the spreadsheet Typical Transitions (Fig. 25). Fig. 25
18 Axis Ranges spreadsheet (Fig. 26) contains information about the x (first feature) and y (second feature) axis of the template s 2D scatter plot, particularly, the range of both axis. This information is required for the Load Template & Sequence module. Fig. 26 It s important that the information in the modified spreadsheets (target s and template s) to be left unaltered by the user. This information is required by other modules of SongSeq, and any user modification of the spreadsheets might result in unsuccessful execution of tasks by SongSeq. It s recommended to create a copy of the spreadsheet that wishes user manipulation.
 over some other target files at a later time (for example, after you get data from a")
 thereby maintaining the same painted boxes")
19 Load Template and Sequence After the boundaries for all syllable clusters are painted and defined through the Make Template and Sequence module, and after SongSeq sequences few target files, it may happen that one would like to run the same simulation (with the same template and syllable boundaries) over some other target files at a later time (for example, after you get data from a post-surgery day). It would be inconvenient to paint the syllable boundaries again, because each time one paints it is most likely that the boxes will be painted in a different way. To overcome this problem, Load Template and Sequence module allows you to load the previously simulated template (that has undergone painting previously) thereby maintaining the same painted boxes and syllable boundaries. This of course requires that the new target files to be simulated are to be compared with the designated template spreadsheet. Fig. 27 shows the first step in launching the Load Template and Sequence module. Fig. 27 The next step is browsing for the previously simulated template (MAIN) excel spreadsheet (Fig. 28). Fig. 28
 are shown. Also shown on the right side of the panel are the syllable names and their associated colors, along with the typical transitions entered by the user previously.")
 just gives the user an idea of what had been done before. No extra painting can be done here and no new syllables or typical transitions can be added.")
20 Fig. 29 below shows the generated window after loading the same template used in the simulation above. The scatter plot with the chosen two features (Fig. 3) and the painted boxes (Figs. 4, 5, and 6) are shown. Also shown on the right side of the panel are the syllable names and their associated colors, along with the typical transitions entered by the user previously. This information is extracted from the spreadsheet of the template as described before (Figs. 24 through 26). Fig. 29 The window above (Fig. 29) just gives the user an idea of what had been done before. No extra painting can be done here and no new syllables or typical transitions can be added. Next, the target files can be added through Load Targets & Sequence. This will load Fig. 30 below. In this step, the target files are uploaded and processed in the same way as discussed before (Figs. 7 through 10). Fig. 30
21 View Scatter Plots Scatter Plots module (Fig. 31) provides an efficient tool allowing the user to browse easily between the different pairs of features to find the best two features that discriminate the syllables efficiently. Fig. 31 After the spreadsheet is browsed for (Fig. 32), the user can choose any two acoustic features to view their scatter plot. The window in Fig. 32 remains allowing the user to keep choosing different combinations of features. It s very easy and convenient using this module to look at the different pairs of features. Fig. 32 Fig. 33 shows a sample scatter plot window. Also, the panel gives the option to save the scatter plot as an image using the button Save Graph.
22 Fig. 33
 allows one to view previously simulated files and recall the results. Fig.")
 button) that had been run")
23 View Sequenced Files Sequenced Files module (Fig. 34) allows one to view previously simulated files and recall the results. Fig. 34 The user is asked to browse for the template spreadsheet (through Browse button) and the target files spreadsheets (through Add Target(s) button) that had been run previously through SongSeq (Fig. 35). Fig. 35
 as the user entered it previously when the targets were simulated (Fig. 10). Fig.")
24 Fig. 36 shows the window after loading the template and the target spreadsheets. Notice that SongSeq remembers the target s name or ID (second column of the table) as the user entered it previously when the targets were simulated (Fig. 10). Fig. 36 Clicking on the Load button opens a window (Fig. 37) that is similar to Fig. 29, where the template scatter plot is shown along with the painted boxes, the syllable names and their associated colors, and typical transitions. Also shown on the lower right corner is a drop down menu showing a list of names of all the target files uploaded. Choosing one target file and hitting View loads the results for that target file chosen. Fig. 37

25 Fig. 38 shows a sample window for the results that are displayed (in this case for target file P1 ). Three tabbed panes are displayed, showing the simulated scores, and the transitional probabilities (in bar chart and pie chart formats). Fig. 38
 intends to help the user identify the syllable clusters on the scatter plot accurately and eliminate any obscurity regarding whether the cluster seen belongs to one syllable or more.")
26 Clustering Test The Clustering Test module (Fig. 39) intends to help the user identify the syllable clusters on the scatter plot accurately and eliminate any obscurity regarding whether the cluster seen belongs to one syllable or more. This will be illustrated below. Fig. 39 A window (Fig. 40) asks the user to browse for an SA+ spreadsheet and chooses the first pair of acoustic features. Fig. 40
 similar to Fig. 4.")
27 This loads a window (Fig. 41) similar to Fig. 4. In this window, the user paints the syllables as descried earlier and then clicks on Move Next (Fig. 42). Fig. 41 Fig. 42


28 The next window (Fig. 43) asks the user to choose a second pair of features. According to this choice, a new 2D scatter plot appears. The data points are now color coded according to the first step of identification (Fig. 42). This is illustrated in Fig. 44 where the same first pair of features is chosen. Fig. 43 Any data points that were within the black boxes defining the borders of syllable A in the scatter plot of Fig. 42, will be painted in the same color (black) in the scatter plot of Fig. 44. Fig. 44
 and I (gray) are pulled apart in the new 2D feature space, and it is clear that some data points previously misidentified as B actually cluster")
29 If the choice of the second pair of features was Syllable Duration versus Mean Entropy, then the scatter plot would like that in Fig. 45. In this figure we see that the data points for B (blue) and I (gray) are pulled apart in the new 2D feature space, and it is clear that some data points previously misidentified as B actually cluster better with I (blue points in the bottom right of the gray cluster). Syllables A (black), C (green), and D (yellow) remain well isolated, but syllable E (cyan) has a similar mean entropy as the introductory notes (I) and therefore their corresponding clusters overlap. So, using this module we now have an idea that we were about to misidentify two clusters (B and I). Fig. 45 SongSeq leaves the window of Fig. 43 open allowing the user to choose as many pair of features as needed. Figs 46 and 47 show another two examples with different combinations of features for the same example and painting done in Fig. 42.

30 Fig. 46 Fig. 47

31 Delete Clusters Test Delete Clusters Test (Fig. 48) is a module where the user can eliminates one or more clusters after designation. This helps clear the spectrogram and give a better visualization of the data points on the scatter plot. Fig. 48 This module opens initially windows identical to Figs. 40, 41, and 42. For this reason, we re omitting showing them here. Next, a window showing the color coded syllables appears along with the syllable s names on right hand side with checkboxes near them (Fig. 49). Fig. 49

32 A checked syllable means that the syllable is painted onto the scatter plot. To remove certain syllables from the scatter plot, uncheck the syllable name and click on RePlot. Fig. 50 shows the scatter plot with syllables A, C, and E eliminated. Fig. 50
Working with Excel CHAPTER 1
 CHAPTER 1 Working with Excel You use Microsoft Excel to create spreadsheets, which are documents that enable you to manipulate numbers and formulas to quickly create powerful mathematical, financial, and
Working with Excel involves two basic tasks: building a spreadsheet and then manipulating the
 Working with Excel You use Microsoft Excel to create spreadsheets, which are documents that enable you to manipulate numbers and formulas to create powerful mathematical, financial, and statistical models
Tricking it Out: Tricks to personalize and customize your graphs.
 Tricking it Out: Tricks to personalize and customize your graphs. Graphing templates may be used online without downloading them onto your own computer. However, if you would like to use the templates
How to use Excel Spreadsheets for Graphing
 How to use Excel Spreadsheets for Graphing 1. Click on the Excel Program on the Desktop 2. You will notice that a screen similar to the above screen comes up. A spreadsheet is divided into Columns (A,
Making Tables and Graphs with Excel. The Basics
 Making Tables and Graphs with Excel The Basics Where do my IV and DV go? Just like you would create a data table on paper, your IV goes in the leftmost column and your DV goes to the right of the IV Enter
The Ribbon The Ribbon contains multiple tabs, each with several groups of commands. You can add your own tabs that contain your favorite commands.
 Lesson1-Getting Star with excel Excel is a spreadsheet program that allows you to store, organize, and analyze information. In this lesson, you will learn your way around the Excel 2010 environment, including
Microsoft Excel 2007
 Learning computers is Show ezy Microsoft Excel 2007 301 Excel screen, toolbars, views, sheets, and uses for Excel 2005-8 Steve Slisar 2005-8 COPYRIGHT: The copyright for this publication is owned by Steve
Excel Core Certification
 Microsoft Office Specialist 2010 Microsoft Excel Core Certification 2010 Lesson 6: Working with Charts Lesson Objectives This lesson introduces you to working with charts. You will look at how to create
Excel 2016 Charts and Graphs
 Excel 2016 Charts and Graphs training@health.ufl.edu Excel 2016: Charts and Graphs 2.0 hours This workshop assumes prior experience with Excel, Basics I recommended. Topics include data groupings; creating
Excel 2013 Part 2. 2) Creating Different Charts
 Creating Different Charts") Excel 2013 Part 2 1) Create a Chart (review) Open Budget.xlsx from Documents folder. Then highlight the range from C5 to L8. Click on the Insert Tab on the Ribbon. From the Charts click on the dialogue
Excel 2013 Part 2 1) Create a Chart (review) Open Budget.xlsx from Documents folder. Then highlight the range from C5 to L8. Click on the Insert Tab on the Ribbon. From the Charts click on the dialogue
OPERATION MANUAL. MV-410HS Layout Editor. Version higher. Command
 OPERATION MANUAL MV-410HS Layout Editor Version 3.0 - higher Command Command Table of Contents 1. Setup... 1 1-1. Overview... 1 1-2. System Requirements... 1 1-3. Operation Flow... 1 1-4. Installing MV-410HS
BioFuel Graphing instructions using Microsoft Excel 2003 (Microsoft Excel 2007 instructions start on page mei-7)
") BioFuel Graphing instructions using Microsoft Excel 2003 (Microsoft Excel 2007 instructions start on page mei-7) Graph as a XY Scatter Chart, add titles for chart and axes, remove gridlines. A. Select
BioFuel Graphing instructions using Microsoft Excel 2003 (Microsoft Excel 2007 instructions start on page mei-7) Graph as a XY Scatter Chart, add titles for chart and axes, remove gridlines. A. Select
Microsoft Excel 2007
 Microsoft Excel 2007 1 Excel is Microsoft s Spreadsheet program. Spreadsheets are often used as a method of displaying and manipulating groups of data in an effective manner. It was originally created
Technology Assignment: Scatter Plots
 The goal of this assignment is to create a scatter plot of a set of data. You could do this with any two columns of data, but for demonstration purposes we ll work with the data in the table below. You
Adobe Premiere: Getting Started
 Prepared by Ansel Herz for the UW Department of Communication http://www.com.washington.edu/tech/irc/ Questions? Comments? Contact Kristina Bowman at kriscb@uw.edu. Adobe Premiere: Getting Started This
Numbers Basics Website:
 Website: http://etc.usf.edu/te/ Numbers is Apple's new spreadsheet application. It is installed as part of the iwork suite, which also includes the word processing program Pages and the presentation program
Starting Excel application
 MICROSOFT EXCEL 1 2 Microsoft Excel: is a special office program used to apply mathematical operations according to reading a cell automatically, just click on it. It is called electronic tables Starting
Creating a Basic Chart in Excel 2007
 Creating a Basic Chart in Excel 2007 A chart is a pictorial representation of the data you enter in a worksheet. Often, a chart can be a more descriptive way of representing your data. As a result, those
INTRODUCTORY LAB INTRODUCTION TO STATCRUNCH 5.0
 INTRODUCTORY LAB INTRODUCTION TO STATCRUNCH 5.0 StatCrunch is a free web-based statistical software package containing all statistical features covered in introductory statistics courses. It is very easy
Charts in Excel 2003
 Charts in Excel 2003 Contents Introduction Charts in Excel 2003...1 Part 1: Generating a Basic Chart...1 Part 2: Adding Another Data Series...3 Part 3: Other Handy Options...5 Introduction Charts in Excel
Overview and Instructions
 AE Mobility Tracking Tool July 30, 2013 Overview and Instructions Sheet-specific Instructions Welcome Instructions Common Qs & As MobilityLog & Data Entry Reports: Graphs & Charts Data for Website Entry
Beginners Guide to Snippet Master PRO
 Beginners Guide to Snippet Master PRO This document assumes that Snippet Master has been installed on your site. If not please contact the Bakas IT web team at webreg@bakasit.com.au. Initial Login Screen...
PS04 Pattern Editor. Last Update: Feb,
 PS04 Pattern Editor www.soundside.de Last Update: Feb,12 2004 Index 1. Introduction. 2. Overview of the Pattern Editor. 3. Setting up the Pattern Editor. 4. Loading and playing a Rhythm Pattern in the
Getting Started With Excel
 Chapter 1 Getting Started With Excel This chapter will familiarize you with various basic features of Excel. Specific features which you need to solve a problem will be introduced as the need arises. When
Application of Skills: Microsoft Excel 2013 Tutorial
 Application of Skills: Microsoft Excel 2013 Tutorial Throughout this module, you will progress through a series of steps to create a spreadsheet for sales of a club or organization. You will continue to
Excel 2010: Getting Started with Excel
 Excel 2010: Getting Started with Excel Excel 2010 Getting Started with Excel Introduction Page 1 Excel is a spreadsheet program that allows you to store, organize, and analyze information. In this lesson,
Introduction to Microsoft Excel 2010
 Introduction to Microsoft Excel 2010 THE BASICS PAGE 02! What is Microsoft Excel?! Important Microsoft Excel Terms! Opening Microsoft Excel 2010! The Title Bar! Page View, Zoom, and Sheets MENUS...PAGE
MOVING FROM CELL TO CELL
 VCAE: EXCEL Lesson 1 Please send comments to Author: Zahra Siddiqui at zed_ess@hotmail.com Concepts Covered: Cell Address; Cell Pointer; Moving across Cells Constants: Entering, Editing, Formatting Using
Beginner s Guide to Microsoft Excel 2002
 Beginner s Guide to Microsoft Excel 2002 Microsoft Excel lets you create spreadsheets, which allow you to make budgets, track inventories, calculate profits, and design charts and graphs. 1. Open Start
Fig. A. Fig. B. Fig. 1. Fig. 2. Fig. 3 Fig. 4
 Create A Spinning Logo Tutorial. Bob Taylor 2009 To do this you will need two programs from Xara: Xara Xtreme (or Xtreme Pro) and Xara 3D They are available from: http://www.xara.com. Xtreme is available
Graphing on Excel. Open Excel (2013). The first screen you will see looks like this (it varies slightly, depending on the version):
. The first screen you will see looks like this (it varies slightly, depending on the version):") Graphing on Excel Open Excel (2013). The first screen you will see looks like this (it varies slightly, depending on the version): The first step is to organize your data in columns. Suppose you obtain
Graphing on Excel Open Excel (2013). The first screen you will see looks like this (it varies slightly, depending on the version): The first step is to organize your data in columns. Suppose you obtain
Spreadsheet Warm Up for SSAC Geology of National Parks Modules, 2: Elementary Spreadsheet Manipulations and Graphing Tasks
 University of South Florida Scholar Commons Tampa Library Faculty and Staff Publications Tampa Library 2009 Spreadsheet Warm Up for SSAC Geology of National Parks Modules, 2: Elementary Spreadsheet Manipulations
Learn more about Pages, Keynote & Numbers
 Learn more about Pages, Keynote & Numbers HCPS Instructional Technology May 2012 Adapted from Apple Help Guides CHAPTER ONE: PAGES Part 1: Get to Know Pages Opening and Creating Documents Opening a Pages
Charting Progress with a Spreadsheet
 Charting Progress - 1 Charting Progress with a Spreadsheet We shall use Microsoft Excel to demonstrate how to chart using a spreadsheet. Other spreadsheet programs (e.g., Quattro Pro, Lotus) are similarly
Microsoft Office Excel
 Microsoft Office 2007 - Excel Help Click on the Microsoft Office Excel Help button in the top right corner. Type the desired word in the search box and then press the Enter key. Choose the desired topic
Excel 2013 for Beginners
 Excel 2013 for Beginners Class Objective: This class will familiarize you with the basics of using Microsoft Excel. Class Outline: Introduction to Microsoft Excel 2013... 1 Microsoft Excel...2-3 Getting
Chemistry Excel. Microsoft 2007
 Chemistry Excel Microsoft 2007 This workshop is designed to show you several functionalities of Microsoft Excel 2007 and particularly how it applies to your chemistry course. In this workshop, you will
Objectives. Objectives. Objectives. Starting Excel. Plan Ahead 3/9/2010. Excel Chapter 1. Microsoft Office 2007
 Objectives Microsoft Office 2007 Excel Chapter 1 Creating a Worksheet and an Embedded Chart Start and quit Excel Describe the Excel worksheet Enter text and numbers Use the Sum button to sum a range of
SUM - This says to add together cells F28 through F35. Notice that it will show your result is
 COUNTA - The COUNTA function will examine a set of cells and tell you how many cells are not empty. In this example, Excel analyzed 19 cells and found that only 18 were not empty. COUNTBLANK - The COUNTBLANK
EXCEL 2013 FDLRS SUNRISE
 EXCEL 2013 FDLRS SUNRISE Goal: Participants will create a spreadsheet and graph to document student progress. Objectives: Participants will create a spreadsheet which includes basic formulas. Participants
Microsoft Excel Chapter 1. Creating a Worksheet and an Embedded Chart
 Microsoft Excel 2010 Chapter 1 Creating a Worksheet and an Embedded Chart Objectives Describe the Excel worksheet Enter text and numbers Use the Sum button to sum a range of cells Copy the contents of
My Awesome Presentation Exercise
 My Awesome Presentation Exercise Part One: Creating a Photo Album 1. Click on the Insert tab. In the Images group click on the Photo Album command. 2. In the Photo Album window that pops up, look in the
Oracle General Navigation Overview
 Oracle 11.5.9 General Navigation Overview 1 Logging On to Oracle Applications You may access Oracle, by logging onto the ATC Applications Login System Status page located at www.atc.caltech.edu/support/index.php
PowerSchool Handbook Federal Survey Card Report
 Handbook Federal Survey Card Report Version 1.0 August 9, 2017 Copyright 2017, San Diego Unified School District. All rights reserved. This document may be reproduced internally by San Diego Unified School
A cell is highlighted when a thick black border appears around it. Use TAB to move to the next cell to the LEFT. Use SHIFT-TAB to move to the RIGHT.
 Instructional Center for Educational Technologies EXCEL 2010 BASICS Things to Know Before You Start The cursor in Excel looks like a plus sign. When you click in a cell, the column and row headings will
GuruFocus User Manual: The FilingWiz
 GuruFocus User Manual: The FilingWiz Contents 0. Introduction to FilingWiz a. Brief overview b. Access 1. The Search Query Toolbox 2. The Search Results Column 3. The Highlights Column a. Highlights tab
Information Technology and Media Services. Office Excel. Charts
 Information Technology and Media Services Office 2010 Excel Charts August 2014 Information Technology and Media Services CONTENTS INTRODUCTION... 1 CHART TYPES... 3 CHOOSING A CHART... 4 CREATING A COLUMN
Adobe Flash CS3 Reference Flash CS3 Application Window
 Adobe Flash CS3 Reference Flash CS3 Application Window When you load up Flash CS3 and choose to create a new Flash document, the application window should look something like the screenshot below. Layers
ME 365 EXPERIMENT 3 INTRODUCTION TO LABVIEW
 ME 365 EXPERIMENT 3 INTRODUCTION TO LABVIEW Objectives: The goal of this exercise is to introduce the Laboratory Virtual Instrument Engineering Workbench, or LabVIEW software. LabVIEW is the primary software
Tutorial: De Novo Assembly of Paired Data
 : De Novo Assembly of Paired Data September 20, 2013 CLC bio Silkeborgvej 2 Prismet 8000 Aarhus C Denmark Telephone: +45 70 22 32 44 Fax: +45 86 20 12 22 www.clcbio.com support@clcbio.com : De Novo Assembly
Double-click on the PowerPoint icon on the desktop. Another way to access the program is to click on the Start button>programs>powerpoint.
 MS PowerPoint 2013 I. About PowerPoint A. What is it? Microsoft PowerPoint is a powerful tool to create professional looking presentations and slide shows. PowerPoint allows you to construct presentations
EDIT202 PowerPoint Lab Assignment Guidelines
 EDIT202 PowerPoint Lab Assignment Guidelines 1. Create a folder named LABSEC-CCID-PowerPoint. 2. Download the PowerPoint-Sample.avi video file from the course WebCT site and save it into your newly created
Graphing Single Subject Research Data. AAC Colloquium October 18 th, 2017
 Graphing Single Subject Research Data AAC Colloquium October 18 th, 2017 Set up the spreadsheet Input the data Graph Harry s data Click and hold, then drag to select Harry s data Just for the top graph
Exercise 5 Animated Excel Charts in PowerPoint
 Exercise 5 Animated Excel Charts in PowerPoint This is a fun exercise to show you how even graphs can become even more interesting if you use multimedia. You will write some slides on your own to summarize
Gloucester County Library System. Excel 2010
 Gloucester County Library System Excel 2010 Introduction What is Excel? Microsoft Excel is an electronic spreadsheet program. It is capable of performing many different types of calculations and can organize
EXCEL 2003 DISCLAIMER:
 EXCEL 2003 DISCLAIMER: This reference guide is meant for experienced Microsoft Excel users. It provides a list of quick tips and shortcuts for familiar features. This guide does NOT replace training or
Spreadsheet Concepts: Creating Charts in Microsoft Excel
 Spreadsheet Concepts: Creating Charts in Microsoft Excel lab 6 Objectives: Upon successful completion of Lab 6, you will be able to Create a simple chart on a separate chart sheet and embed it in the worksheet
While editing a page, a menu bar will appear at the top with the following options:
 Page Editor ===> Page Editor How Can I Use the Page Editor? The Page Editor will be your primary way of editing your website. Page Editor Basics While editing a page, you will see that hovering your mouse
You are to turn in the following three graphs at the beginning of class on Wednesday, January 21.
 Computer Tools for Data Analysis & Presentation Graphs All public machines on campus are now equipped with Word 2010 and Excel 2010. Although fancier graphical and statistical analysis programs exist,
PowerSchool Handbook Federal Survey Form Report
 Handbook Federal Survey Form Report Version 2.1 August 22, 2018 Copyright 2018, San Diego Unified School District. All rights reserved. This document may be reproduced internally by San Diego Unified School
Pre-Lab Excel Problem
 Pre-Lab Excel Problem Read and follow the instructions carefully! Below you are given a problem which you are to solve using Excel. If you have not used the Excel spreadsheet a limited tutorial is given
SolidWorks Intro Part 1b
 SolidWorks Intro Part 1b Dave Touretzky and Susan Finger 1. Create a new part We ll create a CAD model of the 2 ½ D key fob below to make on the laser cutter. Select File New Templates IPSpart If the SolidWorks
Getting Started with. Office 2008
 Getting Started with Office 2008 Copyright 2010 - Information Technology Services Kennesaw State University This document may be downloaded, printed, or copied, for educational use, without further permission
Microsoft Excel 2007 Lesson 7: Charts and Comments
 Microsoft Excel 2007 Lesson 7: Charts and Comments Open Example.xlsx if it is not already open. Click on the Example 3 tab to see the worksheet for this lesson. This is essentially the same worksheet that
Excel 2016: Part 2 Functions/Formulas/Charts
 Excel 2016: Part 2 Functions/Formulas/Charts Updated: March 2018 Copy cost: $1.30 Getting Started This class requires a basic understanding of Microsoft Excel skills. Please take our introductory class,
EXCEL SKILLS. Selecting Cells: Step 1: Click and drag to select the cells you want.
 Selecting Cells: Step 1: Click and drag to select the cells you want. Naming Cells: Viewlet available Step 2: To select different cells that are not next to each other, hold down as you click and
Microsoft Excel is a spreadsheet tool capable of performing calculations, analyzing data and integrating information from different programs.
 About the Tutorial Microsoft Excel is a commercial spreadsheet application, written and distributed by Microsoft for Microsoft Windows and Mac OS X. At the time of writing this tutorial the Microsoft excel
Scribe 4 Manual 2. Scribe 4
 Scribe 4 Manual 2 Scribe 4 Scribe 4 is an optimally flexible data analysis program that permits users to label events in live observations or in QuickTime movies, summarize event timings, and play back
MS Office for Engineers
 MS Office for Engineers Lesson 4 Excel 2 Pre-reqs/Technical Skills Basic knowledge of Excel Completion of Excel 1 tutorial Basic computer use Expectations Read lesson material Implement steps in software
Creating a Worksheet and an Embedded Chart in Excel 2007
 Objectives: Start and quit Excel Describe the Excel worksheet Enter text and numbers Use the Sum button to sum a range of cells Copy the contents of a cell to a range of cells using the fill handle Save
= 3 + (5*4) + (1/2)*(4/2)^2.
 + (1/2)*(4/2)^2.") Physics 100 Lab 1: Use of a Spreadsheet to Analyze Data by Kenneth Hahn and Michael Goggin In this lab you will learn how to enter data into a spreadsheet and to manipulate the data in meaningful ways.
Physics 100 Lab 1: Use of a Spreadsheet to Analyze Data by Kenneth Hahn and Michael Goggin In this lab you will learn how to enter data into a spreadsheet and to manipulate the data in meaningful ways.
Microsoft Excel Important Notice
 Microsoft Excel 2013 Important Notice All candidates who follow an ICDL/ECDL course must have an official ICDL/ECDL Registration Number (which is proof of your Profile Number with ICDL/ECDL and will track
1. Position your mouse over the column line in the column heading so that the white cross becomes a double arrow.
 Excel 2010 Modifying Columns, Rows, and Cells Introduction Page 1 When you open a new, blank workbook, the cells are set to a default size.you do have the ability to modify cells, and to insert and delete
How to Use the Explore Service Area Tool: By Geography.
 How to Use the Explore Service Area Tool: By Geography How to Use the Explore Service Area Tool: By Geography 2 Acronyms Used in This Lesson Acronym UDS ZCTA What It Stands For Uniform Data System ZIP
Annotating a single sequence
 BioNumerics Tutorial: Annotating a single sequence 1 Aim The annotation application in BioNumerics has been designed for the annotation of coding regions on sequences. In this tutorial you will learn how
Statistics with a Hemacytometer
 Statistics with a Hemacytometer Overview This exercise incorporates several different statistical analyses. Data gathered from cell counts with a hemacytometer is used to explore frequency distributions
EXCEL 2007 TIP SHEET. Dialog Box Launcher these allow you to access additional features associated with a specific Group of buttons within a Ribbon.
 EXCEL 2007 TIP SHEET GLOSSARY AutoSum a function in Excel that adds the contents of a specified range of Cells; the AutoSum button appears on the Home ribbon as a. Dialog Box Launcher these allow you to
Chemistry 30 Tips for Creating Graphs using Microsoft Excel
 Chemistry 30 Tips for Creating Graphs using Microsoft Excel Graphing is an important skill to learn in the science classroom. Students should be encouraged to use spreadsheet programs to create graphs.
Office Excel. Charts
 Office 2007 Excel Charts October 2007 CONTENTS INTRODUCTION... 1 Bold text... 2 CHART TYPES... 3 CHOOSING A CHART... 4 CREATING A COLUMN CHART... 5 FORMATTING A COLUMN CHART... 8 Changing the chart style...
1 THE PNP BASIC COMPUTER ESSENTIALS e-learning (MS Powerpoint 2007)
") 1 THE PNP BASIC COMPUTER ESSENTIALS e-learning (MS Powerpoint 2007) 2 THE PNP BASIC COMPUTER ESSENTIALS e-learning (MS Powerpoint 2007) TABLE OF CONTENTS CHAPTER 1: GETTING STARTED... 4 MICROSOFT OFFICE
1 THE PNP BASIC COMPUTER ESSENTIALS e-learning (MS Powerpoint 2007) 2 THE PNP BASIC COMPUTER ESSENTIALS e-learning (MS Powerpoint 2007) TABLE OF CONTENTS CHAPTER 1: GETTING STARTED... 4 MICROSOFT OFFICE
Introduction to MS Office Somy Kuriakose Principal Scientist, FRAD, CMFRI
 Introduction to MS Office Somy Kuriakose Principal Scientist, FRAD, CMFRI Email: somycmfri@gmail.com 29 Word, Excel and Power Point Microsoft Office is a productivity suite which integrates office tools
Microsoft Excel Microsoft Excel
 Excel 101 Microsoft Excel is a spreadsheet program that can be used to organize data, perform calculations, and create charts and graphs. Spreadsheets or graphs created with Microsoft Excel can be imported
User Guide. v7.5. September 4, For the most recent version of this document, visit kcura's Documentation Site.
 User Guide v7.5 September 4, 2013 For the most recent version of this document, visit kcura's Documentation Site. Table of Contents 1 User guide overview 4 2 Relativity objects 4 3 Workspace 6 3.1 Workspaces
MOVING AND COPYING DATA...
 Overview NOTES... 2 OVERVIEW... 3 VIEW THE PROJECT... 5 USING FORMULAS... 6 BASIC EXCEL REVIEW... 6 ENTERING FORMULAS... 7 Typing formulas... 7 Clicking to insert cell references... 7 Using a simple cell
Tutorial: RNA-Seq Analysis Part II (Tracks): Non-Specific Matches, Mapping Modes and Expression measures
: Non-Specific Matches, Mapping Modes and Expression measures") : RNA-Seq Analysis Part II (Tracks): Non-Specific Matches, Mapping Modes and February 24, 2014 Sample to Insight : RNA-Seq Analysis Part II (Tracks): Non-Specific Matches, Mapping Modes and : RNA-Seq Analysis
: RNA-Seq Analysis Part II (Tracks): Non-Specific Matches, Mapping Modes and February 24, 2014 Sample to Insight : RNA-Seq Analysis Part II (Tracks): Non-Specific Matches, Mapping Modes and : RNA-Seq Analysis
YGL 3.0 // The Basics
 YGL 3.0 // The Basics Thank you for your continued support of You ve Got Leads! The following document is intended to help with the many features of the program. Each community may have different features
What s New in Office 2010?
 What s New in Office 2010? General Changes in Office 2010 Applications This document provides a summary of highlighted/significant changes in Office 2010 with simple step-by-step directions for each highlighted
Microsoft Excel 2010 Basic
 Microsoft Excel 2010 Basic Introduction to MS Excel 2010 Microsoft Excel 2010 is a spreadsheet software in the new Microsoft 2010 Office Suite. Excel allows you to store, manipulate and analyze data in
11.1 Create Speaker Notes Print a Presentation Package a Presentation PowerPoint Tips... 44
 Contents 1 Getting Started... 1 1.1 Presentations... 1 1.2 Microsoft Office Button... 1 1.3 Ribbon... 2 1.4 Mini Toolbar... 2 1.5 Navigation... 3 1.6 Slide Views... 4 2 Customize PowerPoint... 5 2.1 Popular...
SolidWorks 2½D Parts
 SolidWorks 2½D Parts IDeATe Laser Micro Part 1b Dave Touretzky and Susan Finger 1. Create a new part In this lab, you ll create a CAD model of the 2 ½ D key fob below to make on the laser cutter. Select
COPYRIGHTED MATERIAL. Making Excel More Efficient
 Making Excel More Efficient If you find yourself spending a major part of your day working with Excel, you can make those chores go faster and so make your overall work life more productive by making Excel
Chapter 6 Formatting Graphic Objects
 Impress Guide Chapter 6 OpenOffice.org Copyright This document is Copyright 2007 by its contributors as listed in the section titled Authors. You can distribute it and/or modify it under the terms of either
Gloucester County Library System EXCEL 2007
 Gloucester County Library System EXCEL 2007 Introduction What is Excel? Microsoft E x c e l is an electronic s preadsheet program. I t is capable o f performing many diff e r e n t t y p e s o f c a l
This book is about using Microsoft Excel to
 Introducing Data Analysis with Excel This book is about using Microsoft Excel to analyze your data. Microsoft Excel is an electronic worksheet you can use to perform mathematical, financial, and statistical
Technical Documentation Version 7.3 Output
 Technical Documentation Version 7.3 Output These documents are copyrighted by the Regents of the University of Colorado. No part of this document may be reproduced, stored in a retrieval system, or transmitted
Piktochart 101 Create your first infographic in 15 minutes
 Piktochart 101 Create your first infographic in 15 minutes TABLE OF CONTENTS 01 Getting Started 5 Steps to Creating Your First Infographic in 15 Minutes 1.1 Pick a Template 1.2 Click Create and Start Adding
Workbooks & Worksheets. Getting Started. Formatting. Formulas & Functions
 1 Getting Started Cells Workbooks & Worksheets Formatting Formulas & Functions Chart Printing 2 Getting Started Start a spreadsheet program Recognize the spreadsheet screen layout Use the ribbon,quick
Exhibitor Software User s Manual. Exhibitor Software V
 Exhibitor Software User s Manual Exhibitor Software V1.0.1 090908 1 Contents 1. Exhibitor Software 2. Installation 3. Using Exhibitor Program 3.1 Starting the Program 3.2 Logging in to the Program 3.3
Lab 4 Importing Data and Basic Graphs
 Lab 4 Importing Data and Basic Graphs Often we will find data that is not in an excel format. This data could be in text format, or an alternate spreadsheet or database format, and therefore needs to be
Nintex Reporting 2008 Help
 Nintex Reporting 2008 Help Last updated: Thursday, 24 December 2009 1 Using Nintex Reporting 2008 1.1 Chart Viewer Web Part 1.2 Importing and Exporting Reports 1.3 Import Nintex report page 1.4 Item Level