MoVis. Movie Recommendation and Visualization. CPSC 547 Infomation Visualization Project Presentation. Ye Chen & Yujie Yang 2015/12/15
|
|
|
- Antony Norman
- 6 years ago
- Views:
Transcription

1 MoVis Movie Recommendation and Visualization CPSC 547 Infomation Visualization Project Presentation Ye Chen & Yujie Yang 2015/12/15 1
2 Outline Introduction Why - Tasks What - Data How Demo Conclusion Limitations/comments Appendix 2
3 Introduction Do you like to watch movies? But how do you find a movie? 3
4 Introduction Some good websites to find a good movie to watch imdb Criticker No live website uses visualization tool to show movie data No live website provides overview of cooperation of actors and directors 4


5 Introduction - related works Some websites show movies in lists Fig. 1 imdb top rated movies page(from Fig. 2 Criticker recommendation page(from http: // 5

![3 FilmFinder [1] features tightly coupled interactive filtering, where the result of moving](/docs-images/71/65628757/images/6-1.jpg "sliders and pressing buttons is immediately reflected in the visual encoding Fig.")
6 Introduction - related works FilmFinder has no live demo Musicovery is a live website related to what we do Fig. 3 FilmFinder [1] features tightly coupled interactive filtering, where the result of moving sliders and pressing buttons is immediately reflected in the visual encoding Fig. 4 Musicovery shows a scatterplot-based visualization to find music(from 6

7 Introduction - related works Some of our ideas also come from this co-author graph Fig. 5 Co-author graph of Tamara on Microsoft academic research(from 7
8 Why - Tasks Task 1: explore some good movies based on users preference. Task 2: explore users interested actors/directors and find relevant good movies. 8
9 What - Data Raw data 30k+ rows of movie data from imdb Pro Selected data for MoVis website 4997-row table filtered from raw data by rate >= 7 4 ordered attributes: runtime, boxoffice, rate, release date 5 categorical attributes: genre, country, language, director, actors To help build the website: movie poster link, movie imdb page link, actor/director picture link 9
10 How Task 1: find some good movies based on users preference. Solution: Movie Scatterplot Tools: HTML, javascript and d3 Task 2: explore users interested actors/directors and find relevant good movies. Solution: Actor/director Network Tools: HTML, javascript and d3 10
11 Demo 11
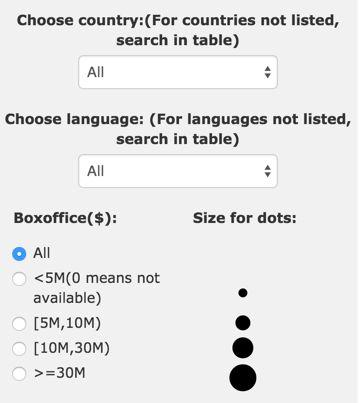
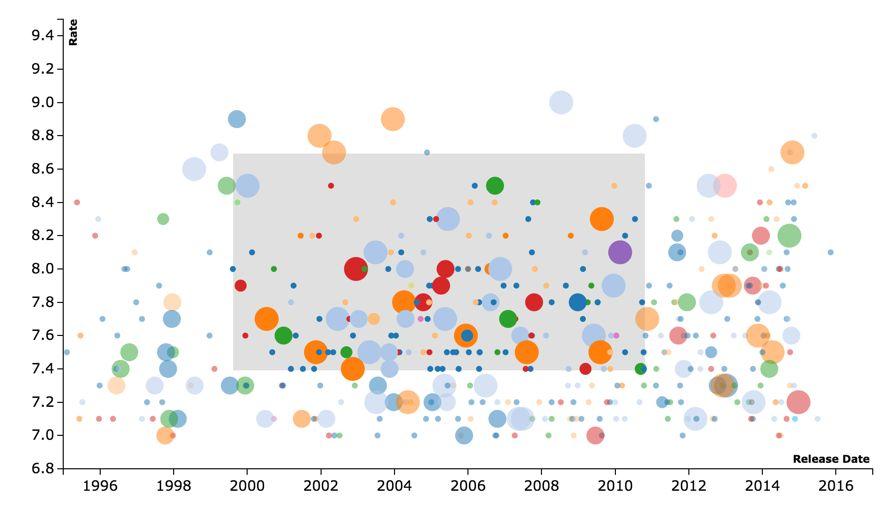
12 Attribute Encoding - Movie Scatterplot Page Attribute Type Scale Release Date Ordinal Rating Data Sample Channel Role in system 1996 to 2016 year 2015/12/15 Spatial region Scatterplot(x axis) Quatitative Spatial region Scatterplot(y axis) Runtime Quatitative min Position on common Filter scale/length Country Categorical Dozens United States Filter Language Categorical Dozens English Filter Boxoffice Quatitative Millions 10M USD Not directly show Not directly show Boxoffice class (derived attribute) Ordinal Four [5M,10M) Size Filter Genre Categorical Dozens Action Action Adventure Color hue Horizontal histogram; Filter Movie count per genre (derived attribute) Quatitative Dozens thousands Action: 456 movies Width of the bins Horizontal histogram; filter 12
13 What-Why-How - Movie Scatterplot Page System MoVis movie scatterplot page What: Data Table: four ordered attributes(runtime, boxoffice, rate, release date), three categorical attributes(genre, country, language) What: Derived Derived table: one ordered attribute(boxoffice class), one quantitative value attribue(item count per genre) Why: Tasks Find items by users preference of attributes How: Encode Scatterplot; horizontal histogram; table How: Facet Multiform; overview-detail; linked highlighting How: Reduce Item filtering How: Embed Popup window with details How: Manipulate Constrained(brush) Scale Items: thousands 13
14 Attribute Encoding - Actor/Director Network Page Attribute Type Scale Data Sample Channel Role in system Movie item Categorical 4997 Martian Nodes Nodes Actors Categorical Anne Hathaway Nodes Nodes Directors Categorical 3797 Lone Scherfig Nodes Nodes Nodes (derived attribute) Categorical hundreds See appendix Spatial region Nodes Links (derived attribute) hundreds See appendix Line Links Categorical 14
15 What-Why-How - Actor/Director Network Page System MoVis actor/director network page What: Data Table(three attributes: movie name, actors, directors) What: Derived Networks(movies/actors/directors as nodes; relationship of actors/directors and movies as links) Why: Tasks Explore relavant nodes How: Encode Node-Link diagram; list How: Search Search actors/directors name How: Embed Popup window with details How: Manipulate Drag; double click actors/directors to jump to his/her network; double click movies to show details in popup window Scale Nodes: hundreds; links: hundreds 15
16 Conclusion Contribution Designed MoVis website Designed a scatterplot-based visualization tool to show movie data, with filters for different attributes Designed a network-based visualization tool to show cooperation of actors and directors, as well as their products Lessons learned Web implementation skills D3 and different visualization tools Deal with different design choices as designers Happy teamwork! 16
17 Limitations/comments Movie scatterplot page Manipulation: brush VS zoom Movies with multiple genres - encode the first genre into color, but other solutions? Filtering works slow for larger dataset Actor/director network page Search is a bit slow Lack of some pictures For future Limited movie dataset - we will need to update our data to maintain this website 17
18 Thank you for listening! Reference [1] Ahlberg C, Shneiderman B. Visual information seeking using the filmfinder[c]//conference companion on Human factors in computing systems. ACM, 1994:
19 Appendix - Movie Scatterplot Page 19

20 Appendix - Filter 20

21 Appendix - Linked highlight 21

22 Appendix - Window pop-up with link to IMDB 22
23 Appendix - Actor/Director Network Page 23

24 Appendix - Window pop-up with link to IMDB 24
MoVis Movie Recommendation and Visualization
 MoVis Movie Recommendation and Visualization Introduction CPSC 547 Infomation Visualization Project Ye Chen clara.yechen@gmail.com Yujie Yang yangyujie.hust@gmail.com Nowadays, movies becomes a popular
cs6964 February TABULAR DATA Miriah Meyer University of Utah
 cs6964 February 23 2012 TABULAR DATA Miriah Meyer University of Utah cs6964 February 23 2012 TABULAR DATA Miriah Meyer University of Utah slide acknowledgements: John Stasko, Georgia Tech Tamara Munzner,
Ch 13: Reduce Items and Attributes Ch 14: Embed: Focus+Context
 Ch 13: Reduce Items and Attributes Ch 14: Embed: Focus+Context Tamara Munzner Department of Computer Science University of British Columbia CPSC 547, Information Visualization Day 15: 28 February 2017
Week 4: Facet. Tamara Munzner Department of Computer Science University of British Columbia
 Week 4: Facet Tamara Munzner Department of Computer Science University of British Columbia JRNL 520M, Special Topics in Contemporary Journalism: Visualization for Journalists Week 4: 6 October 2015 http://www.cs.ubc.ca/~tmm/courses/journ15
Information Visualization - Introduction
 Information Visualization - Introduction Institute of Computer Graphics and Algorithms Information Visualization The use of computer-supported, interactive, visual representations of abstract data to amplify
5. Interaction with Visualizations Dynamic linking, brushing and filtering in Information Visualization displays
 5. Interaction with Visualizations Dynamic linking, brushing and filtering in Information Visualization displays Vorlesung Informationsvisualisierung Prof. Dr. Andreas Butz, WS 20011/12 Konzept und Basis
Chap 12: Facet Into Multiple Views Paper: Multiform Matrices and Small Multiples
 Chap 12: Facet Into Multiple Views Paper: Multiform Matrices and Small Multiples Tamara Munzner Department of Computer Science University of British Columbia CPSC 547: Information Visualization Mon Oct
Visualization of EU Funding Programmes
 Visualization of EU Funding Programmes 186.834 Praktikum aus Visual Computing WS 2016/17 Daniel Steinböck January 28, 2017 Abstract To fund research and technological development, not only in Europe but
Adding a RSS Feed Custom Widget to your Homepage
 Adding a RSS Feed Custom Widget to your Homepage The first, and often hardest, task is to decide which blog or news source you wish to bring into your Avenue course. Once you have selected a blog or news
Introduction to Minitab 1
 Introduction to Minitab 1 We begin by first starting Minitab. You may choose to either 1. click on the Minitab icon in the corner of your screen 2. go to the lower left and hit Start, then from All Programs,
Personalized Movie Database System
 Grand Valley State University ScholarWorks@GVSU Technical Library School of Computing and Information Systems 2015 Personalized Movie Database System Jayaprakash Garaga Grand Valley State University Follow
Week 6: Networks, Stories, Vis in the Newsroom
 Week 6: Networks, Stories, Vis in the Newsroom Tamara Munzner Department of Computer Science University of British Columbia JRNL 520H, Special Topics in Contemporary Journalism: Data Visualization Week
Projekt 1 Ausarbeitung
 Projekt 1 Ausarbeitung Truong Vinh Phan Support for Interactive Visual Analytics in Various Software Packages Fakultät Technik und Informatik Department Informatik Faculty of Engineering and Computer Science
Sharing Interactive Web Reports from JMP
 Sharing Interactive Web Reports from JMP The past twenty years have seen a parade of competing technologies to support interactive web pages. Finally, the industry has standardized on one technology, and
Rich Web UI made simple Building Data Dashboards without Code
 Rich Web UI made simple Building Data Dashboards without Code Dana Singleterry http://blogs.oracle.com/dana Product Manager Oracle JDeveloper and Oracle ADF 2 Copyright 2012, Oracle and/or its affiliates.
Interactive Graphics for Statistics
 Interactive Graphics for Statistics Principles & Examples martin.theus@math.uni-augsburg.de 2 Graphics in Statistics: Diagnostics vs. Analysis Continuous Data 2 Graphics in Statistics: Diagnostics vs.
Video Storage Tool User Manual
 Video Storage Tool User Manual Video Storage Tool is designed to calculate the required number of the deployed DVR/NVRs and the HDDs intelligently and synchronously. The total storage space required can
Nobody uploads till yesterday, difficult?
 Survey Result 1 Assignment II! Nobody uploads till yesterday, difficult? 2 Last Week: Text Visualization 3 Interaction IV Course Spring 14 Graduate Course of UCAS April 4th, 2014 4 InfoVis Pipeline Visualization
Lecture 6: Statistical Graphics
 Lecture 6: Statistical Graphics Information Visualization CPSC 533C, Fall 2009 Tamara Munzner UBC Computer Science Mon, 28 September 2009 1 / 34 Readings Covered Multi-Scale Banking to 45 Degrees. Jeffrey
DataView Features. Input Data Formats. Current Release
 DataView Features Input Data Formats STDF, ATDF NI-CSV, generic CSV, others WAT (fab parameters) Open Compressed (GZip) versions of any of the above Merge data files of any of the above types Link to existing
Construction Change Order analysis CPSC 533C Analysis Project
 Construction Change Order analysis CPSC 533C Analysis Project Presented by Chiu, Chao-Ying Department of Civil Engineering University of British Columbia Problems of Using Construction Data Hybrid of physical
Interaction. CS Information Visualization. Chris Plaue Some Content from John Stasko s CS7450 Spring 2006
 Interaction CS 7450 - Information Visualization Chris Plaue Some Content from John Stasko s CS7450 Spring 2006 Hello. What is this?! Hand back HW! InfoVis Music Video! Interaction Lecture remindme.mov
Getting To Know The Multiform Bivariate Matrix
 Getting To Know The Multiform Bivariate Matrix 1: Introduction A manipulable matrix is a generic component that can accept a variety of representation forms as elements. Some example elements include bivariate
Visual Analytics Tools for the Global Change Assessment Model. Ross Maciejewski Arizona State University
 Visual Analytics Tools for the Global Change Assessment Model Ross Maciejewski Arizona State University GCAM Simulation After running thousands or even hundreds of simulations through GCAM this process
Chapter 2 Assignment (due Thursday, April 19)
") (due Thursday, April 19) Introduction: The purpose of this assignment is to analyze data sets by creating histograms and scatterplots. You will use the STATDISK program for both. Therefore, you should
(due Thursday, April 19) Introduction: The purpose of this assignment is to analyze data sets by creating histograms and scatterplots. You will use the STATDISK program for both. Therefore, you should
2.3 Organizing Quantitative Data
 2.3 Organizing Quantitative Data This section will focus on ways to organize quantitative data into tables, charts, and graphs. Quantitative data is organized by dividing the observations into classes
Visual Encoding Design
 CSE 442 - Data Visualization Visual Encoding Design Jeffrey Heer University of Washington Last Time: Data & Image Models The Big Picture task questions, goals assumptions data physical data type conceptual
Dynamic Aggregation to Support Pattern Discovery: A case study with web logs
 Dynamic Aggregation to Support Pattern Discovery: A case study with web logs Lida Tang and Ben Shneiderman Department of Computer Science University of Maryland College Park, MD 20720 {ltang, ben}@cs.umd.edu
Microsoft Excel 2016 / 2013 Basic & Intermediate
 Microsoft Excel 2016 / 2013 Basic & Intermediate Duration: 2 Days Introduction Basic Level This course covers the very basics of the Excel spreadsheet. It is suitable for complete beginners without prior
Designing a track in Adams/Car:
 Warning: Remember to change your working directory before you begin this lesson. If you do not, Adams may not work correctly. Also remember to move everything you wish to keep from the working directory
Chapter 2 Assignment (due Thursday, October 5)
") (due Thursday, October 5) Introduction: The purpose of this assignment is to analyze data sets by creating histograms and scatterplots. You will use the STATDISK program for both. Therefore, you should
(due Thursday, October 5) Introduction: The purpose of this assignment is to analyze data sets by creating histograms and scatterplots. You will use the STATDISK program for both. Therefore, you should
Temporal, Geographical and Categorical Aggregations Viewed through Coordinated Displays: A Case Study with Highway Incident Data
 Temporal, Geographical and Categorical Aggregations Viewed through Coordinated Displays: A Case Study with Highway Incident Data Anna Fredrikson, Chris North, Catherine Plaisant, Ben Shneiderman Human-Computer
Overview. Principal Product Manager Oracle JDeveloper & Oracle ADF
 Rich Web UI made simple an ADF Faces Overview Dana Singleterry Dana Singleterry Principal Product Manager Oracle JDeveloper & Oracle ADF Agenda Comparison: New vs. Old JDeveloper Provides JSF Overview
Forces acting at a point
 Forces acting at a point Introduction This software has been designed to provide visual representations of the addition of vectors and can be used to show the concept of a polygon of forces. It allows
Statistical Tables and Graphs
 Unit 5C Statistical Tables and Graphs Ms. Young Slide 5-1 Frequency Tables A basic frequency table has two columns: The first column lists the categories of data. The second column lists the frequency
Pentaho BioMe App Demo. Installation, Access & Usage Instructions
 Pentaho BioMe App Demo Installation, Access & Usage Instructions Project SDR Target Pentaho 5.4 Version 1.0 Date Jun 2015 Content 1. Overview of BioMe App Demo. Technology and Access Overview 2. Local
Plot and Look! Trust your Data more than your Models
 Titel Author Event, Date Affiliation Plot and Look! Trust your Data more than your Models martin@theusrus.de Telefónica O2 Germany Augsburg University 2 Outline Why use Graphics for Data Analysis? Foundations
ODK Tables Graphing Tool
 ODK Tables Graphing Tool Nathan Brandes, Gaetano Borriello, Waylon Brunette, Samuel Sudar, Mitchell Sundt Department of Computer Science and Engineering University of Washington, Seattle, WA [USA] {nfb2,
LAB 1 INSTRUCTIONS DESCRIBING AND DISPLAYING DATA
 LAB 1 INSTRUCTIONS DESCRIBING AND DISPLAYING DATA This lab will assist you in learning how to summarize and display categorical and quantitative data in StatCrunch. In particular, you will learn how to
Keynote 08 Basics Website:
 Website: http://etc.usf.edu/te/ Keynote is Apple's presentation application. Keynote is installed as part of the iwork suite, which also includes the word processing program Pages and the spreadsheet program
Multidimensional (Multivariate)
") Multidimensional (Multivariate) Data Visualization IV Course Spring 14 Graduate Course of UCAS May 9th, 2014 1 Data by Dimensionality 1-D (Linear, Set and Sequences) SeeSoft, Info Mural 2-D (Map) GIS,
Multidimensional (Multivariate) Data Visualization IV Course Spring 14 Graduate Course of UCAS May 9th, 2014 1 Data by Dimensionality 1-D (Linear, Set and Sequences) SeeSoft, Info Mural 2-D (Map) GIS,
Exploratory data analysis with one and two variables
 Exploratory data analysis with one and two variables Instructions for Lab # 1 Statistics 111 - Probability and Statistical Inference DUE DATE: Upload on Sakai on July 10 Lab Objective To explore data with
Computational Intelligence Meets the NetFlix Prize
 Computational Intelligence Meets the NetFlix Prize Ryan J. Meuth, Paul Robinette, Donald C. Wunsch II Abstract The NetFlix Prize is a research contest that will award $1 Million to the first group to improve
Sema Foundation ICT Department. Lesson - 18
 Lesson - 18 1 Manipulating Windows We can work with several programs at a time in Windows. To make working with several programs at once very easy, we can change the size of the windows by: maximize minimize
Week 5: Manipulate, Facet, Reduce Demo: Text
 Week 5: Manipulate, Facet, Reduce Demo: Text Tamara Munzner Department of Computer Science University of British Columbia JRNL 520M, Special Topics in Contemporary Journalism: Visualization for Journalists
Welcome to Book Display Widgets
 Welcome to Book Display Widgets Book Display Widgets allow you to create virtual book displays on your website, where covers link to that item s record in your catalog. As a subscriber to Ebook Central
V-BOX Cloud Configuration
 V-BOX Cloud Configuration Website: http://www.we-con.com.cn/en Technical Support: support@we-con.com.cn Skype: fcwkkj Phone: 86-591-87868869 QQ: 1043098682 Technical forum: http://wecon.freeforums.net/
SAVI Advanced The Basics
 SAVI Advanced The Basics Help Topics The Basics Getting Started System Requirements Getting Started Using SAVI Advanced Exploring the Data in SAVI Advanced Viewing Change Over Time Identifying Target Geographies
Premiere Pro Desktop Layout (NeaseTV 2015 Layout)
") Premiere Pro 2015 1. Contextually Sensitive Windows - Must be on the correct window in order to do some tasks 2. Contextually Sensitive Menus 3. 1 zillion ways to do something. No 2 people will do everything
Premiere Pro 2015 1. Contextually Sensitive Windows - Must be on the correct window in order to do some tasks 2. Contextually Sensitive Menus 3. 1 zillion ways to do something. No 2 people will do everything
Address Bar. Application. The space provided on a web browser that shows the addresses of websites.
 Address Bar The space provided on a web browser that shows the addresses of websites. Application Computer software designed to help users perform Specific tasks. Back Button A button at the top of the
Blue Form Builder extension for Magento 2
 Blue Form Builder extension for Magento 2 User Guide Version 1.0 Table of Contents I) Introduction......5 II) General Configurations....6 1) General Settings.....7 2) ReCaptcha... 8 III) Manage Forms......
Center for Faculty Development and Support Creating Powerful and Accessible Presentation
 Creating Powerful and Accessible Presentation PowerPoint 2007 Windows Tutorial Contents Create a New Document... 3 Navigate in the Normal View (default view)... 3 Input and Manipulate Text in a Slide...
Information Visualization. Overview. What is Information Visualization? SMD157 Human-Computer Interaction Fall 2003
 INSTITUTIONEN FÖR SYSTEMTEKNIK LULEÅ TEKNISKA UNIVERSITET Information Visualization SMD157 Human-Computer Interaction Fall 2003 Dec-1-03 SMD157, Information Visualization 1 L Overview What is information
Concepts and basics Of Websites
 Unit One Ministry Of Education Concepts and basics Of Websites Computer and Information Technology 6 Ministry of Education Objective General Objective To identify the content of website Specific Objectives
Introduction Accessing MICS Compiler Learning MICS Compiler CHAPTER 1: Searching for Data Surveys Indicators...
 Acknowledgement MICS Compiler is a web application that has been developed by UNICEF to provide access to Multiple Indicator Cluster Survey data. The system is built on DevInfo technology. 3 Contents Introduction...
Ch 12: Facet Across Multiple Views Paper: BallotMaps
 Ch 12: Facet Across Multiple Views Paper: BallotMaps Tamara Munzner Department of Computer Science University of British Columbia CPSC 547, Information Visualization Day 13: 14 February 2017 http://www.cs.ubc.ca/~tmm/courses/547-17
Making Science Graphs and Interpreting Data
 Making Science Graphs and Interpreting Data Eye Opener: 5 mins What do you see? What do you think? Look up terms you don t know What do Graphs Tell You? A graph is a way of expressing a relationship between
Interactive Visualization
 Interactive Visualization Cecilia R. Aragon I247 UC Berkeley 15 March 2010 Acknowledgments Thanks to slides and publications by Marti Hearst, Tamara Munzner, Colin Ware, Ben Shneiderman, George Furnas
A Web Application to Visualize Trends in Diabetes across the United States
 A Web Application to Visualize Trends in Diabetes across the United States Final Project Report Team: New Bee Team Members: Samyuktha Sridharan, Xuanyi Qi, Hanshu Lin Introduction This project develops
Entry Name: "INRIA-Perin-MC1" VAST 2013 Challenge Mini-Challenge 1: Box Office VAST
 Entry Name: "INRIA-Perin-MC1" VAST 2013 Challenge Mini-Challenge 1: Box Office VAST Team Members: Charles Perin, INRIA, Univ. Paris-Sud, CNRS-LIMSI, charles.perin@inria.fr PRIMARY Student Team: YES Analytic
To return to the Home Page from anywhere within myngconnect, click the Home icon at the top of the screen.
 myngconnect Overview Navigation for Students User Manual Returning to the Home Page To return to the Home Page from anywhere within myngconnect, click the Home icon at the top of the screen. Signing out
Navigate to Success: A Guide to Microsoft Word 2016 For History Majors
 Navigate to Success: A Guide to Microsoft Word 2016 For History Majors Navigate to Success: A Guide to Microsoft Word 2016 for History Majors Navigate to Success: A Guide to Microsoft Word 2016 For History
Welcome to Book Display Widgets
 Welcome to Book Display Widgets Book Display Widgets allow you to create virtual book displays on your website, where covers link to that item s record in your catalog. Bring your own lists of books, or
CS 4460 Intro. to Information Visualization October 18, 2017 John Stasko
 Interaction CS 4460 Intro. to Information Visualization October 18, 2017 John Stasko Learning Objectives Understand how interaction can be used to address fundamental challenges in infovis that cannot
Audio Boo- Web Based Audio Recorder for Blogs/Wikis
 Audio Boo- Web Based Audio Recorder for Blogs/Wikis Record, upload and get code for short audio files -5 minute maximum It also has an app for the iphone and Android smart phones for convenience. Sign
This guide will show you how to create a basic multi-media PowerPoint presentation containing text, graphics, charts, and audio/video elements.
 This guide will show you how to create a basic multi-media PowerPoint presentation containing text, graphics, charts, and audio/video elements. Before starting the steps outlined in this guide, it is recommended
SAMLab Tip Sheet #4 Creating a Histogram
 Creating a Histogram Another great feature of Excel is its ability to visually display data. This Tip Sheet demonstrates how to create a histogram and provides a general overview of how to create graphs,
IDFinder: Data Visualization for Checking Re-identifiability in Microdata
 IDFinder: Data Visualization for Checking Re-identifiability in Microdata Hyunmo Kang Human Computer Interaction Lab., Department of Computer Science, University of Maryland at College Park kang@cs.umd.edu
A Domain-Customizable SVG-Based Graph Editor for Software Visualizations
 A Domain-Customizable SVG-Based Graph Editor for Software Visualizations Tony Lin, Feng Zou, Holger M. Kienle and Hausi A. Müller University of Victoria, Canada {gaoyun,fzou,kienle,hausi}@cs.uvic.ca Abstract
Week 4: Manipulate, Facet, Reduce
 Week 4: Manipulate, Facet, Reduce Tamara Munzner Department of Computer Science University of British Columbia JRNL 520H, Special Topics in Contemporary Journalism: Data Visualization Week 4: 4 October
PowerPoint Quick-Start. Table of Contents. How to Get Help. Information Technology
 PowerPoint 2010 Quick-Start View the Office 2010 Quick-Start for information on the general changes that apply to all Office programs. This table of contents is interactive. Click on an item to jump to
January- March,2016 ISSN NO
 USER INTERFACES FOR INFORMATION RETRIEVAL ON THE WWW: A PERSPECTIVE OF INDIAN WOMEN. Sunil Kumar Research Scholar Bhagwant University,Ajmer sunilvats1981@gmail.com Dr. S.B.L. Tripathy Abstract Information
TNM093 Tillämpad visualisering och virtuell verklighet. Jimmy Johansson C-Research, Linköping University
 TNM093 Tillämpad visualisering och virtuell verklighet Jimmy Johansson C-Research, Linköping University Introduction to Visualization New Oxford Dictionary of English, 1999 visualize - verb [with obj.]
The Fundamentals. Document Basics
 3 The Fundamentals Opening a Program... 3 Similarities in All Programs... 3 It's On Now What?...4 Making things easier to see.. 4 Adjusting Text Size.....4 My Computer. 4 Control Panel... 5 Accessibility
Applied Statistics for the Behavioral Sciences
 Applied Statistics for the Behavioral Sciences Chapter 2 Frequency Distributions and Graphs Chapter 2 Outline Organization of Data Simple Frequency Distributions Grouped Frequency Distributions Graphs
Working with Microsoft Excel. Touring Excel. Selecting Data. Presented by: Brian Pearson
 Working with Microsoft Excel Presented by: Brian Pearson Touring Excel Menu bar Name box Formula bar Ask a Question box Standard and Formatting toolbars sharing one row Work Area Status bar Task Pane 2
MS Office for Engineers
 MS Office for Engineers Lesson 4 Excel 2 Pre-reqs/Technical Skills Basic knowledge of Excel Completion of Excel 1 tutorial Basic computer use Expectations Read lesson material Implement steps in software
MGMT 3125 Introduction to Data Visualization
 MGMT 3125 Introduction to Data Visualization John Sokol, MS Week 2 1/30/2019 Chapter 2: Choose an effective visual Agenda Chapter 2: Choose an effective visual Introduction to Tableau Week 2 action items
3D Capture. 3D Capture. 3D Capture. 3D Capture. Real-world
 Real-world Need at least two cameras, commonly on side-by-side Plug-in the Minoru 3D webcam Right-click the Minoru icons to see a list of options. Set the mode to use Side-by-Side with Left first. Set
A guide to XiT. Main user interface of XiT
 A guide to XiT XiT stands for Xdimensional image analysis Toolbox. It is a tool written in Matlab (R2015b, The MathWorks, Inc., Natick, Massachusetts, United States), which enables performing multidimensional
Glyphs. Presentation Overview. What is a Glyph!? Cont. What is a Glyph!? Glyph Fundamentals. Goal of Paper. Presented by Bertrand Low
 Presentation Overview Glyphs Presented by Bertrand Low A Taxonomy of Glyph Placement Strategies for Multidimensional Data Visualization Matthew O. Ward, Information Visualization Journal, Palmgrave,, Volume
Information Visualization. SWE 432, Fall 2016 Design and Implementation of Software for the Web
 Information Visualization SWE 432, Fall 2016 Design and Implementation of Software for the Web Today What types of information visualization are there? Which one should you choose? What does usability
Step 4 Part B - How to Edit Video on YouTube with Enhancements. You click on Enhancements at the top to add other features and next is what happens.
 Step 4 Part B - How to Edit Video on YouTube with Enhancements You click on Enhancements at the top to add other features and next is what happens. You see Enhancements highlighted and it starts playing
DSC 201: Data Analysis & Visualization
 DSC 201: Data Analysis & Visualization Exploratory Data Analysis Dr. David Koop What is Exploratory Data Analysis? "Detective work" to summarize and explore datasets Includes: - Data acquisition and input
Chapter 5. Creating Special Effects Delmar, Cengage Learning
 Chapter 5 Creating Special Effects 2011 Delmar, Cengage Learning Chapter 5 Lessons 1. Create a mask effect 2. Add sound 3. Add video 4. Create an animated navigation bar 5. Create character animations
Pop-ups from Thumbnails CyberText Consulting Pty Ltd. Rhonda Bracey
 Pop-ups from Thumbnails CyberText Consulting Pty Ltd Rhonda Bracey Printed on 21 October, 2003 i Contents Creating a pop-up link to a full size graphic from a thumbnail 3 Why do this?...3 1. Create a
Labels and Envelopes in Word 2013
 Labels and Envelopes in Word 2013 Labels... 2 Labels - A Blank Page... 2 Selecting the Label Type... 2 Creating the Label Document... 2 Labels - A Page of the Same... 3 Printing to a Specific Label on
1 User Guide. 1 Main screen
 1 User Guide 1 Main screen The opening screen appears in figure 1. Please wait until the loading bar (as shown in the bottom left) has filled up and the text changed from loading to completed. From the
Organizing and Summarizing Data
 Section 2.2 9 Organizing and Summarizing Data Section 2.2 C H A P T E R 2 4 Example 2 (pg. 72) A Histogram for Discrete Data To create a histogram, you have two choices: 1): enter all the individual data
Opening and Using Programs
 Conventions used in this document: Keyboard keys that must be pressed will be shown as Enter or Ctrl. Controls to be activated with the mouse will be shown as Start button > Settings > System > About.
Facet: Multiple View Methods
 Facet: Multiple View Methods Large Data Visualization Torsten Möller Overview Combining views Partitioning Coordinating Multiple Side-by-Side Views Encoding Channels Shared Data Shared Navigation Synchronized
The American University in Cairo. Academic Computing Services. Excel prepared by. Maha Amer
 The American University in Cairo Excel 2000 prepared by Maha Amer Spring 2001 Table of Contents: Opening the Excel Program Creating, Opening and Saving Excel Worksheets Sheet Structure Formatting Text
Histogram Design. VU Visualisation and Visual Data Analysis Milestone 4 Pavares Paul Charoenchaipiyakul Milán Kolki Lachezar Valkov
 VU Visualisation and Visual Data Analysis Milestone 4 Pavares Paul Charoenchaipiyakul Milán Kolki Lachezar Valkov Outline Project Description Persona User Tasks Prototypes Final Version Live Demo Improvements
Handling Multi-Dimensional Data
 Handling Multi-Dimensional Data Advanced Technology Development Group Gray Cancer Institute Data, data, everybody wants more data. In our cell biology work investigating the mechanisms of cancer we find
Statistical graphics in analysis Multivariable data in PCP & scatter plot matrix. Paula Ahonen-Rainio Maa Visual Analysis in GIS
 Statistical graphics in analysis Multivariable data in PCP & scatter plot matrix Paula Ahonen-Rainio Maa-123.3530 Visual Analysis in GIS 11.11.2015 Topics today YOUR REPORTS OF A-2 Thematic maps with charts
Relay Online How To:
 Relay Online How To: ---------------------------------------- Event Announcements Page --------------------------------------- The Event Announcements page is a great way to share upcoming meetings, fundraisers
Requirements Document
 GROUP 9 Requirements Document Create-A-Page Matthew Currier, John Campbell, and Dan Martin 5/1/2009 This document is an outline of what was originally desired in the application in the Project Abstract,
Design Guidelines: Windows. Computer users need to consult multiple sources rapidly. They require the adoption of multiplewindow display strategy.
 Design Guidelines: Windows Computer users need to consult multiple sources rapidly. They require the adoption of multiplewindow display strategy. Design Challenge for Multiple- Window Strategy Offer users
Multidimensional Interactive Visualization
 Multidimensional Interactive Visualization Cecilia R. Aragon I247 UC Berkeley Spring 2010 Acknowledgments Thanks to Marti Hearst, Tamara Munzner for the slides Spring 2010 I 247 2 Today Finish panning
EEG Based Detection of Area of Interest in a Web Page
 EEG Based Detection of Area of Interest in a Web Page Divya Bansal, Joy Bose, Ankit Kumar Web Solutions Samsung R&D Institute India- Bangalore Bangalore, India divya.bansal@snapdeal.com, {joy.bose, ankit2.kumar}@samsung.com