Information Visualization. SWE 432, Fall 2016 Design and Implementation of Software for the Web
|
|
|
- Kristina Foster
- 6 years ago
- Views:
Transcription

1 Information Visualization SWE 432, Fall 2016 Design and Implementation of Software for the Web
2 Today What types of information visualization are there? Which one should you choose? What does usability mean for information visualizations? Cool reference from NYT on election visualization: upshot/many-ways-to-map-election-results.html? _r=0 2
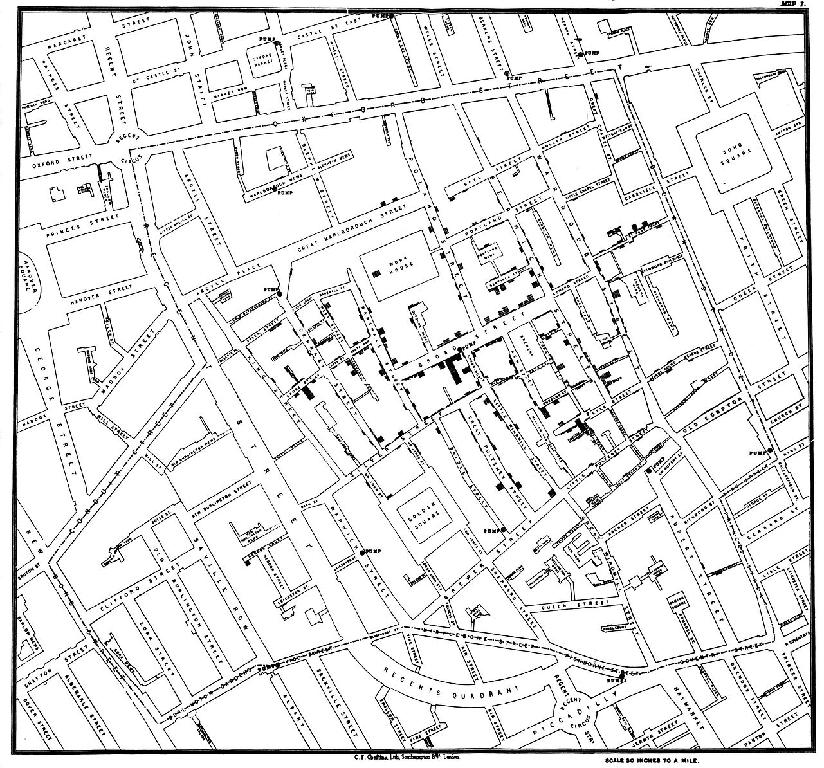
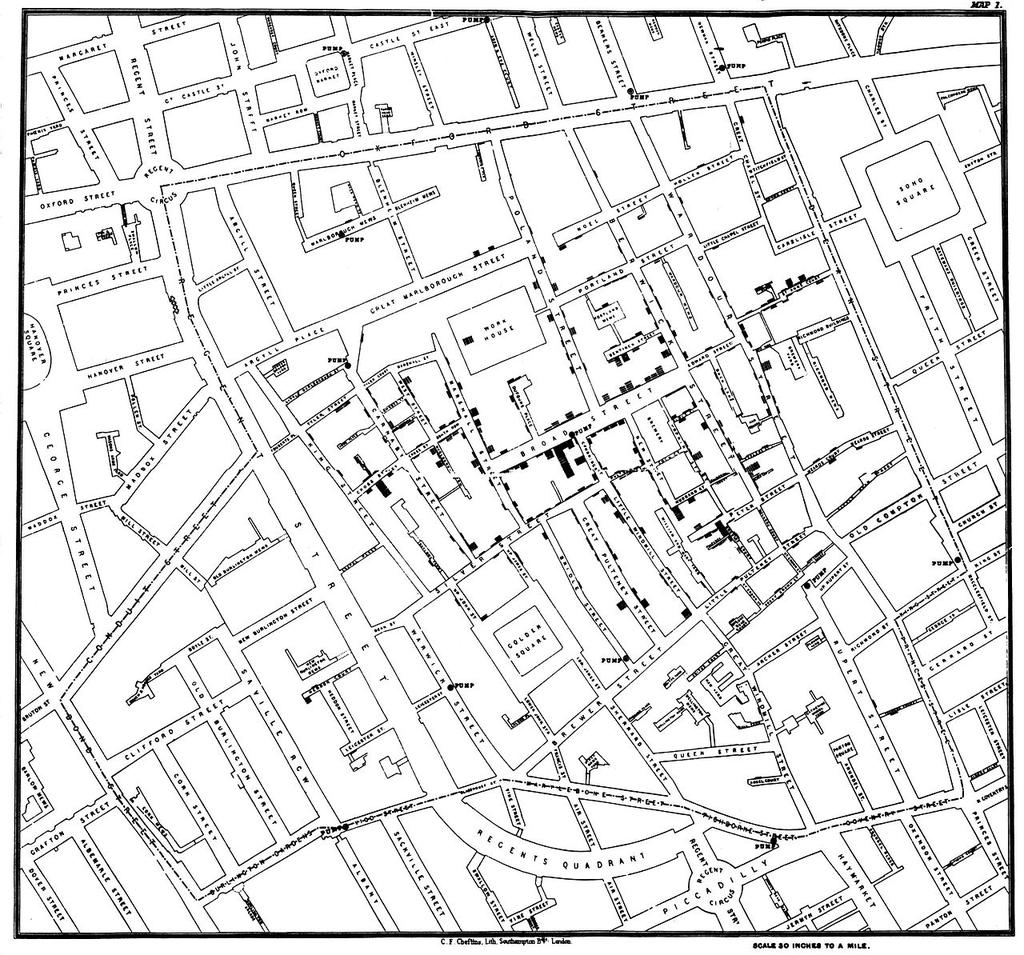
3 Recall: Cholera Epidemic in London, 1854 >500 fatal attacks of cholera in 10 days Concentrated in Broad Street area of London Many died in a few hours Dominant theory of disease: caused by noxious odors Afflicted streets deserted by >75% inhabitants 3
4 4
5 5
6 Investigation and aftermath Based on visualization, did case by case investigation Found that 61 / 83 positive identified as using well water from Broad Street pump Board ordered pump-handle to be removed from well Epidemic soon ended Solved centuries old question of how cholera spread 6
7 Methods used by Snow Placed data in appropriate context for assessing cause & effect Plotted on map, included well location Reveals proximity as cause Made quantitative comparisons Fewer deaths closer to brewery, could investigate cause Considered alternative explanations & contrary cases Investigated cases not close to pump, often found connection to pump Assessment of possible errors in numbers 7

8 How information visualization amplifies cognition Increased resrouces High bandwidth hierarchical 8
9 Mapping data to visual form
10 Designing an information visualization 10
11 Types of raw data Nominal - unordered set Ordinal - ordered set Quantitative - numeric range 11
12 Data transformations Classing / binning: Quantitative > ordinal Maps ranges onto classes of variables Can also count # of items in each class w/ histogram Sorting: Nominal > ordinal Add order between items in sets Descriptive statistics: mean, average, median, max, min, 12
13 Visual structures 3 components spatial substrate marks marks graphical properties 13
 14")
14 Spatial substrate Axes that divide space Types of axes - unstructured, nominal, ordinal, quantitative Composition - use of multiple orthogonal axes (e.g., 2D scatterplot, 3D) 14

15 Folding continuing an axis by continuing in different space 15
16 Marks Points (0D) Lines (1D) Areas (2D) Volumes (3D) 16
, Nominal (N) Filled circle - good; open circle -")
17 Marks graphical properties Quantitative (Q), Ordinal (O), Nominal (N) Filled circle - good; open circle - bad 17
, Nominal (N) Filled circle - good; open circle -")
18 Effectiveness of graphical properties Quantitative (Q), Ordinal (O), Nominal (N) Filled circle - good; open circle - bad 18
19 Animation Visualization can change over time Could be used to encode data as a function of time But often not effective as makes direct comparisons hard Can be more effective to animate transition from before to after as user configures visualization 19
20 Examples of visualizations
21 Time-series data

22 Stacked graph Supports visual summation of multiple components 22

23 Small multiples supports separate comparison of data series may have better legibility than placing all in single plot 23
24 Maps

25 Choropleth map Groups data by area, maps to color 25

26 Cartograms Encodes two variables w/ size & color 26
27 Hierarchies

28 Node link diagram 28

29 Dendrogram leaf nodes of hierarchy on edges of circle 29

30 Treemaps 30
31 Networks
32 Force-directed layout edges function as springs, find least energy configuration 32

33 Arc diagram can support identifying cliques & bridges w/ right order 33

34 Adjacency matrix 34
35 Design considerations
36 Tufte s principles of graphical excellence show the data induce the viewer to think about the substance rather than the methodology avoid distorting what the data have to say present many numbers in a small space make large data sets coherent encourage the eye to compare different pieces of data reveal data at several levels of detail, from overview to fine structure serve reasonable clear purpose: description, exploration, tabulation, decoration 36
37 Distortions in visualizations Visualizations may distort the underlying data, making it harder for reader to understand truth Use of design variation to try to falsely communicate data variation 37

38 Example $(11,014) LaToza/Bell GMU SWE 432 Fall
39 Example 39
40 Example (corrected) 40

41 Example 41

42 Traditional Electoral Map 42

43 Weighted Electoral Map 43
44 Data-ink Data-ink - non-redundant ink encoding data information 44


45 Examples of data-ink ratio ~
46 Design principles for data-ink (a.k.a. aesthetics & minimalism / elegance & simplicity) Above all else show the data Erase non-data-ink, within reason Often not valuable and distracting Redundancy not usually useful 46

47 Example 47
")
48 Example (revised) 48
49 Interacting with visualizations
50 Interactive visualizations Users often use iterative process of making sense of the data Answers lead to new questions Interactivity helps user constantly change display of information to answer new questions Should offer visualization that offers best view of data moment to moment as desired view changes 50
51 Shneiderman s visualization tasks Overview: gain an overview of entire collection Zoom: zoom in on items of interest Filter: filter out uninteresting items Details on demand: select an item or group and get details Relate: view relationships between items History: support undo, replay, progressive refinement Extract: allow extraction of sub-collections through queries 51
52 In Class Activity
53 Design an information visualization In groups of 2 or 3 Select a set of data to visualize and two or more representative questions to answer using this data Design an interactive information visualization Create sketches showing the design of the information visualization Should have multiple views of data, interactions to configure and move between views 53
Information Visualization in Data Mining. S.T. Balke Department of Chemical Engineering and Applied Chemistry University of Toronto
 Information Visualization in Data Mining S.T. Balke Department of Chemical Engineering and Applied Chemistry University of Toronto Motivation Data visualization relies primarily on human cognition for
Tufte s Design Principles
 Tufte s Design Principles CS 7450 - Information Visualization January 27, 2004 John Stasko HW 2 - Minivan Data Vis What people did Classes of solutions Data aggregation, transformation Tasks - particular
Envisioning Information. Tufte s Design Principles. James Eagan
 Envisioning Information Tufte s Design Principles James Eagan Adapted from slides by John Stasko Graphical excellence is the well-designed presentation of interesting data a matter of substance, of statistics,
DEPARTMENT OF COMPUTER SCIENCE UNIVERSITY OF TORONTO CSC318S THE DESIGN OF INTERACTIVE COMPUTATIONAL MEDIA. Lecture March 1998
 DEPARTMENT OF COMPUTER SCIENCE UNIVERSITY OF TORONTO CSC318S THE DESIGN OF INTERACTIVE COMPUTATIONAL MEDIA Lecture 19 30 March 1998 PRINCIPLES OF DATA DISPLAY AND VISUALIZATION 19.1 Nature, purpose of
visualizing q uantitative quantitative information information
 visualizing quantitative information visualizing quantitative information martin krzywinski outline best practices of graphical data design data-to-ink ratio cartjunk circos the visual display of quantitative
Chapter 3. Determining Effective Data Display with Charts
 Chapter 3 Determining Effective Data Display with Charts Chapter Introduction Creating effective charts that show quantitative information clearly, precisely, and efficiently Basics of creating and modifying
Information Visualization Course
 Information Visualization Course Informatica Umanistica Università di Pisa Lecture 2 Design Principles 3 rd March 2011 Emanuele Ruffaldi PERCRO - Scuola Superiore S.Anna Overview Graphical Integrity Design
Information Visualization - Introduction
 Information Visualization - Introduction Institute of Computer Graphics and Algorithms Information Visualization The use of computer-supported, interactive, visual representations of abstract data to amplify
Lecture Slides. Elementary Statistics Twelfth Edition. by Mario F. Triola. and the Triola Statistics Series. Section 2.1- #
 Lecture Slides Elementary Statistics Twelfth Edition and the Triola Statistics Series by Mario F. Triola Chapter 2 Summarizing and Graphing Data 2-1 Review and Preview 2-2 Frequency Distributions 2-3 Histograms
Information Visualization
 Information Visualization Introduction Inspired from Petra Isenberg petra.isenberg@inria.fr Why INFORMATION VISUALIZATION It is estimated that 800 exabyte (800x 10^19) of digital information will be generated
Glyphs. Presentation Overview. What is a Glyph!? Cont. What is a Glyph!? Glyph Fundamentals. Goal of Paper. Presented by Bertrand Low
 Presentation Overview Glyphs Presented by Bertrand Low A Taxonomy of Glyph Placement Strategies for Multidimensional Data Visualization Matthew O. Ward, Information Visualization Journal, Palmgrave,, Volume
Why Should We Care? More importantly, it is easy to lie or deceive people with bad plots
 Plots & Graphs Why Should We Care? Everyone uses plots and/or graphs But most people ignore or are unaware of simple principles Default plotting tools (or default settings) are not always the best More
Multivariate Data & Tables and Graphs. Agenda. Data and its characteristics Tables and graphs Design principles
 Topic Notes Multivariate Data & Tables and Graphs CS 7450 - Information Visualization Aug. 27, 2012 John Stasko Agenda Data and its characteristics Tables and graphs Design principles Fall 2012 CS 7450
Multivariate Data & Tables and Graphs. Agenda. Data and its characteristics Tables and graphs Design principles
 Multivariate Data & Tables and Graphs CS 7450 - Information Visualization Aug. 24, 2015 John Stasko Agenda Data and its characteristics Tables and graphs Design principles Fall 2015 CS 7450 2 1 Data Data
University of Florida CISE department Gator Engineering. Visualization
 Visualization Dr. Sanjay Ranka Professor Computer and Information Science and Engineering University of Florida What is visualization? Visualization is the process of converting data (information) in to
Multivariate Data & Tables and Graphs
 Multivariate Data & Tables and Graphs CS 4460/7450 - Information Visualization Jan. 13, 2009 John Stasko Agenda Data and its characteristics Tables and graphs Design principles Spring 2009 CS 4460/7450
Making Science Graphs and Interpreting Data
 Making Science Graphs and Interpreting Data Eye Opener: 5 mins What do you see? What do you think? Look up terms you don t know What do Graphs Tell You? A graph is a way of expressing a relationship between
Cartographic Principles: Map design
 MSc GIS: GIS Algorithms and Data Structures Cartographic Principles: Map design Martin Dodge (m.dodge@ucl.ac.uk) With Changes by Dan Ryan http://www.casa.ucl.ac.uk/martin/msc_gis/ some (scientific) rules
WCSD/NUES Educational Technology Animation
 Animation verification for you and your peer reviewer Animation (Frames, Flash, or Edge) Animation: Understand and control the timeline Explain the makeup of the objects (fill and line) Import graphics
Raw Data. Statistics 1/8/2016. Relative Frequency Distribution. Frequency Distributions for Qualitative Data
 Statistics Raw Data Raw data is random and unranked data. Organizing Data Frequency distributions list all the categories and the numbers of elements that belong to each category Frequency Distributions
Information Visualization
 Information Visualization Introduction Petra Isenberg petra.isenberg@inria.fr After today you will have gained an overview of the research area learned basic principles of data representation and interaction
2.4-Statistical Graphs
 2.4-Statistical Graphs Frequency Polygon: A frequency polygon uses line segments connected to points directly above class midpoint values. Example: Given the following frequency table for the pulse rate
Outline. 14. Query, Measurement, and Transformation. Spatial analysis. Definitions. The Snow map. What is spatial analysis?
 Outline 14. Query, Measurement, and Transformation What is spatial analysis? Transformations Geographic Information Systems and Science SECOND EDITION Paul A. Longley, Michael F. Goodchild, David J. Maguire,
Lecture 5: DATA MAPPING & VISUALIZATION. November 3 rd, Presented by: Anum Masood (TA)
") 1/59 Lecture 5: DATA MAPPING & VISUALIZATION November 3 rd, 2017 Presented by: Anum Masood (TA) 2/59 Recap: Data What is Data Visualization? Data Attributes Visual Attributes Mapping What are data attributes?
1/59 Lecture 5: DATA MAPPING & VISUALIZATION November 3 rd, 2017 Presented by: Anum Masood (TA) 2/59 Recap: Data What is Data Visualization? Data Attributes Visual Attributes Mapping What are data attributes?
TDWI strives to provide course books that are contentrich and that serve as useful reference documents after a class has ended.
 Previews of TDWI course books offer an opportunity to see the quality of our material and help you to select the courses that best fit your needs. The previews cannot be printed. TDWI strives to provide
Visual Encoding Design
 CSE 442 - Data Visualization Visual Encoding Design Jeffrey Heer University of Washington Review: Expressiveness & Effectiveness / APT Choosing Visual Encodings Assume k visual encodings and n data attributes.
cs6964 March TREES & GRAPHS Miriah Meyer University of Utah
 cs6964 March 1 2012 TREES & GRAPHS Miriah Meyer University of Utah cs6964 March 1 2012 TREES & GRAPHS Miriah Meyer University of Utah slide acknowledgements: Hanspeter Pfister, Harvard University Jeff
Visualization Re-Design
 CS448B :: 28 Sep 2010 Visualization Re-Design Last Time: Data and Image Models Jeffrey Heer Stanford University The Big Picture Taxonomy task data physical type int, float, etc. abstract type nominal,
TNM093 Tillämpad visualisering och virtuell verklighet. Jimmy Johansson C-Research, Linköping University
 TNM093 Tillämpad visualisering och virtuell verklighet Jimmy Johansson C-Research, Linköping University Introduction to Visualization New Oxford Dictionary of English, 1999 visualize - verb [with obj.]
Visual Encoding Design
 CSE 442 - Data Visualization Visual Encoding Design Jeffrey Heer University of Washington Last Time: Data & Image Models The Big Picture task questions, goals assumptions data physical data type conceptual
3 Information Visualization
 3 Information Visualization 3.1 Motivation and Examples 3.2 Basics of Human Perception 3.3 Principles and Concepts 3.4 Standard Techniques for Visualization 3.5 Further Examples Literature: E. Tufte: The
Information Visualization. Overview. What is Information Visualization? SMD157 Human-Computer Interaction Fall 2003
 INSTITUTIONEN FÖR SYSTEMTEKNIK LULEÅ TEKNISKA UNIVERSITET Information Visualization SMD157 Human-Computer Interaction Fall 2003 Dec-1-03 SMD157, Information Visualization 1 L Overview What is information
Visualization as an Analysis Tool: Presentation Supplement
 Visualization as an Analysis Tool: Presentation Supplement This document is a supplement to the presentation Visualization as an Analysis Tool given by Phil Groce and Jeff Janies on January 9, 2008 as
Bar Charts and Frequency Distributions
 Bar Charts and Frequency Distributions Use to display the distribution of categorical (nominal or ordinal) variables. For the continuous (numeric) variables, see the page Histograms, Descriptive Stats
Interaction Techniques. SWE 432, Fall 2016 Design and Implementation of Software for the Web
 Interaction Techniques SWE 432, Fall 2016 Design and Implementation of Software for the Web Today What principles guide the design of usable interaction techniques? How can interaction designs help support
Facet: Multiple View Methods
 Facet: Multiple View Methods Large Data Visualization Torsten Möller Overview Combining views Partitioning Coordinating Multiple Side-by-Side Views Encoding Channels Shared Data Shared Navigation Synchronized
Graph/Network Visualization
 Graph/Network Visualization Data model: graph structures (relations, knowledge) and networks. Applications: Telecommunication systems, Internet and WWW, Retailers distribution networks knowledge representation
Interaction Techniques. SWE 432, Fall 2017 Design and Implementation of Software for the Web
 Interaction Techniques SWE 432, Fall 2017 Design and Implementation of Software for the Web Today What principles guide the design of usable interaction techniques? How can interaction designs help support
Software Visualization. Mircea Lungu
 Software Visualization Mircea Lungu John Snow! The lines on the buildings are proportional to the number of deaths due to cholera from those buildings.! Do you know how did Snow realize which was the cause
Chapter 5. Understanding and Comparing Distributions. Copyright 2012, 2008, 2005 Pearson Education, Inc.
 Chapter 5 Understanding and Comparing Distributions The Big Picture We can answer much more interesting questions about variables when we compare distributions for different groups. Below is a histogram
SAS Visual Analytics 8.2: Getting Started with Reports
 SAS Visual Analytics 8.2: Getting Started with Reports Introduction Reporting The SAS Visual Analytics tools give you everything you need to produce and distribute clear and compelling reports. SAS Visual
GRAPHING BAYOUSIDE CLASSROOM DATA
 LUMCON S BAYOUSIDE CLASSROOM GRAPHING BAYOUSIDE CLASSROOM DATA Focus/Overview This activity allows students to answer questions about their environment using data collected during water sampling. Learning
Today s Hall of Fame and Shame is a comparison of two generations of Google Advanced Search. This is the old interface.
 1 Today s Hall of Fame and Shame is a comparison of two generations of Google Advanced Search. This is the old interface. 2 And this is the new interface. (If you can t read the image, go to http://www.google.com/advanced_search.)
Statistical graphics in analysis Multivariable data in PCP & scatter plot matrix. Paula Ahonen-Rainio Maa Visual Analysis in GIS
 Statistical graphics in analysis Multivariable data in PCP & scatter plot matrix Paula Ahonen-Rainio Maa-123.3530 Visual Analysis in GIS 11.11.2015 Topics today YOUR REPORTS OF A-2 Thematic maps with charts
Table of Contents (As covered from textbook)
") Table of Contents (As covered from textbook) Ch 1 Data and Decisions Ch 2 Displaying and Describing Categorical Data Ch 3 Displaying and Describing Quantitative Data Ch 4 Correlation and Linear Regression
Table of Contents (As covered from textbook) Ch 1 Data and Decisions Ch 2 Displaying and Describing Categorical Data Ch 3 Displaying and Describing Quantitative Data Ch 4 Correlation and Linear Regression
INFORMATION VISUALIZATION Introduction. Petra Isenberg
 INFORMATION VISUALIZATION Introduction Petra Isenberg petra.isenberg@inria.fr INSTRUCTOR DR. PETRA ISENBERG petra.isenberg@inria.fr OFFICE Digiteo Moulon Building + OFFICE HOURS By appointment ? YOU! QUICK
EDWARD TUFTE. The Visual Display of Quantitative Information. Envisioning Information. Edward Tufte
 EDWARD TUFTE The Leonardo da Vinci of data. -The New York Times The Visual Display of Quantitative Information Envisioning Information Edward Tufte Edward Tufte Background Info Visual Display of Quantitative
data visualization Show the Data Snow Month skimming deep waters
 data visualization skimming deep waters Show the Data Snow 2 4 6 8 12 Minimize Distraction Minimize Distraction Snow 2 4 6 8 12 2 4 6 8 12 Make Big Data Coherent Reveal Several Levels of Detail 1974 1975
3. Multidimensional Information Visualization I Concepts for visualizing univariate to hypervariate data
 3. Multidimensional Information Visualization I Concepts for visualizing univariate to hypervariate data Vorlesung Informationsvisualisierung Prof. Dr. Andreas Butz, WS 2011/12 Konzept und Basis für n:
Week 7 Picturing Network. Vahe and Bethany
 Week 7 Picturing Network Vahe and Bethany Freeman (2005) - Graphic Techniques for Exploring Social Network Data The two main goals of analyzing social network data are identification of cohesive groups
DSC 201: Data Analysis & Visualization
 DSC 201: Data Analysis & Visualization Exploratory Data Analysis Dr. David Koop What is Exploratory Data Analysis? "Detective work" to summarize and explore datasets Includes: - Data acquisition and input
Visual Computing. Lecture 2 Visualization, Data, and Process
 Visual Computing Lecture 2 Visualization, Data, and Process Pipeline 1 High Level Visualization Process 1. 2. 3. 4. 5. Data Modeling Data Selection Data to Visual Mappings Scene Parameter Settings (View
3 Visualizing quantitative Information
 Elective in Software and Services (Complementi di software e servizi per la società dell'informazione) Section Information Visualization Numbers of credit : 3 Giuseppe Santucci 3 Visualizing quantitative
The Science of Data Visualization
 Welcome # T C 1 8 The Science of Data Visualization Larry Silverstein Strategic Sales Consultant Tableau Start Your (Visualization) Engines Agenda The science of data visualization Best practices for building
The basic arrangement of numeric data is called an ARRAY. Array is the derived data from fundamental data Example :- To store marks of 50 student
 Organizing data Learning Outcome 1. make an array 2. divide the array into class intervals 3. describe the characteristics of a table 4. construct a frequency distribution table 5. constructing a composite
Learning Objectives for Data Concept and Visualization
 Learning Objectives for Data Concept and Visualization Assignment 1: Data Quality Concept and Impact of Data Quality Summarize concepts of data quality. Understand and describe the impact of data on actuarial
8. Visual Analytics. Prof. Tulasi Prasad Sariki SCSE, VIT, Chennai
 8. Visual Analytics Prof. Tulasi Prasad Sariki SCSE, VIT, Chennai www.learnersdesk.weebly.com Graphs & Trees Graph Vertex/node with one or more edges connecting it to another node. Cyclic or acyclic Edge
STA 570 Spring Lecture 5 Tuesday, Feb 1
 STA 570 Spring 2011 Lecture 5 Tuesday, Feb 1 Descriptive Statistics Summarizing Univariate Data o Standard Deviation, Empirical Rule, IQR o Boxplots Summarizing Bivariate Data o Contingency Tables o Row
IAT 355 Intro to Visual Analytics Graphs, trees and networks 2. Lyn Bartram
 IAT 355 Intro to Visual Analytics Graphs, trees and networks 2 Lyn Bartram Graphs and Trees: Connected Data Graph Vertex/node with one or more edges connecting it to another node Cyclic or acyclic Edge
Understanding and Comparing Distributions. Chapter 4
 Understanding and Comparing Distributions Chapter 4 Objectives: Boxplot Calculate Outliers Comparing Distributions Timeplot The Big Picture We can answer much more interesting questions about variables
CIS 536/636 Introduction to Computer Graphics. Kansas State University. CIS 536/636 Introduction to Computer Graphics
 Visualization, Part 1 of 3: Data (Quantities & Evidence) William H. Hsu Department of Computing and Information Sciences, KSU KSOL course pages: http://bit.ly/hgvxlh / http://bit.ly/evizre Public mirror
IAT 355 Visual Analytics. Animation 2. Lyn Bartram. Many of these slides were borrowed from M. Hearst and J. Heer
 IAT 355 Visual Analytics Animation 2 Lyn Bartram Many of these slides were borrowed from M. Hearst and J. Heer Today A Primer! Things to do when designing your visualization Project concerns Animation
Digital Workshop Center Introduction to Design Fundamentals
 Digital Workshop Center Introduction to Design Fundamentals RELATED CLASSES CONSULTING SERVICES Introduction to Design Fundamentals Digital Workshop Center.com 1 About Digital Workshop Center SKILLS, not
Acquisition Description Exploration Examination Understanding what data is collected. Characterizing properties of data.
 Summary Statistics Acquisition Description Exploration Examination what data is collected Characterizing properties of data. Exploring the data distribution(s). Identifying data quality problems. Selecting
1. Basic Steps for Data Analysis Data Editor. 2.4.To create a new SPSS file
 1 SPSS Guide 2009 Content 1. Basic Steps for Data Analysis. 3 2. Data Editor. 2.4.To create a new SPSS file 3 4 3. Data Analysis/ Frequencies. 5 4. Recoding the variable into classes.. 5 5. Data Analysis/
DSC 201: Data Analysis & Visualization
 DSC 201: Data Analysis & Visualization Visualization Design Dr. David Koop Definition Computer-based visualization systems provide visual representations of datasets designed to help people carry out tasks
STA Module 2B Organizing Data and Comparing Distributions (Part II)
") STA 2023 Module 2B Organizing Data and Comparing Distributions (Part II) Learning Objectives Upon completing this module, you should be able to 1 Explain the purpose of a measure of center 2 Obtain and
STA 2023 Module 2B Organizing Data and Comparing Distributions (Part II) Learning Objectives Upon completing this module, you should be able to 1 Explain the purpose of a measure of center 2 Obtain and
STA Learning Objectives. Learning Objectives (cont.) Module 2B Organizing Data and Comparing Distributions (Part II)
 Module 2B Organizing Data and Comparing Distributions (Part II)") STA 2023 Module 2B Organizing Data and Comparing Distributions (Part II) Learning Objectives Upon completing this module, you should be able to 1 Explain the purpose of a measure of center 2 Obtain and
STA 2023 Module 2B Organizing Data and Comparing Distributions (Part II) Learning Objectives Upon completing this module, you should be able to 1 Explain the purpose of a measure of center 2 Obtain and
Data and Image Models
 CSE 442 - Data Visualization Data and Image Models Jeffrey Heer University of Washington Last Week: Value of Visualization The Value of Visualization Record information Blueprints, photographs, seismographs,
Next Generation HMI/SCADA High Performance HMI
 SESAM 08.09.2016 Next Generation HMI/SCADA High Performance HMI For more information visit us at www.novotek.com Old UI Updated UI New UX User interfaces 1990 Today What s the problem of today? Easy to
STA Rev. F Learning Objectives. Learning Objectives (Cont.) Module 3 Descriptive Measures
 Module 3 Descriptive Measures") STA 2023 Module 3 Descriptive Measures Learning Objectives Upon completing this module, you should be able to: 1. Explain the purpose of a measure of center. 2. Obtain and interpret the mean, median, and
STA 2023 Module 3 Descriptive Measures Learning Objectives Upon completing this module, you should be able to: 1. Explain the purpose of a measure of center. 2. Obtain and interpret the mean, median, and
STK 573 Metode Grafik untuk Analisis dan Penyajian Data
 STK 573 Metode Grafik untuk Analisis dan Penyajian Data Pertemuan 3 4 Penyajian Grafik dari Informasi Tim Dosen: Prof. Dr. Khairil Anwar Notodiputro Dr. Ir. Aji Hamim Wigena Dr. Agus M Soleh Outline Introduction
CP SC 8810 Data Visualization. Joshua Levine
 CP SC 8810 Data Visualization Joshua Levine levinej@clemson.edu Lecture 15 Text and Sets Oct. 14, 2014 Agenda Lab 02 Grades! Lab 03 due in 1 week Lab 2 Summary Preferences on x-axis label separation 10
Vocabulary. 5-number summary Rule. Area principle. Bar chart. Boxplot. Categorical data condition. Categorical variable.
 5-number summary 68-95-99.7 Rule Area principle Bar chart Bimodal Boxplot Case Categorical data Categorical variable Center Changing center and spread Conditional distribution Context Contingency table
Next Generation HMI/SCADA High Performance HMI
 Dau 06.02.2018 Next Generation HMI/SCADA High Performance HMI For more information visit us at www.novotek.com Old UI Updated UI New UX User interfaces 1990 Today What s the problem of today? Easy to put
Sample some Pi Monte. Introduction. Creating the Simulation. Answers & Teacher Notes
 Sample some Pi Monte Answers & Teacher Notes 7 8 9 10 11 12 TI-Nspire Investigation Student 45 min Introduction The Monte-Carlo technique uses probability to model or forecast scenarios. In this activity
Geometric Techniques. Part 1. Example: Scatter Plot. Basic Idea: Scatterplots. Basic Idea. House data: Price and Number of bedrooms
 Part 1 Geometric Techniques Scatterplots, Parallel Coordinates,... Geometric Techniques Basic Idea Visualization of Geometric Transformations and Projections of the Data Scatterplots [Cleveland 1993] Parallel
Theory of Computations Spring 2016 Practice Final Exam Solutions
 1 of 8 Theory of Computations Spring 2016 Practice Final Exam Solutions Name: Directions: Answer the questions as well as you can. Partial credit will be given, so show your work where appropriate. Try
Points Lines Connected points X-Y Scatter. X-Y Matrix Star Plot Histogram Box Plot. Bar Group Bar Stacked H-Bar Grouped H-Bar Stacked
 Plotting Menu: QCExpert Plotting Module graphs offers various tools for visualization of uni- and multivariate data. Settings and options in different types of graphs allow for modifications and customizations
Watershed Sciences 4930 & 6920 GEOGRAPHIC INFORMATION SYSTEMS
 Watershed Sciences 4930 & 6920 GEOGRAPHIC INFORMATION SYSTEMS WATS 4930/6920 WHERE WE RE GOING WATS 6915 welcome to tag along for any, all or none WEEK FIVE Lecture VECTOR ANALYSES Joe Wheaton HOUSEKEEPING
STA 490H1S Initial Examination of Data
 Initial Examination of Data Alison L. Department of Statistics University of Toronto Winter 2011 Course mantra It s OK not to know. Expressing ignorance is encouraged. It s not OK to not have a willingness
What Type Of Graph Is Best To Use To Show Data That Are Parts Of A Whole
 What Type Of Graph Is Best To Use To Show Data That Are Parts Of A Whole But how do you choose which style of graph to use? This page sets They are generally used for, and best for, quite different things.
Introduction to Data Visualization
 Introduction to Data Visualization Author: Nicholas G Reich This material is part of the statsteachr project Made available under the Creative Commons Attribution-ShareAlike 3.0 Unported License: http://creativecommons.org/licenses/by-sa/3.0/deed.en
Grundlagen methodischen Arbeitens Informationsvisualisierung [WS ] Monika Lanzenberger
![Grundlagen methodischen Arbeitens Informationsvisualisierung [WS ] Monika Lanzenberger](/thumbs/96/126572662.jpg "Grundlagen methodischen Arbeitens Informationsvisualisierung [WS ] Monika Lanzenberger") Grundlagen methodischen Arbeitens Informationsvisualisierung [WS0708 01 ] Monika Lanzenberger lanzenberger@ifs.tuwien.ac.at 17. 10. 2007 Current InfoVis Research Activities: AlViz 2 [Lanzenberger et al.,
Grundlagen methodischen Arbeitens Informationsvisualisierung [WS0708 01 ] Monika Lanzenberger lanzenberger@ifs.tuwien.ac.at 17. 10. 2007 Current InfoVis Research Activities: AlViz 2 [Lanzenberger et al.,
Excel Tips and FAQs - MS 2010
 BIOL 211D Excel Tips and FAQs - MS 2010 Remember to save frequently! Part I. Managing and Summarizing Data NOTE IN EXCEL 2010, THERE ARE A NUMBER OF WAYS TO DO THE CORRECT THING! FAQ1: How do I sort my
Visual Analytics. Lecture BigData Analytics. Julian M. Kunkel.
 Visual Analytics Lecture BigData Analytics Julian M. Kunkel julian.kunkel@googlemail.com University of Hamburg / German Climate Computing Center (DKRZ) 2017-10-20 Disclaimer: Big Data software is constantly
Interactive Math Glossary Terms and Definitions
 Terms and Definitions Absolute Value the magnitude of a number, or the distance from 0 on a real number line Addend any number or quantity being added addend + addend = sum Additive Property of Area the
EnvSci360 Computer and Analytical Cartography
 EnvSci360 Computer and Analytical Cartography Lecture 5 Working with Type and Labels Key Points Labels are text that locate and identify features on a map Important for readability & communication EnvSci
Statistical transformations
 Statistical transformations Next, let s take a look at a bar chart. Bar charts seem simple, but they are interesting because they reveal something subtle about plots. Consider a basic bar chart, as drawn
THINKING VISUALLY: AN INTRODUCTION TO DATA & INFORMATION VISUALIZATION
 THINKING VISUALLY: AN INTRODUCTION TO DATA & INFORMATION VISUALIZATION Learning Event for CES Ontario Li Ka Shing Knowledge Institute June 22, 2016 Jesse Carliner ACTING COMMUNICATIONS & REFERENCE LIBRARIAN
cs6964 February TABULAR DATA Miriah Meyer University of Utah
 cs6964 February 23 2012 TABULAR DATA Miriah Meyer University of Utah cs6964 February 23 2012 TABULAR DATA Miriah Meyer University of Utah slide acknowledgements: John Stasko, Georgia Tech Tamara Munzner,
CIS 467/602-01: Data Visualization
 CIS 467/602-01: Data Visualization Tables Dr. David Koop Assignment 2 http://www.cis.umassd.edu/ ~dkoop/cis467/assignment2.html Plagiarism on Assignment 1 Any questions? 2 Recap (Interaction) Important
Introduc)on to Informa)on Visualiza)on
on to Informa)on Visualiza)on") Introduc)on to Informa)on Visualiza)on Seeing the Science with Visualiza)on Raw Data 01001101011001 11001010010101 00101010100110 11101101011011 00110010111010 Visualiza(on Applica(on Visualiza)on on
Introduc)on to Informa)on Visualiza)on Seeing the Science with Visualiza)on Raw Data 01001101011001 11001010010101 00101010100110 11101101011011 00110010111010 Visualiza(on Applica(on Visualiza)on on
CPSC 340: Machine Learning and Data Mining. Density-Based Clustering Fall 2017
 CPSC 340: Machine Learning and Data Mining Density-Based Clustering Fall 2017 Assignment 1 is due Friday. Admin Needs Julie 0.6 (you can use JuliaBox if you can t get Julia/PyPlot working). There was a
Statistical Package for the Social Sciences INTRODUCTION TO SPSS SPSS for Windows Version 16.0: Its first version in 1968 In 1975.
 Statistical Package for the Social Sciences INTRODUCTION TO SPSS SPSS for Windows Version 16.0: Its first version in 1968 In 1975. SPSS Statistics were designed INTRODUCTION TO SPSS Objective About the
The Death Map. Hollins University Visitors 25 October / 63
 The Death Map John Burkardt Information Technology Department Virginia Tech... http://people.sc.fsu.edu/ jburkardt/presentations/,,, death map 2007 vt.pdf Hollins University Visitors 25 October 2007 1
Edge Equalized Treemaps
 Edge Equalized Treemaps Aimi Kobayashi Department of Computer Science University of Tsukuba Ibaraki, Japan kobayashi@iplab.cs.tsukuba.ac.jp Kazuo Misue Faculty of Engineering, Information and Systems University
Practical Data Mining COMP-321B. Tutorial 1: Introduction to the WEKA Explorer
 Practical Data Mining COMP-321B Tutorial 1: Introduction to the WEKA Explorer Gabi Schmidberger Mark Hall Richard Kirkby July 12, 2006 c 2006 University of Waikato 1 Setting up your Environment Before
Perception Maneesh Agrawala CS : Visualization Fall 2013 Multidimensional Visualization
 Perception Maneesh Agrawala CS 294-10: Visualization Fall 2013 Multidimensional Visualization 1 Visual Encoding Variables Position Length Area Volume Value Texture Color Orientation Shape ~8 dimensions?
Lecture 2 Map design. Dr. Zhang Spring, 2017
 Lecture 2 Map design Dr. Zhang Spring, 2017 Model of the course Using and making maps Navigating GIS maps Map design Working with spatial data Geoprocessing Spatial data infrastructure Digitizing File