Creating Dashboards using Web Intelligence
|
|
|
- Jonas Manning
- 6 years ago
- Views:
Transcription


1 September 9 11, 2013 Anaheim, California Creating Dashboards using Web Intelligence Session 8806 Alan Mayer Solid Ground Technologies
2 Agenda Introduction Examining interactive features Graphing relationships Filtering using Input Controls Driving behavior using prompts Masking values using alerts Controlling other documents and blocks Using workspaces Calling reports from other programs Conclusion 3
 Wrote the first BusinessObjects training manuals Over 75 Fortune 1000 customers before company was sold in 2007 Presented at every national conference Founded Solid Ground Technologies in")
3 Introduction Alan Mayer Co-founded Integra Solutions in 1993 Used BusinessObjects since 1992 (Version 2.2) Wrote the first BusinessObjects training manuals Over 75 Fortune 1000 customers before company was sold in 2007 Presented at every national conference Founded Solid Ground Technologies in 2009 Different company same principles Specialize in BusinessObjects consulting and training 4

4 Introduction The focus of this presentation Use available features to build interactive reports Techniques will be shown using sample universes and data Most will work in either XI 3.1 or BI 4.0/ specific techniques will be labeled as such Everything seen today can be downloaded for at-home experimentation 5
")
5 Disclaimer Not proposing to replace other dashboard tools Not the focus of Web Intelligence Other tools are much stronger at visualization With that said, the lines are beginning to blur More web-based controls and graphics being added Fast data sources could process data in near acceptable time (5 10 seconds) 6


6 Thinking Differently About Reports Online reporting has changed Staging and refreshing massive reports not the goal Selecting information on an exception basis is Reports can satisfy this new goal Previous reports or report pieces serve as the building blocks Emphasis on guided discovery vs 7

7 Report Content All queries and reports derived from e-fashion universe Initially installed with the software Available for different databases Rich enough to show most techniques 8

8 Key Expectations Expectations from most dashboard users Response time less than 5 10 seconds ideally Some users will tolerate longer times for REALLY good output The fewer mouse clicks, the better Simplest way to show the desired analysis 9
9 Agenda Introduction Examining interactive features Graphing relationships Filtering using Input Controls Driving behavior using prompts Masking values using alerts Controlling documents and blocks Using workspaces Calling reports from other programs Conclusion 10
10 Examining Interactive Features Focusing on features that report readers use most often Filter Fold Drill The Tracking feature will not be discussed Neat concept shows data changes before / after BUT requires two microcubes (data providers) Twice the resources 11


11 Interactive Features Report Show Regional Revenue by Year Region variable created to group stores by geographic area (East / West). Report breaks placed on Region and Year. Revenue totaled. 12
12 Interactive Controls Use the Interactive Toolbar (BI 4.x) to manipulate a report as a reader: 13

13 Interactive Filtering Use the Filter Bar control to activate online filters Click the drop-down arrows to set the appropriate filter 14
 or horizontal.")
14 Interactive Folding Use the Outline control to display Outline mode and break bars Click the grey arrows or break numbers to fold / unfold Currently works in XI 3.1 BI 4.x only in Design mode Must use breaks within the report for this feature to work. Tabs may be vertical (shown) or horizontal. 15

15 Interactive Drilling Plan the depth to drill using the Query Panel Use the Scope of Analysis Panel to limit the drill depth. This can be done for every navigation path (hierarchy in XI 3.1) 16

16 Interactive Drilling, cont d Use the Drill control to display hyperlinks used for Drilling Use the column header to drill up If the Scope of Analysis Panel was not used, drilling would be determined by the navigation path programmed in the universe 17

17 Interactive Drilling, cont d Skip to any level by right-clicking and choosing Drill By Any block can be drilled on charts as well as tables 18
18 Demonstration 19
19 Agenda Introduction Examining interactive features Graphing relationships Filtering using Input Controls Driving behavior using prompts Masking values using alerts Controlling documents and blocks Using workspaces Calling reports from other programs Conclusion 20


20 Visualizing Relationships Let s start with a simple report showing Revenue by Store 21


21 Column Charts Use a Vertical column chart to show Revenue by Region 22

22 Column Charts, cont d Add Year to the graph to see the annual trend 23


23 Bar Charts Use a Horizontal bar chart to show Store revenues 24

24 Bar Charts, cont d The final result Revenue was sorted to show highest revenues first Right-click on the chart and choose Sort > Sales Revenue > Ascending 25

25 Heat Maps Heat maps can show variations in quarterly revenue Only available in BI 4.x. But don t worry we ll show how to recreate this in XI

26 Tree Maps Tree maps can use size and color to show relationships Only available in BI 4.x. No way to recreate in XI
27 Combined Charts Combined charts allow for different types per data set Look how a line is added to represent Average Revenue Popular technique for showing actual metrics against constants (Budget, SLA, ) 28
28 Demonstration 29
29 Agenda Introduction Examining interactive features Graphing relationships Filtering using Input Controls Driving behavior using prompts Masking values using alerts Controlling documents and blocks Using workspaces Calling reports from other programs Conclusion 30


30 Using Input Controls Input controls can filter any report Entry Field Single Value Radio Button Multi Value Check Box Spinner Slider List List Combo Box 31

31 Creating an Input Control Move to a report page to be filtered Click on the Input Control Button Select New Choose a report object Object from a query or report variable 32
 or many (Multiple Selections) 33")
32 Creating an Input Control, cont d Choose the type of input control The control selected determines if one value is filtered (Simple Selection) or many (Multiple Selections) 33

33 Creating an Input Control, cont d Select the block to be filtered More than one block can be filtered by a single input control 34
34 Demonstration 35
35 Agenda Introduction Examining interactive features Graphing relationships Filtering using Input Controls Driving behavior using prompts Masking values using alerts Controlling documents and blocks Using workspaces Calling reports from other programs Conclusion 36
36 Using Prompts Prompts can be used to drive how the Webi interface looks We ll use prompts to allow report users Sort their data Swap report breaks Reveal layers of visualization Change from tables to charts dynamically Each technique requires a little universe preparation Additional objects will be required 37
37 Dynamic Objects The secret to making prompts dynamic Must be added to the universe Created from metadata rather than tables Cannot use them alone in a query All follow the same IF-Then-Else formula: Prompt sentence', 'A', {X,Y},,,) = X, table1.column1, table2.column2) The conditional function used for IF-THEN-ELSE will vary by database. 38
 Second sort on that object What is sorted can be programmed this way, but the direction of the sort cannot.")
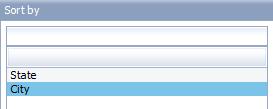
38 Sorting Dynamically First - create the Dynamic Sort object: IIF(@Prompt('Sort by','a',{'state','city'},,,) = 'City', Outlet_Lookup.City, Outlet_Lookup.State) Second sort on that object What is sorted can be programmed this way, but the direction of the sort cannot. 39
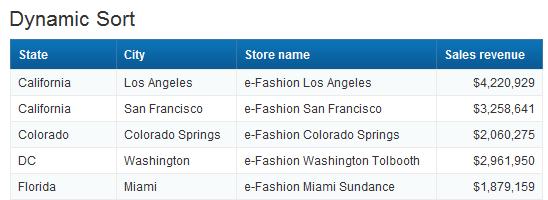
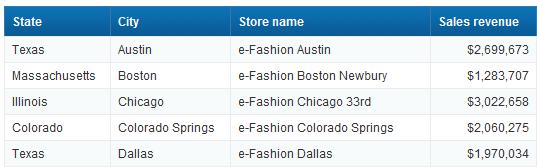
39 Sorting Dynamically, cont d The results: 40
 = 'State', Outlet_Lookup.State, Outlet_Lookup.")
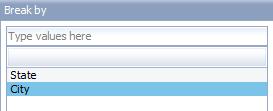
40 Breaking Dynamically First - create the Dynamic Break object: IIF(@Prompt('Break by','a',{'state','city'},,,) = 'State', Outlet_Lookup.State, Outlet_Lookup.City) Second break on that object 41
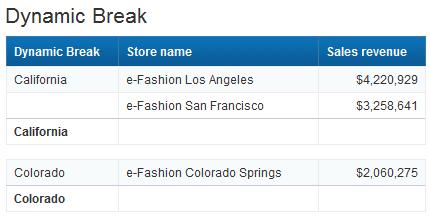
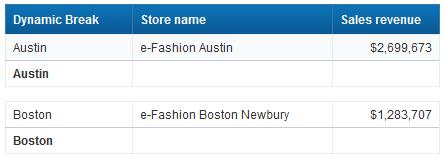
41 Breaking Dynamically, cont d Now to break from the ordinary! 42
42 Display Blocks Dynamically Even blocks can be displayed dynamically Every block can be hidden based on a variable s value That value can be the result of a prompt Blocks can be stacked on top of one another Block 1 Hide if: Layer = 2 Block 2 Hide if: Layer = 1 This idea can be extended to create sets of blocks that appear one layer at a time. 43
43 Dynamic Blocks, cont d This technique is simpler No additional variable needed Universe object is all that s Set the properties of each block (Format > General) 44


44 Dynamic Blocks, cont d This single technique can add great depth to a dashboard 45
45 Demonstration 46
46 Agenda Introduction Examining interactive features Graphing relationships Filtering using Input Controls Driving behavior using prompts Masking values using alerts Controlling documents and blocks Using workspaces Calling reports from other programs Conclusion 47


47 Alerters The Conditional Formatter Alerters can be used to apply formatting based on a condition Reference variables in that condition for even more power Remember that Heat Map input control? You can build your own using alerters! With more control Conditional formatting must be applied in Design mode for BI4.x 48
48 Creating Conditional Variables Variables are like steroids for alerters The complex logic is inside the variable Allows conditions that couldn t be accomplished otherwise Average Quarterly Revenue =Average([Sales revenue]) In([Year];[Quarter]) 49

49 Creating Conditional Rules Let s show which quarters are above or below the average Open the Conditional Alerter Editor Analysis > Conditional > New Rule 50

50 Creating Conditional Rules, cont d Both conditions can be defined by one rule Notice how the Average Quarterly Revenue variable is used. 51

51 The Final Alerter The results are stunning and within your control Ranges for the Input Control heat map cannot be customized as easily. 52
52 Demonstration 53
53 Agenda Introduction Examining interactive features Graphing relationships Filtering using Input Controls Driving behavior using prompts Masking values using alerts Controlling documents and blocks Using workspaces Calling reports from other programs Conclusion 54
54 Going Beyond One Document Sometimes one document isn t enough Only so much screen real estate Users may need additional information at point Makes the original dashboard more dynamic 55
55 Creating Links Documents can be linked to others via prompts Links are created in the source document Those links answer prompts from a second document Source Destination State: City: 56

56 Creating Links, cont d Start with the Origin document Decide which area should be dynamic Cells around that area become the context Context: Year = 2006 Quarter = Q2 Store = e-fashion Austin 57

57 Creating Links, cont d Create a Destination document Add prompts based on the context previously described Any additional detail can be added Format can be graphical or tabular 58
58 Creating Links, cont d Link Source to Destination Right-click on the selected area Linking > Add Document Link 2 Refresh that document 1 Locate the document to link to 3 Map prompts from that document to objects in this one 4 Choose a new or existing window to display 59
59 Drill Between Documents Highlighted cells become hyperlinks Click on any cell to drill to the Destination document 60
60 Demonstration 61
61 Drilling Between Blocks Using Document Links has its drawbacks The Destination document takes an entire window Not easy to navigate back Multiple queries are executed (at least two) In BI 4.x, there is another way Called Element Links One block can be linked to another Regardless of formatting (table, graph, ) The first block filters the second Many advantages Fewer queries More interactivity on the same report page 62


62 Creating Element Links Blocks can be linked to others via objects or variables Same concept as document links Values from the first block control a second block No prompts required Source block Destination block Store = e-fashion Austin Year = 2006 Quarter = Q2 63

63 Creating Element Links, cont d Start by selecting a block Block to link FROM Right-click and choose Linking > Add Element Link Choose the objects to filter the second block 64

64 Creating Element Links, cont d Define the input control Yes element links FILTER so are really input controls Add a name and description 65

65 Creating Element Links, cont d Choose the block that will be filtered 66
66 Demonstration 67
67 Agenda Introduction Examining interactive features Graphing relationships Filtering using Input Controls Driving behavior using prompts Masking values using alerts Controlling documents and blocks Using workspaces Calling reports from other programs Conclusion 68
68 Build the Framework First BusinessObjects BI Workspaces arrange those report pieces Formerly part of Dashboard Builder Creates a frame from which report pieces can be mounted Links can be created between pieces Content links Different than element or document links covered earlier Introduces interaction between reports / pieces Different types of reports and dashboards can be linked What follows are the basics behind creating workspaces 69


69 The Workspace Editor 1 Start the Editor 4 Link those modules together 2 Choose your content as modules 3 Add those modules here 70

70 Adding Content Modules control content Many options to choose from We ll focus on Public reports 71

71 Arranging Content Documents are dragged to the workspace from the Module Library 72


72 Selecting Report Pieces Piece 1 Piece 2 Resize each module and select only the pieces you need 73

 between")
73 Link the Pieces Use Content Linking to define how one module will drive the others 1 Create a connection between modules by dragging 2 Map parameters (prompts) between modules 74
74 Other Workspace Notes Menus can be created Offers more screen real estate Content can be expanded beyond Webi documents Crystal Reports BI Dashboards (Xcelsius) Web sites Other included modules Navigation Control Viewers Custom content 75
75 Demonstration 76
76 Agenda Introduction Examining interactive features Graphing relationships Filtering using Input Controls Driving behavior using prompts Masking values using alerts Controlling other documents and blocks Using workspaces Calling reports from other programs Conclusion 77
77 Launching Reports From Other Programs What about integrating Webi content from existing programs? Other than BI Launch pad, Infoview, Common request for custom portals Custom portal - an HTML application developed by your company The initial user interface is handled from that application All prompt values for the report are gathered, then Webi reports can be refreshed using OpenDocument A BusinessObjects session must be previously established If not, a login window will appear asking for credentials 78
78 Launching Reports, cont d The OpenDocument command looks like a hyperlink What appears below is a sample Argument values in red idocid=aajyahfr9z9gh_bsboiqnzm &sidtype=cuid &stype=wid &srefresh=y &lsmyear=
79 Launching Reports, cont d Document arguments idocid Uniquely identifies the document Example: idocd=aajyahfr9z9gh_bsboiqnzm sdocname Document Name (may not be unique) Example: sdocname=2006+sales sidtype The type of ID supplied (CUID, InfoObjectID) Example: sidtype=cuid stype The type of document (wid = Webi) Example: stype=wid sinstance Opens the latest instance (User, Last, Param) Example: sinstance=last srefresh Refresh the document before viewing (Y, N) Example: srefresh=y 80
80 Launching Reports, cont d Prompt arguments lsc Selects a Universe context Example: lsc=rentals lss<prompt> - Single value for a prompt Example: lssyear=2006 lsm<prompt> One or more values for a prompt Example: lsmcountries=usa;germany lsr<prompt> - Range of values for a prompt Example: lsrdates=[date(2013,07,01)..date(2013,07,15)] 81
81 Launching Reports, cont d Last words of advice Use the plus sign to cover spaces in the URL Example: sdocname=2006+sales Remove any trailing spaces in a prompt Example: Prompt is Choose a year: lsschoose+a+year:= The length of the URL may be limited by the browser Internet Explorer:

82 Demonstration 83
83 Agenda Introduction Examining interactive features Graphing relationships Filtering using Input Controls Driving behavior using prompts Masking values using alerts Controlling documents and blocks Using workspaces Calling reports from other programs Conclusion 84
84 Key Learnings Online reporting is moving towards visualization Report trends or exceptions first Back this up with detailed information when necessary Web Intelligence can satisfy both initiatives Display graphs or summary tables to show the trend Link to detailed graphs or reports to show details Techniques in this presentation showed you how Not a substitute for dedicated dashboard tools 85
85 Questions? Alan Mayer Session 8806 Creating Dashboards using Web Intelligence (office) (mobile) (fax) 86


86 Thank you for participating. Please provide feedback on this session by completing a short survey via the event mobile application. SESSION CODE: 8806 Learn more year-round at
Creating Dashboards using Web Intelligence
 September 9 11, 2013 Anaheim, California Creating Dashboards using Web Intelligence Session 8806 Alan Mayer Solid Ground Technologies Agenda Introduction Examining interactive features Graphing relationships
Advanced Web Intelligence Techniques for Aspiring Jedi Knights
 September 9 11, 2013 Anaheim, California Advanced Web Intelligence Techniques for Aspiring Jedi Knights Alan Mayer Solid Ground Technologies Agenda Introduction Query Techniques Report Techniques Performance
Building reports using the Web Intelligence HTML Report Panel
 Building reports using the Web Intelligence HTML Report Panel Building reports using the Web Intelligence HTML Report Panel Copyright 2008 Business Objects. All rights reserved. Business Objects owns the
Performing on-report analysis with Web Intelligence
 Performing on-report analysis with Web Intelligence BusinessObjects Enterprise XI 3.0 Copyright 2008 Business Objects. All rights reserved. Business Objects owns the following U.S. patents, which may cover
Griffin Training Manual Grif-WebI Introduction (For Analysts)
") Griffin Training Manual Grif-WebI Introduction (For Analysts) Alumni Relations and Development The University of Chicago Table of Contents Chapter 1: Defining WebIntelligence... 1 Chapter 2: Working with
Griffin Training Manual Grif-WebI Introduction (For Analysts) Alumni Relations and Development The University of Chicago Table of Contents Chapter 1: Defining WebIntelligence... 1 Chapter 2: Working with
SAP BusinessObjects Integration Option for Microsoft SharePoint Getting Started Guide
 SAP BusinessObjects Integration Option for Microsoft SharePoint Getting Started Guide SAP BusinessObjects XI3.1 Service Pack 4 Copyright 2011 SAP AG. All rights reserved.sap, R/3, SAP NetWeaver, Duet,
Reading Sample. Creating New Documents and Queries Creating a Report in Web Intelligence Contents. Index. The Authors
 First-hand knowledge. Reading Sample In this sample chapter, you l l start in Chapter 2 by creating your first document and query in SAP BusinessObjects BI. In this process, we ll explore the query panel,
Business Intelligence Launch Pad User Guide SAP BusinessObjects Business Intelligence Platform 4.1 Support Package 1
 Business Intelligence Launch Pad User Guide SAP BusinessObjects Business Intelligence Platform 4.1 Support Package 1 Copyright 2013 SAP AG or an SAP affiliate company. All rights reserved. No part of this
Jim Brogden, Heather Sinkwitz, Dallas Marks, Gabriel Orthous. SAP BusinessObjects Web Intelligence. The Comprehensive Guide. S Galileo Press.
 Jim Brogden, Heather Sinkwitz, Dallas Marks, Gabriel Orthous SAP BusinessObjects Web Intelligence The Comprehensive Guide S Galileo Press Bonn Acknowledgments 21 Foreword 23 1.1 Features of Web Intelligence
SAP BI BO 4.0 Online Training
 WWW.ARANICONSULTING.COM SAP BI BO 4.0 Online Training Arani consulting 2014 A R A N I C O N S U L T I N G, H Y D E R A B A D, I N D I A SAP BI BO 4.0 Training Topics Introduction Datwarehouse concepts
WebIntelligence 4.0 Rich Client: Tips and Tricks From The Master
 WebIntelligence 4.0 Rich Client: Tips and Tricks From The Master 56132 Parkview Shelby Twp, MI 48316 586.677.8300 Phone 586.677.8301 Fax http://www.cttsbi.com Michael Ward Presentation Objectives Reporting
33 Exploring Report Data using Drill Mode
 33 Exploring Report Data using Drill Mode Drill Functionality enables you to explore data by moving up, down and across the dataset(s) held within the document. For example, we have the following data
BI Launch Pad User Guide SAP BusinessObjects Business Intelligence platform 4.0 Support Package 2
 BI Launch Pad User Guide SAP BusinessObjects Business Intelligence platform 4.0 Support Package 2 Copyright 2011 SAP AG. All rights reserved.sap, R/3, SAP NetWeaver, Duet, PartnerEdge, ByDesign, SAP Business
SAP BusinessObjects Live Office User Guide SAP BusinessObjects Business Intelligence platform 4.1 Support Package 2
 SAP BusinessObjects Live Office User Guide SAP BusinessObjects Business Intelligence platform 4.1 Support Package 2 Copyright 2013 SAP AG or an SAP affiliate company. All rights reserved. No part of this
Building Queries with SAP BusinessObjects Web Intelligence Query - HTML
 Building Queries with SAP BusinessObjects Web Intelligence Query - HTML SAP BusinessObjects XI 3.1 Service Pack 4 Copyright 2011 SAP AG. All rights reserved.sap, R/3, SAP NetWeaver, Duet, PartnerEdge,
SAP Crystal Reports and SAP HANA: Options and Opportunities (0301)
") September 9 11, 2013 Anaheim, California SAP Crystal Reports and SAP HANA: Options and Opportunities (0301) Jaclyn Churcher Learning Points Connectivity options to SAP HANA for SAP Crystal Reports Two
September 9 11, 2013 Anaheim, California SAP Crystal Reports and SAP HANA: Options and Opportunities (0301) Jaclyn Churcher Learning Points Connectivity options to SAP HANA for SAP Crystal Reports Two
SharePoint 2010 Site Owner s Manual by Yvonne M. Harryman
 SharePoint 2010 Site Owner s Manual by Yvonne M. Harryman Chapter 9 Copyright 2012 Manning Publications Brief contents PART 1 GETTING STARTED WITH SHAREPOINT 1 1 Leveraging the power of SharePoint 3 2
SAP BW vs. SAP BusinessObjects Web Intelligence Functionalities
 SAP BW vs. SAP BusinessObjects Web Intelligence Functionalities Applies to: SAP BW, SAP BusinessObjects. For more information, visit the Business Objects homepage. Summary This document discusses BW Bex/WAD
4 Introduction to Web Intelligence
 4 Introduction to Web Intelligence Web Intelligence enables you to create documents for reporting, data analysis, and sharing with other users using the BI Launch Pad environment. Querying The required
User Guide. Web Intelligence Rich Client. Business Objects 4.1
 User Guide Web Intelligence Rich Client Business Objects 4.1 2 P a g e Web Intelligence 4.1 User Guide Web Intelligence 4.1 User Guide Contents Getting Started in Web Intelligence 4.1... 5 Log into EDDIE...
How to use the Sales Based Availability Dashboard
 How to use the Sales Based Availability Dashboard Supplier Guide Sept 2017 v1 1 Contents What is Sales Based Availability and why is it important?... 3 How is Sales Based Availability calculated and how
Integration of Webi Reports using SDK into your JSP App
 Integration of Webi Reports using SDK into your JSP App Tom Ray, Daugherty Business Solutions AGENDA 1. The Business Problem 2. Report Engine SDK 3. The BusinessObjects Viewer Samples 4. Demo of Samples
Business Intelligence Launch Pad User Guide SAP BusinessObjects Business Intelligence Platform 4.0 Support Package 5
 Business Intelligence Launch Pad User Guide SAP BusinessObjects Business Intelligence Platform 4.0 Support Package 5 Copyright 2012 SAP AG. All rights reserved.sap, R/3, SAP NetWeaver, Duet, PartnerEdge,
Going Live With Xcelsius - Options, Tricks, and Tips. Jackson Whitfield
 Going Live With Xcelsius - Options, Tricks, and Tips Jackson Whitfield Learning Points Tips on designing an interactive, low maintenance dashboard. Understanding of various connection methods and security
To access BuckIQ, you must first be granted access. Send requests for permission to
 BuckIQ User s Guide Job Aid What is BuckIQ? Several years ago, Oracle took a look at the state of the Business Intelligence industry in terms of the different processes and applications that were required
Style Report Enterprise Edition
 INTRODUCTION Style Report Enterprise Edition Welcome to Style Report Enterprise Edition! Style Report is a report design and interactive analysis package that allows you to explore, analyze, monitor, report,
Power BI Desktop Lab
 Power BI Desktop Lab Fil Schwartz fschwartz@manersolutions.com (517) 323-7500 POWER BI DESKTOP LAB This is a hands on lab for users that have little or no experience with Power BI. We will go through a
Business Intelligence for MYOB User Manual v3.3
 Business Intelligence for MYOB User Manual v3.3 Lite Professional Enterprise BIforMYOB User Manual - 1 - Interactive Reporting Table of Contents Table of Contents... 2 Overview... 4 Chapter 1 - Getting
User Manual instantolap
 User Manual instantolap Version 2.7.0 15.12.2010 Page 2 / 213 instantolap User Manual 2.7.0 instantolap User Manual 2.7.0 Page 3 / 213 Copyright Copyright (C) 2002-2010 Thomas Behrends Softwareentwicklung
Freestyle Reports DW DIG Crosstabs, Hotspots and Exporting
 Exporting a Report You can export a report into other file formats. Acrobat (.pdf) Before exporting a report to.pdf format, make sure the columns in your report provide ample space for their contents.
Designing Adhoc Reports
 Designing Adhoc Reports Intellicus Enterprise Reporting and BI Platform Intellicus Technologies info@intellicus.com www.intellicus.com Copyright 2010 Intellicus Technologies This document and its content
SAS Visual Analytics 8.2: Getting Started with Reports
 SAS Visual Analytics 8.2: Getting Started with Reports Introduction Reporting The SAS Visual Analytics tools give you everything you need to produce and distribute clear and compelling reports. SAS Visual
SAS Web Report Studio 3.1
 SAS Web Report Studio 3.1 User s Guide SAS Documentation The correct bibliographic citation for this manual is as follows: SAS Institute Inc. 2006. SAS Web Report Studio 3.1: User s Guide. Cary, NC: SAS
icts Web Intelligence
 Jim Brogden, Heather Callebaut Sinkwitz, Mac Holden, Dallas Marks, and Gabriel Orthous SAP Business* icts Web Intelligence The Comprehensive Guide Galileo Press Bonn Foreword 19 Acknowledgments 23 1.1
PCB. Summary. Modified by Rob Evans on 8-Oct Parent page: PCB Panels
 PCB Modified by Rob Evans on 8-Oct-2016 Parent page: PCB Panels The PCB panel gives you full access to board objects and items via a filtered browser. Summary The PCB panel allows you to browse the current
BusinessObjects Frequently Asked Questions
 BusinessObjects Frequently Asked Questions Contents Is there a quick way of printing together several reports from the same document?... 2 Is there a way of controlling the text wrap of a cell?... 2 How
CounselLink Reporting. Designer
 CounselLink Reporting Designer Contents Overview... 1 Introduction to the Document Editor... 2 Create a new document:... 2 Document Templates... 3 Datasets... 3 Document Structure... 3 Layout Area... 4
Admissions & Intro to Report Editing Participants Guide
 IBM Cognos Analytics Admissions & Intro to Report Editing Participants Guide Welcome to Cognos - Admissions and Introduction to Report Editing! Today s objectives include: Gain a Basic Understanding of
SyncFirst Standard. Quick Start Guide User Guide Step-By-Step Guide
 SyncFirst Standard Quick Start Guide Step-By-Step Guide How to Use This Manual This manual contains the complete documentation set for the SyncFirst system. The SyncFirst documentation set consists of
Xcelsius Gurus. Dashboard Design Essentials. Presented by: David Lai Date: September 15, 2010
 Xcelsius Gurus Dashboard Design Essentials Presented by: David Lai Date: September 15, 2010 Who are We? Xcelsius Gurus Network #1 source for Xcelsius community related information http://www.everythingxcelsius.com
MICROSOFT Excel 2010 Advanced Self-Study
 MICROSOFT Excel 2010 Advanced Self-Study COPYRIGHT This manual is copyrighted: S&G Training Limited. This manual may not be copied, photocopied or reproduced in whole or in part without the written permission
Innovations in Business Solutions. SAP Analytics, Data Modeling and Reporting Course
 SAP Analytics, Data Modeling and Reporting Course Introduction: This course is design to cover SAP Analytics, Data Modeling and Reporting course content. After completion of this course students can go
User Manual Section 7 Report Module. Report Module
 User Manual Section 7 Report Module Report Module 7. Report Module... 7-1 7.1 Report Module Overview... 7-1 7.1.1 Accessing the Reports Module... 7-1 7.1.2 Navigating within MicroStrategy... 7-2 7.1.3
MY MEDIASITE. https://mediasite.ecu.edu/ms/mymediasite
 MY MEDIASITE https://mediasite.ecu.edu/ms/mymediasite My Mediasite provides tools for managing your recordings. All faculty have access to My Mediasite and the ability to download the Desktop Recorder.
DecisionPoint For Excel
 DecisionPoint For Excel Getting Started Guide 2015 Antivia Group Ltd Notation used in this workbook Indicates where you need to click with your mouse Indicates a drag and drop path State >= N Indicates
Widgets for SAP BusinessObjects Business Intelligence Platform User Guide SAP BusinessObjects Business Intelligence platform 4.1 Support Package 2
 Widgets for SAP BusinessObjects Business Intelligence Platform User Guide SAP BusinessObjects Business Intelligence platform 4.1 Support Package 2 Copyright 2013 SAP AG or an SAP affiliate company. All
USER GUIDE. Forms & Surveys. Schoolwires Centricity
 USER GUIDE Schoolwires Centricity TABLE OF CONTENTS Introduction... 1 Audience and Objectives... 1 Major Components of a Form or Survey... 2 Overview... 2 Manage... 3 New Forms/Surveys... 3 Item Libraries...
Beyond 20/20. Browser - English. Version 7.0, SP3
 Beyond 20/20 Browser - English Version 7.0, SP3 Notice of Copyright Beyond 20/20 Desktop Browser Version 7.0, SP3 Copyright 1992-2006 Beyond 20/20 Inc. All rights reserved. This document forms part of
We start by providing you with an overview of the key feature of the IBM BPM Process Portal.
 Lab 1 Process Portal 1.1 Overview This lab exercise will make you familiar with the key capabilities of the ready-to-use Process Portal included with IBM Business Process Manager (BPM). You will experience
EMS LIVE! CONFERENCE. Reporting on Facility Usage and Utilization. October 17, 2017 Jill Maxwell EMS Implementation Consultant
 EMS LIVE! CONFERENCE Reporting on Facility Usage and Utilization October 17, 2017 Jill Maxwell EMS Implementation Consultant Benefits of Monitoring Facility Usage Maximize space utilization to save costs:
Javelin Workbench Tutorial. Version 3.0 September, 2009
 Javelin Workbench Tutorial Version 3.0 September, 2009 OVERVIEW The Javelin Workbench Beginner Tutorial walks you through the steps of building online feedback forms for the purposes of data collection.
Product Documentation SAP Business ByDesign August Analytics
 Product Documentation PUBLIC Analytics Table Of Contents 1 Analytics.... 5 2 Business Background... 6 2.1 Overview of Analytics... 6 2.2 Overview of Reports in SAP Business ByDesign... 12 2.3 Reports
SAP BusinessObjects Analysis, edition for OLAP User Guide SAP BusinessObjects XI 4.0
 SAP BusinessObjects Analysis, edition for OLAP User Guide SAP BusinessObjects XI 4.0 Copyright 2011 SAP AG. All rights reserved.sap, R/3, SAP NetWeaver, Duet, PartnerEdge, ByDesign, SAP Business ByDesign,
3 Setting BI Launch Pad and Web Intelligence Preferences
 3 Setting BI Launch Pad and Web Intelligence Preferences This session describes the various settings and preferences you can change (depending on permissions) to personalise your BI Launch Pad and Web
BusinessObjects Enterprise XI Release 2
 BusinessObjects Enterprise XI Release 2 Overview Contents This document contains information on using the opendocument command to call a report that is published in a BusinessObjects Enterprise XI Release
Talis Decisions: InfoView and Web Intelligence
 safsdfsdkjafdsajf dajf lkasdj flkasdjfadsfasdfffsdakfjsdakjfaalto Education Talis Services Talis Decisions: InfoView and Web Intelligence Trainee Notes safsdfsdkjafdsajf dajf lkasdj flkasdjfadsfasdfffsdakfjsdakjfaalto
Griffin Training Manual Grif-WebI Intermediate Class
 Griffin Training Manual Grif-WebI Intermediate Class Alumni Relations and Development The University of Chicago Table of Contents Chapter 1: Setting Up My Computer for Successful Use of the Grif-WebI
edev Technologies integreat4tfs 2015 Update 2 Release Notes
 edev Technologies integreat4tfs 2015 Update 2 Release Notes edev Technologies 11/18/2015 Table of Contents 1. INTRODUCTION... 2 2. SYSTEM REQUIREMENTS... 3 3. APPLICATION SETUP... 3 DASHBOARD... 4 1. FEATURES...
OBIEE. Oracle Business Intelligence Enterprise Edition. Rensselaer Business Intelligence Finance Author Training
 OBIEE Oracle Business Intelligence Enterprise Edition Rensselaer Business Intelligence Finance Author Training TABLE OF CONTENTS INTRODUCTION... 1 USER INTERFACE... 1 HOW TO LAUNCH OBIEE... 1 TERMINOLOGY...
MicroStrategy Desktop
 MicroStrategy Desktop Quick Start Guide MicroStrategy Desktop is designed to enable business professionals like you to explore data, simply and without needing direct support from IT. 1 Import data from
Call: Crystal Report Course Content:35-40hours Course Outline
 Crystal Report Course Content:35-40hours Course Outline Introduction Of Crystal Report & It s Benefit s Designing Reports Defining the Purpose Planning the Layout Examples of Reports Choosing Data Laying
Introduction Accessing MICS Compiler Learning MICS Compiler CHAPTER 1: Searching for Data Surveys Indicators...
 Acknowledgement MICS Compiler is a web application that has been developed by UNICEF to provide access to Multiple Indicator Cluster Survey data. The system is built on DevInfo technology. 3 Contents Introduction...
Explore. American Express. User Guide
 American Express AX @ Work Explore Reporting User Guide This guide provides an overview of @ Work Reporting, the self-service reporting platform for clients of American Express Global Commercial Payments.
Advance Excel Performing calculations on data 1. Naming groups of data 2. Creating formulas to calculate values
 Advance Excel 2013 Getting started with Excel 2013 1. Identifying the different Excel 2013 programs 2. Identifying new features of Excel 2013 a. If you are upgrading from Excel 2010 b. If you are upgrading
Excel Basics Rice Digital Media Commons Guide Written for Microsoft Excel 2010 Windows Edition by Eric Miller
 Excel Basics Rice Digital Media Commons Guide Written for Microsoft Excel 2010 Windows Edition by Eric Miller Table of Contents Introduction!... 1 Part 1: Entering Data!... 2 1.a: Typing!... 2 1.b: Editing
Excel 2007 New Features Table of Contents
 Table of Contents Excel 2007 New Interface... 1 Quick Access Toolbar... 1 Minimizing the Ribbon... 1 The Office Button... 2 Format as Table Filters and Sorting... 2 Table Tools... 4 Filtering Data... 4
MicroStrategy reporting uses a browser-independent web interface that includes features like:
 INTRODUCTION TO BUSINESS INTELLIGENCE Business Intelligence (BI) uses methodologies, processes, architectures, and technologies that transform raw data into meaningful and useful information used to enable
PowerPlay Studio. User Documentation
 PowerPlay Studio User Documentation June 2013 POWERPLAY STUDIO PowerPlay Studio... 1 Supported browsers... 1 Logging On... 2 The Cognos Table of Contents... 3 Working in PowerPlay Studio... 5 Open a Cube...
Index COPYRIGHTED MATERIAL. Symbols and Numerics
 Symbols and Numerics ( ) (parentheses), in functions, 173... (double quotes), enclosing character strings, 183 #...# (pound signs), enclosing datetime literals, 184... (single quotes), enclosing character
ALES Wordpress Editor documentation ALES Research websites
 ALES Wordpress Editor documentation ALES Research websites Contents Login... 2 Website Dashboard... 3 Editing menu order or structure... 4 Add a new page... 6 Move a page... 6 Select a page to edit...
Taking a First Look at Excel s Reporting Tools
 CHAPTER 1 Taking a First Look at Excel s Reporting Tools This chapter provides you with an overview of Excel s reporting features. It shows you the principal types of Excel reports and how you can use
Portal Integration Kit User s Guide for Microsoft SharePoint
 Portal Integration Kit User s Guide for Microsoft SharePoint BusinessObjects Enterprise XI 3.1 windows Copyright 2008 Business Objects, an SAP company. All rights reserved. Business Objects owns the following
TRACES On-line Reporting DG SANCO User Introductory Guide
 Version 0.4 2 Copyright Business Objects, the Business Objects logo, Crystal Reports, and Crystal Enterprise are trademarks or registered trademarks of Business Objects SA or its affiliated companies in
Using Xcelsius 2008 with SAP NetWeaver BW
 Using Xcelsius 2008 with SAP NetWeaver BW Applies to: Xcelsius 2008 Enterprise Service Pack 02 (and higher) SAP NetWeaver BW 7.0 Enhancement package 01 Service Pack 05 (and higher) Summary In this short
EXCEL 2003 DISCLAIMER:
 EXCEL 2003 DISCLAIMER: This reference guide is meant for experienced Microsoft Excel users. It provides a list of quick tips and shortcuts for familiar features. This guide does NOT replace training or
Module 4: Creating Content Lesson 5: Creating Visualizations Try Now!
 Module 4: Creating Content Lesson 5: Creating Visualizations Try Now! In this Try Now! exercise, you will be creating a visualization in your Sales domain, based on the data you uploaded from your Microsoft
[ Getting Started with Analyzer, Interactive Reports, and Dashboards ] ]
![[ Getting Started with Analyzer, Interactive Reports, and Dashboards ] ]](/thumbs/88/117545107.jpg "[ Getting Started with Analyzer, Interactive Reports, and Dashboards ] ]") Version 5.3 [ Getting Started with Analyzer, Interactive Reports, and Dashboards ] ] https://help.pentaho.com/draft_content/version_5.3 1/30 Copyright Page This document supports Pentaho Business Analytics
Version 5.3 [ Getting Started with Analyzer, Interactive Reports, and Dashboards ] ] https://help.pentaho.com/draft_content/version_5.3 1/30 Copyright Page This document supports Pentaho Business Analytics
Site Owners: Cascade Basics. May 2017
 Site Owners: Cascade Basics May 2017 Page 2 Logging In & Your Site Logging In Open a browser and enter the following URL (or click this link): http://mordac.itcs.northwestern.edu/ OR http://www.northwestern.edu/cms/
Using Chart components
 Using Chart components Page 1 of 5 Using Chart components Charts allow you to represent data visually to make it easy for users to see comparisons, patterns, and trends. Xcelsius includes the following
ADVANCED EXCEL Course Modules for Advance Excel Training Online (MS Excel 2013 Course):
:") Course Modules for Advance Excel Training Online (MS Excel 2013 Course): ADVANCED EXCEL 2013 1 Getting started with Excel 2013 A Identifying the different Excel 2013 programs B Identifying new features
Course Modules for Advance Excel Training Online (MS Excel 2013 Course): ADVANCED EXCEL 2013 1 Getting started with Excel 2013 A Identifying the different Excel 2013 programs B Identifying new features
Salient Dashboard Designer 6.x. Training Guide
 Salient Dashboard Designer 6.x Training Guide Salient Dashboard Designer Salient Dashboard Designer enables your team to create interactive consolidated visualizations of decision support intelligence,
Intellicus Enterprise Reporting and BI Platform
 Designing Adhoc Reports Intellicus Enterprise Reporting and BI Platform Intellicus Technologies info@intellicus.com www.intellicus.com Designing Adhoc Reports i Copyright 2012 Intellicus Technologies This
Downloading shapefiles and using essential ArcMap tools
 CHAPTER 1 KEY CONCEPTS downloading shapefiles learning essential tools exploring the ArcMap table of contents understanding shapefiles customizing shapefiles saving projects Downloading shapefiles and
A Guide to Quark Author Web Edition 2015
 A Guide to Quark Author Web Edition 2015 CONTENTS Contents Getting Started...4 About Quark Author - Web Edition...4 Smart documents...4 Introduction to the Quark Author - Web Edition User Guide...4 Quark
Introducing V3 Analytics A U G U S T
 Introducing V3 Analytics A U G U S T 2 0 1 7 Table of Contents Document Versioning 2 Introduction 3 Terminology 3 Analytics Platforms: V1 Analytics versus V2 Analytics versus V3 Analytics 3 Schedule 3
Cognos. Active Reports Development. Presented by: Craig Randell
 Cognos Active Reports Development Presented by: Craig Randell Objectives: Understand the purpose and benefits of Active Reports Through theory and demonstration introduce the different Active Report Components
Course Contents: 1 Business Objects Online Training
 IQ Online training facility offers Business Objects online training by trainers who have expert knowledge in the Business Objects and proven record of training hundreds of students Our Business Objects
Budget Process Tools: Smart View Ad Hoc Basics
 Budget Process Tools: Smart View Ad Hoc Basics 2 6.21.17 CalPlan HCP (Human Capital Planning) CalRptg HCPRptg Smart View 1 Agenda 1 2 3 4 5 6 Smart View Ad Hoc Basics 1 Homework Review Creating Multiple
TYPO3 Editing Guide Contents
 TYPO3 Editing Guide Contents Introduction... 2 Logging in... 2 Selecting your Workspace for editing... 2 Working with Content Elements... 3 Working in the Editing Window... 4 Pasting content from MS Word
Getting Started with Access
 MS Access Chapter 2 Getting Started with Access Course Guide 2 Getting Started with Access The Ribbon The strip across the top of the program window that contains groups of commands is a component of the
WebIntelligence. Creating Documents
 Creating Documents This page is intentionally left blank. 2 WIC110904 Table of Contents Lesson Objective... 5 For Assistance...6 Introduction... 7 Document Editor... 7 Designing a Query Flowchart... 9
SAS Report Viewer 8.3 Documentation
 SAS Report Viewer 8.3 Documentation About SAS Report Viewer Introduction to SAS Report Viewer SAS Report Viewer (the report viewer) enables users who are not report designers to view a report using a web
Hands-On Lab. Developing BI Applications. Lab version: Last updated: 2/23/2011
 Hands-On Lab Developing BI Applications Lab version: 1.0.0 Last updated: 2/23/2011 CONTENTS OVERVIEW... 3 EXERCISE 1: USING THE CHART WEB PART... 4 Task 1 Add the Chart Web Part to the page... 4 Task 2
Creating Reports in Access 2007 Table of Contents GUIDE TO DESIGNING REPORTS... 3 DECIDE HOW TO LAY OUT YOUR REPORT... 3 MAKE A SKETCH OF YOUR
 Creating Reports in Access 2007 Table of Contents GUIDE TO DESIGNING REPORTS... 3 DECIDE HOW TO LAY OUT YOUR REPORT... 3 MAKE A SKETCH OF YOUR REPORT... 3 DECIDE WHICH DATA TO PUT IN EACH REPORT SECTION...
Welcome. Accessing Your Banner Reports
 Welcome Accessing Your Banner Reports Objective Introduction Show e~print users how to select, retrieve, view, save, and print e~print reports from their browsers. Intended Use Self-Training Guided Training
Cougar Mountain Software Dashboards
 Cougar Mountain Software Dashboards Cougar Dtails User s Guide Copyright Notification At Cougar Mountain Software, Inc., we strive to produce high-quality software at reasonable prices. We can only do
econnect Baccarat User Guide EC7 June 2017
 econnect Baccarat User Guide EC7 June 2017 Table of Contents Baccarat Camera View A. Card Displayed on Virtual Table B. Bet Session Recording C. How to open a camera D. What is displayed on Data View E.
MicroStrategy Desktop Quick Start Guide
 MicroStrategy Desktop Quick Start Guide Version: 10.4 10.4, December 2017 Copyright 2017 by MicroStrategy Incorporated. All rights reserved. Trademark Information The following are either trademarks or
Using Qualtrics. ERL Workshop Social Psychology Lab Spring 2014
 Using Qualtrics ERL Workshop Social Psychology Lab Spring 2014 Set up your account It is FREE because you are at Barnard! Barnard.qualtrics.com More details on our tutorial here Your BARNARD email address
Tips and Guidance for Analyzing Data. Executive Summary
 Tips and Guidance for Analyzing Data Executive Summary This document has information and suggestions about three things: 1) how to quickly do a preliminary analysis of time-series data; 2) key things to