User Services Spring 2008 OBJECTIVES Introduction Getting Help Instructors
|
|
|
- Arabella Shields
- 6 years ago
- Views:
Transcription
1 User Services Spring 2008 OBJECTIVES Use the Data Editor of SPSS 15.0 to to import data. Recode existing variables and compute new variables Use SPSS utilities and options Conduct basic statistical tests. Use SPSS Pivot Tables Create a pie chart with the new graphics editor. Tips: Variable names have been expanded from eight characters to 64 characters since SPSS This will aid you when pulling data from Microsoft Excel files or working with charts. In addition to SPSS existing recode feature, the Visual Bander allows you to easily create bands. For example, breaking age or income into groups automatically. Introduction to Introduction Getting Help The ITS Help Desk is a service provided to all Mississippi State University students, staff, and faculty. The ITS consultants are available to help with various computer-related problems as well as provide answers to computer and technology-related questions. Visit the Web site at for handouts and resolutions to common computer problems. If you cannot find an anwer to your question on the Web or you do not have access to the Internet, please call at (7:30 a.m. to 5:00 p.m. Monday through Friday). You may also contact the ITS Help Desk, located at 108 Allen Hall, by at helpdesk@msstate.edu. Instructors Harriet Foley hvf1@its.msstate.edu SPSS 15.0 for Windows SPSS 15.0 is a comprehensive system for analyzing data. SPSS can take data from almost any type of file and use it to generate tabulated reports, charts, and plots of distributions and trends, descriptive statistics, and complex statistical analyses. SPSS makes statistical analysis convenient for the experienced user and approachable for the beginner. The Data Editor offers a simple and efficient spreadsheet-type interface for entering data and browsing the working data file. The output can be easily used in other applications. This workshop will introduce you to entering data using the Data Editor, basic manipulation of data, use of descriptive statistics for checking of data, and basic statistical analysis. Amy Berryhill berryhill@its.msstate.edu
2 Table of Contents User Services Table of Contents SPSS Interface Importing a Text File Data Definition in Variable View Split File Command Descriptive Statistics Importing an Excel Spreadsheet Defining Types of Measurement Defining Variable and Value Labels Recoding Into the Same Variable Creating New Variables with Compute Recoding into a Different Variable Using Utilities Setting Options Running Cross-tabs SPSS Output Viewer Pivoting Tables and Trays Running Correlations Running a Paired-Sample T-test Running a Linear Regression Analysis Creating a Pie Chart Export Output Help Topics Powerpoint Slides


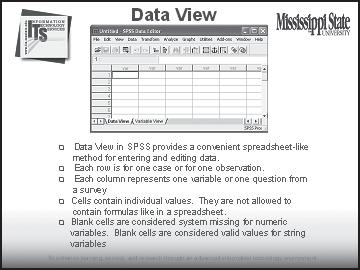
3 User Services SPSS Interface SPSS Data View Data View in SPSS provides a convenient spreadsheet-like method for entering and editing data. 2. Each row is for one case or for one observation. 3. Each column represents one variable or one question from a survey. 4. Cells contain individual values. They are not allowed to contain formulas like in a spreadsheet. 5. Blank cells are considered system missing for numeric variables. Blank cells are considered valid values for string variables. 3
, decimals (number of decimal places), labels (longer description of variable names), values (include")
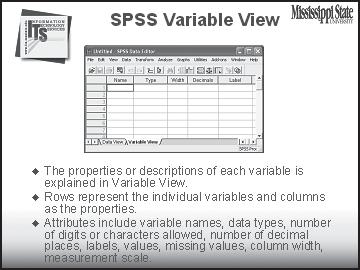
4 SPSS Interface User Services SPSS Variable View The properties or descriptions of each variable is explained in Variable View. 2. Rows represent the individual variables and columns as the properties. 3. Attributes include variable names, data types, width (number of digits or characters allowed), decimals (number of decimal places), labels (longer description of variable names), values (include value labels), missing (user-defined missing values), columns (column width), alignment and measure (measurement scale). 4

5 User Services SPSS Interface SPSS Window Viewer Used to display results. 2. The left pane is the outline pane. It displays an outline of the contents Chart and statistical tables are shown in the right pane. You can scroll through results in the content pane or right click on an item in the outline pane to display its result. 5


6 Importing a Text File User Services Start Window Launch SPSS 15.0 for Windows. SPSS starts with a dialog box - you can choose to open an existing file or to start entering data in a new file. Click Cancel for now. For this exercise we will be reading in a tab delimited data file. Importing a Text File In this example we will import data from a data file. From the File pull-down menu select Read Text Data. 2. Change Files of type: to Data(*.dat). 3. Open the file samp.dat from the Temp folder on the Desktop. 6

7 User Services Text Import Wizard 4. The Text Import Wizard has 6 steps. a. Does your text file match a predefined format? Choose No, then Next. b. How are your variables arranged? Choose Delimited Are variable names included at the top of your file? Choose No, Choose Next. c. The first case of data begins on which line number? Choose 1 Choose: Each line represents a case All of the cases Next d. Which delimiters appear between variables Choose Tab, uncheck the others, then choose Next. e. In step 5 of 6, choose Next. f. In step 6 of 6, leave the defaults and choose Finish. The data appears in Data View. Variable definitions appear in Variable View. 7


, right click and select Paste.")
8 Data Definition User Services Data Definition in Variable View 5. Click on Variable View. Change the variable names as they appear in the left column, the default names, to as they appear in the right column. In this sample data style stands for one of the overall styles and usefulness of oncampus and tool stands for a survey question on the course tools of oncampus. 6. Change the Type of the date variable to Date. Click in the Type column in the date row. Click on the three dots. Choose Date and mm/dd/yy. Click OK. 7. In the Missing column, assign -9 for a missing value for style After setting up -9 for style1, select that cell and then from the Edit pull-down menu select Copy. Highlight the cells you want to copy to, (all the variables except date), right click and select Paste. You may want to know why the data is missing, whether it is because a person refused to answer or if the question just didn t apply. Up to 3 missing values can be assigned to each variable in order to make such differences. In this case -9 is being used to represent questions that were not answered 8


9 User Services Split File Feature 8. Change the Measure for variables style1 to tool5 from Nominal to Ordinal. 9. Return to Data View. Split File Command 10. Using Split File, the data is split into various groups. Then the same analysis, such as descriptive statistics can be run on each of the separate groups of data with one command. From the Data pull-down menu select Split File... 1 In the Split File dialog box, choose Compare Groups. Select Sort the file by grouping variables. Move date over into the Groups Based on: box. ClickOK. 9
.")


10 Descriptive Statistics User Services Running Descriptive Statistics on a Split File using the Paste command. Calculation of means is an important descriptive statistic. This exercise calculates the mean for the ordinal variables (data values representing categories with some intrinsic order, see page 15). Also, usually in SPSS when you are ready to run your commands you will select OK. This runs the commands immediately. By selecting Paste, you can easily save your commands and run them again in another SPSS session. From the Analyze pull-down menu select Descriptive Statistics, Descriptives. 2. Move the variables over that you want the descriptives to be run on. 3. Select the Options button in the Descriptives dialog box. Choose the options you are interested in seeing in the Descriptives:Options dialog box. Click Continue. When returned to the Descriptives diaog box select Paste. 4. Run the commands from the Syntax window by clicking on the triangle icon. The syntax commands can be saved and run at a future time. A syntax file saves with a.sps ending. 10
11 User Services Descriptive Statistics The results show the data being split on the date variable. There are two groupings by date. 5. Return to the data editor. Close the syntax window. 11

 The first row of the spreadsheet will act as your variable names. From the File pull-down menu select Open, Data. 2. Change the file type to Excel in the dialog box.")
12 Importing an Excel Spreadsheet User Services Importing an Excel Spreadsheet The next example will import data from an Excel spreadsheet. You may be using an Excel spreadsheet for entering data because you might not have access to SPSS or you may already have the data entered into a spreadsheet. It is important to use SPSS naming conventions for your variables, no spaces or special characters and begin with a letter. (Names can now be up to 64 characters.) The first row of the spreadsheet will act as your variable names. From the File pull-down menu select Open, Data. 2. Change the file type to Excel in the dialog box. Choose the Excel file 4203 from the Temp folder on the Desktop. Click Open. 12

13 User Services Importing an Excel Spreadsheet 3. This will result in the Opening Excel Data Source dialog box. Check to Read the variable names from the first row of data. The range of cells from the spreadsheet, following the worksheet name will be displayed. Click OK. Switch to Data View to see the data. 4. It is smart to save SPSS data files you will work with again as.sav files. Then the data is saved with all your editing changes. We will save the data now, and periodically as we work on the data. From the File pull-down menu select Save As. Save to your Temp folder on the Desktop. Name it survey.sav. In this example each row represents a student from a class and the column a characteristic or a variable being measured about that student (e.g. what type of teaching method was used). Each cell contains values. 13


14 Data View and Variable View User Services Your variables appear in Data View. 213 cases were imported. The variable definitions are in Variable View. Each row lists a variable name, the type, width, decimal places, variable label, value labels, missing values, columns, alignment and measurement. Many of these will already be filled in. You will fill in variable labels and value labels and be sure the measurement is the right type. 14

15 User Services Data Definition Defining Type of Measurement and Variable Labels Measure Column Specifying the type of measurement is extremely important for future analyses. A user doesn t want to perform an analysis on a nominal variable when the analysis is designed for scale variables, interval or ratio level of measurement. Definitions: Nominal: Data values represent categories with no intrinsic order. For example, string or numeric values that represent distinct categories (e.g. 1=Male, 2=Female). Ordinal: Data values represent categories with some intrinsic order (e.g. low, medium, high or strongly agree, agree, disagree, strongly disagree). Nominal and ordinal values are categorical. Scale: Data values are numeric values on an interval or ratio scale (e.g. age, income). Scale variables must be numeric. Interval - distance between values is meaningful. Ratio - ratio scale has an absolute zero. Define section, class and gender as nominal in the Measure column. 2. The remainder of the variables for the sake of this exercise are scale or ordinal variables. Define pre and post anxiety scores as ordinal in the Measure column. 3. Define modules, projects, exam, total and geft as scale in the Measure column. Defining Variable Labels Label Column - be sure to use something descriptive, but not too long. Variable labels can be up to 256 characters. Give the variable names the following variable labels. 15

16 Value Labels User Services Defining Value Labels Identify the value labels if appropriate. This will help with the interpretation of data results. Values Column To define values click in a values cell. Then click on the... ellipsis. The Value Labels dialog box opens as shown below.. Defining Value Lables for Nominal Variables Section Value Labels The section variable identifies the teaching methodology in this study. 0 =Traditional Lab 1 = Self-Paced Lab Click OK. Assign Class Value Labels The class variable is also a nominal variable describing if the student is an undergraduate or graduate. Assign: 0 = Undergraduate 1 =Graduate. Click OK. Gender Value Labels Assign for the gender: 0= Females 1 =Males Click OK. 16


17 User Services Value Labels Value Labels continued 4. Sometimes there are a number of variables that have the same value labels. In this example there are a number of items that are Likert items with 4 choices ranging from Strongly Disagree to Strongly Agree. These are the pre and post anxiety scores. Enter these value labels for one anxiety score: 00 = Strongly Disagree 2.00 = Disagree 3.00= Agree 4.00=Strongly Agree 5. Once you have entered in the value labels once in Variable View, you can Copy and Paste it for the other anxiety scores. Highlight the cell where you have defined the Value labels. From the Edit pull-down menu select Copy. Next, highlight the cells you want to copy to. Right click and select Paste. The original data from the spreadsheet is now entered and all variables and values are correctly labeled. However, there are some variables that need to be recoded and some variables that need to be created. These tasks will be done from the Transform menu item. Recoding The Likert questions are part of a pre-test and post-test to measure computer anxiety. Four of the questions were reversed coded to help prevent a pattern response from the subjects. These variables (pre_a1, pre_a3, pre_a4, pre_a12, post_a1, post_a3, post_a4, post_a12) need to be re-coded to where 4=>1, 3=>2, 2=>3, 1=>4. This will provide a correct anxiety score when the 12 items are summed together (which will create two new variables a pre-course computer anxiety score and a post-course computer anxiety score). 17


18 Recoding User Services Recoding Into the Same Variable First the necessary values will be re-coded for variables pre_a1, pre_a3, pre_a4, pre_a12, post_a1, post_a3, post_a4, and post_a12. The Transform menu is used for recoding variables as well as creating new variables. In the case of these variables they are going to be recoded into the same variable. From the Transform pull-down menu select Recode, Into Same Variables In the Recode dialog box select the variables that are going to be recoded. All eight of the variables are moved into the Numeric Variables box. Click on the Old and New Values button. 3. A new dialog box appears. Enter the value you want to change in the Old Value box and the value you want to change to in the New Value box and then click on the Add button. Do this for each set of numbers until you have a total of four Old and New value pairs. Click Continue to return to the previous box and then OK to make the recodes take effect. 18
. Therefore this needs to be recoded. This is also done through the Transform window.")
.")

19 User Services Recoding 4. Case 181 through 213 were entered incorrectly for the section variable. The value is currently 2 while it should be (All values for section are either 0 or 1). Therefore this needs to be recoded. This is also done through the Transform window. In this case only one variable section needs to be transformed. The only transformation that needs to be done is change 2 to The same process is followed. But in this case there is only one Old and New Value pair (2=>1). Note that the previous variables that were recoded need to be moved out as well as the the four pairs of Old and New values. Follow the same process for section (Teaching Technique). Creating New Variables with Compute... The new variables can now be created. The first one created will be the Pre-course Computer Anxiety score based on the summation of the variables pre_a1 through pre_a12. The same process will be used for the Post-course Computer Anxiety score except using the variables post_a1 through post_a12. The Transform menu is used again except this time the Compute option is selected. 19


20 Compute Variable User Services 2. In the Compute dialog box the new variable needs to be named prescore. Type this in for the Target Variable. Then in the Numeric Expression box you can enter a formula or use a built-in function to build the computation for the new variable. In this example the Sum function is being used. First select Statistical from the Function group box. Click Sum from the Functions and Special Variables box. The Sum function is placed in the Numeric Expression box. Then replace?,? with the expression pre_a1 to pre_a12. When done click OK and the new variable is created at the last column of the Data Editor. 3. The same procedure is done for the Post Anxiety score postscore by replacing the pre-test questions with the appropriate post-test questions. Follow the same procedure to calculate the postscore. 20


21 User Services Recoding Recoding Into a Different Variable Additionally, the geft variable reports the subjects score on the Group Embedded Figures Test. Subjects that score 12 or higher are classified as Field-Independent learning styles and those who score 11 or less are classified as Field-Dependent learning styles. Therefore a new variable, style, needs to be created based on the GEFT value. The next variable to create is the style variable, which is based on the subjects geft score. The Compute or Recode dialog box can be used for this one. This exercise uses the Recode into a different variable to generate the new variable style. The variable geft is the input variable and the output variable is style with Label of Learning Style. Click on Change to insert style for the? 2. Click on Old and New Values. 3. Ranges are used in determining the new values for the new variable style. Insert the following ranges and select System-or user-missing and assign it a value of 2. Click Continue. 0 thru 11 -> 0 (Field Dependent) 12 thru 18 -> 1 (Field Independent) System-or user-missing -> 2 21


22 Utilities User Services 4. After recoding click OK. The new variable style is added as a new column to the end of the Data Editor. 5. Return to Variable View of the Editor and enter Value Labels for your new variable style. Assign it a Measure of Nominal. Click on its cell for Missing Values. Enter 2 as a Discrete missing value. Value labels and Measure are required properties for using style later in a graph. Using Utilities SPSS Definitions (*from SPSS Help): -System-missing: Values assigned by the program when values in your data are undefined according to the format type you have specified. -System-or user-missing-observations with values that either have been defined as user-missing values or have been assigned the system-missing value. Under the Utilities menu is a Variables dialog box that will allow you to check your variables for labels, values, missing values, and additional important items. This is a good tool to use to insure there are no gross errors in the data set-up. 22


23 User Services Setting Options Setting Options SPSS provides the user an opportunity to customize almost any aspect of the application. Many of these changes can be made from the Options dialog box under the Edit menu. For example, if a user wanted to have the session journal in a different folder than the default one. From the Edit pull-down menu select Options. On the General tab click Browse in the Session Journal area and choose a different file for the session journal. 2. A user could also change the Text Output Page Size in the same way. In the Options dialog box a User could click on the Viewer tab, click on Custom and specify the page width. Also, be sure to choose, Display commands in the log. This will make it easy to identify your results. Click OK. 23


24 Crosstabs User Services Running Cross-tabs Cross-tabs is a convenient way to check your data. It is used for reporting descriptive statistics and checking for significant differences in the cross-tabulated variables. This exercise creates cross-tabs to describe gender by learning style and class by learning style and test for chi-square. The Cross-tabs dialog box is located under Descriptive Statistics in the Analyze menu. 2. The gender variable and the class variable, (independent variables) are placed on the column and the learning style variable, (dependent variable), is placed on the row of the cross-tab. See the next page for the dialog boxes for Statistics, Cells and Formats. 24


25 User Services SPSS Output Viewer 3. The Statistics button allows you choose the statistics you want reported with the cross-tabs table. The Cells button allows you to choose the appearance of the cells within the cross-tabs table. Select Column Percentages. The Format button allows you to choose ascending or descending for your data. Once you have selected your parameters click OK. Percentages eliminate the differences that shows up when you have more people in one group than in another. If you have an independent variable and a dependent variable, place the independent variable at the heads of the columns, so the columns sum to 100% for each category of the independent variable. SPSS Output Viewer 4. The results are recorded in the SPSS for Windows Viewer. The left side of the window provides an outline pane of the results of all the commands that you have run in SPSS. The right side of the window is the content pane where the tables are displayed. 25


26 Pivot Tables User Services Pivoting Tables You can select any table by clicking on the title in the outline pane or by using the scroll arrows to locate it in the contents pane. Many of the results in the viewer are presented in tables that can be pivoted interactively. That is, you can rearrange the rows, columns, and layers of the table. You can double-click on a table to pivot or edit it or right click and choose SPSS Pivot Table Object, Open. A formatting Toolbar and SPSS Pivot Table will open. 2. Left click on the value label Independent. When the cursor changes to a circle with a diagonal line running through it, drag up the mouse towards the value label Dependent. When the circle changes to four arrows, release the mouse. Select Swap. The two rows will be interchanged. 26


27 User Services Pivot Tables 3. Another option is to activate the pivoting trays that will provide icons for the rows, columns, and data. Drag an icon from one tray to another to change the arrangement of the table. For example, drag the icon representing Learning Styles from the row tray to the column tray. The result is that they become row labels rather than column labels. 27


 postscore (total post-test anxiety score). Move these scores over into the Variables box.")
28 Correlations User Services Running Correlations Correlations are another common statistic run for descriptive studies and also as a way to get a rough estimate of data interactions before running more advanced statistics. Correlations are also found in the Analyze menu in the Correlate dialog box. This exercise will conduct some bivariate corrleations between the interval level variables. 2. The following scale variables in this study will be used: Group Embedded Figures Test Homework Score Projects Score Final Exam Score, Total Points Score prescore (total pre-test anxiety score) postscore (total post-test anxiety score). Move these scores over into the Variables box. 3. Means and standard deviations can also be reported by selecting for them in the options sub-menu. Click OK. The resulting correlations are reported in a table in the Viewer. 28


29 User Services Paired-Sample T-Test Running a Paired-Sample T-Test Comparison of means is often an important part of data analysis for a research project. In this exercise the group means of the pre-test computer anxiety score and the post-test computer anxiety score will be compared using a paired-sample t-test, also known as a dependent t-test. The Mean Comparison dialog box is also located in the Analyze menu. From the Analyze pulldown menu Compare Means, Paired Samples T-Test. 2. Choose prescore for Variable 1 and postscore for Variable 2. Click on the arrow to move them over. 3. In the Options, Exclude cases analysis by analysis. Click OK. Note the results below. 29


30 Linear Regression User Services Running a Linear Regression Analysis Find the coefficients of one or more independent variables that best predict the dependent variable in a linear equation. In this analysis we will run a Linear Regression to predict a students final exam score from their geft score and anxiety prescore. From the Analyze pull-down menu select Regression, Linear. 2. Select Final Exam Score for the Dependent variable and geft and anxiety prescore for the Independent variables. In other words, we are trying to predict the final exam score based on a students group embedded figures test score and his/her anxiety prescore. Click OK to run. 30
31 User Services Linear Regression Results from Linear Regression Analysis 31


32 Creating Charts User Services Creating a Pie Chart SPSS also has a powerful charting capability. Bar, line, area, and pie charts all present summary statistics for one or more variables. This exercise will create a pie chart of the learning styles represented in the sample data. From the Graphs pull-down menu 2. select Chart Builder. Click OK in the Chart Builder dialog box. We have already set the measurement level and value labels. 3. Click on the Gallery tab. (The Basic Elements tab can also be used to create charts.) Select Bar under Choose from: and double click on the first bar chart. Drag Learning Style, from the Variables list to the X-Axis box in the chart display. Click on the Options button. 32


33 User Services Creating Charts 4. In the Options dialog box, select Include under Break Variables. This will create a bar for the missing values. Click OK. 5. Click on the Titles/Footnotes tab. Check the check box Title In the Element Properties dialog box type Learning Style in the Content box. Only T1 appears now, the title will appear later on the chart. Click Apply in the Element Properties window. Click OK in the Chart Builder dialog box. 33


34 Creating Charts User Services 6. The chart will appear in the Content area of the output window. Double click on the chart. The chart will open in the Chart Editor. Click on one of the bars to select all the bars. The Properties window will open. Chart Properties Next we will change the color of the bars. Click on the Fill & Border tab. Select the dark maroon color. Click Apply. The bars on the chart will turn maroon. 2. To add data labels to the bars, from the Elements drop-down list, select Show Data Labels. 34


35 User Services 3. In the Data Value Labels tab of the Properties dialog box, drag Learning Style and Percent from Not Displayed to Displayed. Click Apply. 4. Charts Also, in the Data Value Labeles tab, click on Custom radio button under Label Position. Click Apply. The data labels will appear on the top otf the bars. 5. We will next change the bar chart to a pie 6. The chart will now appear in a pie format. chart. Click on the Variables tab. Select Pie Close the Chart Builder. Your chart with next to Element Type. Click Apply. its changes will appear in the SPSS Output window. 35


36 Export Output User Services Export Output In the Output window from the File pull-down menu select Export. 2. The Export Output dialog box saves pivot tables and text output in HTML and text format. 3. The Export Output dialog box also saves charts in a variety of common formats used by other applications. 36


37 User Services Help Help Topics Online Help is provided in several ways. The Help menu is available in every window. Topics provide access to the Contents, Index, Search and Favorites tabs. 2. Right-click on any control in a dialog box and its definition will pop up. Right-click else where in the program and select What s This? Dialog boxes also contain Help buttons. 3. There is a Statistics coach and a Results coach. 37


38 PowerPoint Slides User Services 38
39 PowerPoint Slides User Services 39

40 A publication of ITS User Services, a division of Information Technology Services, Mississippi State University Mississippi State Univesity does not discriminate on the basis of race, color, religion, national orign, sex, age, disability, or veteran status.
Creating a data file and entering data
 4 Creating a data file and entering data There are a number of stages in the process of setting up a data file and analysing the data. The flow chart shown on the next page outlines the main steps that
1. Basic Steps for Data Analysis Data Editor. 2.4.To create a new SPSS file
 1 SPSS Guide 2009 Content 1. Basic Steps for Data Analysis. 3 2. Data Editor. 2.4.To create a new SPSS file 3 4 3. Data Analysis/ Frequencies. 5 4. Recoding the variable into classes.. 5 5. Data Analysis/
SPSS for Survey Analysis
 STC: SPSS for Survey Analysis 1 SPSS for Survey Analysis STC: SPSS for Survey Analysis 2 SPSS for Surveys: Contents Background Information... 4 Opening and creating new documents... 5 Starting SPSS...
UNIT 4. Research Methods in Business
 UNIT 4 Preparing Data for Analysis:- After data are obtained through questionnaires, interviews, observation or through secondary sources, they need to be edited. The blank responses, if any have to be
Introduction (SPSS) Opening SPSS Start All Programs SPSS Inc SPSS 21. SPSS Menus
 Opening SPSS Start All Programs SPSS Inc SPSS 21. SPSS Menus") Introduction (SPSS) SPSS is the acronym of Statistical Package for the Social Sciences. SPSS is one of the most popular statistical packages which can perform highly complex data manipulation and analysis
Introduction (SPSS) SPSS is the acronym of Statistical Package for the Social Sciences. SPSS is one of the most popular statistical packages which can perform highly complex data manipulation and analysis
Intermediate Microsoft Access 2010
 OBJECTIVES Develop Field Properties Import Data from an Excel Spreadsheet & MS Access database Create Relationships Create a Form with a Subform Create Action Queries Create Command Buttons Create a Switchboard
IENG484 Quality Engineering Lab 1 RESEARCH ASSISTANT SHADI BOLOUKIFAR
 IENG484 Quality Engineering Lab 1 RESEARCH ASSISTANT SHADI BOLOUKIFAR SPSS (Statistical package for social science) Originally is acronym of Statistical Package for the Social Science but, now it stands
DEPARTMENT OF HEALTH AND HUMAN SCIENCES HS900 RESEARCH METHODS
 DEPARTMENT OF HEALTH AND HUMAN SCIENCES HS900 RESEARCH METHODS Using SPSS Topics addressed today: 1. Accessing data from CMR 2. Starting SPSS 3. Getting familiar with SPSS 4. Entering data 5. Saving data
Opening a Data File in SPSS. Defining Variables in SPSS
 Opening a Data File in SPSS To open an existing SPSS file: 1. Click File Open Data. Go to the appropriate directory and find the name of the appropriate file. SPSS defaults to opening SPSS data files with
22/10/16. Data Coding in SPSS. Data Coding in SPSS. Data Coding in SPSS. Data Coding in SPSS
 DATA CODING IN SPSS STAFF TRAINING WORKSHOP March 28, 2017 Delivered by Dr. Director of Applied Economics Unit African Heritage Institution Enugu Nigeria To code data in SPSS, Lunch the SPSS The Data Editor
Basic concepts and terms
 CHAPTER ONE Basic concepts and terms I. Key concepts Test usefulness Reliability Construct validity Authenticity Interactiveness Impact Practicality Assessment Measurement Test Evaluation Grading/marking
IBM SPSS Statistics 22 Brief Guide
 IBM SPSS Statistics 22 Brief Guide Note Before using this information and the product it supports, read the information in Notices on page 77. Product Information This edition applies to version 22, release
Research Methods for Business and Management. Session 8a- Analyzing Quantitative Data- using SPSS 16 Andre Samuel
 Research Methods for Business and Management Session 8a- Analyzing Quantitative Data- using SPSS 16 Andre Samuel A Simple Example- Gym Purpose of Questionnaire- to determine the participants involvement
Mr. Kongmany Chaleunvong. GFMER - WHO - UNFPA - LAO PDR Training Course in Reproductive Health Research Vientiane, 22 October 2009
 Mr. Kongmany Chaleunvong GFMER - WHO - UNFPA - LAO PDR Training Course in Reproductive Health Research Vientiane, 22 October 2009 1 Object of the Course Introduction to SPSS The basics of managing data
Statistical Package for the Social Sciences INTRODUCTION TO SPSS SPSS for Windows Version 16.0: Its first version in 1968 In 1975.
 Statistical Package for the Social Sciences INTRODUCTION TO SPSS SPSS for Windows Version 16.0: Its first version in 1968 In 1975. SPSS Statistics were designed INTRODUCTION TO SPSS Objective About the
INTRODUCTORY SPSS. Dr Feroz Mahomed Swalaha x2689
 INTRODUCTORY SPSS Dr Feroz Mahomed Swalaha fswalaha@dut.ac.za x2689 1 Statistics (the systematic collection and display of numerical data) is the most abused area of numeracy. 97% of statistics are made
Introduction. About this Document. What is SPSS. ohow to get SPSS. oopening Data
 Introduction About this Document This manual was written by members of the Statistical Consulting Program as an introduction to SPSS 12.0. It is designed to assist new users in familiarizing themselves
Microsoft Excel Using Excel in the Science Classroom
 Microsoft Excel Using Excel in the Science Classroom OBJECTIVE Students will take data and use an Excel spreadsheet to manipulate the information. This will include creating graphs, manipulating data,
A Simple Guide to Using SPSS (Statistical Package for the. Introduction. Steps for Analyzing Data. Social Sciences) for Windows
 for Windows") A Simple Guide to Using SPSS (Statistical Package for the Social Sciences) for Windows Introduction ٢ Steps for Analyzing Data Enter the data Select the procedure and options Select the variables Run the
A Simple Guide to Using SPSS (Statistical Package for the Social Sciences) for Windows Introduction ٢ Steps for Analyzing Data Enter the data Select the procedure and options Select the variables Run the
OneView. User s Guide
 OneView User s Guide Welcome to OneView. This user guide will show you everything you need to know to access and utilize the wealth of information available from OneView. The OneView program is an Internet-based
The Menu and Toolbar in Excel (see below) look much like the Word tools and most of the tools behave as you would expect.
 look much like the Word tools and most of the tools behave as you would expect.") Launch the Microsoft Excel Program Click on the program icon in Launcher or the Microsoft Office Shortcut Bar. A worksheet is a grid, made up of columns, which are lettered and rows, and are numbered.
Launch the Microsoft Excel Program Click on the program icon in Launcher or the Microsoft Office Shortcut Bar. A worksheet is a grid, made up of columns, which are lettered and rows, and are numbered.
Introduction to SPSS Edward A. Greenberg, PhD
 Introduction to SPSS Edward A. Greenberg, PhD ASU HEALTH SOLUTIONS DATA LAB JANUARY 7, 2013 Files for this workshop Files can be downloaded from: http://www.public.asu.edu/~eagle/spss or (with less typing):
Separate Text Across Cells The Convert Text to Columns Wizard can help you to divide the text into columns separated with specific symbols.
 Chapter 7 Highlights 7.1 The Use of Formulas and Functions 7.2 Creating Charts 7.3 Using Chart Toolbar 7.4 Changing Source Data of a Chart Separate Text Across Cells The Convert Text to Columns Wizard
Chapter 4. Microsoft Excel
 Chapter 4 Microsoft Excel Topic Introduction Spreadsheet Basic Screen Layout Modifying a Worksheet Formatting Cells Formulas and Functions Sorting and Filling Borders and Shading Charts Introduction A
Course Code: SPSS19 Introduction to IBM SPSS Statistics
 Centre for Learning and Academic Development (CLAD) Technology Skills Development Team Course Code: SPSS19 Introduction to IBM SPSS Statistics www.intranet.birmingham.ac.uk/itskills An Introduction to
Introduction to SPSS
 Introduction to SPSS Purpose The purpose of this assignment is to introduce you to SPSS, the most commonly used statistical package in the social sciences. You will create a new data file and calculate
An introduction to SPSS
 An introduction to SPSS To open the SPSS software using U of Iowa Virtual Desktop... Go to https://virtualdesktop.uiowa.edu and choose SPSS 24. Contents NOTE: Save data files in a drive that is accessible
Handling Your Data in SPSS. Columns, and Labels, and Values... Oh My! The Structure of SPSS. You should think about SPSS as having three major parts.
 Handling Your Data in SPSS Columns, and Labels, and Values... Oh My! You might think that simple intuition will guide you to a useful organization of your data. If you follow that path, you might find
Creating an Excel resource
 Excel Mobile Excel Mobile is a Microsoft application similar to Excel, but designed to run on handhelds. This mobile version of Excel is a spreadsheet application that allows you to manipulate numbers,
Beginner s Guide to Microsoft Excel 2002
 Beginner s Guide to Microsoft Excel 2002 Microsoft Excel lets you create spreadsheets, which allow you to make budgets, track inventories, calculate profits, and design charts and graphs. 1. Open Start
Data Analysis using SPSS
 Data Analysis using SPSS 2073/03/05 03/07 Bijay Lal Pradhan, Ph.D. Ground Rule Mobile Penalty Participation Involvement Introduction to SPSS Day 1 2073/03/05 Session I Bijay Lal Pradhan, Ph.D. Object of
Pivot Tables, Lookup Tables and Scenarios
 Introduction Format and manipulate data using pivot tables. Using a grading sheet as and example you will be shown how to set up and use lookup tables and scenarios. Contents Introduction Contents Pivot
Quick Start Guide Jacob Stolk PhD Simone Stolk MPH November 2018
 Quick Start Guide Jacob Stolk PhD Simone Stolk MPH November 2018 Contents Introduction... 1 Start DIONE... 2 Load Data... 3 Missing Values... 5 Explore Data... 6 One Variable... 6 Two Variables... 7 All
Working with Charts Stratum.Viewer 6
 Working with Charts Stratum.Viewer 6 Getting Started Tasks Additional Information Access to Charts Introduction to Charts Overview of Chart Types Quick Start - Adding a Chart to a View Create a Chart with
Microsoft Excel 2007
 Microsoft Excel 2007 1 Excel is Microsoft s Spreadsheet program. Spreadsheets are often used as a method of displaying and manipulating groups of data in an effective manner. It was originally created
Software Reference Sheet: Inserting and Organizing Data in a Spreadsheet
 Inserting and formatting text Software Reference Sheet: Inserting and Organizing Data in a Spreadsheet Column headings are very important to include in your spreadsheet so that you can remember what the
Sales Presentation for Matt s Mega Mart. Objectives. Steps: By the end of this lesson, you will be able to:
 Sales Presentation for Matt s Mega Mart Objectives By the end of this lesson, you will be able to: Apply Theme to presentation Export Word outline to PowerPoint Create pivot charts Modify pivot charts
User Services. WebCT Integrating Images OBJECTIVES
 User Services Spring 2005 OBJECTIVES Learn how to manipulate images in Photoshop Create WebCT: Icons Banner Images Backgrounds Visual Aids Understand file formats and how to save images for use on the
Data Should Not be a Four Letter Word Microsoft Excel QUICK TOUR
 Toolbar Tour AutoSum + more functions Chart Wizard Currency, Percent, Comma Style Increase-Decrease Decimal Name Box Chart Wizard QUICK TOUR Name Box AutoSum Numeric Style Chart Wizard Formula Bar Active
Math 227 EXCEL / MEGASTAT Guide
 Math 227 EXCEL / MEGASTAT Guide Introduction Introduction: Ch2: Frequency Distributions and Graphs Construct Frequency Distributions and various types of graphs: Histograms, Polygons, Pie Charts, Stem-and-Leaf
Chapter One: Getting Started With IBM SPSS for Windows
 Chapter One: Getting Started With IBM SPSS for Windows Using Windows The Windows start-up screen should look something like Figure 1-1. Several standard desktop icons will always appear on start up. Note
INTRODUCTION TO SPSS OUTLINE 6/17/2013. Assoc. Prof. Dr. Md. Mujibur Rahman Room No. BN Phone:
 INTRODUCTION TO SPSS Assoc. Prof. Dr. Md. Mujibur Rahman Room No. BN-0-024 Phone: 89287269 E-mail: mujibur@uniten.edu.my OUTLINE About the four-windows in SPSS The basics of managing data files The basic
Homework 1 Excel Basics
 Homework 1 Excel Basics Excel is a software program that is used to organize information, perform calculations, and create visual displays of the information. When you start up Excel, you will see the
Intermediate SPSS. If you have an SPSS dataset (*.sav), you can open it in the following way:
, you can open it in the following way:") Center for Teaching, Research & Learning Research Support Group at the Social Science Research lab American University, Washington, D.C. http://www.american.edu/provost/ctrl/ 202-885-3862 Intermediate
Center for Teaching, Research & Learning Research Support Group at the Social Science Research lab American University, Washington, D.C. http://www.american.edu/provost/ctrl/ 202-885-3862 Intermediate
Excel 2007 New Features Table of Contents
 Table of Contents Excel 2007 New Interface... 1 Quick Access Toolbar... 1 Minimizing the Ribbon... 1 The Office Button... 2 Format as Table Filters and Sorting... 2 Table Tools... 4 Filtering Data... 4
Intermediate Microsoft Excel 2010
 P a g e 1 Intermediate Microsoft Excel 2010 ABOUT THIS CLASS This class is designed to continue where the Microsoft Excel 2010 Basics class left off. Specifically, we will cover additional ways to organize
Technology Webinar. Integrating Spreadsheets into Core Curriculum. Part 1
 Technology Webinar Integrating Spreadsheets into Core Curriculum Part 1 Online Workshop Adobe Connect overview Core curriculum TEKS Spreadsheet basics Cell cell name Column and row Entering data into a
EXCEL 2003 DISCLAIMER:
 EXCEL 2003 DISCLAIMER: This reference guide is meant for experienced Microsoft Excel users. It provides a list of quick tips and shortcuts for familiar features. This guide does NOT replace training or
Chapter 11 Dealing With Data SPSS Tutorial
 Chapter 11 Dealing With Data SPSS Tutorial 1. Visit the student website at for this textbook at www.clowjames.net/students. 2. Download the following files: Chapter 11 Dealing with Data (SPSS data file)
Introduction to Microsoft Excel 2010
 Introduction to Microsoft Excel 2010 This class is designed to cover the following basics: What you can do with Excel Excel Ribbon Moving and selecting cells Formatting cells Adding Worksheets, Rows and
1 Introduction to Using Excel Spreadsheets
 Survey of Math: Excel Spreadsheet Guide (for Excel 2007) Page 1 of 6 1 Introduction to Using Excel Spreadsheets This section of the guide is based on the file (a faux grade sheet created for messing with)
Survey of Math: Excel Spreadsheet Guide (for Excel 2016) Page 1 of 9
 Page 1 of 9") Survey of Math: Excel Spreadsheet Guide (for Excel 2016) Page 1 of 9 Contents 1 Introduction to Using Excel Spreadsheets 2 1.1 A Serious Note About Data Security.................................... 2 1.2
Survey of Math: Excel Spreadsheet Guide (for Excel 2016) Page 1 of 9 Contents 1 Introduction to Using Excel Spreadsheets 2 1.1 A Serious Note About Data Security.................................... 2 1.2
SPSS. Faiez Mussa. 2 nd class
 SPSS Faiez Mussa 2 nd class Objectives To describe opening and closing SPSS To introduce the look and structure of SPSS To introduce the data entry windows: Data View and Variable View To outline the components
UW Department of Chemistry Lab Lectures Online
 Introduction to Excel and Computer Manipulation of Data Review Appendix A: Introduction to Statistical Analysis. Focus on the meanings and implications of the calculated values and not on the calculations.
SPSS. (Statistical Packages for the Social Sciences)
") Inger Persson SPSS (Statistical Packages for the Social Sciences) SHORT INSTRUCTIONS This presentation contains only relatively short instructions on how to perform basic statistical calculations in SPSS.
Inger Persson SPSS (Statistical Packages for the Social Sciences) SHORT INSTRUCTIONS This presentation contains only relatively short instructions on how to perform basic statistical calculations in SPSS.
MICROSOFT WORD. MS. Office includes the following application:
 MICROSOFT WORD MS. Office consists of group of application developed overtime by MS work together, both in terms of accomplishing things is a similar way and in terms of providing easy of data. MS. Office
AcaStat User Manual. Version 8.3 for Mac and Windows. Copyright 2014, AcaStat Software. All rights Reserved.
 AcaStat User Manual Version 8.3 for Mac and Windows Copyright 2014, AcaStat Software. All rights Reserved. http://www.acastat.com Table of Contents INTRODUCTION... 5 GETTING HELP... 5 INSTALLATION... 5
Using Microsoft Word. Working With Objects
 Using Microsoft Word Many Word documents will require elements that were created in programs other than Word, such as the picture to the right. Nontext elements in a document are referred to as Objects
Microsoft Office. Microsoft Office
 is an office suite of interrelated desktop applications, servers and services for the Microsoft Windows. It is a horizontal market software that is used in a wide range of industries. was introduced by
INTRODUCTION... 1 UNDERSTANDING CELLS... 2 CELL CONTENT... 4
 Introduction to Microsoft Excel 2016 INTRODUCTION... 1 The Excel 2016 Environment... 1 Worksheet Views... 2 UNDERSTANDING CELLS... 2 Select a Cell Range... 3 CELL CONTENT... 4 Enter and Edit Data... 4
Beyond 20/20. QuickStart Guide. Version 7.0, SP3
 Beyond 20/20 QuickStart Guide Version 7.0, SP3 Notice of Copyright Beyond 20/20 Desktop Browser Version 7.0, SP3 Copyright 1992-2006 Beyond 20/20 Inc. All rights reserved. This document forms part of the
Excel 2016 Intermediate for Windows
 1 Excel 2016 Intermediate for Windows Excel Intermediate Training Objective To learn the tools and features of Excel 2016, and gain vital skills to use Excel more efficiently and effectively. What you
Computer Applications Final Exam Study Guide
 Name: Computer Applications Final Exam Study Guide Microsoft Word 1. To use -and-, position the pointer on top of the selected text, and then drag the selected text to the new location. 2. The Clipboard
EDIT202 Spreadsheet Lab Prep Sheet
 EDIT202 Spreadsheet Lab Prep Sheet While it is clear to see how a spreadsheet may be used in a classroom to aid a teacher in marking (as your lab will clearly indicate), it should be noted that spreadsheets
Introduction to Microsoft Excel 2010
 Introduction to Microsoft Excel 2010 This class is designed to cover the following basics: What you can do with Excel Excel Ribbon Moving and selecting cells Formatting cells Adding Worksheets, Rows and
Microsoft Excel Basics Ben Johnson
 Microsoft Excel Basics Ben Johnson Topic...page # Basics...1 Workbook and worksheets...1 Sizing columns and rows...2 Auto Fill...2 Sort...2 Formatting Cells...3 Formulas...3 Percentage Button...4 Sum function...4
Appendix A. SPSS 11.x in 30 Minutes
 Appendix A SPSS 11.x in 30 Minutes For use with Exploring Research (5/e) Neil J. Salkind 1 Lesson 1 Starting SPSS After This Lesson, You Will Know How to start SPSS What the opening SPSS screen looks like
THE BASICS OF USING SPSS OCTOBER 22, 2008
 Faculty Research Center College of Education http://frc.coe.nau.edu/ OCTOBER 22, 2008 PRESENTED BY: Robert A. Horn, Ph.D. Assistant Professor, Educational Psychology 928-523-0545 Robert.Horn@nau.edu PRESENTATION
CHRIST THE KING BOYS MATRIC HR. SEC. SCHOOL, KUMBAKONAM CHAPTER 2 TEXT FORMATTING
 CHAPTER 2 TEXT FORMATTING 1. Explain how to create a Bulleted and Numbered List in Star Office Writer? One way to create a list of points or topics in a document is to create a bulleted list. A bullet
EXCEL 2007 TIP SHEET. Dialog Box Launcher these allow you to access additional features associated with a specific Group of buttons within a Ribbon.
 EXCEL 2007 TIP SHEET GLOSSARY AutoSum a function in Excel that adds the contents of a specified range of Cells; the AutoSum button appears on the Home ribbon as a. Dialog Box Launcher these allow you to
Create Custom Tables in No Time
 PASW Custom Tables 18 Create Custom Tables in No Time Easily analyze data and communicate your results with PASW Custom Tables Show the results of analyses clearly and quickly You often report the results
Microsoft Excel Pivot Tables & Pivot Table Charts
 Microsoft Excel 2013 Pivot Tables & Pivot Table Charts A pivot table report allows you to analyze and summarize a million rows of data in Excel 2013 without entering a single formula. Pivot Tables let
Beginning Excel for Windows
 Beginning Excel for Windows Version: 2002 Academic Computing Support Information Technology Services Tennessee Technological University September 2003 1. Opening Excel for Windows and Setting the Toolbars
MOVING FROM CELL TO CELL
 VCAE: EXCEL Lesson 1 Please send comments to Author: Zahra Siddiqui at zed_ess@hotmail.com Concepts Covered: Cell Address; Cell Pointer; Moving across Cells Constants: Entering, Editing, Formatting Using
Study Guide. PCIC 3 B2 GS3- Key Applications-Excel. Copyright 2010 Teknimedia Corporation
 Study Guide PCIC 3 B2 GS3- Key Applications-Excel Copyright 2010 Teknimedia Corporation Teknimedia grants permission to any licensed owner of PCIC 3 B GS3 Key Applications-Excel to duplicate the contents
A Brief Word About Your Exam
 Exam 1 Studyguide A Brief Word About Your Exam Your exam will be MONDAY, FEBRUARY 20 DURING CLASS TIME. You will have 50 minutes to complete Exam 1. If you arrive late or leave early, you forfeit any time
Excel Primer CH141 Fall, 2017
 Excel Primer CH141 Fall, 2017 To Start Excel : Click on the Excel icon found in the lower menu dock. Once Excel Workbook Gallery opens double click on Excel Workbook. A blank workbook page should appear
How to Use a Statistical Package
 APPENDIX D How to Use a Statistical Package Candace M. Evans, Lisa M. Gilman, Jeffrey Xavier, Joan Saxton Weber Computers and statistical software such as the Statistical Package for the Social Sciences
Tests of difference for two sample designs. Bivariate and multiple regression. Analysis of covariance and multivariate analysis of variance
 Chapter 1 Introduction 1 Chapter 2 Chapter 3 Chapter 4 Chapter 5 Chapter 6 Chapter 7 Chapter 8 Chapter 9 Chapter 10 Chapter 11 Chapter 12 Chapter 13 Data entry in SPSS Exploring data in SPSS Data handling
Studying in the Sciences
 Organising data and creating figures (charts and graphs) in Excel What is in this guide Familiarisation with Excel (for beginners) Setting up data sheets Creating a chart (graph) Formatting the chart Creating
4. Descriptive Statistics: Measures of Variability and Central Tendency
 4. Descriptive Statistics: Measures of Variability and Central Tendency Objectives Calculate descriptive for continuous and categorical data Edit output tables Although measures of central tendency and
CSSCR Excel Intermediate 4/13/06 GH Page 1 of 23 INTERMEDIATE EXCEL
 CSSCR Excel Intermediate 4/13/06 GH Page 1 of 23 INTERMEDIATE EXCEL This document is for those who already know the basics of spreadsheets and have worked with either Excel for Windows or Excel for Macintosh.
eschoolplus+ Cognos Query Studio Training Guide Version 2.4
 + Training Guide Version 2.4 May 2015 Arkansas Public School Computer Network This page was intentionally left blank Page 2 of 68 Table of Contents... 5 Accessing... 5 Working in Query Studio... 8 Query
Canadian National Longitudinal Survey of Children and Youth (NLSCY)
") Canadian National Longitudinal Survey of Children and Youth (NLSCY) Fathom workshop activity For more information about the survey, see: http://www.statcan.ca/ Daily/English/990706/ d990706a.htm Notice
Canadian National Longitudinal Survey of Children and Youth (NLSCY) Fathom workshop activity For more information about the survey, see: http://www.statcan.ca/ Daily/English/990706/ d990706a.htm Notice
Getting Started With. A Step-by-Step Guide to Using WorldAPP Analytics to Analyze Survey Data, Create Charts, & Share Results Online
 Getting Started With A Step-by-Step Guide to Using WorldAPP Analytics to Analyze Survey, Create Charts, & Share Results Online Variables Crosstabs Charts PowerPoint Tables Introduction WorldAPP Analytics
An Introduction to Microsoft Excel For Adult Learners. A Project-Based Approach
 An Introduction to Microsoft Excel For Adult Learners A Project-Based Approach Introduction Why should you use Microsoft Excel? Microsoft Excel is one of the most common tools in any business. It may be
Introduction to Excel
 Introduction to Excel Written by Jon Agnone Center for Social Science Computation & Research 145 Savery Hall University of Washington Seattle WA 98195 U.S.A. (206)543-8110 November 2004 http://julius.csscr.washington.edu/pdf/excel.pdf
Statistical Good Practice Guidelines. 1. Introduction. Contents. SSC home Using Excel for Statistics - Tips and Warnings
 Statistical Good Practice Guidelines SSC home Using Excel for Statistics - Tips and Warnings On-line version 2 - March 2001 This is one in a series of guides for research and support staff involved in
Gloucester County Library System. Excel 2010
 Gloucester County Library System Excel 2010 Introduction What is Excel? Microsoft Excel is an electronic spreadsheet program. It is capable of performing many different types of calculations and can organize
Working with Excel CHAPTER 1
 CHAPTER 1 Working with Excel You use Microsoft Excel to create spreadsheets, which are documents that enable you to manipulate numbers and formulas to quickly create powerful mathematical, financial, and
One does not necessarily have special statistical software to perform statistical analyses.
 Appendix F How to Use a Data Spreadsheet Excel One does not necessarily have special statistical software to perform statistical analyses. Microsoft Office Excel can be used to run statistical procedures.
Using Microsoft Excel
 Using Microsoft Excel Introduction This handout briefly outlines most of the basic uses and functions of Excel that we will be using in this course. Although Excel may be used for performing statistical
Rockefeller College MPA Excel Workshop: Clinton Impeachment Data Example
 Rockefeller College MPA Excel Workshop: Clinton Impeachment Data Example This exercise is a follow-up to the MPA admissions example used in the Excel Workshop. This document contains detailed solutions
Basics of Spreadsheet
 106 :: Data Entry Operations 6 Basics of Spreadsheet 6.1 INTRODUCTION A spreadsheet is a large sheet having data and information arranged in rows and columns. As you know, Excel is one of the most widely
Gloucester County Library System EXCEL 2007
 Gloucester County Library System EXCEL 2007 Introduction What is Excel? Microsoft E x c e l is an electronic s preadsheet program. I t is capable o f performing many diff e r e n t t y p e s o f c a l
Intermediate Excel 2003
 Intermediate Excel 2003 Introduction The aim of this document is to introduce some techniques for manipulating data within Excel, including sorting, filtering and how to customise the charts you create.
MICROSOFT OFFICE. Courseware: Exam: Sample Only EXCEL 2016 CORE. Certification Guide
 MICROSOFT OFFICE Courseware: 3263 2 Exam: 77 727 EXCEL 2016 CORE Certification Guide Microsoft Office Specialist 2016 Series Microsoft Excel 2016 Core Certification Guide Lesson 1: Introducing Excel Lesson
Working with Excel involves two basic tasks: building a spreadsheet and then manipulating the
 Working with Excel You use Microsoft Excel to create spreadsheets, which are documents that enable you to manipulate numbers and formulas to create powerful mathematical, financial, and statistical models
Excel 2013 Workshop. Prepared by
 Excel 2013 Workshop Prepared by Joan Weeks Computer Labs Manager & Madeline Davis Computer Labs Assistant Department of Library and Information Science June 2014 Excel 2013: Fundamentals Course Description
Freestyle Reports DW DIG Crosstabs, Hotspots and Exporting
 Exporting a Report You can export a report into other file formats. Acrobat (.pdf) Before exporting a report to.pdf format, make sure the columns in your report provide ample space for their contents.