Basic Reports & Dashboards
|
|
|
- Octavia Tucker
- 6 years ago
- Views:
Transcription


1 Basic Reports & Dashboards Arizona Board of Regents, 2012 updated v.1.10 For information and permission to use our PDF manuals, please contact PDFs available at
2 COPYRIGHT & TRADEMARKS Copyright 2012, Arizona Board of Regents. All rights reserved. Record of Changes Date Version # Description 04/01/ Original 06/01/ Corrected some capitalization errors.
3 Table of Contents About this Workshop... v Access to Analytics Data... v Mosaic Community... v Getting Around in Analytics... 1 Working with the Home Page... 1 Working with the Global Header Review - Home Page and Global Header Working with Analyses Analytics Data Creating a New Analysis Filtering an Analysis Working with Columns Editing the Table View Exercise - Creating a New Analysis Adding a Graph Exercise - Adding a New View Working with Dashboards Creating a New Dashboard Working with Dashboard Functionality Review - Working with Dashboards Appendix A Adding a Pivot Table Index Page iii
4 Page iv
5 About this Workshop This workshop introduces attendees to UAccess Analytics, the University's report and dashboard creating tool. This is a basic hands-on session, appropriate for people who will be creating employee-based ad hoc analyses (reports) and basic dashboards (collections of reports on a single web page) in Analytics. For information on additional workshops in which you can further your knowledge of Requests and Dashboards, please go to the Workshops and Training Team website at Access to Analytics Data Request for Individual access to UAccess Analytics can be submitted to Mosaic Community The Mosaic Community is an online networking resource available to everyone on campus who uses UAccess systems. If you have an official UA address, you can request membership in the Mosaic Community. Just go to and click the Sign Up link in the upper right corner of the screen. Once your membership is confirmed usually within a few hours you ll have access to valuable information about all of the various aspects of the Mosaic Project. You ll want to join one or more of the groups within the Community, because that s where the value comes in. In each of the group areas, there are short videos showing you how to perform different tasks, discussion boards with questions from campus and answers from the experts, and information on upcoming workshops from the Workshops and Training Team. Please take advantage of the opportunity and become a member of the Mosaic Community. Page v
6

7 Getting Around in Analytics Working with the Home Page Procedure The Home page is the first screen you land on when you log into UAccess Analytics. 1. This is the UAccess Analytics Home page. The page is divided into different sections, each of which has a different purpose. Page 1
8 2. The Create section contains links which allow you to begin building different Analytics items. To get started, just click the appropriate link. 3. In this case, you are creating an analysis (a query). Click the Analysis link. Page 2
9 4. Once you click a link in the Create section, Analytics will either take you to another screen or, more often, simply open a pop-up window in which you can select a Subject Area for your analysis or other item. Page 3
10 5. The Browse/Manage section contains links to file management screens. 6. Choose a folder here to look for content that you want to open or edit. Click the All Content link. Page 4
11 7. You can either browse or search for Analyses and other files in the Presentation Catalog. Click the Browse Presentation Catalog link. Page 5
12 8. The Catalog includes all of the information in your personal folders and in the Shared Folders that you have access to. 9. Expand or collapse the folders to view sub-folders within them. Note: Sub-folders are also visible in the pane on the right side of the screen. Click the + button before My Folders. Page 6
13 10. Click the folder name to see the contents of that folder. Click the Upgrade Workshop link. Page 7

14 11. Now you're looking at the contents of the specific folder. Note that there are different types of items here (prompts and Analyses), each of which is represented by a different icon. The icons you see depend on what types of items are in the folder. 12. You can go back to the Home page at any time by simply clicking the link on the Global Header. Click the Home link. Page 8
15 13. The Get Started section contains links to Help documentation, the Mosaic Community (UAccess Analytics Community Forum), the Workshops and Training Team, and the Enterprise Information & Analytics team websites. 14. Take a closer look at the Help documentation. Click the Help Contents link. Page 9
16 15. Click the UAccess Analytics link. Page 10
 to search for a specific topic. 18. Click the Close button. Page 11")
17 16. You can navigate through all of the help documentation from this one page. Note: Oracle Business Intelligence Enterprise Edition is the software that drives UAccess Analytics. 17. Note: Use the browser's built-in find function (typically available by pressing [CTRL+F] on your keyboard) to search for a specific topic. 18. Click the Close button. Page 11
18 19. The bulk of the Home page is taken up with two additional sections. The Recent section displays up to six dashboards you've recently accessed, and as many as nine other items you've opened. Click the appropriate link to navigate directly to the dashboard or other item. Page 12
19 20. The Most Popular section displays as many as six different dashboards that other Analytics users have been using. Note: You will only see those items to which you have been granted access. 21. That's it for the features of the Home Page! End of Procedure. Page 13
20 Page 14
21 Working with the Global Header Procedure Another great feature in UAccess Analytics is the Global Header. 1. The Global Header (the blue bar across the top of the screen) is present on all screens in UAccess Analytics. The Global Header allows you to navigate within the application from your current screen. 2. Some of these Global Header links duplicate other navigation options on the Home page. Choose whichever method you prefer. For instance, the Catalog link takes you to the same area of the software you navigate to when you click All Content > Browse Presentation Catalog in the Browse/Manage section of the Home page. Click the Catalog link. Page 15

22 3. The Global Header looks exactly the same on each page even though you are now looking at a different part of Analytics. 4. Click the Dashboards link. Page 16
23 5. All of the dashboards are available through one handy vertical menu, accessible from anywhere in the software. Click the PELs by Home Department link. Page 17

24 6. The various dashboards provide access to the Analyses and information you need. 7. When you need to create a new analysis, you can simply click the New link on the Global Header, regardless of where you are in the application. Click the New link. 8. From the drop-down menu, you can begin the process of creating any of the items on the menu. 9. If you want to open an already-existing item, use the Open menu. Click the Open link. 10. The Open menu includes quick links to Recent and Most Popular items, just like the Home page. You can also click the Open folder to navigate to additional items. 11. The Global Header also includes a Search function. Enter "11g" in the Search field. Page 18

25 12. Click the Search button. 13. Analytics locates items that include your search term in the name or description. Click the Open link. Page 19

26 14. Navigate back to the Home page using the Global Header. Click the Home link. 15. You can also manage your account settings from the Global Header by clicking on your name. Click the Super Steven Singkofer link. 16. Click the My Account link. Page 20
27 17. The My Account screen has four tabs. The Preferences tab lets you change a few things, including the landing page you see when you log into Analytics. Click the Starting Page drop-down list. Page 21

28 18. You could elect to start on any dashboard page instead of the Home page. 19. Click the Roles and Catalog Groups tab. Page 22
29 20. The Roles and Catalog Groups tab shows you the roles you've been assigned in UAccess Analytics. Click the OK button. 21. That's it for the Global Header. Remember that it is available no matter where you are in Analytics and allows you to readily navigate to any part of the system. End of Procedure. Page 23
30 Page 24
31 Review - Home Page and Global Header Exercise 1 1. When logging in to UAccess Analytics, users will typically land on the. 2. On the Home page, users can see as many as dashboards they've previously accessed. 3. To manage existing Analyses, prompts, and other items, a user may click an appropriate link in the section of the Home page. 4. You can also get to a file manager by clicking on the Global Header. 5. When you need to create a new analysis, you can click the link on the Global Header. 6. To find a list of the roles you've been assigned, you can click on, then. Page 25
32 Page 26
33 Working with Analyses Analytics Data Where does the data come from? The information available in Analytics comes from the data warehouse The data warehouse is fed by the source software; e.g., UAccess Financials, UAccess Student, etc. How is the data organized? The data is organized into Subject Areas Subject Areas contain many tables of data Each table contains many columns of data Most columns in Analytics appear because a field exists in the source software Some columns in Analytics appear because someone created that column; i.e., calculated columns (e.g., averages, counts, sums) Columns within tables may be organized alphabetically or by subjective importance; the organization of the columns varies with the table Tables very often contain three versions of many columns, e.g., o Position Code (or ID) a one-, two-, or three-character alphanumeric code or abbreviation o Position an shorter form of the Description column (10 char) o Position Desc a longer description of the column s information (30 char) Sometimes there are just two versions of columns, e.g., o ABOR Code (or ID) a one-, two-, or three-character alphanumeric code or abbreviation o ABOR Code Description a longer description of the column s information (30 char) Indicators, Flags, and Current columns are often Y or N columns, e.g., Disabled Veteran Flag, Works with Animals Flag, or Current Indicator are all Y/N columns Date Tables Date tables for important dates contain many versions of date data The one you want will be the Day Date column Additional Data Tables Some table names begin with the word Additional. Those tables contain variations of columns that exist in other tables, e.g., Alternate Employee ID, or Home Address 4, and may also contain columns of information that are not likely to be used, e.g., Military Compensation Code, or Congruent Address Indicator. Page 27
34 Page 28
35 Page 29
36 Creating a New Analysis Procedure The process of creating a new analysis in UAccess Analytics is fairly straightforward. 1. In this example, you are creating an analysis designed to show you the trends in student enrollment numbers in a particular college and set of majors across several terms. Click the New drop-down list. 2. A drop-down menu appears, and you could click the Analysis link on that menu. Page 30
37 3. Alternatively, if you are on the Home page, you could click the Analysis link from the Create section. Click the Analysis link. 4. Whichever way you choose, a pop-up screen listing all of the available Subject Areas. Click the scrollbar. 5. When you find the Subject Area you wish to use, simply select that Subject Area. Click the CSW - Student Records - Class Enrollment link. 6. The screen changes and you're ready to start choosing columns to create your analysis. Click the scrollbar. Page 31
38 7. Click the + button before Term. 8. Double-click columns to move them into the Selected Columns section of the screen. Double-click the Term Description list item. 9. Click the scrollbar. 10. Click the + button before Academic Program. Page 32
39 11. You can also drag-and-drop columns. Drag-and-drop the Academic Program Desc column into the Selected Columns area. Click the Academic Program Description list item and drag it to the desired location. 12. Click the scrollbar. 13. Click the + button before Term Career Program Plan. 14. Click the scrollbar. Page 33
40 15. Double-click the Primary Major Acad Plan Desc list item. 16. Click the scrollbar. 17. Click the + button before Fact Class Enrollment. 18. Double-click the Student Enrollment Count list item. End of Procedure. Page 34
41 Page 35
42 Filtering an Analysis Procedure You've started the process of creating an analysis. Part of that process is filtering the data to get just what you need. 1. All of the columns of data you need are now in the analysis. Use the Academic Program Desc column to limit the data to students in your college. Click the Preferences icon. 2. Click the Filter list item. Page 36
43 3. Three elements are required to create a filter through this method. 1) You need to have already selected the Column. 2) The default Operator needs to work for this filter, or you need to change it. 3) You need to identify one or more Values. 4. Click the Value drop-down list. 5. This example uses Eller College of Management. Click the scrollbar. Page 37
44 6. Choose the Academic Program you want to use for your filter. Click the Eller College of Management checkbox. 7. Click the OK button. 8. Now filter on the Primary Major Acad Plan Desc column to remove students who haven't selected a major. Click the Preferences icon. Page 38
45 9. Click the Filter list item. 10. In this instance, you want to make sure that the students have chosen a major. In other words, you want to make sure that there is a value in the Primary Major Academic Plan column. You can accomplish this simply by choosing the right Operator. Click the Operator drop-down list. Page 39
46 11. In this operator, the word "null" takes the place of any values. Click the is not null list item. 12. Click the OK button. 13. Sometimes you need to create a filter using a column that is not in your analysis. In this case, you need to filter to one or more Academic Years. Click the Filter icon. Page 40
47 14. Click the More Columns list item. 15. Click the scrollbar. 16. Click the + button before Term. Page 41
48 17. Use Academic Year for this filter. Click the Academic Year list item. 18. Click the OK button. 19. You don't always have to select your filter values from a list. If you know exactly what values you need, you may simply type them into the Value field. Enter "2011; 2012" in the Value field. Page 42

49 20. Click the OK button. 21. Once you have added a filter, you might have to edit it at some point. Point to the Filter icon. Page 43
50 22. The Edit, Copy, Paste, and Delete buttons appear when you hover over or click on an existing filter. 23. Save the analysis. Click the Save icon. Page 44
51 24. As you save an analysis, you have the option of creating a new folder to organize that analysis. Click the New Folder icon. 25. Enter "Basic Workshop" in the Name field. 26. Click the OK button. 27. Enter "Student Enrollment" in the Name field. 28. Enter "An analysis created to show the changes in student enrollment in a particular college and set of majors across several terms." in the Description field. Page 45
52 29. Click the OK button. 30. You have just created a basic analysis. End of Procedure. Page 46
53 Page 47
54 Working with Columns Procedure You've created, filtered, and saved the analysis. It's time to look at the results. 1. Click the Results tab. 2. Looking at the Compound Layout screen on the Results tab, you can see the Title view and the Table view. This table shows the four columns that you used to create this analysis. In the lower-left corner of the screen, you see a Views window. Both the Title and Table views are listed in that window. Page 48

55 3. You can also preview how the analysis will look when you drop it into a dashboard. Click the Preview on Dashboard icon. 4. The analysis looks a bit different here, but mostly because the boxes have been removed from around the views. You should use this Dashboard Preview screen to test any and all functionality of your Analyses, rather than testing directly on the Compound Layout screen. Click the Close button. Page 49

56 5. By default, the table displays just the first 25 rows of data. You can page through the analysis by using the appropriate button at the bottom of the table. You can also expand the table to see all rows of data. Click the Display More Rows icon. 6. Click the scrollbar. 7. Now you see 266 rows. Note that the terms are not in time order. They're in alphabetical order. Also note that the Academic Program column doesn't provide any valuable data. It just repeats the College name. 8. Click the First 25 Rows icon. Page 50

57 9. Since the Academic Program Desc column does not show much information, remove it from this view. Right-click the Academic Program Desc column header. 10. Click the Exclude column list item. Page 51
58 11. The column has been removed from this view but it has not been removed from the analysis. 12. You can add another column to sort the terms chronologically rather than alphabetically. Click the Criteria tab. Page 52
59 13. The Academic Program Desc column is still here even though it was removed from the Table view. Note: Excluding a column from the Table view on the Results tab does not remove that column from the analysis. 14. If you want to remove the column from the analysis, you would need to remove it on the Criteria tab. 15. Add the Term Code so that you can sort chronologically. Click the scrollbar. 16. Click the + button before Term. Page 53
60 17. Double-click the Term Code list item. 18. Move the Term Code to the first position. Page 54
61 19. Click the Results tab to view the changes. Click the Results tab. Page 55
62 20. The new column isn't in the table. If you add a data column to a request from the Criteria tab after you have already viewed the results, the column will be excluded from the table view. 21. A new data column will be excluded from the table view on the Results tab if you've added that data column from the Criteria tab after having viewed the Results tab. Note: Review the Editing the Table View tutorial for details on how to add the new column to your Table view. 22. Click the Save icon. Page 56

63 23. Once it's been saved, the word Saved with a little green check mark next to it appear next to the Save icon. 24. Those are the basics of excluding and adding columns to a request. End of Procedure. Page 57
64 Editing the Table View Procedure There are quite a few options for how you arrange your columns in the Table view. 1. Some unexpected things happen when you add or exclude columns. Editing the Table view may help you grasp why those unexpected things occur. 2. Click the Edit View icon. Page 58

65 3. When you edit the Table view, the screen is split into two sections. The usual view of the table, and a Layout section at the bottom. You can resize the Layout section to make things easier to see and work with. 4. Drag-and-drop the Layout bar to a higher position on the screen. Click the Layout object and drag it to the desired location. 5. In the Layout screen, you see several different areas: - Table Prompts - Sections - Columns and Measures - Excluded Moving data columns around among those areas allow you to display the data in different ways for different purposes. Page 59
66 6. The Term Code and Academic Program Desc columns are already in the Excluded area. You purposely excluded the Academic Program Desc column from the Table view. When you added the Term Code column from the Criteria tab after having viewed the analysis on the Results tab, the system dropped the Term Code column into the Excluded area. That's why neither of the columns exist in the Table view, but they are both present on the Criteria tab. 7. Drag-and-drop the Term Code column to the Columns and Measures area and drop it to the left of the Term Description column. Click the Term object and drag it to the desired location. Page 60
67 8. The reason you added the Term Code column to the analysis was to provide a means of ordering the data. That doesn't mean you need to see that column, however. Click the More options icon. Page 61

68 9. Click the Hidden list item. 10. You can add totals to the Table in various locations. Add totals to the Columns and Measures area. Click the Total icon. Page 62
69 11. Click the After list item. 12. Now drag both of the Term columns to the Table Prompts area. Drag-and-drop by clicking and dragging the Term table header. This will create a separate page for each of the different terms in the list. Click the Term table and drag it to the desired location. Page 63
70 13. Notice the drop-down menu at the top of the table that allows you to choose a term to display. 14. You can add totals to the Table Prompts area, too. Click the Total icon. Page 64
71 15. Click the After list item. 16. Take a look to see what you've created. Click the Term Description drop-down list. Page 65

72 17. This analysis is filtered to the 2011 and 2012 academic years. The items you see in the drop-down menu are the terms that make up the two academic years. Also note that the terms are in the proper sequential order. The All Values item at the bottom of the menu is the total that you just added to the Table Prompts area. 18. You're done editing the Table view. Click the Done button. Page 66
73 19. Any users of this analysis will be able to select the term they wish to see. One thing that's missing, however, is a Filters View. 20. Click the New View icon. 21. Click the Filters list item. Page 67

74 22. The Filters view has been added to the bottom of the analysis. 23. Click the Save icon. 24. That's how you edit your columns display in a Table view. End of Procedure. Page 68
75 Page 69
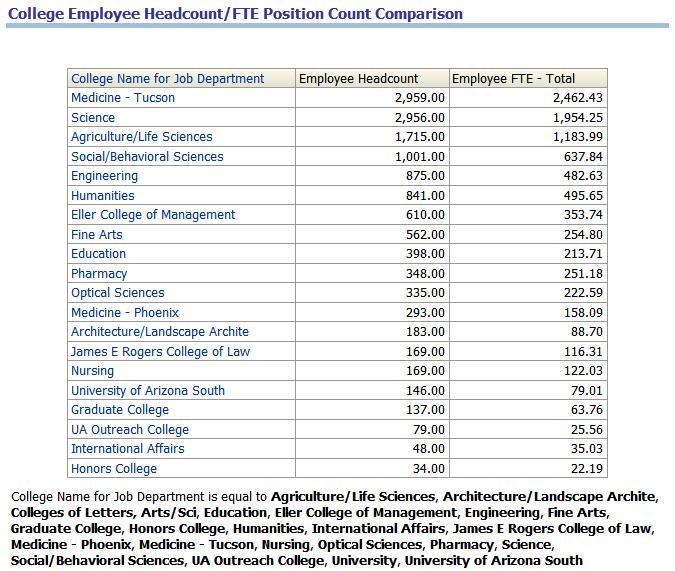
76 Exercise - Creating a New Analysis Exercise 1 Scenario: Your boss has asked you to create a very simple analysis. She would like to see a listing of all the colleges on campus, along with a count of their employees and a count of their FTEs. The list should be sorted to show the colleges with a greater number of employees at the top. 1. Create the analysis using the HCM - Employee Profile Subject Area. 2. Add these columns: Department > College Name for Job Department Measures > Counts > Employee Headcount Measures > Counts > Employee FTE - Total 3. Add a filter to limit the data to just the various colleges on all campuses. In other words, do not include any auxiliary departments. You should end up with approximately 19 rows of data in your analysis. 4. Order the information properly. 5. Edit the Column Properties and format the data such that the numbers are displayed with two decimal places in each numeric column. 6. Look at the Results. a. How many rows of data are present in your analysis? 7. Add a Filters View. 8. Save the analysis in your Basic Workshop folder as College Employee Headcount/FTE Comparison. Page 70
77 Page 71

78 Adding a Graph Procedure Adding a graph to the analysis will help viewers get a better idea of whatever trends are occurring. 1. Add a new view by using the buttons in the Views window. Click the New View icon. 2. Click the Graph list item. Page 72
79 3. Seeing trends is easiest with line graphs. Click the Line list item. Page 73

80 4. The graph is created automatically, based on the data and types of data you've included in the original analysis. You must often make modifications to the graph in order to present the data in a better way. 5. This screen is split into two sections just like other screens in the software. Columns of data can be moved around in the Layout window, which will allow you to display the data as you wish to see it. 6. Scroll down in the Layout window so you can see all of the sections. Click the scrollbar. 7. By default, any counts or other numeric-value columns will fall into the Measures section. All other columns will fall into the Line section. Page 74
81 8. What you are trying to graph is the total number of enrolled students per term. What is currently graphed is the number of enrolled students in each Academic Program and Major Plan per term. You have to exclude some columns. 9. Drag-and-drop the Academic Program Desc column from the Lines area into the Excluded area. Click the Academic Program Desc object and drag it to the desired location. 10. Drag-and-drop the Primary Major Acad Plan Desc column into the Excluded area. Click the Primary Major Acad Plan Desc object and drag it to the desired location. Page 75
82 11. There are a few additional minor modifications you can make. Click the Properties icon. 12. The Canvas Width and Canvas Height fields only accept pixel values. The graph size cannot be adjusted by percentage. There are Zoom and Scroll features here, too. 13. Click the Enable for Horizontal Axis checkbox. 14. Click the Enable for Vertical Axis checkbox. 15. Click the Titles and Labels tab. 16. The Graph Title isn't necessary. Click the Use measure name as graph title checkbox. Page 76
83 17. You can simplify both the Vertical Axis and Horizontal Axis Titles. Start with the Vertical Axis Title. Click the Use measure name as axis title checkbox. 18. Enter "Student Count" in the Vertical Axis Title field. 19. Now the Horizontal Axis Title. Click the Use column name as axis title checkbox. 20. Enter "Term" in the Horizontal Axis Title field. 21. Click the OK button. Page 77

84 22. Click the Done button. Page 78
85 23. When you add a new view using the buttons in the small Views window, the view isn't automatically added to the analysis. You must add it manually. 24. The Graph view is highlighted in the Views window. Click the Add View button. 25. New views are always added at the bottom of the analysis. Click the scrollbar. Page 79

86 26. Now that the graph appears, move it to a new location to make it more visible. 27. Drag-and-drop the graph and put it just to the right of the table. Click the Graph object and drag it to the desired location. Page 80

87 28. When you see the dark blue line touching the right side of the table, you have the graph in the right position. Release the mouse button. Page 81
88 29. The graph is now located in a great spot. Now test the Zoom and Scroll function that you enabled. 30. Point to the list item. 31. The Zoom and Scroll button doesn't appear until you hover over one of the axes in the graph. Once it appears, you can click the button. Click the Zoom and Scroll icon. 32. Click the Vertical Axis list item. Page 82

89 33. Click the Zoom In list item. Page 83
90 34. When you activate the Zoom and Scroll feature on a graph, the system drops a scroll bar onto the appropriate graph axis. 35. Click the Down button of the scrollbar. Page 84
91 36. Click the Up button of the scrollbar. Page 85
92 37. Now, turn off the Zoom and Scroll. Click the Zoom and Scroll icon. Page 86
93 38. Click the Actual Size list item. 39. The graph could be taller. Edit the graph. Click the Edit View icon. Page 87
94 40. Click the Properties icon. Page 88

95 41. Change the Canvas Height of the graph. Enter "500" in the Canvas Height field. 42. Click the OK button. 43. Click the Done button. Page 89

96 44. That looks great! Click the Save As icon. 45. Enter "Student Enrollment - Graphed" in the field. Page 90

97 46. Click the OK button. Page 91
98 Exercise - Adding a New View Exercise 2 Scenario: Your boss likes the analysis you created for her earlier. Now she'd like you to add a graph to the analysis. 1. Open the analysis you created in Exercise Add a New View: Graph > Bar > Horizontal. 3. Edit the graph properties: a. Increase the height of the graph to 400 pixels. b. Move the legend and put it above the graph. c. Remove the graph title. d. Modify the vertical axis title to read "Colleges." e. Modify the horizontal axis title to read "Counts." f. Click Done. 4. Move the Graph View to the right side of the Table View. 5. Save the modified analysis in your Basic Workshop folder as College Employee Headcount/FTE Comparison - Graphed. Page 92
99 Page 93
100 Working with Dashboards Creating a New Dashboard Procedure You've created the Analyses and the prompt. It's time to put it all together on a new dashboard page. 1. Start the process on the Global Header. Click the Dashboards drop-down list. 2. Create the new page on your own personal dashboard. Click the My Dashboard list item. Page 94
101 3. It doesn't matter if you already have multiple pages or an empty dashboard. Create a new page. Click the Page Options icon. Page 95

102 4. Click the Edit Dashboard list item. 5. Click the Add Dashboard Page icon. 6. Enter "Basic Workshop" in the Page Name field. 7. Enter "This page was created during the UAccess Analytics: Basic Workshop." in the Page Description field. Page 96
103 8. Click the OK button. Page 97
104 9. When you create a new dashboard page, that page is completely empty. Begin by adding sections from the Dashboard Objects pane on the left. Page 98

105 10. Drag a Section object into the empty dashboard. Click the Subject object and drag it to the desired location. Page 99
106 11. Dag a second Section into the dashboard and drop it below the first Section. Click the Subject object and drag it to the desired location. 12. Now that you have the basic layout in place, add your Analyses. Your Analyses live in the My Folders folder in the Catalog pane. Expand My Folders. Click the + button before My Folders. 13. Now expand the Basic Workshops folder. Click the + button before Basic Workshop. Page 100
107 14. Begin by dragging the Student Enrollment - Graphed analysis into Section 2. Page 101
108 15. Now drag the other three Analyses into Section 1. Click the Student Enrollment analysis and drag it to the desired location. 16. Continue with the College Employee Headcount/FTE Comparison analysis. Drop that analysis below the Student Enrollment analysis. You'll know you have it in the right location when you see the dark blue bar inside Section 1 and below the first analysis. Release the mouse button. 17. Continue dragging-and-dropping with the remaining Analyses. 18. Once you have all four remaining Analyses in Section 1, you can see that they are arranged vertically. You want them arranged horizontally. Hover your mouse over the upper-right corner of Section 1 to see the section buttons. Point to the desired location. Page 102
109 19. The greyed-out button is arranging the Analyses vertically. It's the Vertical Layout button. Click the Horizontal Layout icon. 20. Now the four Analyses in Section 1 are arranged horizontally. 21. Make some modifications to Section 1. Click the Properties icon. 22. There are a number of options here, which will help you make several changes. First, rename the section, then add the Section Header and the Section Title. Finally, format the section. Each time you make a change, click the Section Properties button. 23. Click the Rename link. 24. Enter "Additional Analyses" in the field. 25. Click the OK button. 26. Click the Properties icon. 27. Click the Show Section Header link. 28. Click the Properties icon. 29. Click the Show Section Title link. 30. Click the Properties icon. 31. Click the Format Section link. Page 103
110 32. When you format the section, you simply want to remove the borders. Click the Border Position drop-down list. 33. Click the None list item. 34. Click the OK button. 35. Now format Section 2. Click the Properties icon. 36. For Section 2, just turn on the Section Header. Click the Show Section Header link. 37. Save the dashboard. Click the Save button. 38. You've made a number of changes. You can preview the dashboard to see how you're doing. Click the Preview link. 39. That's not quite right. Those three Analyses in the top section are supposed to be links. You have more work to do. Click the Close button. 40. Make adjustments to the three Analyses in Section 1 to make them appear as links rather than displaying the Analyses directly on the dashboard. Start with the Student Enrollment analysis. Click the Properties icon. 41. Click the Display Results link. Page 104
111 42. Click the Link - In a Separate Window link. 43. Continue with the next analysis. Click the Properties icon. 44. Click the Display Results link. 45. Click the Link - In a Separate Window link. 46. Make the same changes to the remaining Analyses in Section 1. Once you have made the changes to all four Analyses, save your dashboard and take another look. Click the Save button. 47. Click the Preview link. 48. The four Analyses no longer appear in the preview screen. In fact, they don't appear at all! Don't worry. The preview screen doesn't necessarily show you exactly how the dashboard will look, but you will get a good idea. Links, which is what you've created, tend not to show. Click the Close button. 49. Click the Run link. 50. Your dashboard is complete. The three Analyses in the Additional Analyses section are displayed as links, and the reports can be displayed by clicking those links. The analysis in the bottom section is displayed directly on the screen, as desired. Page 105
112 Working with Dashboard Functionality Procedure Now that your dashboard page is finished, look at some functionality. 1. Open one of the additional Analyses. Click the Student Enrollment link. 2. Data can be manipulated on any analysis on any dashboard in many different ways. Exclude columns first, move any remaining columns as needed, then apply sorting. If you sort then move, you'll lose your sorting. Page 106
113 3. Click the Sort Ascending icon. 4. The counts are ordered from lowest to highest. Click the Sort Descending icon. 5. Now they're ordered from highest to lowest. Right-click the Student Enrollment Count column header. 6. There are other sorting options, too. Click the Sort layer list item. Page 107
114 7. Use the right-click Sort layer menu to sort ascending or descending, or to layer sorting by multiple columns. 8. You also have the option to clear any applied sorting. Click the Clear All Sorts in View list item. Page 108
115 9. Right-click the Student Enrollment Count column header. 10. There are other options available on the right-click menu. One option gives users the ability to exclude columns. Another option is to move columns. 11. Click the Move list item. Page 109
116 12. Users can move columns to the right or left, as appropriate, or can move them to either the Table Prompts or Section areas above the table. Note: This analysis already has the Term Description column in the Table Prompts area. 13. You can also drag columns from the Table Prompts or Sections areas back into the analysis. Click the Term Description object and drag it to the desired location. 14. The light blue bar shows you where the column will drop in. Page 110
117 15. The Term column is now in the analysis. Click the Return link. Page 111
118 16. If you've made changes that you wish to maintain, the next step is to save. Click the Page Options icon. 17. Click the Save Current Customization list item. 18. Enter "Workshop" in the Name field. Page 112

119 19. Use this setting to make this customization your default by clicking the checkbox. Click the OK button. 20. Clear the customizations, then reapply them to see how that functions. Click the Page Options icon. Page 113
120 21. Click the Clear My Customization list item. Page 114
121 22. The page has refreshed to its original state. Click the Page Options icon. Page 115
122 23. Click the Apply Saved Customization list item. Page 116

123 24. Click the Workshop list item. Page 117
124 25. Your customizations have been applied. 26. Those are the basics of working in a dashboard! End of Procedure. Page 118
125 Page 119
126 Review - Working with Dashboards Exercise 4 1. In order to preserve any customized sorting orders, you should sort your columns first, then move them. True False 2. You can create as many customized views of a dashboard page as you wish. True False 3. Once you Exclude a column, how can you add it back into the analysis? 4. The Table Prompts section will create a different smaller section report for each value in the column. True False 5. This was fun. True Yes Page 120
127 Page 121
128 Appendix A Adding a Pivot Table Procedure Pivot Tables are very useful ways of displaying counts of data by multiple characteristics. For instance, Pivot Tables allow you to answer requests like "show me how many students are in each of these ten majors broken out by academic level" and "show me the distribution of faculty in my college by department, rank, ethnicity, and gender." 1. In this tutorial, you are adding a Pivot Table to this analysis. Click the New View icon. Page 122
129 2. Click the Pivot Table list item. Page 123

130 3. The Pivot Table is automatically added, but it includes all of the columns which means you have to edit. 4. Click the Edit View icon. Page 124

131 5. The first thing you need to do is to exclude the Academic Program Desc column. Drag-and-drop it into the Excluded area. Click the Academic Program Desc object and drag it to the desired location. 6. Now move both of the Term columns into the Columns area. Click the Term object and drag it to the desired location. 7. The Term Code column is doing its job of ordering the information, but you don't need to see it, so hide it. Click the More options icon. Page 125

132 8. Click the Hidden list item. 9. Now move the Measure Labels item into the Excluded area. Click the Measure Labels object and drag it to the desired location. 10. You need a Grand Total of all the rows in this analysis, but you have an option here you didn't have before. Click the Total icon. Page 126

133 11. Click the Before list item. 12. Take a look at what the data looks like. Click the Done button. Page 127
134 13. When you add a new view, that view is always at the bottom of the analysis. Click the scrollbar. Page 128
135 14. Counts of students are displayed for each major in each term. The Grand Totals are located at the top, so users can see the totals, but can also access the detail numbers, if desired. The Pivot Table only displays the first 25 rows by default. 15. Delete the Table View. Scroll back up to the top of the analysis, then click the Delete button on the Table view. Click the scrollbar. 16. Click the Delete icon. 17. The Table view still exists in the analysis. Removing from the Compound Layout screen is the equivalent of putting it in your desk drawer. You still have it, but you can't see it on your desktop. If you look in the View window, you'll see the Table there. Click the Table list item. Page 129

136 18. Click the Remove View from Analysis icon. 19. The Table view has been completely removed from this analysis. 20. Now move the Pivot Table above the Filters view. Click the Pivot Table object and drag it to the desired location. 21. Save the analysis, but give it a new name. Click the Save As button. 22. Enter "Student Enrollment - Pivot Table" in the field. 23. Click the OK button. 24. You've added a basic Pivot Table to your analysis and edited it. Nice work! End of Procedure. Page 130
137 Page 131
138 Index Add Dashboard Page All Values Apply Saved Customization Browse/Manage... 4, 15 Catalog... 5, 6, 15, 99 Clear My Customization Column Properties Columns and Measures Compound Layout... 47, 48, 128 Create... 2 Criteria... 51, 52, 55, 59 Dashboard Objects Dashboards... i, ii, v, 16, 17, 93, 119 drag-and-drop Edit Dashboard Edit View... 57, 86, 123 Exclude column Excluded... 58, 59, 74, 124, 125 Filter... 35, 38, 39, 42 Filtering Filters View... 66, 69 Get Started... 9 Global Header... 8, 15, 16, 18, 20, 23, 25, 93 Graph... 71, 75, 78, 79, 91 Hidden... 61, 125 Home 1, 8, 12, 13, 15, 17, 18, 20, 22, 25, 27, 30 Home Page... 1, 13, 25 Layout... 58, 73, 102 Measure Labels Measures... 59, 61, 69, 73 Most Popular... 13, 18 Move... 53, 91, 108 My Account... 20, 21 My Dashboard New... 18, 29, 44, 66, 69, 78, 91, 93, 121 New View Open...18, 19, 91, 105 Operator... 36, 38 Order... 69, See Sort Page Options... 94, 111, 112, 114 Pivot Table , 122, 123, 128, 129 Preview on Dashboard Recent... 12, 18 Results... 47, 52, 54, 55, 59, 69, 103, 104 Roles and Catalog Groups Save. 43, 55, 56, 67, 69, 91, 103, 104, 129 Save As Save Current Customization Search... 18, 19 Section... 98, 99, 100, 101, 102, 103, 104, 109 Sections Selected Columns... 31, 32 Sort , 107, See Order Starting Page Subject Area... 3, 30, 69 Table Prompts 58, 62, 63, 65, 109, 119 Total...61, 63, 69, 125 Value... 36, 41 Views... 47, 71, 78 Page 132
139 Page 133
140 Page 134
UAccess ANALYTICS. Fundamentals of Reporting. updated v.1.00
 UAccess ANALYTICS Arizona Board of Regents, 2010 THE UNIVERSITY OF ARIZONA updated 07.01.2010 v.1.00 For information and permission to use our PDF manuals, please contact uitsworkshopteam@listserv.com
UACCESS ANALYTICS. Intermediate Reports & Dashboards. Arizona Board of Regents, 2015 THE UNIVERSITY OF ARIZONA. updated v.1.
 UACCESS ANALYTICS Arizona Board of Regents, 2015 THE UNIVERSITY OF ARIZONA For information and permission to use our PDF manuals, please send an email to: uitsworkshopteam@list.arizona.edu updated 06.01.2015
UAccess ANALYTICS Next Steps: Creating Report Selectors
 UAccess ANALYTICS Arizona Board of Regents, 2015 THE UNIVERSITY OF ARIZONA created 08.10.2015 v.1.00 For information and permission to use our PDF manuals, please contact uitsworkshopteam@list.arizona.edu
UAccess ANALYTICS Next Steps: Working with Bins, Groups, and Calculated Items: Combining Data Your Way
 UAccess ANALYTICS Next Steps: Working with Bins, Groups, and Calculated Items: Arizona Board of Regents, 2014 THE UNIVERSITY OF ARIZONA created 02.07.2014 v.1.00 For information and permission to use our
UAccess ANALYTICS Working with Agents: Delivering Data to Your Desktop
 UAccess ANALYTICS : Delivering Data to Your Desktop Arizona Board of Regents, 2015 THE UNIVERSITY OF ARIZONA updated 08.20.2015 v.3.00 For information and permission to use our PDF manuals, please contact
UAccess ANALYTICS. Intermediate Reports & Dashboards. updated v3.00
 UAccess ANALYTICS Intermediate Reports & Dashboards Arizona Board of Regents, 2017 THE UNIVERSITY OF ARIZONA For information and permission to use our PDF manuals, please send an email to: uitsworkshopteam@list.arizona.edu
UAccess ANALYTICS Oracle Business Intelligence Mobile for the Apple ipad or iphone
 UAccess ANALYTICS Oracle Business Intelligence Mobile for the Apple ipad or iphone Arizona Board of Regents, 2012 THE UNIVERSITY OF ARIZONA updated 07.06.2012 v.1.00 For information and permission to use
SmartView. User Guide - Analysis. Version 2.0
 SmartView User Guide - Analysis Version 2.0 Table of Contents Page i Table of Contents Table Of Contents I Introduction 1 Dashboard Layouts 2 Dashboard Mode 2 Story Mode 3 Dashboard Controls 4 Dashboards
Lesson 1: Creating and formatting an Answers analysis
 Lesson 1: Creating and formatting an Answers analysis Answers is the ad-hoc query environment in the OBIEE suite. It is in Answers that you create and format analyses to help analyze business results.
User Guide. Web Intelligence Rich Client. Business Objects 4.1
 User Guide Web Intelligence Rich Client Business Objects 4.1 2 P a g e Web Intelligence 4.1 User Guide Web Intelligence 4.1 User Guide Contents Getting Started in Web Intelligence 4.1... 5 Log into EDDIE...
To access BuckIQ, you must first be granted access. Send requests for permission to
 BuckIQ User s Guide Job Aid What is BuckIQ? Several years ago, Oracle took a look at the state of the Business Intelligence industry in terms of the different processes and applications that were required
Shopping Cart: Queries, Personalizations, Filters, and Settings
 Shopping Cart: Queries, Personalizations, Filters, and Settings on the Shopping Cart Home Page Use this Job Aid to: Learn how to organize the Shopping Cart home page so that it is easier to use. BEFORE
OBIEE. Oracle Business Intelligence Enterprise Edition. Rensselaer Business Intelligence Finance Author Training
 OBIEE Oracle Business Intelligence Enterprise Edition Rensselaer Business Intelligence Finance Author Training TABLE OF CONTENTS INTRODUCTION... 1 USER INTERFACE... 1 HOW TO LAUNCH OBIEE... 1 TERMINOLOGY...
Web Intelligence Reporting Basics HTML Version
 Training Guide Web Intelligence Reporting Basics HTML Version 2 Web Intelligence Reporting Basics Appropriate Use and Security of Confidential and Sensitive Information Due to the integrated nature of
UAccess ANALYTICS A New Look, New Features, and New Functions
 UAccess Analytics has been updated to a new version of software! Naturally, a software update means there are some new features and functions available to UAccess Analytics users. An Updated Look One thing
THE EXCEL ENVIRONMENT... 1 EDITING...
 Excel Essentials TABLE OF CONTENTS THE EXCEL ENVIRONMENT... 1 EDITING... 1 INSERTING A COLUMN... 1 DELETING A COLUMN... 1 INSERTING A ROW... DELETING A ROW... MOUSE POINTER SHAPES... USING AUTO-FILL...
The following instructions cover how to edit an existing report in IBM Cognos Analytics.
 IBM Cognos Analytics Edit a Report The following instructions cover how to edit an existing report in IBM Cognos Analytics. Navigate to Cognos Cognos Analytics supports all browsers with the exception
Oracle Business Intelligence Icon Definitions
 Oracle Business Intelligence Icon Definitions Version 1.0 JANUARY 14, 2015 OHIO UNIVERSITY Table of Contents Icon Definitions...2 1.1 Catalog Definitions for Report Consumers (ability to run reports)...2
Query Studio Training Guide Cognos 8 February 2010 DRAFT. Arkansas Public School Computer Network 101 East Capitol, Suite 101 Little Rock, AR 72201
 Query Studio Training Guide Cognos 8 February 2010 DRAFT Arkansas Public School Computer Network 101 East Capitol, Suite 101 Little Rock, AR 72201 2 Table of Contents Accessing Cognos Query Studio... 5
EDITING AN EXISTING REPORT
 Report Writing in NMU Cognos Administrative Reporting 1 This guide assumes that you have had basic report writing training for Cognos. It is simple guide for the new upgrade. Basic usage of report running
Blackboard for Faculty: Grade Center (631) In this document:
 In this document:") 1 Blackboard for Faculty: Grade Center (631) 632-2777 Teaching, Learning + Technology Stony Brook University In this document: blackboard@stonybrook.edu http://it.stonybrook.edu 1. What is the Grade Center?..
1 Blackboard for Faculty: Grade Center (631) 632-2777 Teaching, Learning + Technology Stony Brook University In this document: blackboard@stonybrook.edu http://it.stonybrook.edu 1. What is the Grade Center?..
Primo Analytics Workshop. BIBSYS Konferansen 20 March 2018
 Primo Analytics Workshop BIBSYS Konferansen 20 March 2018 Objectives By the end of this session, you will: Understand what is Primo Analytics and OBI. Have a high-level view of how Primo Analytics is working.
Salesforce Classic Guide for iphone
 Salesforce Classic Guide for iphone Version 35.0, Winter 16 @salesforcedocs Last updated: October 27, 2015 Copyright 2000 2015 salesforce.com, inc. All rights reserved. Salesforce is a registered trademark
Mastering the Environment WVU ecampus
 Mastering the Environment WVU ecampus Information Technology Services, West Virginia University Service Desk (304) 293-4444, ITShelp@mail.wvu.edu Mastering the Environment of WVU ecampus 1 Table of Contents
eschoolplus+ Cognos Query Studio Training Guide Version 2.4
 + Training Guide Version 2.4 May 2015 Arkansas Public School Computer Network This page was intentionally left blank Page 2 of 68 Table of Contents... 5 Accessing... 5 Working in Query Studio... 8 Query
Report Designer Report Types Table Report Multi-Column Report Label Report Parameterized Report Cross-Tab Report Drill-Down Report Chart with Static
 Table of Contents Report Designer Report Types Table Report Multi-Column Report Label Report Parameterized Report Cross-Tab Report Drill-Down Report Chart with Static Series Chart with Dynamic Series Master-Detail
Institutional Reporting and Analysis (IRA) For help, blitz "Financial Reports", or
 For help, blitz Financial Reports, or") Institutional Reporting and Analysis (IRA) 1 Training Agenda Introduction to the IRA Reporting Tool Logging onto the system (4-5) Navigating the Dashboard (6-10) Running Reports (11-12) Working with Reports
Institutional Reporting and Analysis (IRA) 1 Training Agenda Introduction to the IRA Reporting Tool Logging onto the system (4-5) Navigating the Dashboard (6-10) Running Reports (11-12) Working with Reports
UAccess STUDENT. Financial Aid Training Manual FA Fundamentals
 UAccess STUDENT Financial Aid Training Manual FA Fundamentals Table of Contents UAccess Student... 1 Financial Aid... 1 Financial Aid- Fundamentals... 1 Training Registration... 1 Navigating Through
FIN 850: UDW+ Finance Ad Hoc Reports Training Version 2.9
 FIN 850: UDW+ Finance Ad Hoc Reports Training Version 2.9 Program Services Office & Decision Support Group Table of Contents Subject Areas... 1 Criteria... 2 Exercise 1: Create a Budget Summary Report...
A Quick Introduction to the Genesis Framework for WordPress. How to Install the Genesis Framework (and a Child Theme)
") Table of Contents A Quick Introduction to the Genesis Framework for WordPress Introduction to the Genesis Framework... 5 1.1 What's a Framework?... 5 1.2 What's a Child Theme?... 5 1.3 Theme Files... 5
Table of Contents A Quick Introduction to the Genesis Framework for WordPress Introduction to the Genesis Framework... 5 1.1 What's a Framework?... 5 1.2 What's a Child Theme?... 5 1.3 Theme Files... 5
ICDL & OOo BASE. Module Five. Databases
 ICDL & OOo BASE Module Five Databases BASE Module Goals taken from the Module 5 ICDL Syllabus Module 5 Database requires the candidate to understand some of the main concepts of databases and demonstrates
Business Insight Authoring
 Business Insight Authoring Getting Started Guide ImageNow Version: 6.7.x Written by: Product Documentation, R&D Date: August 2016 2014 Perceptive Software. All rights reserved CaptureNow, ImageNow, Interact,
Creating a Dashboard Prompt
 Creating a Dashboard Prompt This guide will cover: How to create a dashboard prompt which can be used for developing flexible dashboards for users to utilize when viewing an analysis on a dashboard. Step
Navigate to Cognos Cognos Analytics supports all browsers with the exception of Microsoft Edge.
 IBM Cognos Analytics Create a List The following instructions cover how to create a list report in IBM Cognos Analytics. A list is a report type in Cognos that displays a series of data columns listing
IRA Basic Running Financial Reports
 IRA Basic Running Financial Reports Dartmouth College maintains a data warehouse of institutional finances, student data, advancement giving and other important measures. Institutional Reporting and Analysis
Salesforce Classic Mobile Guide for iphone
 Salesforce Classic Mobile Guide for iphone Version 41.0, Winter 18 @salesforcedocs Last updated: November 30, 2017 Copyright 2000 2017 salesforce.com, inc. All rights reserved. Salesforce is a registered
Designing Adhoc Reports
 Designing Adhoc Reports Intellicus Enterprise Reporting and BI Platform Intellicus Technologies info@intellicus.com www.intellicus.com Copyright 2010 Intellicus Technologies This document and its content
Numbers Basics Website:
 Website: http://etc.usf.edu/te/ Numbers is Apple's new spreadsheet application. It is installed as part of the iwork suite, which also includes the word processing program Pages and the presentation program
TABLE OF CONTENTS CHAPTER
 TABLE OF CONTENTS CHAPTER 1...1 A QUICK OVERVIEW OF THE MICROSOFT EXCHANGE CLIENT...1 BASIC CONCEPTS AND FEATURES...1 STARTING THE MICROSOFT EXCHANGE CLIENT...1 SETTING OPTIONS FOR YOUR MESSAGES...3 LOOKING
Table of Contents COURSE OVERVIEW... 5
 Table of Contents COURSE OVERVIEW... 5 DISCUSSION... 5 THE NEW DATABASE FORMAT... 5 COURSE TOPICS... 6 CONVENTIONS USED IN THIS MANUAL... 7 Tip Open a File... 7 LESSON 1: THE NEW INTERFACE... 8 LESSON
Excel Tables & PivotTables
 Excel Tables & PivotTables A PivotTable is a tool that is used to summarize and reorganize data from an Excel spreadsheet. PivotTables are very useful where there is a lot of data that to analyze. PivotTables
Desktop Studio: Charts
 Desktop Studio: Charts Intellicus Enterprise Reporting and BI Platform Intellicus Technologies info@intellicus.com www.intellicus.com Working with Charts i Copyright 2011 Intellicus Technologies This document
Desktop Studio: Charts. Version: 7.3
 Desktop Studio: Charts Version: 7.3 Copyright 2015 Intellicus Technologies This document and its content is copyrighted material of Intellicus Technologies. The content may not be copied or derived from,
Microsoft Excel 2010 Tutorial
 1 Microsoft Excel 2010 Tutorial Excel is a spreadsheet program in the Microsoft Office system. You can use Excel to create and format workbooks (a collection of spreadsheets) in order to analyze data and
Introduction. Table Basics. Access 2010 Working with Tables. Video: Working with Tables in Access To Open an Existing Table: Page 1
 Access 2010 Working with Tables Introduction Page 1 While there are four types of database objects in Access 2010, tables are arguably the most important. Even when you're using forms, queries, and reports,
GOBENCH IQ Release v
 GOBENCH IQ Release v1.2.3.3 2018-06-11 New Add-Ons / Features / Enhancements in GOBENCH IQ v1.2.3.3 GOBENCH IQ v1.2.3.3 contains several new features and enhancements ** New version of the comparison Excel
Stellar Training Guide
 Stellar Training Guide v. 2.1 - updated Winter 2008 Stellar Training Guide Table of Contents Getting to Know Stellar 1-5 Accessing Stellar 1-2 Stellar Home Page 3 Stellar Dayparts 4-5 Creating Stellar
Product Documentation SAP Business ByDesign August Analytics
 Product Documentation PUBLIC Analytics Table Of Contents 1 Analytics.... 5 2 Business Background... 6 2.1 Overview of Analytics... 6 2.2 Overview of Reports in SAP Business ByDesign... 12 2.3 Reports
NSCC SUMMER LEARNING SESSIONS MICROSOFT OFFICE SESSION
 NSCC SUMMER LEARNING SESSIONS MICROSOFT OFFICE SESSION Module 1 Using Windows Welcome! Microsoft Windows is an important part of everyday student life. Whether you are logging onto an NSCC computer or
Creating Reports in Access 2007 Table of Contents GUIDE TO DESIGNING REPORTS... 3 DECIDE HOW TO LAY OUT YOUR REPORT... 3 MAKE A SKETCH OF YOUR
 Creating Reports in Access 2007 Table of Contents GUIDE TO DESIGNING REPORTS... 3 DECIDE HOW TO LAY OUT YOUR REPORT... 3 MAKE A SKETCH OF YOUR REPORT... 3 DECIDE WHICH DATA TO PUT IN EACH REPORT SECTION...
Data Feedback Report Tutorial Script Data Collection Cycle
 Data Feedback Report Tutorial Script 2014-15 Data Collection Cycle The IPEDS Data Center includes a wide-range of functional options, including access to current and previous versions of your institution's
Academic Advising Basics
 Arizona Board of Regents, 2011 updated 07.11.2010 v.3.0 For information and permission to use our PDF manuals, please contact uitsworkshopteam@listserv.com PDFs available at www.uits.arizona.edu/workshops
Marquette University Time and Attendance
 2016 Marquette University Time and Attendance TM01 Student Employee Time and Attendance This guide helps you learn the most commonly used student employee functions in EmpCenter Time and Attendance. The
IRA Basic Running Financial Reports
 IRA Basic Running Financial Reports Updated 6-7-2013 1 Training Index Part I Introduction to the IRA Reporting Tool IRA Resources (3) Logging onto the system (4) Navigating the Dashboard (5-9) Running
MICROSOFT PROJECT Level 2
 MICROSOFT PROJECT 2010 Level 2 Contents LESSON 1 - ORGANISING PROJECT DATA... 3 FILTERING DATA... 4 USING THE AUTOFILTER FEATURE... 4 SORTING A VIEW... 6 CREATING A CUSTOM SORT... 6 GROUPING DATA... 7
EXCEL Using Excel for Data Query & Management. Information Technology. MS Office Excel 2007 Users Guide. IT Training & Development
 Information Technology MS Office Excel 2007 Users Guide EXCEL 2007 Using Excel for Data Query & Management IT Training & Development (818) 677-1700 Training@csun.edu TABLE OF CONTENTS Introduction... 1
Alfresco Content Services 5.2. Getting Started Guide
 Alfresco Content Services 5.2 Getting Started Guide Contents Contents Getting started with Alfresco Share... 3 Signing in...3 Personalizing Alfresco Share... 4 Setting up your dashboard... 4 Updating your
OBIEE. Oracle Business Intelligence Enterprise Edition. Rensselaer Business Intelligence Admissions, Undergraduate
 OBIEE Oracle Business Intelligence Enterprise Edition Rensselaer Business Intelligence Admissions, Undergraduate TABLE OF CONTENTS INTRODUCTION... 1 USER INTERFACE... 1 HOW TO LAUNCH OBIEE... 1 HOW TO
Introduction to Excel 2007
 Introduction to Excel 2007 These documents are based on and developed from information published in the LTS Online Help Collection (www.uwec.edu/help) developed by the University of Wisconsin Eau Claire
1. Managing Information in Table
 1. Managing Information in Table Spreadsheets are great for making lists (such as phone lists, client lists). The researchers discovered that not only was list management the number one spreadsheet activity,
2015 Arkansas Department of Education Data & Reporting Conference. Cognos Query Studio
 2015 Arkansas Department of Education Data & Reporting Conference Cognos Query Studio SMS Workshop August 7, 2015 Arkansas Public School Computer Network CREATING REPORTS USED TO GENERATE DATA FILES 1.
IHS Enerdeq Desktop International Training Guide
 IHS > Decision Support Tool IHS Enerdeq Desktop International Training Guide May 2009 Version 1.5.2 2009 IHS, All Rights Reserved. All trademarks belong to IHS or its affiliated and subsidiary companies,
Monash University Policy Management. User Guide
 Monash University Policy Management User Guide 1 Table of Contents 1. GENERAL NAVIGATION... 4 1.1. Logging In to Compliance 360 - Single Sign On... 4 1.2. Help... 4 1.2.1. The University Policy Bank...
BusinessObjects Frequently Asked Questions
 BusinessObjects Frequently Asked Questions Contents Is there a quick way of printing together several reports from the same document?... 2 Is there a way of controlling the text wrap of a cell?... 2 How
User Guide. Avery Dennison Web Ordering Solution for Steinmart
 User Guide Avery Dennison Web Ordering Solution for Steinmart March 2012 Copyright 2012 A very Dennison The information in this document is subject to change without notice and should not be construed
Table of Contents. Revu ipad. v3.6. Navigation. Document Manager. File Access. Markups. Signature Tool. Field Verification Measurements
 Table of Contents Navigation Document Manager File Access Markups Signature Tool Field Verification Measurements Editing Properties Tool Sets & the Tool Chest Markups List Forms Studio Sessions Studio
Microsoft How to Series
 Microsoft How to Series Getting Started with EXCEL 2007 A B C D E F Tabs Introduction to the Excel 2007 Interface The Excel 2007 Interface is comprised of several elements, with four main parts: Office
Pivots and Queries Intro
 Workshop: Pivots and Queries Intro An overview of the Pivot, Query and Alert functions in Multiview as a refresher for the experienced or new user, we will go over how to format an inquiry screen, create
MS Excel Advanced Level
 MS Excel Advanced Level Trainer : Etech Global Solution Contents Conditional Formatting... 1 Remove Duplicates... 4 Sorting... 5 Filtering... 6 Charts Column... 7 Charts Line... 10 Charts Bar... 10 Charts
New Finance Officer & Staff Training
 New Finance Officer & Staff Training Overview MUNIS includes many programs and tools to allow for the management of the District financials. As newer finance officers and staff, you are charged with understanding,
Kona ALL ABOUT FILES
 Kona ALL ABOUT FILES February 20, 2014 Contents Overview... 4 Add a File/Link... 5 Add a file via the Files tab... 5 Add a file via a conversation, task, or event... 6 Add a file via a comment... 7 Add
Data Warehouse Training Project. Training Handbook. June 22, Office of Institutional Analysis, Assessment, and Reporting
 Data Warehouse Training Project Training Handbook June 22, 2010 Office of Institutional Analysis, Assessment, and Reporting Trainer: Marcia Belcheir, Ph.D. Data Warehouse Administrator: Steve Grantham,
Layout and display. STILOG IST, all rights reserved
 2 Table of Contents I. Main Window... 1 1. DEFINITION... 1 2. LIST OF WINDOW ELEMENTS... 1 Quick Access Bar... 1 Menu Bar... 1 Windows... 2 Status bar... 2 Pop-up menu... 4 II. Menu Bar... 5 1. DEFINITION...
User Manual for Student. Moodle Administrator
 User Manual for Student Moodle Administrator 1.Introduction About this document This document is part of a Moodle Learning Management System(LMS) documentation Start Guides for Students. What is Moodle?
BrioQuery 6. Training Guide
 BrioQuery 6 Training Guide Purdue University IT Computing Services Staff Computer Training www.purdue.edu/itap/itcs/sct Revised: June 7, 2001 Copyright 2001 by Purdue University. All rights reserved. No
1. Managing Information in Table
 1. Managing Information in Table Spreadsheets are great for making lists (such as phone lists, client lists). The researchers discovered that not only was list management the number one spreadsheet activity,
their in the new a program such as Excel or Links aren't just document.
 Navigating with Hyperlinks Hyperlinks are those bits of underlinedd text or pictures that, when you click them, take you to a new place, like another Web page. Most people never think of adding links to
Visual Analytics User s Guide
 Visual Analytics User s Guide Question Page How do I log on to the system? 2 How do I navigate the reports? 3 How do I view an object that does not fit on the screen? 3 How do I change the column width
course notes quick reference guide
 course notes quick reference guide Microsoft Excel 2010 Welcome to Excel 2010 Excel 2010 is the premier spreadsheet application from Microsoft. Excel 2010 makes it easier to analyze data quickly with new
Formulas, LookUp Tables and PivotTables Prepared for Aero Controlex
 Basic Topics: Formulas, LookUp Tables and PivotTables Prepared for Aero Controlex Review ribbon terminology such as tabs, groups and commands Navigate a worksheet, workbook, and multiple workbooks Prepare
Remodeling Your Office A New Look for the SAS Add-In for Microsoft Office
 Paper SAS1864-2018 Remodeling Your Office A New Look for the SAS Add-In for Microsoft Office ABSTRACT Tim Beese, SAS Institute Inc., Cary, NC Millions of people spend their weekdays in an office. Occasionally
Excel 2007 New Features Table of Contents
 Table of Contents Excel 2007 New Interface... 1 Quick Access Toolbar... 1 Minimizing the Ribbon... 1 The Office Button... 2 Format as Table Filters and Sorting... 2 Table Tools... 4 Filtering Data... 4
Introduction to Cognos Participants Guide. Table of Contents: Guided Instruction Overview of Welcome Screen 2
 IBM Cognos Analytics Welcome to Introduction to Cognos! Today s objectives include: Gain a Basic Understanding of Cognos View a Report Modify a Report View a Dashboard Request Access to Cognos Table of
Day 1 Agenda. Brio 101 Training. Course Presentation and Reference Material
 Data Warehouse www.rpi.edu/datawarehouse Brio 101 Training Course Presentation and Reference Material Day 1 Agenda Training Overview Data Warehouse and Business Intelligence Basics The Brio Environment
CHAPTER 4: MICROSOFT OFFICE: EXCEL 2010
 CHAPTER 4: MICROSOFT OFFICE: EXCEL 2010 Quick Summary A workbook an Excel document that stores data contains one or more pages called a worksheet. A worksheet or spreadsheet is stored in a workbook, and
Quick Guide FAST HR. For more resources, including a guide on FAST HR codes, visit # Instructions Screenshot
 Tips & tricks This quick guide describes basic navigation within the FAST HR reporting tool, including how to use filter options, format columns and export reports. For more resources, including a guide
Topaz Workbench Data Visualizer User Guide
 Topaz Workbench Data Visualizer User Guide Table of Contents Displaying Properties... 1 Entering Java Regular Expressions in Filter Fields... 3 Related Topics... 3 Exporting the Extract Trace Events View...
INTRODUCTION... 1 UNDERSTANDING CELLS... 2 CELL CONTENT... 4
 Introduction to Microsoft Excel 2016 INTRODUCTION... 1 The Excel 2016 Environment... 1 Worksheet Views... 2 UNDERSTANDING CELLS... 2 Select a Cell Range... 3 CELL CONTENT... 4 Enter and Edit Data... 4
PM4 + Partners Knowledge Articles
 PM4 + Partners Knowledge Articles Customizing your PM4+ user experience r 1 November 30, 2108 PM4+ Partners Workspace - customize your experience Page 2 Contents Customizing Your Workspace... 1 Customizing
Data. Selecting Data. Sorting Data
 1 of 1 Data Selecting Data To select a large range of cells: Click on the first cell in the area you want to select Scroll down to the last cell and hold down the Shift key while you click on it. This
Handout created by Cheryl Tice, Instructional Support for Technology, GST BOCES
 Handout created by Cheryl Tice, Instructional Support for Technology, GST BOCES Intro to FrontPage OVERVIEW: This handout provides a general overview of Microsoft FrontPage. AUDIENCE: All Instructional
Using Tables, Sparklines and Conditional Formatting. Module 5. Adobe Captivate Wednesday, May 11, 2016
 Slide 1 - Using Tables, Sparklines and Conditional Formatting Using Tables, Sparklines and Conditional Formatting Module 5 Page 1 of 27 Slide 2 - Lesson Objectives Lesson Objectives Explore the find and
These materials may not be reproduced in whole or in part without the express written permission of The University of Akron.
 Table of Contents Chapter 1 : Overview...1-1 Chapter 2 : Definitions...2-1 ChartFields...2-1 Accounting and Budget Periods...2-3 Budgetary Control...2-3 Chapter 3 : Sign In and Sign Out...3-1 Sign In to
Microsoft Excel 2010 Basic
 Microsoft Excel 2010 Basic Introduction to MS Excel 2010 Microsoft Excel 2010 is a spreadsheet software in the new Microsoft 2010 Office Suite. Excel allows you to store, manipulate and analyze data in
Guide to User Interface 4.3
 Datatel Colleague Guide to User Interface 4.3 Release 18 June 24, 2011 For corrections and clarifications to this manual, see AnswerNet page 1926.37. Guide to User Interface 4.3 All Rights Reserved The
Using Windows 7 Explorer By Len Nasman, Bristol Village Computer Club
 By Len Nasman, Bristol Village Computer Club Understanding Windows 7 Explorer is key to taking control of your computer. If you have ever created a file and later had a hard time finding it, or if you
sforce Web Services Enterprise API sforce Object Query Language sforce Custom Objects... 40
 Release Notes Winter 04 Major Announcements Dashboards... 2 Workflow Automation... 8 Advanced Page Layout Wizard... 12 Dynamic Page Layouts and Field-Level Security... 14 Team-Based Account Management...
Wimba Pronto. Version 2.0. User Guide
 Wimba Pronto Version 2.0 User Guide Wimba Pronto 2.0 User Guide Welcome to Wimba Pronto 1 What's New in Wimba Pronto 2.0 2 Getting Started 3 Wimba Pronto System Requirements 3 Creating a New Wimba Pronto
Monitoring and Evaluation Tool
 Monitoring and Evaluation Tool USER MANUAL March, 2014 www.menarid.icarda.org THIS PAGE LEFT EMPTY INTENTIONALLY USER MANUAL Definitions and abbreviations Chart... Graphical representation of M&E project
SAS Web Report Studio 3.1
 SAS Web Report Studio 3.1 User s Guide SAS Documentation The correct bibliographic citation for this manual is as follows: SAS Institute Inc. 2006. SAS Web Report Studio 3.1: User s Guide. Cary, NC: SAS