BlomURBEX. AutoCAD 2010/2011/2012 Plug-in v3.0.0 User manual. : User manual for BlomURBEX AutoCAD 2010/2011/2012 Plug-in
|
|
|
- Jerome Gaines
- 6 years ago
- Views:
Transcription
1 BlomURBEX AutoCAD 2010/2011/2012 Plug-in v3.0.0 User manual Audience Abstract : BLOM ASA partners and developers : User manual for BlomURBEX AutoCAD 2010/2011/2012 Plug-in Date Blom Document 16 December 2010 BlomURBEX AutoCAD 2010 plug-in User manual.docx i
2 Revision History Document Number Issue Date Reason for Change BUC10P 1 December 2010 Document for release ii
3 Table of Contents BlomURBEX... i 1 Introduction Version changes System requirements Installing BlomURBEX plug-in for AutoCAD 2010/2011/ Starting with BlomURBEX plug-in for AutoCAD 2010/2011/ Setup the BlomURBEX Viewer plug-in in AutoCAD 2010/2011/ Adding Data Sources Adding BlomURBEX TM as a Data Source Adding Blom Library as a Data Source Setup the BlomURBEX Viewer basic options Changing language interface Changing layout Viewing BlomURBEX images Selecting location in AutoCAD 2010/2011/ Introducing known coordinates in BlomURBEX Viewer Panning images Magnifying images Changing views The intelligent behavior Changing basemap ortho image Showing the visible and total extension in AutoCAD 2010/2011/ Synchronizing views Seeing historical images from different years Obtaining image information Using the measurement tools Changing units of measure Viewing the coordinates of a location Measuring squared perimeter or distance iii
4 8.4 Measuring bearing Measuring area Measuring height Measuring elevation Clearing measurements Printing images Printing images Changing print settings Page setup Print preview Exporting images Exporting all visible views Projection of the extracted ortho images Saving measurements Setting measurement savings Starting and stopping save sessions Procedure for saving measurements Example: how to extrude features to 3D Overlaying tile raster data Activating and deactivating raster overlays Overlaying vector data Activating and deactivating vector overlays Refreshing vector overlays Overlay and performance considerations Symbology limitations Uninstalling BlomURBEX plug-in for AutoCAD 2010/2011/ Troubleshooting Log files Cache directory Frequently Asked Questions iv
5 17 Appendix A: how to add new projections Appendix B: how to improve interface translation v
6 1 Introduction BlomURBEX is a collection of Web Services provided by Blom that allow to navigate through high-detailed maps with ortho and oblique imagery, and to fly through 3D immersive cities. In addition, the Web Services can be invoked to obtain measurement information about buildings and other map elements. Blom leverages in Europe and around the world the production of a huge image and 3D model database of more than 900 cities, and the database increases each month as new countries are included in it. BlomURBEX offers the most detailed and comprehensive imagery database and 3D models of urban places in the market. Based on the same interface, Blom is developing a full range of plug-ins that integrates BlomURBEX services in common GIS and CAD applications. Blom development roadmap with BlomURBEX includes the following targets: BlomURBEX plug-in for ESRI ArcMap (ArcView, ArcEditor and ArcInfo) BlomURBEX plug-in for ESRI ArcIMS BlomURBEX plug-in for ESRI ArcGIS Server BlomURBEX plug-in for Intergraph GeoMedia Professional BlomURBEX plug-in for Integraph GeoMedia WebMap BlomURBEX plug-in for Autodesk Map and AutoCAD BlomURBEX plug-in for Autodesk MapGuide BlomURBEX plug-in for Bentley MicroStation BlomURBEX plug-in for MapInfo Professional BlomURBEX plug-in for MapInfo MapXtreme Contact Blom at for new releases and updates. 1
7 2 Version changes Version of BlomURBEX Plug-in for AutoCAD 2010/2011/2012 includes these improvements: Added support for adding Blom Library as a data source. Display measurement tool results option has been removed from Printing options in Settings. Better navigational controls for map. Proxy settings will now get detected automatically. Version of BlomURBEX plug-in for AutoCAD 2010/2011 includes these improvements: Fixed an error that causes a crash in AutoCAD when viewing obliques. OSGB36 projection supported. Fixed a problem for viewing overlays in one view of multi-view layouts. Fixed a problem refreshing overlays in obliques. NTLM and Kerberos proxy authentication support Version of BlomURBEX plug-in for AutoCAD 2010/2011 includes these improvements: Better support for big geometries in overlays Version 2.5 of BlomURBEX plug-in for AutoCAD 2010/2011 includes these improvements: All the rendering is done asynchronously. Height measurement now uses a BlomURBEX service to obtain the best angle in the oblique image to force the measurement in a vertical direction. Better resize to avoid flickering. Vector overlay on top of oblique imagery is done faster. A new option in settings can change the priority order for the basemap. Now it is possible to priorize between the different ortho images ( pictometry, Countryortho or satellite ) present sometimes at the same zoom level in the server. Other tile layers in BlomURBEX server can be overlapped selecting them in the options dialog. Product and version number appears in About dialog. Print error that occurred after printing is fixed. Tooltips close when the map looses focus. Default zoom and orientation has been fixed. Views are now correct when changing between different layouts. Bug fixed with double sync between map and BlomURBEX viewer. Bug fixed with Extract image tool. Proj4 DLL is no more used, but DotSpatial is used instead. Installer uses bootstrap to download from web required prerequisites. More accurate measurements in distance and area. 2
8 Version 2.0 of BlomURBEX plug-in for AutoCAD 2010/2011 includes these improvements: Internet Explorer 7 not needed. New BlomURBEX viewer do not requires Internet Explorer 7 to be installed or any other web browser. The plug-in manage requests on its own. A new image cache owned by all the plug-ins speeds bitmap recovery and makes it easy to manage the plug-ins cache. No more the browser cache is used. Easier installation. BlomURBEX viewer component is not a previous install requirement. Plug-in installer checks if viewer is installed, and if not, then installs it. The viewer is never uninstalled to avoid other plug-ins to stop working. Better performance. New BlomURBEX viewer is not JavaScript based but.net based, and executes code faster. New option to choose the date of the imagery, allowing to see history changes in images, and seeing different years in a side-by-side mode. Year of the current visible image in a label at the bottom of each view. Intelligent behaviour when zooming. If a better view mode or orientation exists for current zoom then it is loaded automatically. Faster vector overlay on obliques. The new BlomURBEX viewer sends fewer requests to transform vector data between ortho and oblique, and draws vector data faster. A new button in toolbar to enable/disable vector overlay faster than changing settings. Print improvement. Print and export now support vector overlay. Log levels to better grained logging and a default folder for storing logs in just one file. A new tool for extracting images has been added. If image exported is ortho view, then the world file is saved for easy use in GIS packages. Proxy settings support Full support of Windows versions from XP to 7, including 32 and 64 bits versions. 3
9 3 System requirements Microsoft.NET Framework 2.0 and 3.5 (installed by setup if not present) BlomURBEX plug-in for AutoCAD 2010/2011/2012 is developed with Microsoft.NET Framework 2.0 and 3.5. During installation, if these Frameworks are not present, they are downloaded and installed. AutoCAD version 2010/2011/2012 This BlomURBEX plug-in for AutoCAD 2010/2011/2012 requires any of these products from Autodesk installed in order to execute BlomURBEX plug-in. Windows versions BlomURBEX plug-in for AutoCAD 2010/2011/2012 supports Windows versions supported by the Autodesk product. Read AutoCAD 2010/2011/2012 install guide for more info. User Token To access BlomURBEX Web Services a UserToken is needed. This UserToken is an encrypted string that authenticates each user request. Contact with Blom Marketing Department to obtain the required UserToken in: 4

10 4 Installing BlomURBEX plug-in for AutoCAD 2010/2011/ Ensure you are logged onto your computer with Administrator privileges. 2. Close all programs. 3. Uninstall previous BlomURBEX plug-in versions for any GIS or CAD package that could be installed. Older BlomURBEX plug-ins cannot coexist with current version. If any other plug-in is installed for other GIS or CAD package, upgrade the plug-in also to last version. 4. Run setup.exe installer. Be careful to not run Urbex30AutoCAD2010.msi installer because this installer does not check if dependencies are already installed. 5. If.NET Framework 2.0 or.net Framework 3.5 are not installed a message is shown. Accept in the message. The Frameworks will be downloaded from the Microsoft webpage and installed. 6. If Microsoft Interop Forms is not installed a dialog will appear to perform its installation. Click in Accept to accept the license agreement and continue. This software from Microsoft is an add-in to the.net Framework that improves ActiveX /.NET interoperability. 7. Wait until Microsoft Interop Forms install completes. 5

11 8. The BlomURBEX plug-in for AutoCAD 2010/2011/2012 Setup Wizard will lead you through all stages of the setup process. 9. Click Next > to begin installation. 6

12 10. The next screen displays the license agreement. Please read this and if you accept the terms select the I Agree radio button. Click Next > to continue. 11. Click Browse to change the destination folder. Click Disc cost to confirm that there is enough space to install. Select in the radio buttons if BlomURBEX plug-in for AutoCAD 2010/2011/2012 will be available to all users or just you in your computer. Click Next > to continue. 7
13 12. Click Next > to start installation. 13. Finally click Finish to close installation wizard. 8

14 5 Starting with BlomURBEX plug-in for AutoCAD 2010/2011/ Setup the BlomURBEX Viewer plug-in in AutoCAD 2010/2011/2012 To execute the plug-in, follow these steps: 1. Open AutoCAD 2010/2011/ In AutoCAD 2010 select the Tools > Load application menu. The Load / Unload applications dialog box will open. In AutoCAD 2011 select the Manage tab of the Ribbon toolbar and click in Load application. 3. Browse for the accont2010.arx file contained in the plug-in install folder, select it, and then click the Load button. This ARX application is a utility that allows dockable windows inside AutoCAD 2010/2011/2012. It should appear in the bottom list of loaded applications, as shown in the screenshot. 4. To avoid this setup every time AutoCAD is started, click in the Contents button. The Load on startup dialog box will appear. 9

15 5. Click the Add button. A new dialog will open. Browse to the accont2010.arx file in the plug-in install folder, select it, and click Add. Then Close the Load on startup dialog and the Load / Unload applications dialog. 6. To load the Blom Dockable Window that contains the BlomURBEX Viewer, type with the mouse cursor inside AutoCAD or type in the command bar if visible the following command: dockable_container and press Enter. 7. The command executes and asks for a ProgID (the identifier of the dockable control that shows BlomURBEX Viewer). Type the following identifier: BlomUrbexDock2010.DockControl, and press Enter. After some seconds, the BlomURBEX Viewer will be opened in a dockable window inside AutoCAD 2010/2011/ It is possible to dock or undock the window as with any AutoCAD dockable window. Also it is possible to reduce the window to a sidebar clicking in the buttons that appear on top and title bar of the window. Also the window can be closed. To open it again repeat steps 6 and 7. The window saves its state when AutoCAD is closed so next time it will be seen the same as previously. 10


16 5.2 Adding Data Sources A Data Source is a repository of complex cartographic data. In order to work with a Data Source it must be assigned to Plug-in. Current version of Plug-in supports two different Data Sources: 1. BlomURBEX TM online services 2. Blom Libraries Adding BlomURBEX TM as a Data Source 1. In the BlomURBEX Viewer toolbar, select the menu Settings > Open settings dialog, to open the Settings dialog. 2. In the dialog select General tab. 3. In the Data Source drop down select BlomUrbex. 11
17 4. In the User token textbox type the UserToken provided by Blom. This UserToken is an encrypted string that authenticates each user request. Contact with Blom Marketing Department to obtain the required UserToken. The UserToken is needed to connect to the BlomURBEX Web Services and allow the access to the imagery. 5. Click OK button to finish configuration Adding Blom Library as a Data Source 1. In the BlomURBEX Viewer toolbar, select the menu Settings > Open settings dialog, to open the Settings dialog. 2. In the dialog select General tab. 3. In the Data Source drop down select Blom Library. 4. Selecting Blom Libraries Browse and select a Blom Library. Click add new button in order to add multiple libraries. 5. Selecting Library Licenses Browse and select a valid License. Click Add New button in order to add multiple licenses in case there are more than one library. 12

18 6. In order to remove a Library or a License, click delete button next to it. 7. Click OK button to finish configuration. 5.3 Setup the BlomURBEX Viewer basic options The first thing to do in an application that uses BlomURBEX Viewer is to specify some minimum options in order that the viewer can correctly search for images. For this follow the next steps. 1. Open BlomURBEX Viewer window using the dockable_container command as explained above. 2. In the BlomURBEX Viewer toolbar select the menu Settings > Open settings dialog to open the Settings dialog. 3. In the dialog select the General tab. Select the desired Data Source (See section 5.2 for details on adding a Data Source). 4. Select the Linking tab. Depending on the projection of the basemap (the map of AutoCAD 2010/2011/2012) it is needed to indicate BlomURBEX Viewer which projection is this. Follow next steps. 13


19 5. Click in the Select button to open the Select projection dialog. In the dialog select in the available projection list the one that the basemap has. There are different options to select the desired projection: 6. To select a projection from the full list of supported projections, choose Show all projections in the upper dropdown box. To select click in the list and then click in OK, or double click an item in the list. Any item chosen will be reminded later in a list with the most used projections, so it is not needed to find it again in the long list. Also, it is possible to add any item to this most used list without leaving the dialog clicking with right mouse button and selecting Add to most used from the context menu. 14

20 7. To select a projection from the reduced list of the most used projections, choose Show most used projections from the upper dropdown box. The list will show only those projections selected at least once or any other marked explicitly as most used. To select click in the list and then click in OK, or double click an item in the list. Alternatively, it is possible to remove items from this most used list clicking with the right mouse button and selecting Remove from most used. The current selected projection cannot be removed from this list. 15


21 8. To select a projection from a reduced list using a filter, choose Use a filter in the upper dropdown box. The filter textbox and Filter button will activate. Type a search word or words in the filter textbox and press Filter. Only the projections containing the full search text will be shown. The search is possible by EPSG code and also by the projection name, and is case insensitive. To select click in the list and then click in OK, or double click an item in the list. The selected projection will be recorded in the most used list as usual. 16

22 9. Save the settings clicking in OK. Settings are saved in registry for each user so it is not needed to set them again later as each user has their own settings. The latest settings are used by default. To configure different settings use the Save button to save a file with the settings that can be later opened with the Open button. 10. This finish the configuration. Settings do not persist, if the Plug-in is reinstalled. We need to set the settings again in case of re-installation. 5.4 Changing language interface Language interface can be changed through the direct menu: Settings > Language, or through the Settings dialog, by Settings > Open Settings dialog. The first is a more direct way to change the language, but the results are the same. To change the language through the direct menu: 1. Click in menu Settings > Language > <The desired language>. The interface language of the application is changed at once. The selection is saved in the user registry so next time BlomURBEX Viewer is opened the preferred language will remain in the interface. To change the language through the settings dialog: 1. Click in menu Settings > Open settings dialog. 2. Select the General tab. In the Language selector, choose the preferred one. The interface language of the application is changed at once. 3. If needed, click Save to save the settings in a file for future use. 4. Click OK to save the settings in user registry. Next time BlomURBEX Viewer is opened the preferred language will remain in the interface. 17
23 Improving translations of the interface is very easy. Check the Appendixes. 5.5 Changing layout BlomURBEX Viewer can show one or several orientations at the time using different layouts, and view images of different dates. It is possible to change from one layout to other either from Settings > Layout direct menu, or using the Settings dialog by Settings > Open settings dialog menu. The first is a more direct way to change the layout, but the results are the same. To change the layout using a direct menu: 1. Click in Settings > Layout > <the desired layout>. The choice is saved in the user registry so this layout will remain in future sessions until changed again. 18


24 To change the layout and image dates using the settings dialog: 1. Click in Settings > Open settings dialog menu to open settings dialog. 2. In the dialog select the Layout tab and select the preferred layout in the upper dropdown box. For each view in the layout, it is possible to select the preferred year of the BlomURBEX imagery to be shown as explained later. 3. If needed, click Save to save the settings to disk for future use. 4. Click OK to save the settings in user registry. Next time BlomURBEX Viewer opens the preferred layout will remain in the interface. 19
25 20

26 6 Viewing BlomURBEX images The BlomURBEX Viewer is the window that shows BlomURBEX images. To open an image is needed to select a location, either clicking in the basemap in AutoCAD 2010/2011/2012 or introducing a known coordinates. 6.1 Selecting location in AutoCAD 2010/2011/ Open AutoCAD 2010/2011/2012 with a basemap. 2. Open BlomURBEX Viewer if it is not, as explained previously. 3. Ensure that settings are correct, as previously indicated. 4. Resize and move application windows so they can be seen comfortably. 5. Open any map data in AutoCAD 2010/2011/2012. The data can use any projection if it is in the EPSG list in the BlomURBEX Viewer options. It is only needed to know the projection and to indicate this projection in the BlomURBEX Viewer settings dialog. Remember when using different drawing files in AutoCAD with different projections to modify the options in BlomURBEX Viewer matching the active one. 1. Once everything is right set, and with a map drawing opened, click in the Center in new map point button at the bottom of the BlomURBEX Viewer. Click OK in the message that appears and then move mouse cursor over the map display and click inside it. A message requesting a point will appear. Type the exact coordinates and press Enter or select a point clicking in the map. 2. After some seconds BlomURBEX Viewer will open the best Blom images for that location, in all the orientations selected in the BlomURBEX Viewer layout. The images are centered in the selected point and show a crosshair. If no image appears consider if your user permissions do not allow seeing images for that location. 21

27 6.2 Introducing known coordinates in BlomURBEX Viewer 1. In BlomURBEX Viewer toolbar click in the tool Go to coordinates The Go to coordinate dialog is opened. 2. Introduce a correct longitude or X and latitude or Y coordinates. Indicate the projection for this coordinates clicking in Select. This opens the same Select projection dialog that we see when selecting the basic options. By default, the last projection selected in the Settings dialog is offered here, but it can be changed, so we can ask for coordinates in any of the supported projections. 3. Click OK. 4. After some seconds BlomURBEX Viewer will open the best BlomURBEX images for that location, in all the orientations selected in the BlomURBEX Viewer layout. The images are centered in the selected point and show a crosshair. If no image appears consider if your user permissions do not allow seeing images for that location. 6.3 Panning images Panning is the default behaviour of the display when no tool is selected. 1. In BlomURBEX Viewer unselect any tool in the toolbar. 2. Click and hold the left mouse button in the view to pan. 3. Drag the image up, down, left, or right within the view, and finally release mouse. 6.4 Magnifying images It is possible to zoom in for more detail or zoom out for more context information. Simply change the image s magnification by using the zoom buttons on the toolbar. Zooming in all views Use the Zoom In button to increase the magnification of an image. To zoom in: 1. Click the Zoom In button on the toolbar. 2. The magnification percentage is doubled. (The part of the image that was centered in the display remains in the center.). The Zoom In button affects all the images opened in the layout. 3. Continue clicking the button until reached the desired amount of magnification. 22


28 Zooming out all views 1. Click the Zoom Out button on the toolbar. The Zoom Out button affects all the images. 2. The magnification is reduced by half. 3. Repeat Step 1 until zoomed out the desired amount. Zooming in or out with the mouse wheel in one view 1. Move the mouse wheel frontwards or backwards to zoom in or out in just one view. Zooming to a extent in one view 1. Unselect any tool selected in the toolbar so the Pan default tool activates. 2. Press SHIFT key in keyboard. 3. Click with left mouse button in any view and hold pressed. Drag to draw a rectangle. A rectangle appears showing the extent selected. Release button at the ending corner. 4. Map centers and zoom to the best level zoom that contains the selected extent. This action only affects the view used. Zooming with the zoom bar in one view 1. Each view has a zoom bar with a + button on top and a - button on bottom. Click + button to increase the zoom level, or - to decrease the zoom level. There are 20 zoom levels available for the continuous or Ortho view mode (see below about view modes). There are 6 zoom levels available for the photo by photo or Oblique mode. The last two levels in Oblique mode are a resample of level Alternatively drag the level indicator up or down to increase or decrease any number of zoom levels. Every view in the layout has its own level indicator, so changes in this only affect the view that contains that level indicator. 23
29 6.5 Changing views Initially each view in the layout has set an orientation, but it is possible to modify this selecting orientations orientation selector. In fact, it is possible to have the same image several times. For example, it is possible to use the dual view to have two times the same ortho image opened. It can be useful to have a master detail view to study two distant buildings at the same time that are in the same photo. Each time an orientation is changed in a view; this setting is saved in user registry so it will be used until changed again. There are two types of view modes: Ortho, that shows the images in a continuous mode, and Oblique, that shows images one by one. In both modes it is possible to do Pan in the map endlessly. In the Oblique mode a new image is loaded in a seamless way when panning reaches the border of the current loaded image. Oblique imagery shown in a continuous or Ortho mode may suffer some distortion due to the irregularities of the terrain model that affects the ortho-rectification process. In flatter terrains the distortion is less. Tools are unselected when the view mode changes. Remember to select again the tool if using one when the mode is changed. There are five types of orientations: Ortho orientation, that shows the image as an ortho-photo; North, that shows the image looking from south to north; South, from north to south; East, from west to east; and West, from east to west. To change the orientation click in the O, N, S, E or W buttons in the upper left control to activate the Ortho, North, South, East and West orientations, respectively. The size of each view in the layout can be changed through the use of splitter bars between the views. Just move the mouse in the boundary of two views, and 24
30 when the cursor changes, drag and drop the splitter to change the size of the views. Each time the size is changed this setting is saved in the user registry. 6.6 The intelligent behavior At closer zoom levels, oblique rectified images show big distortion on the buildings, while at furthest zoom levels they do not offer better information than the ortho images. Each view in the BlomURBEX Viewer is configured in an intelligent way so that any request that attempts to change the zoom level of the view will check if the view is displaying any orientation other than Ortho, and in this case decide what set of images should be displayed: ortho, oblique rectified or natural obliques. 6.7 Changing basemap ortho image By default the ortho image shown as basemap is one from several images available in BlomURBEX server. These images are visible are certain resolutions: Satellite images, with low resolution of the data. This source data is available in the furthest zoom levels (1 to 13), and contains Blue Marble and Landsat 7 imagery. Countryortho is imagery covering a whole country (or a region). This source data is available in the medium zoom levels (13 to 19), and contains imagery from several providers and from Blom. Blom imagery captured with Pictometry cameras, also called pictometry images in the BlomURBEX server. This source data is available in the zoom levels with the maximum resolution (14 to 20). As can be seen at certain zoom levels these three sources coexist. For that zoom levels with more than one image available, the BlomURBEX server priorizes first the pictometry image, then the Countryortho, and finally, the satellite. It is possible to change this priority in the options. 25

31 In the textbox Baselayer priority of the General tab of the Settings dialog, change the text to consider other priorities in the images for the basemap. For example, in the next screen capture, the left shows the default priority with the pictometry imagery by Blom in the zoom level 18, and the right shows a different priority that renders the Countryortho imagery, that is also available for that zoom level. Be careful to type the correct names in the Baselayer priority textbox, or no image will be shown. Type the names separated by commas and without any blank spaces. 6.8 Showing the visible and total extension in AutoCAD 2010/2011/2012 It is possible to see the visible and total extent of the opened BlomURBEX images drawn in AutoCAD 2010/2011/2012. To do this follow this steps: 1. In BlomURBEX Viewer, select the menu Settings > Open Settings dialog. In the Settings dialog select the Linking tab. Ensure that checkbox Display image visible extent on linked mapping application is checked for viewing the visible extent, and that checkbox Display image total extent on linked mapping application is checked for viewing the total extent. Uncheck the checkboxes to 26

32 not update the extents in AutoCAD 2010/2011/2012. The total extent only has sense when the view mode is photo by photo also called Oblique mode. 2. Modify the visible extent of BlomURBEX Viewer by panning or zooming in the current image, or requesting other image. 3. After a moment the boundaries will be drawn in AutoCAD 2010/2011/2012. Boundaries are drawn using two layers in AutoCAD 2010/2011/2012. By default visible extents are drawn in the color with index 3 in the current color table and total extents in the color with index 1. Modify this color indexes to show the extents in better colors. Ensure that the current colors do not match the background color or extents will not be visible. Also ensure that this layers in AutoCAD 2010/2011/2012 are visible and are rendered using colors by layer. 4. Another way to avoid the refresh of the visible an total extent, and also to avoid the refresh of the red crosshair with the center, is to set the apropiate layer to not visible in the Layer Properties Manager once this layers are added to the AutoCAD drawing. 6.9 Synchronizing views It is possible to synchronize the several views in the BlomURBEX layout, and synchronize the main view in BlomURBEX with the linked map in AutoCAD 2010/2011/2012. To do this follow this steps: 1. Open the Settings dialog and select the Linking tab. To update AutoCAD 2010/2011/2012 map center when BlomURBEX main view changes: 2. The main view in BlomURBEX is one of the opened views. Depending on the layout the main view changes. The settings dialog marks which is the main view for each layout type. This view can be in sync with the linked map application. For it check the Center linked map at main view center. Now each time the location of the BlomURBEX main view changes, the map will be refreshed to show that location. 27

33 To update the main view in the BlomURBEX layout with AutoCAD 2010/2011/2012: 3. The main view in BlomURBEX is one of the opened views. Depending on the layout the main view changes. The settings dialog marks which is the main view for each layout type. This view can be in sync with the AutoCAD map. For it check the Center main view at linked map center. Now each time the center of the AutoCAD map changes, BlomURBEX main view will be refreshed to show that location Seeing historical images from different years It is possible to show imagery for different years in each view, facilitating user to follow the changes occurred in a spot of the city. To do this, follow these steps: 1. Open the Settings dialog and select the Layout tab. 2. For the current layout, a set of textboxes for each view is shown in the dialog. Enter a year or a range of years, inside these textboxes to filter that view for a particular point in time. The date filter should follow one of these structures: YYYY-YYYY and YYYY, where YYYY is the year number with four digits. 3. For example: will return the most updated image available inside the range of years, including both bounding years. In this example, if an image of 2007 is available and no image in 2008 is available, then the image of 2007 is returned. But if no image is available between 2005 and 2008, and only an image of 2009 is available, then no image will be returned. 4. Another example: 2006 will return the most current images available, whose date is previous to the requested date. In this case if several images are available previous to the year 2006 or from that year, then the last one will be returned. 5. If the default value is empty, then the most updated image will be requested. 6. If a wrong value is sent, then no image will be returned. 7. The settings will affect also the Extract image or Export image tools when applied to the views with a date filter. 28

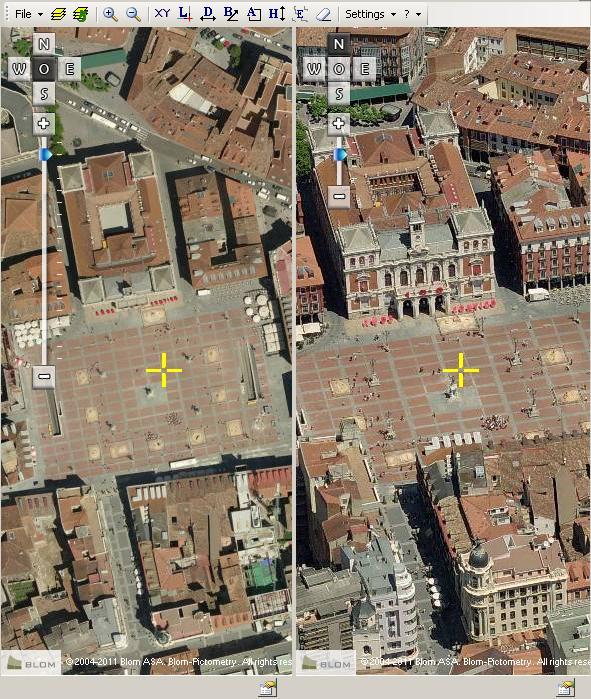
34 Above both views of Eiffel tower from 2008 and 2009 The option to change the date of the BlomURBEX images allows to see side by side the same part of a city in different years. Up to five different years could be shown at a time. Just select the same view mode and orientation, and explained below, for each view in a multi-view layout, but choose different years for each view. 29


35 7 Obtaining image information To obtain the information about the current opened image, click in the Image Properties button in any status bar of the views. A panel will open showing extent coordinates in WGS84 lon/lat for the full image (in obliques) and for the visible portion and other data if available. To hide the panel click again in the button. Info in ortho view Info in oblique view To copy the image data just select the text in the panel, click the right mouse button, select copy, and paste it anywhere. 30
36 8 Using the measurement tools BlomURBEX Viewer offers various tools for measuring features visible in images. For example, it is possible to measure the distance between two points, the elevation of the terrain, building heights, bearing, area, perimeter, and the coordinates of a point. Before using the measurement tools, be sure that the unit of measure is set as desired. 8.1 Changing units of measure To change units of measure: 1. In BlomURBEX Viewer click the menu Settings > Open Settings dialog. The Settings dialog box opens. 2. In the General tab click the desired units: Meters or Feet. 3. Click OK. The changes remain in effect until units are changed again. 8.2 Viewing the coordinates of a location Use the Location Tool to determine the location (the coordinates) of an object in an image both in ortho or oblique views. To determine the location of an object: 1. In BlomURBEX Viewer click the Location Tool. 2. Click the desired location on the image. 3. The point s coordinates appear drawn in the view. If the projection selected in the Settings dialog is not Spherical Mercator, the same coordinates will be seen in both systems, Spherical Mercator and the selected one, in the desired units, meters or feet. For Oblique images, remember to click near the base of buildings for more accurate coordinates. 31

37 8.3 Measuring squared perimeter or distance Use the Distance Tool to measure perimeter the distance around the outside edge of an object or distances both in ortho or oblique views. To measure perimeter by using a parallelogram or measure distances: 1. Click the Distance Tool. 2. Starting with one corner of the object, click with the left mouse button. 3. Click again for each new vertex. The outline of a polyline appears as new vertexes are added. In oblique mode take in mind that a workaround to the server must be done in each vertex and the measure takes longer. 4. When the polyline surrounds the shape being measured or distance being measured, double click with left mouse button. 5. The partial measurements and total length appears drawn in the view. 8.4 Measuring bearing Use the mouse to draw one line to measure bearing both in ortho or oblique views. Where start drawing the line is important, as shown in the following illustrations: 32

38 To measure bearing: 1. Click the Bearing Tool. 2. Click with the left mouse button on the starting point. 3. Click with the left mouse button on the ending point in the direction you want to measure the bearing of. The measurement appears drawn in view. 8.5 Measuring area The Area Tool lets to measure the area of any linear shape both in ortho or oblique views. After the perimeter of the area to be measured is outlined, the area measurement appears in view. To measure the area of any straight-sided shape: 33

39 1. Click the Area Tool. 2. Click in the display at the desired starting point. 3. Click again for every new vertex of the area. A polygon that returns to initial point is drawn automatically. 4. When outlined the entire perimeter, double click in the last vertex. 8.6 Measuring height Use the Height Tool to measure the height of an object in an Oblique image. (Because orthogonal images are captured straight down, the Height Tool doesn t apply to the continuous or Ortho view mode.) To measure height: 1. Click the Height Tool. 2. Click with the left mouse button on a point at the base (where it meets the ground) of the object we want to measure the height of. Important: Be sure to measure height by starting at ground level and moving upwards. If the ground level starting point is not seen, then estimate its location. 3. Move the mouse upwards and click a new vertex at the ending point. 34
 of a point in an image. To measure the elevation: 1. Click the Elevation Tool. 2.")
40 Finish measuring here. Start measuring here. 4. The measurement appears drawn in view. 8.7 Measuring elevation Use the Elevation Tool to measure the elevation (height above sea level) of a point in an image. To measure the elevation: 1. Click the Elevation Tool. 2. Click the point whose elevation to measure. 3. The measurement appears drawn in view. 8.8 Clearing measurements Use the Eraser Tool to clear measurements in the map display. To clear measurements: 1. Click the Eraser Tool. 2. The measurements are removed in all available views. 35

41 9 Printing images BlomURBEX Viewer let print all the views opened to the selected printer, setup the page options and preview the printing, along with the image properties if they were activated in the settings dialog. Before printing, scroll or pan the image so that the portion we wish to print is visible in the display. Also resize the views with the splitters and the size of the BlomURBEX Viewer window. The visible portion of each image, and with the exact pixel size, will be send to printer. 9.1 Printing images To send all the current views to the printer with the current settings: 1. Click the File > Print menu. 2. The views are printed. Each view in the layout is printed in different pages also with the image information activated in settings. If the image information is longer than the page space, it will be cropped. In this case, try reducing the size of the BlomURBEX Viewer views or window, or limit the amount of information to print in settings dialog, as explained below. 9.2 Changing print settings To change the printing settings: 1. Click the Settings > Open Settings dialog menu. 2. The settings dialog opens. Select the Printing tab. 3. Check or uncheck the options wanted. 4. Display image properties adds the corner coordinates of the image to the output (if the image is a oblique one) and other properties. 5. Display the visible extension of the image adds the corner coordinates of the visible portion of the image. 6. Display shot date adds to the output the shot date of the image. 7. Click OK in the Settings dialog to save changes. 36


42 9.3 Page setup To change page settings: 1. Click the File > Page setup menu. 2. The Page setup dialog opens. Modify the page margin, orientation, etc. as desired. Click OK to accept changes. 9.4 Print preview To preview the print: 1. Click the File >Print preview menu. 37

43 2. The Print preview dialog opens. Click in the options to see the print at different zooms o layouts. Also it is possible to print clicking in the Print button. The dialog can be resized to full screen. The image shows the preview of a dual view layout. Each view and its properties are print in different pages. 38

44 10 Exporting images 10.1 Exporting all visible views The BlomURBEX Viewer Export image menu lets exporting the visible extent of the active views to a set of JPG files. To export an image: 1. Pan in the views to display the extent desired. 2. Click the File > Export image menu. 3. In the Save as dialog that opens introduce the path and filename for the file. The extracted image or images are saved with the filename specified. If the BlomURBEX layout shows several views, then several files will be created and all the files will be suffixed with a view number and orientation. Also, if view is in ortho mode, a world file (JGW) is saved for easy integration of the image in other GIS packages Projection of the extracted ortho images The projection of the extracted ortho images are Spherical Mercator, the projection labelled by EPSG as 'Popular Visualisation CRS / Mercator' in March 2008 with code number Due to limited support to this projection in AutoCAD 2010/2011/2012 version, a transformation of the exported images using other software would be necessary to open them in AutoCAD 2010/2011/

45 11 Saving measurements BlomURBEX Viewer is able to notify when the user has made measurements in order to store this measures into any opened table in AutoCAD 2010/2011/ Setting measurement savings To activate the measurement storage, it is needed to complete two one-time setup tasks. It is needed to specify some options about the place where store the measurements, and some options about the units and the projection to use (in the case the measurements are locations). To specify the options regarding the place to store measurements: 1. Click in the Center in new map point button once. When this button is clicked, the Saving options are updated for the current drawing opened. 2. Click in the Settings > Open Settings dialog menu. 3. The Settings dialog opens. Select the Saving tab. 4. Select a mode for saving measurements from the Table dropdown list. The options for saving measurements are: <Save as text>, that inserts a text with the measure; <Save as dimension>, that creates a dimension (only has sense for linear or angular measurements); <Save as attribute>, that creates a block with the measurements as attributes; <Save as extrusion (only for Heights), that saves the measurements as Z values inside the geometry (only has sense for height measurements). 5. Each option of the Table dropdown list populates different sub-options in the Column dropdown lists: For Save as text mode, only a <Save as text> option is given. Select this sub-option for that type of measurements you want to save as texts, and leave as <None> for those measurements not to be saved. 40
46 For Save as dimension mode, two sub-options (Linear dimension and Angular dimension) are given. Select Linear dimension for distances and heights measurements, and select Angular dimension for bearing measurements, because for the other type of measurements this saving has no sense. For Save as attribute there are multiple sub-options, one per each type of measurement. In this last case the sub-options represent names for blocks and attributes that will be added to drawing for storing the measurements. For Save as extrusion (only for heights) mode, only a sub-option Save as extrusion (only for heights) is given. Select this sub-option for height measurements only. This option will extrude one or several region objects selected. 6. As seen in the screenshot, it is possible to select a sub-option from the dropdown lists for each type of measurement to save. It is possible to store seven different type of measurement. The table summarizes the relation between the BlomURBEX Viewer tools and the Column dropdown used to make the savings. In BlomURBEX Viewer the tool used is... In AutoCAD 2010/2011/2012 measurements are saved in the field selected in dropdown... Column for areas Column for distances Column for heights Column for elevations Column for X coords and Y coords Column for bearings 7. To store only some measurements, select <None> for those measurements in the dropdown lists. 8. Click in OK to save settings. To specify the options regarding the units and the projection to use in locations: 1. Click in the Settings > Open Settings dialog menu. 2. The Settings dialog opens. Select the Saving tab. 3. Select the desired units, meters or feet. The values will be stored in the units selected. 4. Select the Linking tab. 5. In the Save location measurements groupbox, choose in Spherical Mercator projection for storing location data in Spherical Mercator meters in AutoCAD 2010/2011/2012, or choose in selected map projection, more usual, for storing location data in the projection of the current map in AutoCAD 2010/2011/2012. This setting only affects the Location tool. 6. Click OK to save settings. 41
. To pause a session: 1.")


47 11.2 Starting and stopping save sessions In BlomURBEX Viewer it is possible to start, pause and continue the savings through an option. To start a save session: 1. Click in the File > Start saving measurements menu if it is unchecked. The menu will toggle to a checked state and measurements will be stored (if fields were correctly set). To pause a session: 1. Click in the File > Stop saving measurements menu if it is checked. The menu will toggle to an unchecked state and measurements will be paused Procedure for saving measurements The procedure for saving measurements is this: 1. Ensure that the Start saving measurements menu is checked so the text in the menu is now Stop saving measurements. 2. Now in BlomURBEX Viewer do a measurement as described in this manual. A message to confirm the saving appears, informing about the measurement that is going to be saved, and the method and sub-option to be used. Click Yes to proceed. 3. An input box appears, for methods Save as text, Save as dimension and Save as attribute, to define a text height in map units that will be used to draw texts in AutoCAD. Type a height value and click OK. 4. Click in the map display to activate the AutoCAD commands. 5. If the mode for saving was Save as text, the user will be prompted for a point where to insert the text. Enter a known coordinates and press Enter or click a point in the map. 6. If the mode for saving was Save as dimension and the sub-option was Linear dimension, the user will be prompted for a point where to start creating the dimension. Enter a known coordinates and press Enter or click a point in the map. 42


48 Next the user will be prompted for a point where to finish creating the dimension. Enter a known coordinates and press Enter or click a point in the map. Finally the user will be prompted for a point where to position the dimension. Enter a known coordinates and press Enter or click a point in the map. 7. If the mode for saving was Save as dimension and the sub-option for storing measurements was Angular dimension then the user will be prompted for a point where to position the vertex of the angular dimension. Enter a known coordinates and press Enter or click a point in the map. Next the user will be prompted for a point for the first reference point. Enter a known coordinates and press Enter or click a point in the map. Next the user will be prompted for a point for the second reference point. Enter a known coordinates and press Enter or click a point in the map. Finally the user will be prompted for a point where to position the dimension. Enter a known coordinates and press Enter or click a point in the map. 8. If the mode for saving was Save as attribute the user will be prompted for a point where to position the block with an attribute. Enter a known coordinates and press Enter or click a point in the map. 9. If the mode for saving was Save as an extrusion the user will be prompted to select one or several region objects. Select the objects you want to extrude and press Enter. To see the result of the extrusion, you should change the view of the map to a 3D viewport Example: how to extrude features to 3D In this example, the saving measurements capabilities will be used to extrude 2D features (buildings), to convert them to 3D features using the Height measurement tool. Follow the steps below: 1. Open AutoCAD 2010/2011/2012 and a dwg file with 2D features. 2. Features to be extruded must be regions, so if it not the case, select the Draw > Region command, or the Region tool from the Draw toolbar in AutoCAD. Then select the features to be converted to regions and press Enter. When doing this be aware that the new feature is added to the active layer. 43


49 On the left the building footprints (orange) before converted, drawn as polylines, and on the right, after using Region tool (white). 3. Tilt the view using the View > 3D Orbit menu to better appreciate the 3D conversion. 4. Open the BlomURBEX viewer if it was closed. Click in Center in new map point button and select a point in the map in the middle of the zone of interest. Switch to a oblique view. If view does not switch to any oblique view, check the intelligent behaviour and zoom in to closer zoom level, and then retry changing to any oblique view modes (North, South...). When the city buildings are best viewed, then proceed to next step. 44
>, and in the column for heights dropdown box select <Save as extrusion (only for heights)>. 6.")
50 5. Change Saving settings in the Settings dialog as previously indicated. In the Settings dialog set the table name to <Save as extrusion (only for heights)>, and in the column for heights dropdown box select <Save as extrusion (only for heights)>. 6. Check the File > Start saving measurements in BlomURBEX viewer toolbar to initialize saving session. 7. Select the Height tool. Measure heights in the buildings. Each height measured a message box appears with information about the measure to be saved. Click Yes to proceed. Then select the feature or features to extrude. Finally press Enter. The selected features are extruded. 45
51 12 Overlaying tile raster data BlomURBEX Viewer is able to overlay tile raster data from BlomURBEX server, both in Ortho and Oblique modes. In next chapter is explained how is possible to overlap also local vector data loaded in AutoCAD 2010/2011/2012. Both tile raster layers and local vector layers can be overlapped at the same time over the BlomURBEX Viewer. They all are treated as layers and drawn on top of the basemap imagery Activating and deactivating raster overlays To activate or deactivate the raster overlays follow these steps: 1. Click in the Settings > Open Settings dialog menu. 2. Select the Overlays tab. 3. Each time the settings dialog in opened, a query is done to the BlomURBEX server to return the available tile layers for the current user. Remember when changing the UserToken option to close the dialog clicking OK button and to open again the dialog, because each UserToken has permission for different tile layers depending on user restrictions. Indeed, it is possible for a customer to host his vector data at BlomURBEX through a rasterization process. 4. Select one or several layers from the list Tile layer to overlay from server. Click once to select and once again to deselect. 5. Click OK to save the setting and start overlaying or clean overlays. This setting is not saved in user registry for better performance initialization. BlomURBEX Viewer always start with the setting unselected. It is needed to set it explicitly in each BlomURBEX Viewer session. 46

52 Tile raster overlay with TeleAtlas streetmap 47
53 13 Overlaying vector data BlomURBEX Viewer is able to overlay vector data from AutoCAD 2010/2011/2012 on top of BlomURBEX imagery, both in Ortho and Oblique modes Activating and deactivating vector overlays To activate or deactivate the vector overlays there are two options with the same result: 1. Click in Overlay vector layers over BlomURBEX imagery button in the BlomURBEX toolbar. OR 2. Click in the Settings > Open Settings dialog menu. 3. Select the Overlays tab. 4. Check or uncheck the Overlay vector layers over BlomURBEX imagery checkbox to activate or deactivate overlays, respectively. 5. Click OK to save the setting and start overlaying or clean overlays. This setting is not saved in user registry for better performance initialization. BlomURBEX Viewer always start with the setting uncheck. It is needed to set it explicitly in each BlomURBEX Viewer session. 48
54 Overlying on top of oblique imagery may be a long time operation. Be patient when overlaying a big number of features over oblique images. Read below for tricks to improve performance Refreshing vector overlays When Overlay option is activated all the existing layers in the AutoCAD 2010/2011/2012 map display are added to BlomURBEX views. If a new layer is added or any feature is modified in its geometry after activating the Overlay option, these changes are not shown immediately. To reflect these changes is needed to click in the Reload overlays button in the BlomURBEX Viewer toolbar. This function again adds the layers to BlomURBEX; cleans all the overlays and redraw again the vector data. Before refreshing Vector Overlay 49

55 Before refreshing Vector Overlay When overlaying vector data in oblique imagery, remember that vertexes of the geometries should match with the imagery at the ground level, not at the roof level. That is the reason of the apparent offset seen when overlapping over oblique imagery Overlay and performance considerations To overlap geometries faster, a combination of requests to BlomURBEX server and local interpolations is done. It is possible to adjust the precision of the interpolations. For that, follow these steps. 1. Open Settings dialog. 2. Select the Overlays tab. 3. The amount of points used for the interpolation determines the accuracy. It is possible to use no less than four points and no more than 400 points. Change this clicking up or down the Points of interpolation textbox. More points interpolate more accurately but are slower. Default is
56 When Overlay option is activated only visible features inside the visible extent are sent from AutoCAD 2010/2011/2012 to BlomURBEX Viewer and rendered on top of BlomURBEX imagery. Try to limit the amount of features to be sent or the BlomURBEX Viewer performance will decrease when overlapping imagery. To limit the number of features follow this advices: 1. Remove those layers that do not contain entities, or that contain blocks or references. Blocks and references are ignored when overlapping. If the drawing contains a big number of temporary layers, blocks, and references, consider the creation of a new version of the drawing using only the entities that can be overlapped. 2. Use DWG format better than DXF format. 3. Use Color ByLayer and Line Type ByLayer. This has a great impact in performance. BlomURBEX viewer is optimized to show GIS-like vector data that uses one style per layer, instead of CAD-like vector layer, where each entity can be drawn with different style properties. 4. Hide in AutoCAD 2010/2011/2012 those layers that are not relevant. 5. Zoom in inside Ortho BlomURBEX views so the visible extent contains a small number of features. Only features that fall inside the visible extent are overlaid. The zoom level is not a consideration in Oblique mode Symbology limitations The BlomURBEX Viewer has less symbology properties than AutoCAD 2010/2011/2012. These are the limitations of the current version: 1. Only AutoCAD 2010/2011/2012 entities that support the LightWeightPolyline interface are sent to BlomURBEX. For example, ellipse or circle elements are not drawn in BlomURBEX. Arcs entities are treated as straight lines and the curved lines are not preserved. Each element in the drawing is draw with its own color and width, or the Layer one if the element has the ByLayer color and width. 2. Points are visible. 3. Polylines supported are always shown as solid lines, but the width and color are correctly chosen. 4. Polygons and the rest of AutoCAD 2010/2011/2012 entity types are not supported. 51
57 14 Uninstalling BlomURBEX plug-in for AutoCAD 2010/2011/2012 To uninstall follow these steps: 1. In the Windows Control Panel, open the Add/Remove programs, select BlomURBEX plug-in for AutoCAD 2010/2011/2012 and uninstall, following the guidelines. 52
58 15 Troubleshooting 15.1 Log files If the applications do not work as expected, the best way to know what is happening is to activate the logging utility. In BlomURBEX Viewer, to activate logs, open the Settings dialog, and in the General tab, select the desired level for logs. A log file or several, one per process, will be created in the [User Application Data] \ BlomURBEX2D folder (usually c:\ Documents and Settings \<username>\application Data\BlomURBEX2D). To deactivate logs just select None as log level. To activate logs select Error, Warning, or Information level (in order from minimum to maximum verbose). Log files offer the time and some information about events that occur in the applications that can help to solve some problems. Otherwise, if the problem is not known, send the log files with your comments to Blom Technical Support to help in fixing the problem. You can use the menu? > Send feedback to send an . 53
59 15.2 Cache directory The BlomURBEX Viewer creates a cache folder stored in [User Application Data] \ BlomURBEX2D \ cache folder (usually c:\ Documents and Settings \<username>\application Data\BlomURBEX2D\cache). This cache folder store tiles for faster retrieve of them. To avoid this folder to resize to a big amount of bytes, it is possible to delete its contents periodically. Deleting the cache folder also ensures that the last tiles are downloaded. To delete the cache click in the Delete cache button from the General tab of the Settings dialog, or just delete its content from Windows Explorer. 54
60 16 Frequently Asked Questions 1. Why I do not see the visible and total extent of images in AutoCAD 2010/2011/2012? Ensure checkboxes in Linking tab of BlomURBEX Viewer Settings dialog are checked. 2. Why the point I select in AutoCAD 2010/2011/2012 is not exactly the same in the image in BlomURBEX Viewer? The data opened in AutoCAD 2010/2011/2012 can be in any coordinate system. When digitizing this data, a coordinate system was used, defined by some parameters that describe the Earth and how to convert between projections. BlomURBEX Viewer uses the DotSpatial library to perform transformations between any projection and Mercator Spheric (EPSG: 3785), the default projection that use BlomURBEX Web Services at the moment. If the parameters used by the operator that digitizes the data opened in AutoCAD 2010/2011/2012 and the parameters used in DotSpatial are not the exactly the same, some shift can occur in the location. In order to minimize this shift, it is possible to modify the epsg file that comes in the BlomURBEX install dir. The parameters must comply with the rules that expect DotSpatial (PROJ4 format). To know more about this, check the appendix below. 3. Why the measurements are not saved in AutoCAD? The requirements to save measurements in AutoCAD are the following. If any of this requirements are not fulfilled the saving will not takes place. In the BlomURBEX Viewer settings dialog a table and a field must be selected for the desired measurement type. To store heights, the correct dropdown box with the field for heights must be selected, for example. If the dropdown has <None> selected that measurement will be ignored. The File > Start saving measurements menu must be checked. 55
61 17 Appendix A: how to add new projections The projection support relies on the DotSpatial public domain library. In the installation folder of BlomURBEX Viewer a file epsg is provided that contains EPSG codes, names and parameters for the EPSG coded projections. If you need to modify an existing projection, or to add support for new projections, modify this file with any text editor following the DotSpatial (Proj4) rules for parameters. See the webpage for more information. For example, if support for the Microsoft Live Maps projection is needed, add the next two lines to the file (the second line looks longer but is only one): # World Mercator <54004> +proj=merc +lat_ts=0 +lon_0=0 +k= x_0=0 +y_0=0 +ellps=wgs84 +datum=wgs84 +units=m no_defs <> Or support for Google Maps projection: #Google <900913> +proj=merc +a= b= lat_ts=0.0 +lon_0=0.0 +x_0=0.0 +y_0=0 +k=1.0 +units=m +nadgrids=@null +wktext +no_defs <> For optimize the Select projection dialog, delete from the epsg file any projection not needed. Remember that each projection in the file uses two lines, so do not break the format of this file or BlomURBEX Viewer could not work correctly. Once the epsg file is modified, open again the Settings dialog in BlomURBEX Viewer and reselect again the projection to refresh internal BlomURBEX settings. 56


62 18 Appendix B: how to improve interface translation BlomURBEX Viewer interface supports twelve languages. The strings for each language are stored in the registry, in the path HKEY_LOCAL_MACHINE / SOFTWARE / Blom / Urbex 2.0. Each language has a section: english (en), español (es), deutsch (de), français (fr), italiano (it), nederlands (nl), portugués (pt), dansk (da), norsk (no), svenska (sv), suomi (fi), româna (ro). Each string uses a pair name-value. The name is an easy-to-understand name. For example, AboutBoxForm.Description is the description for BlomURBEX Viewer that appears in the About dialog. Change these values at your convenience using the registry editor. Next time you open BlomURBEX Viewer will reflect your changes. If any value is missing, the default value used is the English string. If you found wrong strings in your language and want to help us improve the software, feel free to send us an export of the registry language settings to the Blom Technical Support using? > Send feedback menu in BlomURBEX Viewer. 57
BlomURBEX. AutoCAD Plug-in v3.5.0 User manual. BlomURBEX Plug-in for AutoCAD. : BLOM ASA partners and developers
 BlomURBEX AutoCAD Plug-in v3.5.0 User manual Audience Abstract : BLOM ASA partners and developers : User manual for Date Blom Document 4 Dec 2012 BlomURBEX AutoCAD plug-in - User manual.docx i Revision
BlomURBEX. MicroStation Plug-in v3.0.0 User manual. Blom Document 14 December 2010 BlomURBEX MicroStation Plug-in User manual.
 BlomURBEX MicroStation Plug-in v3.0.0 User manual Audience Abstract : BLOM ASA partners and developers : User manual for BlomURBEX MicroStation Plug-in Date Blom Document 14 December 2010 BlomURBEX MicroStation
BlomURBEX. MicroStation 8i Plug-in v3.0.0 User manual. 16 February 2010 BlomURBEX MicroStation 8i plug-in User manual.docx
 BlomURBEX MicroStation 8i Plug-in v3.0.0 User manual Audience Abstract : BLOM ASA partners and developers : User manual for BlomURBEX MicroStation 8i plug-in Date Blom Document 16 February 2010 BlomURBEX
BlomURBEX. ArcMap 9.2, 9.3 & Plug-in v3.0 User manual. : User manual for BlomURBEX ArcMap 9.2, 9.3 & Plug-in
 BlomURBEX ArcMap 9.2, 9.3 & 9.3.1 Plug-in v3.0 User manual Audience Abstract : BLOM ASA partners and developers : User manual for BlomURBEX ArcMap 9.2, 9.3 & 9.3.1 Plug-in Date Blom Document 26 November
BlomURBEX. ArcMap Plug-in v3.5.0 User manual. BlomURBEX Plug-in for ArcMap. : BLOM ASA partners and developers
 BlomURBEX ArcMap Plug-in v3.5.0 User manual Audience Abstract : BLOM ASA partners and developers : User manual for BlomURBEX Plug-in for ArcMap Date Blom Document 09 November 2012 BlomURBEX ArcMap plug-in
BlomURBEX ArcMap Plug-in User Manual
 The leading provider of aerial imagery, remote sensing and geospatial solutions Customer Support Document BlomURBEX ArcMap Plug-in User Manual Customer Support Document May 2013 Revision History REVISION
Pictometry for ArcGIS Desktop Local Guide For ArcGIS Desktop Version 10
 Pictometry for ArcGIS Desktop Local Guide For ArcGIS Desktop Version 10 September 2013 Copyright 2010-2013 Pictometry International Corp. All rights reserved. No part of this publication may be reproduced,
Pictometry for ArcGIS Desktop Local Guide For ArcGIS Desktop Version 10.3
 for ArcGIS Desktop Local Guide For ArcGIS Desktop Version 10.3 June 2015 Copyright 2010-2015 International Corp. All rights reserved. No part of this publication may be reproduced, stored in a retrieval
Pictometry for ArcGIS Desktop Local Release Notes
 Version 10.4 The Desktop - Local 10.4 extension is compatible with ArcGIS Desktop 10.4. Version 10.3.2 This extension includes a new installer, which allows you to select a location (other than Program
BlomURBEX. Whitepaper. BLOM ASA partners and developers. BlomURBEX WhitePaper v5.0r1.0a
 BlomURBEX Whitepaper Audience: BLOM ASA partners and developers BlomURBEX WhitePaper v5.0r1.0a Table of Contents 1 What is BlomURBEX TM... 1 1.1 The BlomURBEX TM platform... 1 2 BlomURBEX TM datasets...
GIS DATA SUBMISSION USER GUIDE. Innovation and Networks Executive Agency
 Innovation and Networks Executive Agency GIS DATA SUBMISSION USER GUIDE Innovation and Networks Executive Agency (INEA) W910 Chaussée de Wavre 910 B-1049 Brussels, Belgium Tel: +32 (0)2 29 95252 Fax: +32
ArcGIS Extension User's Guide
 ArcGIS Extension 2010 - User's Guide Table of Contents OpenSpirit ArcGIS Extension 2010... 1 Installation ( ArcGIS 9.3 or 9.3.1)... 3 Prerequisites... 3 Installation Steps... 3 Installation ( ArcGIS 10)...
GIS DATA SUBMISSION USER GUIDE. Innovation and Networks Executive Agency
 Innovation and Networks Executive Agency GIS DATA SUBMISSION USER GUIDE Innovation and Networks Executive Agency (INEA) W910 Chaussée de Wavre 910 B-1049 Brussels, Belgium Tel: +32 (0)2 29 95252 Fax: +32
OnCOR Silverlight Viewer Guide
 Getting Around There are many ways to move around the map! The simplest option is to use your mouse in the map area. If you hold the left button down, then click and drag, you can pan the map to a new
RAPIDMAP Geocortex HTML5 Viewer Manual
 RAPIDMAP Geocortex HTML5 Viewer Manual This site was developed using the evolving HTML5 web standard and should work in most modern browsers including IE, Safari, Chrome and Firefox. Even though it was
Open Source Cloud Map User Guide
 Open Source Cloud Map User Guide Table of Contents Map Page... 1 Static Mercator Map... 1 Customizable Map... 1 Title Bar... 2 Toolbar... 2 Non Toolbar Navigation... 3 Map Window... 3 Layers / Legend Window...
Lab 3: Digitizing in ArcMap
 Lab 3: Digitizing in ArcMap What You ll Learn: In this Lab you ll be introduced to basic digitizing techniques using ArcMap. You should read Chapter 4 in the GIS Fundamentals textbook before starting this
How to use the DuPage County Parcel Viewer Interactive Web Mapping Application.
 How to use the DuPage County Parcel Viewer Interactive Web Mapping Application. Parcel Viewer URL: URL: http://gis.dupageco.org/parcelviewer/ Initial View (And frequently asked questions) Parcel Search
for ArcSketch Version 1.1 ArcSketch is a sample extension to ArcGIS. It works with ArcGIS 9.1
 ArcSketch User Guide for ArcSketch Version 1.1 ArcSketch is a sample extension to ArcGIS. It works with ArcGIS 9.1 ArcSketch allows the user to quickly create, or sketch, features in ArcMap using easy-to-use
Exercise 1: Getting to know ArcGIS
 The Scenario You are working for the California Visitor s Commission. You have been asked to prepare a map of California for several dignitaries from out of the country. Your map will need to include enough
SAGIS Property Map Viewer Instruction Manual Instructions for using the SAGIS Property Map Viewer. Published December 21, 2018.
 SAGIS Property Map Viewer Instruction Manual www.sagis.org/map Instructions for using the SAGIS Property Map Viewer. Published December 21, 2018. 1 Instructional Videos Click on a link to watch a video
Pre-release User Guide. Version 2.0 August 2015
 Pre-release User Guide Version 2.0 August 2015 Copyright 2015 EagleView Technologies. Copyright 2015 Pictometry International Corp. All rights reserved. No part of this publication may be reproduced, stored
XnView Image Viewer. a ZOOMERS guide
 XnView Image Viewer a ZOOMERS guide Introduction...2 Browser Mode... 5 Image View Mode...14 Printing... 22 Image Editing...26 Configuration... 34 Note that this guide is for XnView version 1.8. The current
Geographical Information Systems Institute. Center for Geographic Analysis, Harvard University. LAB EXERCISE 1: Basic Mapping in ArcMap
 Harvard University Introduction to ArcMap Geographical Information Systems Institute Center for Geographic Analysis, Harvard University LAB EXERCISE 1: Basic Mapping in ArcMap Individual files (lab instructions,
Server Usage & Third-Party Viewers
 Server Usage & Third-Party Viewers October 2016 HiPER LOOK Version 1.4.16.0 Copyright 2015 PIXIA Corp. All Rights Reserved. Table of Contents HiPER LOOK Server Introduction... 2 Google Earth... 2 Installation...2
Explore some of the new functionality in ArcMap 10
 Explore some of the new functionality in ArcMap 10 Scenario In this exercise, imagine you are a GIS analyst working for Old Dominion University. Construction will begin shortly on renovation of the new
Guide to Mapping Website (Public) December 2016 GC_236594
 December 2016 GC_236594") Guide to Mapping Website (Public) December 2016 GC_236594 Table of Contents Guide to Mapping Website (Public)... 1 December 2016... 1 Quick Start... 3 Map Layers... 4 How do I?... 5 Draw on the Map...
Guide to Mapping Website (Public) December 2016 GC_236594 Table of Contents Guide to Mapping Website (Public)... 1 December 2016... 1 Quick Start... 3 Map Layers... 4 How do I?... 5 Draw on the Map...
4. If you are prompted to enable hardware acceleration to improve performance, click
 Exercise 1a: Creating new points ArcGIS 10 Complexity: Beginner Data Requirement: ArcGIS Tutorial Data Setup About creating new points In this exercise, you will use an aerial photograph to create a new
Controlling the Drawing Display
 Controlling the Drawing Display In This Chapter 8 AutoCAD provides many ways to display views of your drawing. As you edit your drawing, you can control the drawing display and move quickly to different
CHAPTER 1 COPYRIGHTED MATERIAL. Getting to Know AutoCAD. Opening a new drawing. Getting familiar with the AutoCAD and AutoCAD LT Graphics windows
 CHAPTER 1 Getting to Know AutoCAD Opening a new drawing Getting familiar with the AutoCAD and AutoCAD LT Graphics windows Modifying the display Displaying and arranging toolbars COPYRIGHTED MATERIAL 2
v Overview SMS Tutorials Prerequisites Requirements Time Objectives
 v. 12.2 SMS 12.2 Tutorial Overview Objectives This tutorial describes the major components of the SMS interface and gives a brief introduction to the different SMS modules. Ideally, this tutorial should
QUICK START GUIDE. SOLO Forest
 QUICK START GUIDE SOLO Forest Software Installation 1. For PC installation, run the.msi file. 2. For Mobile device installation, copy the.cab file onto the device 3. Run the.cab file Starting the Program
City of La Crosse Online Mapping Website Help Document
 City of La Crosse Online Mapping Website Help Document This document was created to assist in using the new City of La Crosse online mapping sites. When the website is first opened, a map showing the City
Layout Tutorial. Getting Started. Creating a Layout Template
 Layout Tutorial This tutorial will explain how create a layout template, send views to a layout page, then save the document in PDF format. In this tutorial you will learn about: Creating a Layout Template
BC Spatial Member Map Viewer. Version 2.0. User Guide. May 2015
 BC Spatial Member Map Viewer Version 2.0 User Guide May 2015 1 P a g e Revised: 16 June 2015 Contents Contents... 2 Introduction... 4 System Requirements... 5 BC Spatial Map Viewer... 6 I. Navigation Tools...
Greater Bridgeport Regional Council Municipal GIS Viewer Training April 2015
 Greater Bridgeport Regional Council Municipal GIS Viewer Training April 2015 GBRC GIS Web Training Table of Contents Introduction........................................................... 3 Viewer Components.......................................................
Import, view, edit, convert, and digitize triangulated irregular networks
 v. 10.1 WMS 10.1 Tutorial Import, view, edit, convert, and digitize triangulated irregular networks Objectives Import survey data in an XYZ format. Digitize elevation points using contour imagery. Edit
v SMS 11.1 Tutorial GIS Requirements GIS Module Map Module ArcGis (Optional) Time minutes Prerequisites None Objectives
 Time minutes Prerequisites None Objectives") v. 11.1 SMS 11.1 Tutorial GIS Objectives This tutorial demonstrates how you can read in GIS data, visualize it, and convert it into SMS coverage data that could be used to build a numeric model. We will
v. 11.1 SMS 11.1 Tutorial GIS Objectives This tutorial demonstrates how you can read in GIS data, visualize it, and convert it into SMS coverage data that could be used to build a numeric model. We will
XnView 1.9. a ZOOMERS guide. Introduction...2 Browser Mode... 5 Image View Mode...15 Printing Image Editing...28 Configuration...
 XnView 1.9 a ZOOMERS guide Introduction...2 Browser Mode... 5 Image View Mode...15 Printing... 22 Image Editing...28 Configuration... 36 Written by Chorlton Workshop for hsbp Introduction This is a guide
v SMS 12.1 Tutorial GIS Requirements GIS Module Map Module ArcGis (Optional) Time minutes Prerequisites None Objectives
 Time minutes Prerequisites None Objectives") v. 12.1 SMS 12.1 Tutorial Objectives This tutorial demonstrates how to read in data, visualize it, and convert it into SMS coverage data that could be used to build a numeric model. This tutorial will
v. 12.1 SMS 12.1 Tutorial Objectives This tutorial demonstrates how to read in data, visualize it, and convert it into SMS coverage data that could be used to build a numeric model. This tutorial will
BooneMap LT User Guide
 BooneMap LT 2016 User Guide Boone County Planning Commission GIS Services Division 2950 Washington St, Room 317 P.O. Box 958 Burlington, Kentucky 41005 Phone: 859.334.2196 Fax: 859.334.2264 Email: bcgis@boonecountyky.org
Introduction to GIS 2011
 Introduction to GIS 2011 Digital Elevation Models CREATING A TIN SURFACE FROM CONTOUR LINES 1. Start ArcCatalog from either Desktop or Start Menu. 2. In ArcCatalog, create a new folder dem under your c:\introgis_2011
MapInfo ProViewer 11.0 USER GUIDE
 MapInfo ProViewer 11.0 USER GUIDE Information in this document is subject to change without notice and does not represent a commitment on the part of the vendor or its representatives. No part of this
City of Richmond Interactive Map (RIM) User Guide for the Public
 User Guide for the Public") Interactive Map (RIM) User Guide for the Public Date: March 26, 2013 Version: 1.0 3479477 3479477 Table of Contents Table of Contents Table of Contents... i About this
Interactive Map (RIM) User Guide for the Public Date: March 26, 2013 Version: 1.0 3479477 3479477 Table of Contents Table of Contents Table of Contents... i About this
Press the Plus + key to zoom in. Press the Minus - key to zoom out. Scroll the mouse wheel away from you to zoom in; towards you to zoom out.
 Navigate Around the Map Interactive maps provide many choices for displaying information, searching for more details, and moving around the map. Most navigation uses the mouse, but at times you may also
Getting Started. In This Chapter
 Getting Started In This Chapter 2 This chapter introduces concepts and procedures that help you get started with AutoCAD. You learn how to open, close, and manage your drawings. You also learn about the
Web Viewer Guide. HiPER LOOK Version Copyright 2016 PIXIA Corp. All Rights Reserved.
 Web Viewer Guide 2016 HiPER LOOK Version 1.4.16.0 Copyright 2016 PIXIA Corp. All Rights Reserved. Table of Contents 1 System Requirements... 5 1.1 Prerequisites... 5 1.2 Web Browser... 5 2 HiPER LOOK Web
Quick Guide to MapWindow GIS Desktop Application
 Quick Guide to MapWindow 1 Quick Guide to MapWindow GIS Desktop Application Version 2 January 2007 Adapted by Tom Croft. This is a summary user guide for commonly used tools and capabilities and does not
GIS-BASED SUPPORT FOR IMPLEMENTING POLICIES AND PLANS TO INCREASE ACCESS TO ENERGY SERVICES IN GHANA
 GIS-BASED SUPPORT FOR IMPLEMENTING POLICIES AND PLANS TO INCREASE ACCESS TO ENERGY SERVICES IN GHANA Appendix 3: GEAR Toolkit User Guide and Training Manual March 2012 Francis Kemausuor; Abeeku Brew-Hammond;
Juniata County, Pennsylvania
 GIS Parcel Viewer Web Mapping Application Functional Documentation June 21, 2017 Juniata County, Pennsylvania Presented by www.worldviewsolutions.com (804) 767-1870 (phone) (804) 545-0792 (fax) 115 South
The Preparing for Success Online Mapping Tool
 The Preparing for Success Online Mapping Tool Baker Polito Administration The Executive Office of Housing and Economic Development and MassGIS Questions & Comments? Please contact MassWorks@state.ma.us
v Introduction to WMS WMS 11.0 Tutorial Become familiar with the WMS interface Prerequisite Tutorials None Required Components Data Map
 s v. 11.0 WMS 11.0 Tutorial Become familiar with the WMS interface Objectives Import files into WMS and change modules and display options to become familiar with the WMS interface. Prerequisite Tutorials
In this exercise, you will convert labels into geodatabase annotation so you can edit the text features.
 Instructions: Use the provided data stored in a USB. For the report: 1. Start a new word document. 2. Follow an exercise step as given below. 3. Describe what you did in that step in the word document
13. Albums & Multi-Image Printing
 13. Albums & Multi-Image Printing The Album function is a flexible layout and printing tool that can be used in a number of ways: Two kinds of albums: At left we used automatic mode to print a collection
GEOCIRRUS 3D Viewer. User Manual: GEOCIRRUS 3D Viewer Document version 1.6 Page 1
 GEOCIRRUS 3D Viewer Page 1 Table of Contents 3D Viewer Functionality... 3 Line of Sight (LoS)... 4 Identify... 8 Measurement... 9 3D Line Measure Tool... 10 3D Area Measure Tool... 11 Environment... 12
Microsoft Word
 OBJECTS: Shapes (part 1) Shapes and the Drawing Tools Basic shapes can be used to graphically represent information or categories. The NOTE: Please read the Objects (add-on) document before continuing.
Acrobat X Professional
 Acrobat X Professional Toolbar Well Page Navigations/Page Indicator Buttons for paging through document Scroll Bar/box page indicator appears when using the scroll button to navigate. When you release
User Manual. pdoc Forms Designer. Version 3.7 Last Update: May 25, Copyright 2018 Topaz Systems Inc. All rights reserved.
 User Manual pdoc Forms Designer Version 3.7 Last Update: May 25, 2018 Copyright 2018 Topaz Systems Inc. All rights reserved. For Topaz Systems, Inc. trademarks and patents, visit www.topazsystems.com/legal.
What's New in ArcGIS 9.2 Service Packs
 What's New in ArcGIS 9.2 Service Packs 18 July 2007 Updated for Service Pack 3 This document describes the main enhancements to 9.2 added by the service packs. It does not cover the bug fixes and quality
Managing Content with AutoCAD DesignCenter
 Managing Content with AutoCAD DesignCenter In This Chapter 14 This chapter introduces AutoCAD DesignCenter. You can now locate and organize drawing data and insert blocks, layers, external references,
Basic Tasks in ArcGIS 10.3.x
 Basic Tasks in ArcGIS 10.3.x This guide provides instructions for performing a few basic tasks in ArcGIS 10.3.1, such as adding data to a map document, viewing and changing coordinate system information,
COGCC GIS Online Map Tools-Intranet Site July 12, 2011
 COGCC GIS Online Map Tools-Intranet Site July 12, 2011 Table of Contents Page Section Page Section 1 Introduction 7 Clear Selection 2 Double Click 7 Buffer 2 Arrow Tip Information 8 Select within 3 Busy
v SMS 12.2 Tutorial GIS Requirements GIS Module Map Module ArcGis (Optional) Time minutes Prerequisites None Objectives
 Time minutes Prerequisites None Objectives") v. 12.2 SMS 12.2 Tutorial Objectives This tutorial demonstrates how to read in data, visualize it, and convert it into SMS coverage data that could be used to build a numeric model. This tutorial will
v. 12.2 SMS 12.2 Tutorial Objectives This tutorial demonstrates how to read in data, visualize it, and convert it into SMS coverage data that could be used to build a numeric model. This tutorial will
GIS LAB 1. Basic GIS Operations with ArcGIS. Calculating Stream Lengths and Watershed Areas.
 GIS LAB 1 Basic GIS Operations with ArcGIS. Calculating Stream Lengths and Watershed Areas. ArcGIS offers some advantages for novice users. The graphical user interface is similar to many Windows packages
Using rasters for interpolation and visualization in GMS
 v. 10.3 GMS 10.3 Tutorial Using rasters for interpolation and visualization in GMS Objectives This tutorial teaches how GMS uses rasters to support all kinds of digital elevation models and how rasters
Setting Up Your Drawing Environment
 Setting Up Your Drawing Environment In This Chapter 3 After you start a drawing, you can change its settings, including drawing units and limits, snap and grid settings, and layer, linetype, and lettering
Creating Interactive PDF Forms
 Creating Interactive PDF Forms Using Adobe Acrobat X Pro for the Mac University Information Technology Services Training, Outreach, Learning Technologies and Video Production Copyright 2012 KSU Department
ANALYSIS SOFTWARE. CAmReport
 ANALYSIS SOFTWARE CAmReport ENGLISH User Manual CONTENTS 1. INSTALLATION... 3 2. GETTING STARTED... 4 2.1 Starting and Exiting CAmReport... 4 2.2 Setup... 4 2.2.1 Language... 4 2.2.2 Units... 4 2.2.3 CAmReport
Manitowoc County, WI Advanced Access GIS Viewer User Documentation
 Manitowoc County, WI Advanced Access GIS Viewer User Documentation Introduction Extensive time was put into developing this website both from a display, and from a printing and scaling perspective. This
WinView. Getting Started Guide
 WinView Getting Started Guide Version 4.3.12 June 2006 Copyright 2006 Mincom Limited All rights reserved. No part of this document may be reproduced, transferred, sold or otherwise disposed of without
ERDAS Image Web Server Datasheet
 ERDAS Image Web Server Datasheet age 1 of 10 ERDAS Image Web Server Image serving protocols Multi-protocol support Expose images with different protocols. ERDAS Compressed Wavelet Protocol (ECWP) image
Welcome to MicroStation
 Welcome to MicroStation Module Overview This module will help a new user become familiar with the tools and features found in the MicroStation design environment. Module Prerequisites Fundamental knowledge
Tutorial 1 Exploring ArcGIS
 Tutorial 1 Exploring ArcGIS Before beginning this tutorial, you should make sure your GIS network folder is mapped on the computer you are using. Please refer to the How to map your GIS server folder as
To the GeoView System Overview Online Training Course
 Welcome! To the GeoView System Overview Online Training Course The Alberta Department of Energy provides GeoView as a mapping system to enable users to find geographic information in Alberta. GeoView retrieves
MRMLS SmartMap CityGIS5 (More training available at
 MRMLS SmartMap CityGIS5 (More training available at http://www.imrmls.com/centsite/training.html) 3201 W. Temple Ave., Suite 250 Pomona, Ca 91768 800-925-1525 or http://www.imrmls.com/support Last Edited
Edupen Pro User Manual
 Edupen Pro User Manual (software for interactive LCD/LED displays and monitors) Ver. 3 www.ahatouch.com Some services in Edupen Pro require dual touch capability. In order to use dual touch, your computer
FactoryLink 7. Version 7.0. Client Builder Reference Manual
 FactoryLink 7 Version 7.0 Client Builder Reference Manual Copyright 2000 United States Data Corporation. All rights reserved. NOTICE: The information contained in this document (and other media provided
Geography 281 Mapmaking with GIS Project One: Exploring the ArcMap Environment
 Geography 281 Mapmaking with GIS Project One: Exploring the ArcMap Environment This activity is designed to introduce you to the Geography Lab and to the ArcMap software within the lab environment. Please
COGCC GIS Online Map Instructions - Internet Site April 10, 2018
 COGCC GIS Online Map Instructions - Internet Site April 10, 2018 Table of Contents Page Section Page Section 1 Introduction 8 Clear Selection 2 Double Click 8 Buffer 3 Arrow Tip Information 9 Select within
The Rectangular Problem
 C h a p t e r 2 The Rectangular Problem In this chapter, you will cover the following to World Class standards: The tools for simple 2D Computer Aided Drafting (CAD) The Command Line and the Tray The Line
User s Guide. Valvova Oy
 User s Guide Valvova Oy June 21, 2017 CONTENTS Contents 1 Timeline 2 1.1 Program startup......................................... 3 1.2 Calendar............................................. 3 1.3 Go to
Map Tools: A Transformative Experience
 Bonus Chapter 3 Map Tools: A Transformative Experience The Autodesk AutoCAD Civil 3D 2016 software contains most of the functionality that can be found in the Autodesk AutoCAD Map 3D 2016 software. As
ENVI Tutorial: Introduction to ENVI
 ENVI Tutorial: Introduction to ENVI Table of Contents OVERVIEW OF THIS TUTORIAL...1 GETTING STARTED WITH ENVI...1 Starting ENVI...1 Starting ENVI on Windows Machines...1 Starting ENVI in UNIX...1 Starting
TRAINING GUIDE. Mobile for Administrators Part 3 - GIS
 TRAINING GUIDE Mobile for Administrators Part 3 - GIS Mobile for Administrators - GIS One of the critical components of mobile is GIS, and it can also be the most complex. The mobile GIS maps are designed
Page 1 of 16 CONTENTS:
 Page 1 of 16 CONTENTS: HOME-BOX -- (PG.2) o PROPERTY OWNERSHIP o ADDRESS SEARCH o I WANT TO AERIAL IMAGERY AND BASE MAPS -- (PG.2) o IMAGERY WITH LABELS ON/OFF o TOPOGRAPHY ON/OFF o TRANSPARENCY ZOOM IN
ArcGIS 9. Using ArcReader
 ArcGIS 9 Using ArcReader Copyright 2003 2004 ESRI. All Rights Reserved. Printed in the United States of America. The information contained in this document is the exclusive property of ESRI. This work
Mosaic Tutorial: Advanced Workflow
 Mosaic Tutorial: Advanced Workflow This tutorial demonstrates how to mosaic two scenes with different color variations. You will learn how to: Reorder the display of the input scenes Achieve a consistent
Using SymPrint to Make Overlays, Templates & More...
 Welcome to SymPrint SymPrint is an easy-to-use tool for creating communication overlays, worksheets, classroom activities and more using a modern toolbar and common-sense interface modeled after the programs
Objectives Learn how to work with projections in GMS, and how to combine data from different coordinate systems into the same GMS project.
 v. 10.2 GMS 10.2 Tutorial Working with map projections in GMS Objectives Learn how to work with projections in GMS, and how to combine data from different coordinate systems into the same GMS project.
GIS Basics for Urban Studies
 GIS Basics for Urban Studies Date: March 21, 2018 Contacts: Mehdi Aminipouri, Graduate Peer GIS Faciliator, SFU Library (maminipo@sfu.ca) Keshav Mukunda, GIS & Map Librarian Librarian for Geography (kmukunda@sfu.ca)
Working with PDF s. To open a recent file on the Start screen, double click on the file name.
 Working with PDF s Acrobat DC Start Screen (Home Tab) When Acrobat opens, the Acrobat Start screen (Home Tab) populates displaying a list of recently opened files. The search feature on the top of the
TRAINING GUIDE. Tablet: Cradle to Mobile GIS
 TRAINING GUIDE Tablet: Cradle to Mobile GIS Tablet Cradle to Mobile One of the critical components of mobile is the GIS piece, and also can be the most complex. The mobile GIS maps are designed to consume
Insight: Measurement Tool. User Guide
 OMERO Beta v2.2: Measurement Tool User Guide - 1 - October 2007 Insight: Measurement Tool User Guide Open Microscopy Environment: http://www.openmicroscopy.org OMERO Beta v2.2: Measurement Tool User Guide
GeoWeb Portal. User Manual
 GeoWeb Portal User Manual Purpose The GeoWeb Portal (GWP) is a map viewing and publishing site. It is designed to allow people to build their own maps and review the data that is attached to the elements
Map Viewer User Guide
 Map Viewer User Guide Sea Level Scenario Sketch Planning Tool Version 2, 2017 University of Florida GeoPlan Center Introduction The purpose of this document is to guide users on how to use the Sea Level
3. Map Overlay and Digitizing
 3. Map Overlay and Digitizing 3.1 Opening Map Files NavviewW/SprayView supports digital map files in ShapeFile format from ArcView, DXF format from AutoCAD, MRK format from AG-NAV, Bitmap and JPEG formats
Display Layers in Geosoft 3D View
 Use the New 2D/3D Workflow features in Target for ArcGIS In Target for ArcGIS version 3.5, there are three new interconnected features that make integrating 2D and 3D data in plan and section maps easier.
Tutorial 9: Creating Layout Plans and Printing
 Tutorial 9: Creating Layout Plans and Printing Tutorial Content 9.1. What is the layout view and how is this different to the data view? 9.2. How do I set out a map for printing in ArcMap? 9.3. What tools
Overview of CCSD Secure Cropper Map
 Overview of CCSD Secure Cropper Map Map Components: 1. Menu Options Use these menus to interact with the map. View School Zones: Use this menu to choose which school zone map to view. Select Students:
Please refer to for specifics and limitations with these operating systems.
 Appendix B ArcReader User Guide For the Southeast Ocean Based Renewable Energy Project INTRODUCTION The purpose of this document is to provide guidance and assistance to users with ArcReader, so that they