QuickScore. Version 2.3 User Guide. Table of Contents (Hyperlinked)
|
|
|
- Ilene Welch
- 6 years ago
- Views:
Transcription
 Getting Started Login Screen Navigating the Sections of QuickScore Icons My Bookmarks Section Administrator Message Briefing Pane Commonly Used Functions")
1 QuickScore Version 2.3 User Guide Table of Contents (Hyperlinked) Getting Started Login Screen Navigating the Sections of QuickScore Icons My Bookmarks Section Administrator Message Briefing Pane Commonly Used Functions The Administration Section Calendars Images Users Groups View Organization Permissions Owners and Updaters Application Configuration Server Configuration Database Connections License Management Current User Activity View Log Files Background Process Status Import Data Tree Fixer SQL Console The Briefing Books Section The Balanced Scorecard Section Building the Organizations Building Balanced Scorecards Navigation Subsection Executive View Subsection Overview Subsection Performance Measures Subsection Analysis Subsection Tasks Subsection Related Items Subsection The Strategy Maps Section The Strategic Initiatives Section Gantt Chart Subsection Overview Subsection The Documents Section The Reports Section The Dashboard Section Creating Your Dashboard Editing Your Dashboard

2 Getting Started Login Screen: This is the first screen you will see and how you access the application: Type in your username and password. If you have more than one database available, choose the correct database from the drop-down menu and then click the Submit button. 2

3 Navigating the Sections of QuickScore: QuickScore is broken down into different sections and subsections for easy navigation. Once you log in, check the top-left part of your screen and look for the following location: This indicates that you are currently looking at the My Bookmarks section. If you would like to change the section, either click on the My Bookmarks text or the small arrow icon to its right. This will pull up a drop-down menu, allowing you to choose another section of the application: Choose the appropriate section and the newly selected section will now display at the top. Some sections also have available subsections. In this case, we are in the Balanced Scorecards section and viewing the Navigation subsection. You can choose a different subsection in the same manner. There is a lot of data that will be period specific in QuickScore. To change the calendar period, simply click on the date and the calendar selector will appear: 3
4 Icons: This is a list of the icons that you will find throughout QuickScore and what they represent: Administration Section PDF Archive My Bookmarks Section Briefing Book Section Calendar Empty Notes Populated Notes Copy Cut Delete Documentation Section Edit Erase Error Excel External Link Strategy Map Section Group Help History New Task Locked Log Out Order Down Order Up Organization Unpopulated Organization Outlook Paste Strategy Map Strategy Map Section Last Period Next Period Picture PowerPoint Print Promote Rename Reports Section Report Balanced Scorecards Section Send To Sort Down Sort Up Un-archive Go up one level User Warning Word Weight Linked Object Performance Measure Objective Perspective Balanced Scorecard Task Strategic Initiative Milestone Red Perf Meas. Ind 4

5 My Bookmarks Section This is the default section in which the application opens. You can also return to this section at any time by clicking on the section. Any time you wish to log out of the application, you can either click on the icon in the upper middle part of your screen or click on to the left of the key icon. 5
6 Administrator Message: Within this section you can add messages in the right-hand pane under Administrator Message by clicking on if you have the appropriate privileges. When you do so, you will see the text editor activate: Just enter the appropriate information and formatting, and then click Save. 6


7 Briefing Pane: This is where your bookmarks are saved. They are easily accessible as soon as you log in to the application. Simply click on the one that you would like to see, and it will be displayed in the briefing pane to the right. You can also right-click to create new bookmarks or folders: If you would like to reorder the items, simply left-click and hold the object you would like to move and then drag it to another location in the bookmarks tree. Let go and you have successfully moved the object. 7


8 Commonly Used Functions: These shortcuts are provided on your home bookmark link to allow you easy access to the most commonly used functions inside the application: Just click the expand icon to the left of the function to view its contents: You can check on the tasks you have been assigned from My Tasks. You may also monitor performance measures you own by clicking the expand icon associated with Performance Measures I Own. Additionally, you may update or import specific performance measures you are associated with by clicking on Performance Measures I Update. You may also change your password by clicking My Settings. Finally, the image in the center of the briefing pane may be changed to any picture you want, as described in the Administration section of this guide. 8
9 The Administration Section 9


10 Calendars: Standard Calendars: You are able to create weekly, monthly and annual calendars. The application automatically creates the periods, depending on which frequency you choose, by the wizard. To set up a standard calendar, click on the on the link. You will see this screen: section, and then click To add a calendar, click on the button. You can then select either Standard Calendar or Custom Calendar. (You may add both standard calendars and custom calendars to the application.) 10

11 If you choose Standard Calendar and click Next, you then choose from any of the standard calendar options below: Weekly Monthly Quarterly Yearly US Government Fiscal Quarterly US Government Fiscal Yearly If Monthly is selected, you will see that it has been added to the list of existing calendars: You can also edit the name of the calendar by clicking on the edit button. 11

12 Custom Calendars: In this section, you can create your own calendar frequencies, including any fiscal accounting calendar. You can create quarterly, semi-annual, or any frequency you like. (You may also have as many as you like.) Once created, simply changing to any one of these calendars within the application causes the scores, targets, red flags, and actual values to be summarized for the new frequency. By choosing Custom Calendar instead of Standard Calendar you will be presented with a dialog box where you can give a name to your calendar: Once you have created your Custom Calendar, simply click on the name of the newly created calendar and then you may apply the custom periods as you wish. This is done by clicking on the button in the right-hand pane. 12


13 Upon clicking the New Calendar Period button, you will see the following dialog box where you are required to enter an alias, start, and end date for that period. For example, if you chose to report over a period of 2 weeks, you would add the following: Click OK, and this is what you will see: At any time, you can delete any of the calendars and their periods by clicking the corresponding. Upon clicking next to your calendar name, you will receive this warning message: 13

14 Upon clicking next to the period s data, you will receive this warning: **It is recommended that you create all calendars before adding underlying performance measure data, so as not to lose any data should you choose to delete a calendar.** 14

15 Images: First, click on the link under the section. Use the button to search your local environment for your image. Once the image is located and the path is detailed in the upload box, click the button. You will then see the image link appear in the same dialog box with a next to it. Use this to delete the image. Click on the image name link to see a preview of the image. The image will open in another dialog box. 15

16 Adding Users: Under the Administration section, click on the Users link: You will then see the following in the right-hand pane: Once you have added Users to your database, the right-hand pane will look like this: 16
17 To add a User, click on the button and fill out the form: **To allow for further security, passwords will be hashed upon clicking OK. If a User clicks on another User s name in the Users section, they will see 11 dots in the password section even if the password only has 5 letters and/or numbers.** You may select the check box next to User must change password on login. This will force a password change when the user first logs into the application. You may also choose to leave this unchecked. After the information is entered and you click OK, you will see your User in the list. 17
.")
18 Adding Groups: Under the Administration section, click on the Groups link: You will see the following in the right-hand pane: To add a new Group, click on the button under the specific Group category (i.e., Power Users, Communication Users and Viewers). Each of these categories has specific permissions associated with them that are also configurable by way of a checkbox selection, as you can see in the following examples. Please Note: Current licensing offers only two tiers, Power Users and Communication Users. Power Users I and Power Users II licenses are for our legacy customers who previously purchased these types of licenses. We no longer offer Power User II licenses. 18


19 Power Users have full access to the software. Under the Power Users category, you may select the following permission options: 19
20 Communication Users have even fewer available rights. Communication Users can update information but are not allowed to create structure such as scorecards, Dashboards and Briefing Books. 20
21 And Viewers have the least amount of options. Viewers can only view information within the software. 21
22 The next thing you should do is add the Users that you have created to the specific Groups. Simply click on the icon next to the desired Group and you will see the following dialog box: OR 22

23 View Organization Permissions: Click on View Organization Permissions in the Administration section: This is what will show up in the right-hand pane of your screen: Select the Group that you wish to add permissions for in the drop-down menu: 23

24 Once you ve chosen the Group, you will have a list of organizations in the right-hand pane with checkboxes: By clicking on a checkbox in the View column, you will enable all members of the selected Group to use whatever permissions you have assigned that Group previously in the Groups section in this organization. If you click Cascade next to an organization, you will give the same permissions to that organization and all children of that organization. In the example above, if you click Cascade for Balanced Scorecard Institute, you are giving permissions to that Group for all of the organizations, because Balanced Scorecard Institute is the parent organization for all of the others. You can then continue the process for the remainder of the Groups that you have created. Once you have checked the appropriate boxes, click Save. 24

25 Owners and Updaters: To assign Owners and Updaters for your Balanced Scorecards, click the Owners and Updaters link under the Administration section: You will now see your organization structure in the left-hand pane: Once you select the organization you will be working with, one of two screens will appear in the right-hand pane. 25
26 Choose a name from the drop-down list and you will see: To assign a User as an Owner of an object within your organization, simply click on the checkboxes of the individual hierarchy objects, and then click Save. This User will now become the Owner of the specified object. Repeat this as necessary for the rest of the Users or hierarchies. 26
27 To assign a User as an Updater, simply follow the same steps, but this time choose Updater instead of Owner in the drop-down list. When assigning an Updater, you are able to check another set of boxes. You can allow an Updater to update either the performance measure values or both the performance measure values and the scoring thresholds: 27

28 Application Administration: To access this area of the application, click on the section, and then click on the link. You will see this screen: 28
.")
29 Appearance Images: Within the Application Administration link, you can use the application images tool. This tool allows you to upload your own images to switch in and out of the default images found in the My Bookmarks (Main Image). You also have the ability to set the default background image for Strategy Maps. **You must upload an image to the application before you can select it for use.** Simply choose the image in the drop-down list and click Save. We covered how to upload images to the application in the Images section of this manual. **Selecting a default Strategy Map background will only apply to future maps; the background image for existing maps will not change.** You may select Yes or No for Show charts and gauges with shading, shine and rounded corners. If Yes, it will show objects with more definition 29

30 Notification: QuickScore allows you to send automated s when a performance measure is red, but doesn t have an associated task. Yes turns the notification on and No will turn it off. You can configure the QuickScore application to send out notification s to the owner of a performance measure when it turns red. The Performance Measure Update Reminder allows the application to the updater of a performance measure before or after a period ends. The last option enables QuickScore to the owner of a linked object when the source of that linked object is changed. 30

31 Reports: Select YTD Calendar: Offers a drop-down menu where you can choose which calendar view your YTD values appear in. **You must create a calendar(s) in order to choose a calendar view.** Number of Calendar Periods to Display for Performance Measures Tab: Choosing a number here will set the default number of calendar periods that will display on the Performance Measures subsection. This number can also be manually changed when viewing the Performance Measures Report. Enable Performance Measure Scores Analysis: If you select Yes, the Performance Measure Scores Report will be available in the Analysis subsection. Enable Objective Scores Analysis: If you select Yes, the Objective Scores Report will be available in the Analysis subsection. Display Performance Measure Comparison Report: If you select Yes, the Performance Measure Comparison Report will be available in the Reports section. 31

32 Scoring: Scores Visible: This option allows you to display the computer-generated scores throughout the application or disable them. Ignore gray scorecard objects for color roll-up: This option allows QuickScore to disregard all gray objects when determining roll ups. Non-Performance Measure Colors: This option defines how many and which colors will be used for non-performance measure objects. Enable Forward Effect Scoring: This option determines whether or not QuickScore aggregates scoring forward for smaller than native calendar periods. 32

33 Data Format: Date Format: This option sets the configuration for dates inside the application. Date and Time Format: This option sets the configuration for the order of times and dates. Default Performance Measure Precision: This determines the number of decimal places that are displayed for performance measure values. Default Currency Precision: This determines the number of decimal places that are displayed for currency values. Enable Decimal Precision Editing: This allows editing the decimal precision for each performance measure. Default Currency Unit: This lets you set the default currency unit for performance measures. Display format for users names: This lets you set the format for displaying the Users names. Sort order for users names: This lets you set the sort order for Users names. User Titles: This lets you define custom titles for Users. Metric Units: This option allows you to select metric units such as Kilograms, Miles or Hours Allowed Tags: Allows you to add tags to objects in the application. Leave blank to allow any tags or enter specific tags that are only to be allowed. 33
34 General Settings: Default Strategy Map Drilldown: Choose the appropriate location that you wish to be the default for drilling down from Strategy Maps. This selection can always be manually overridden when creating or editing your Strategy Map. Display Trend Indicators on Strategy Maps: This option allows you to view trends in your performance measures scores; you can view them at the Strategy Maps section. The arrows will point down if the score this period is lower than last period, up if it is higher, and sideways if it is the same. The color of the arrow is the color that the score was at the end of the last period. Enable Performance Measure Drilldown on Performance Measure Subtab: This will allow you to enable hyperlinks on the Performance Measure subsection, allowing for drilldown functionality. Default Balanced Scorecard Page: This page allows you to define the default subsection that will appear the first time you view the Balanced Scorecard section each time you log in to the application. Display Add to Calendar Links: If set to Yes, the Add to Calendar link will appear in the appropriate dated areas. If set to No, this option will not appear. Display Linked Objects in Balanced Scorecard tree: If set to Yes, the application will display any Linked Objects in the navigation tree. If set to No, these objects will not appear. Display Executive View Subsection: This option allows you to either display or disable the Executive View subsection depending on your organization s needs. 34
35 Display Speedometers: This option allows you to either display speedometers or disable them in the Overview subsection. If you choose No, a square colored box will appear instead. Always Show Red on the Left for Speedometers and Gauges: Red will appear on the left if Yes is selected and on the right if No is selected. Display IDs: Choosing Yes here will display object IDs throughout the application, and choosing No will hide them. Restrict editing of Import Mapping Key to Application Administrators only: This disables editing the import mapping key field when creating or editing a performance measure to avoid confusion for Users. The Application Administrator will still be able to edit the field. Allow users Send to option: This toggles the send to feature found in the send page to button menus. Enforce Strong Passwords (numbers and letters): If set to Yes, you will be required to use at least two numbers and two letters when you create your login password. Changes before a password can be reused: Set number of password changes before a previous password may be reused. Force user to change passwords every number of days: Enter the number of days when a user will be asked to change their password. Leave blank if you do not require users to change passwords. Compress HTML Output: If set to Yes, this will improve the speed that the Balanced Scorecards/Performance Measures Reports and the Strategic Initiatives/Tasks are sent over the Internet. Show Red Performance Measures Indicator for Scores Less Than (leave blank for no indicators): Here you can enter a value to show red performance measure indicator for scores less than or leave it blank for no indicators. Require note when updating metrics that have a score less than: You can require the owner/updater to enter a note when a metric s score falls below a specific score. Leave blank if you do not require notes. 35
36 Import/Export: This option allows you to force performance measure values in to the last day of the period for the purpose of simplifying import processes. 36

37 Server Administration: To configure your server settings, click the link in the section. Here, you can change the admin password for the login, edit the admin , configure the port communication, configure the server settings, and set the logging level. 37

38 Database Connections: Click on the button in the section and you will see: Here, you can create, edit, remove, delete, and prioritize database connections. 38

39 License Management: Click on in the section to add or manage your license files. The following screen illustrates the functionality: 39

40 Current User Activity: Click on the link in the section to view the current Users who have logged in to the application. Your screen should look like this: **This screen will auto-refresh so that you are always looking at updated information.** 40
41 View Log Files: Click on the the following report: link to view the log files for the application, and you will see You can choose to view this in HTML or.txt view. 41
42 Background Process Status: Click on the processes running the application: link to see a summary of the background 42


43 Import Data: Click on the link to import your data into the application: Other than updating each of these menu items individually within the application, you can also create an entire report that may be uploaded into the application. Click on the expand/collapse icon to the left of each entity; you will notice that each one has an example report associated with it: You can use these sample reports to aid you in setting up your Import File. **Be sure to save the file as a CSV file.** 43
44 Tree Fixer: The Tree Fixer allows the administrator to fix any corrupt structure trees in the application. Any tree manipulation will be suspended while this action is being performed. Make sure that you check any modified trees after running this to reorganize any necessary parts. 44
45 SQL Console: The SQL Console is a built-in query tool that enables you to query the database by using simple or complex SQL statements. To access the SQL Console, click on the link in the section: You can see the SQL query box on the right-hand side of the screen; simply type in a SQL query and click Submit. 45

46 You also have the ability to export the results: 46


47 The Briefing Books Section This is the section where you can store all of your Briefing Books. Briefing books are a collection of slides that you can pull from different parts of the application to create one or more sets of screens for the purposes of demonstrating information found in QuickScore. The first thing you will have to do is create a Briefing Book. When choosing an organization that doesn t yet have a Briefing Book, this is the first screen you will see when choosing the section: 47

48 Click on the button to create a new Briefing Book. Give it a name: This will be the result: 48
49 You can now navigate throughout the application and, using the Send To button and choosing Briefing Book, add as many slides to your Briefing Book as you like. This is what the wizard looks like for sending page to Briefing Book: 49

50 Once you have created all your slides, you can view your Briefing Book in full screen by sending page to full screen. First, navigate to the Briefing Book you would like to view, and send the page to full screen. Then, you will see the slide show functionality available at the bottom of the new screen. You can click left or right to view the next slide or jump to any available slide: 50

51 This is the result: In this full screen view, look to the bottom of the screen for the controls to move between slides. 51

52 The Balanced Scorecard Section This is the section in which most of the data in the application can be found. You can also return to this section at any time by clicking on the section. 52

53 Building the Organizations: If you have not defined any organizations when you navigate to the Balanced Scorecard section, you will see: You can then click on the link Create Root Organization: When you first click on the link, you will see a dialog box prompting you to enter the name of the highest-level unit in your organization: Enter the name of the highest-level unit of your organization, and you will see the beginning of your organization: 53

54 Once you have created the highest-level unit, you can right-click on the name and see the following choices: By clicking on the New Organization link, you can add organization units directly under the unit you have clicked. A dialog box will appear, prompting you to give a name to your new organization. You can add as many levels as you need to represent your organization structure: 54

55 Once you have created your organization hierarchy, you now have more options when you click on an organization unit: New Organization: adds an organization unit directly under the current choice Promote To Top Level: moves the organization to the top-level organization Cut: enables you to cut an organization to be moved somewhere else Paste: lets you paste a cut organization in another spot Edit: allows you to edit the name of the unit Delete: allows you to delete the unit and all Balanced Scorecards attached to that unit **In order to change the order or structure of your organization, you can use the dragand-drop feature. Simply click and drag the organization to where you would like it to go.** 55

56 As soon as you click on the Balanced Scorecard section, the application will ask you to choose which organization you would like to see. Choose the appropriate organization. 56
57 Building Balanced Scorecards: The Balanced Scorecards section will allow you to build a Balanced Scorecard structure for each organization unit. Click on the Balanced Scorecards section: Choose the appropriate organization. You can now create your new Balanced Scorecard. Click on New Balanced Scorecard: A dialog box will appear. Name is required. Description can be entered if applicable: 57

58 Once you have created the root of the Balanced Scorecard, you will see this: Right-click on the Balanced Scorecard and you will get a menu with several options: 58
59 New Perspective: creates an object under whatever you clicked. Name and Object Type are required and Description is optional. Under the Advanced menu you can specify when your Key Performance areas will start and end within your scorecard. This allows the scorecard structure to change over time. Adding Tags will assist in searching for information. You also have the option of assigning Owners if they are applicable: New Objective: creates a new object in the same fashion as New Perspective. The same rules apply: 59
60 New Theme: Same again with the same rules: 60
61 New Performance Measure: When you start adding performance measures, the first menu you will see is: Name: Enter the name of your performance measure. Calendar: Choose the frequency for the performance measure based on the calendars you have defined. You will then be asked how to score the performance measure: In QuickScore, we offer 10 different scoring options: Yes/No: something is done or it isn't: This type of scoring is ideal for performance measures that either are or aren t done. For example, did you or didn t you finish you project on time. It can also work for performance measures where the desired outcome is negative: Did any employees quit this month? 61

62 2 Color: between worst and goal is red and between goal and best is green This type of scoring is ideal for situations where you want to give a more continuous range of scores. For example, when tracking revenue, gradations are important because it is crucial to see just how close you are getting to your revenue goal. 2 Color Goal Only: red if you are under goal, green if you are above This type of scoring is not used as often as the 2 Color option above, likely because it does not offer the ability to see a continuous range of scores. 62

63 3 Color: stoplight coloring where you specify where the absolute worst and best value is This scoring option allows you to specify where the best and worst value is, like in the 2 Color option, but it allows for even more gradations because of the yellow band. Note that the Red Flag value is the point at which yellow changes to red. Goal/Red Flag: stoplight where you have red below a least acceptable value, yellow between that value and goal with green at goal and above This is the scoring type most often recommended to QuickScore users. This type of scoring only requires that you specify Goal and Red Flag. The system creates the best and the worst automatically in such a way that all three fields are the same size. 63
64 4 Color (Red-Orange-Yellow-Green): like stoplight except you include a wider range from worst to best This scoring option is similar to the 3 Color type, but with the addition of the orange field to show when you want an additional warning that orange will soon turn to red. 4 Color (Red-Yellow-Green-Blue): like stoplight except blue is where things are TOO good and no more effort should be expended This scoring option is similar to the previous 4 Color type, but instead of orange nearing red, you ve denoted the point at which things are, perhaps, too good and you might want to focus less effort there. 64

65 Stabilize (Red-Green-Red): for performance measures like inventory where too much is bad and too little is also bad This type of scoring is useful for when you want to have exactly a certain value. For example, a warehouse might need to have exactly a certain amount of items on its shelves. Too much and too little would both cause problems. In this type of scenario, the best score is dead center while one end of the speedometer is Low Worst and the other end is High Worst. Stabilize (Red-Yellow-Green-Yellow-Red): for performance measures where there is some flexibility about what is too much and too little This is similar to the previous type of scoring, but allows for more gradations. 65
, but you do score your profits.")
66 Unscored: This type of scoring is useful for when you have data you want to report on, but don t have a target. For example, perhaps you don t want to set targets for revenue or expenses (both unscored), but you do score your profits. Then, using the Unscored option for revenue and expenses won t affect the roll up of the objects higher in the tree. 66
67 The next dialog box will ask you to make a few more decisions: Data Type: Standard means a real number. Percentage and Currency are self-explanatory. Aggregation Type: Select from sum, average, or last value. This selection determines how values are aggregated for calendar periods that span lengths of time that are larger than this performance measure s native calendar period. Import Mapping Key: Enter a user defined "key" for use with CSV imports. Decimal Precision: Enter the number of decimal places to display for this individual performance measure. If you leave this blank, the application will apply whatever the default has been set for. Update Type: Select Manual or Calculated. If you choose Manual for Red Flag and Goal, you must also add a Default Value. Calculated allows you to create performance measures whose values are calculated based on performance measures elsewhere in the hierarchy. 67

68 If you select Calculated, you will see the following dialog box: This screenshot shows sample equations for Actual Value, Red Flag, and Goal. To create the Actual Value equation shown above, first, select the organization you want on the left side of the screen. Then, select a performance measure from the right side. Click Add. Then click, choose your next performance measure and click Add. You can select as many performance measure s as you want in the same manner. Make sure that you have selected Actual Value and Current Period in the drop down menus at the bottom of the dialog box. Click Finished when you are done. To create the Red Flag equation shown above, first convert your value into a decimal. In this case we changed 90% into.9, and then click. Then select (i.e., the one you are currently editing) from the top of the right-hand column. Instead of Current Period in the drop down menu at the bottom of the dialog box, select 12 Periods Earlier. Your equation will be.9*m(-12p). To create the Goal equation shown above, again convert your value into a decimal. In this case we changed 125% to 1.25, and then click. Then select (i.e., the one you are currently editing) from the top of the 68
69 right-hand column. Instead of Current Period in the drop down menu at the bottom of the dialog box, select 12 Periods Earlier. Your equation will be 1.25*M(-12p). Aside from the default functions to choose from while creating an equation in the Calculated Performance Measure dialog box, you may also use functions from the following charts in your equations: Trigonometric Functions Log and Exponential Functions 69
70 Statistical Functions Rounding Functions Miscellaneous Functions 70

71 When calculating Sum and Average of a series of performance measures, make sure to use the appropriate function. By using the function itself, you will ensure that any performance measure marked N/A or with a null value is not calculated in the equation even if it is included in the equation itself. NOTE: An N/A designation is useful because it means that that value does not factor into the score for its parent object for that period. Remember, to denote a performance measure as N/A, go to Balanced Scorecards / Overview and click on the performance measure. Your screen should look something like this: 71

72 For Actual and Threshold Values, select and you will see the following dialog box. To make the performance measure N/A, select No in the dropdown menu for Include performance measure in this period s calculations. However, if you have the appropriate permission, you can make this selection for all performance measures. Simply select from the upper left corner of your screen. Then select. In the section on scoring, make sure that you have selected Yes for Ignore gray scorecard objects for color roll-up. If you select Yes here, note that the option to denote an individual performance measure N/A as in the Update Performance Measure dialog box above will no longer appear. 72
73 Also, the following chart denotes the operational symbols to use within QuickScore: Click Finished or you can go ahead and Add Owners and Updaters as well. 73
74 New Linked Object: This allows you to create a virtual link in your Balanced Scorecard structure that references another object in the system. You should choose the appropriate source object and decide whether or not you want to use the same name as that object. 74

75 As you build your Balanced Scorecard, you will begin to see it take shape: 75
, you will notice that the information on the right-hand pane (content pane) will change to reflect your changes.")
76 Navigation Subsection: This subsection is an auto-generated, color-enhanced display of the parts of your Balanced Scorecard: As you click and expand your Balanced Scorecard in the left-hand pane (navigation pane), you will notice that the information on the right-hand pane (content pane) will change to reflect your changes. This information is all dependant on the calendar period that you have chosen to view it in. To see what calendar period you are currently viewing, look for the date at the top left of your screen: To change the date period, simply click on the current date and this will pop up: Choose the calendar and period you would like to see and click Go. The date will change on the top right. Likewise, the data you will now be seeing will reflect the new calendar and period. 76


77 To identify the colors and what they mean: Exceeds Goals No Data Met Goals Warning Poor Needs Attention 77


78 Executive View Subsection: This is another auto-generated display of the information for your Balanced Scorecard: In this view, you can see the entire scorecard structure. To add this as a bookmark to your My Bookmarks section, click on the button near the top of the content pane. Then choose My Bookmarks from the drop-down list: 78

79 Give your new bookmark a name and then click OK. You have now added the new bookmark to your My Bookmark section. There are a number of icons displayed on this subsection, and clicking on the link in the top right of the content frame will display their meanings: In addition to using the navigation pane, you can also expand and contract the +/- icons in the content frame to see more or less information. Clicking on any of the icons on the right will display expanded information about that scorecard object. 79

80 Overview Subsection: This is where the most detailed information for your Balanced Scorecard will be displayed: 80


81 You can use the navigation pane on the left to drill-down to specific scorecard objects. To print valuable information, click on the drop-down list. button, then choose Printer from the Once you have drilled-down to the performance measure level, you will find even more options and information: 81


82 If you have the permissions to do so, you can Modify Owners, Updaters, or even Update Performance Measures from this screen by clicking on their respective buttons. To edit notes, you can click on, and it will bring up the text editor for you to use. To export the information out of QuickScore into an external application, click on the button near the top of the page. You will then choose where to export to from the drop-down menu: Choose the application you would like to export to and then either choose Open or Save in the next dialog box: 82

83 You will also notice that all of the sections of the Overview subsection are collapsible for your usability. You can click on the name of the section or the small triangle next to it to open or close those sections of the display pane: The Historical Performance part of the overview subsection also has its own special set of features. You can change the amount of time displayed in the chart. Use the slider to set the amount of time displayed: 83

84 You can also modify the data displayed on the chart itself. Click on the to bring up the chart builder: button Here you can add series, change the axis, as well as a number of other configurations. All changes are made real-time and you can see the new chart as you work. For further information and instructions on chart building, refer to the Reports section of this guide. Click the button to save your changes or click the link at the top of the page to go back to the Overview subsection. 84

85 Performance Measures Subsection: The Performance Measures Report allows you to view information, in a Balanced Scorecard view, associated with any one of the chosen perspectives as well as individual performance measures. Click to change the number of calendar periods to display or change the data you want to view in your report. 85

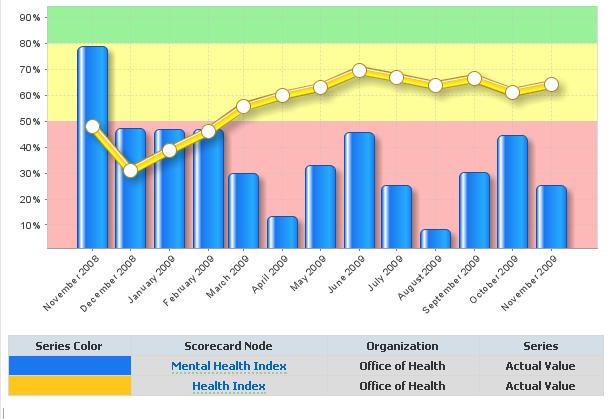
86 Analysis Subsection: The Analysis subsection contains a variety of graphical representations of your data. Clicking on any of these icons will produce a different type of analysis graph. Also, these results will dynamically change to match whichever object you select from the Balanced Scorecard structure on the Navigation pane. 86

87 Tasks Subsection: The Tasks subsection will display any overdue, ongoing, or completed tasks that have been associated with the scorecard object that is displayed. There are two toggled views here: Show by Status and Show as One List. The view you choose will determine how the data are displayed. If it has been enabled in the Application Configuration part of the Administration section, you will see the ability to Add to Calendar. By clicking on the link, you can add this date to your desktop calendar. Below is the first screen that appears after clicking the button. Choose to open the file: Now you can use all of the available tools from your default calendar application to save the appointment. **Disclaimer The screen shot below is of a popular calendar software and its use in this guide is in no way promoting the purchase or use of such software and is in no way connected to Spider Strategies, Inc.** 87
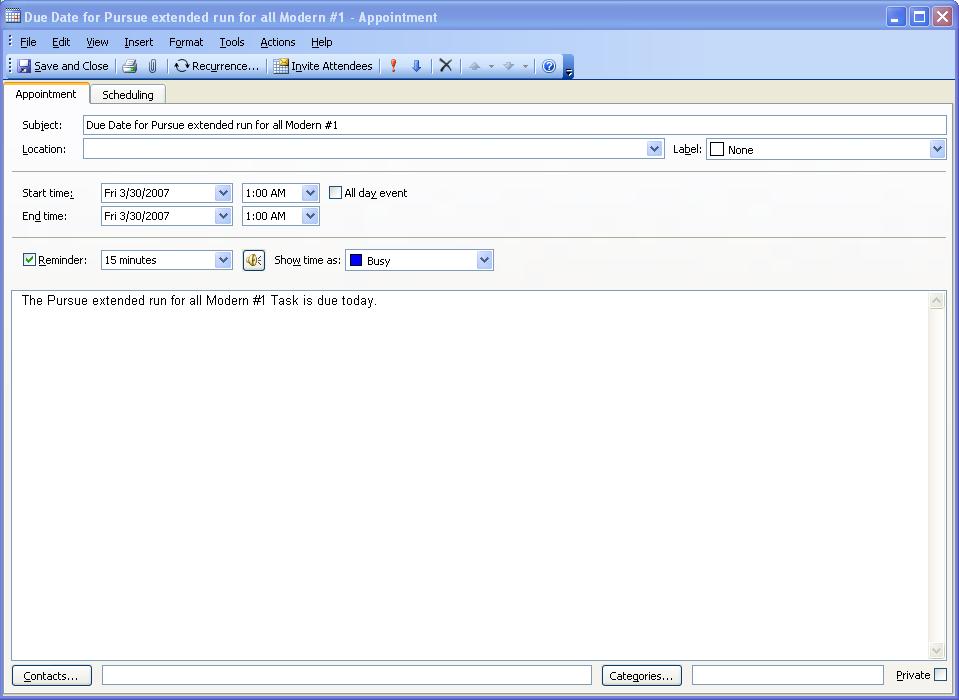
88 88

89 Related Items Subsection: On the Related Items subsection, you can link your scorecard object to other scorecard objects, Strategy Maps, Strategic Initiatives, Documents, or External Web addresses. Simply click the corresponding button and then follow the on-screen instructions to select the object you are linking it to. 89

90 The Strategy Maps Section 90
91 This section is where you can view your custom Strategy Maps. You can also return to this section at any time by clicking on the section. The above illustration is an example of a Strategy Map with the trend indicators turned on. The Strategy Map will automatically be populated with color based on the calendar period that you have chosen in the top right. Clicking on any of the scorecard objects will take you to the appropriate drill-down target identified in the application configuration part of the application. As soon as you click on the Strategy Map section, the application will ask you to choose which organization you would like to see. Choose the appropriate organization. 91

92 Building Strategy Maps: Click on the New Strategy Map button on the left: Once you do that, you will be prompted to give your Strategy Map a name: Once you give your Strategy Map a name, the new map/chart applet will open automatically. Make sure that your pop-up blocker is not turned on. If there is a Balanced Scorecard associated with that organization, then that Balanced Scorecard tree will appear under the organization on the left: 92


93 If the Balanced Scorecard tree is empty or if you want to create a map from objects in different Balanced Scorecards, click on the button in the most upper left-hand corner of the application to open the Organization tree. Once you have opened the Organization tree, you can click on any object and select the Balanced Scorecard objects associated with that object: You can now drag and drop any element in the Balanced Scorecard tree onto the Strategy Map: 93

94 At this point, you are ready to create your Strategy Map. Following is a listing of the tools on the Strategy Map toolbar and each of their respective actions: Right click on an element and you will see a menu of further options: These options allow you to adjust the font size and the shape of the element, edit the label, change the way background colors appear, manually select a drill-down target, or remove the selected element. More options: This button saves the Strategy Map. This button turns on the select cursor. This button turns on the draw arrow cursor. This button will undo the last action. You may undo as many actions as have been completed up until the point at which you d started to undo them. This button will redo the last action that was undone. This button will delete the selected element. This button will zoom to normal view. This button will zoom in to enlarge the size of the full image. This button will zoom out to reduce the size of the full image. You are now ready to create your maps and connect the objects with cause and effect arrow indicators. To do so, click the draw arrow button; now click on the element that you want the arrow to come from and drag it to the element that you want the arrow to go to. When you release, your map will have an arrow connecting the two performance measures together. 94

95 The other feature the Strategy Map edit applet holds is the ability to set a background image for your charts. Uploading, saving, previewing, and switching in and out images is covered in the Images section as well as the Application Administration section of the User Manual. To add images to your map, simply select the image from the drop-down list: Click the Save button in the top left-hand corner before closing the applet. Once you have created a Strategy Map, you have the option to edit or delete it at any time. Just go to the Strategy Map section and right-click the Strategy Map that you would like to edit and you will see these options as well as the ability to drag and drop to reorder: 95


96 The Strategic Initiatives Section This section is where your custom Strategic Initiatives can be viewed. You can also return to this section at any time by clicking on the section. As soon as you click on the Strategic Initiatives section, the application will ask you to choose which organization you would like to see. Choose the appropriate organization. 96

97 Gantt Chart Subsection: This is the first section that will be displayed when you choose the Strategic Initiatives section. By default, the All Strategic Initiatives option will display as a Gantt chart. This will display all the Strategic Initiatives, Tasks, and Milestones that have been created for this organization. You can also add Strategic Initiatives, Tasks, and Milestones from this subsection. Rightclick on the parent object of the object that you would like to create and you will see this menu: New Strategic Initiative: Title and Type are the only required fields. 97

98 In order to enter dates for the Start, Due, and Completion date fields, click on the appropriate box. This will bring up the calendar dialog box. Click on a date in the calendar and this will populate the appropriate field: New Task: Title and Type are the only required fields. New Milestone: Title and Type are the only required fields. 98

99 Overview Subsection: From the Overview subsection, you have much more detailed information displayed as well as the ability to create, and/or modify Strategic Initiatives, Tasks, or Milestones. You can create these objects in the same way described in the Gantt chart section: by right-clicking the object and using the drop-down menu. Or you can navigate using the tree navigation on the left and clicking on the button. You can also modify assigned Users or Groups by clicking on their respective buttons. 99

100 The Documents Section This section is where your uploaded documents can be viewed. You can also return to this section at any time by clicking on the section. As soon as you click on the Documents section, the application will ask you to choose which organization you would like to see. Choose the appropriate organization. 100


101 Click on the button to upload a new document into the application. A dialog box will pop up that looks like this: Click on the button to locate the file on your local environment. Give it a description and then click the button. You can then click on your document on the left navigation pane. You should see this in the content pane: Here you have the option to rename, delete or revise the document. To rename the document, click on the button. To delete the document from the database, click on the button. To revise the file, simply upload a newer version of the file in the New Revision section. 101

102 The Reports Section This section is where you can create/view reports in the application. You can also return to this section at any time by clicking on the section. There are eight out-of-the-box reports available for you to choose from: Scorecard Object Owner/Updater Report, Annual Performance Measure Data Report, Balanced Scorecard Structure Report, Red Performance Measures Report, Gray Performance Measures Report, Performance Measure Update Frequency Report, Performance Measure Comparison Report, and the Strategic Initiatives Report. There is also a Report Writer that allows you to create and save your own custom report options and a Chart Writer that allows you to create and save your own custom charts. You can find all of these reports by clicking on the button. You will then see: 102


103 Scorecard Object Owner/Updater Report: This report will allow you to create and view Owners and/or Updaters associated with Users, Organizations, and Balanced Scorecards that you select. Annual Performance Measure Data Report: This report allows you to create and view annual performance measure data based on the selections that you search: 103
104 Balanced Scorecard Structure Report: This allows you to view a report outlining the structure of a Balanced Scorecard. 104
105 Red Performance Measure Report: This allows you to view a report displaying the performance measure with red scores for a specific time period. 105
106 Gray Performance Measure Report: This allows you to view a report displaying the performance measure with gray scores for a specific time period. 106
107 Performance Measure Update Frequency Report: This allows you to view a report displaying the performance measures and their update frequency. 107
108 Performance Measure Comparison Report: This allows you to view a report displaying the performance measures from two or more similar Balanced Scorecards from different organizations side by side. 108
109 Strategic Initiatives Report: This allows you to view a report displaying Strategic Initiatives, Actions or Tasks based on a specific set of parameters. 109
110 Report Writer: This feature allows you to create your own custom reporting. You can select as many or as few filters as you wish and then decide what columns you want to be displayed on the report. 110

111 Start by expanding the first step and then clicking on the the page. You will see the following: button at the top of Name: Allows you to filter based on the physical name of the object. You can choose contains any of the terms, contains all of the terms, begins with, or ends with. Description: Allows you to filter based on the description of the object. You can choose contains any of the terms, contains all of the terms, begins with, or ends with. Scorecard Object Type: Allows you to filter based on the object type. You can choose scorecard root, perspective, and performance measure, generic, objective, or linked. You can also have multiple choices selected here. Descendant Of: Allows you to choose any set of objects that are subordinate to a particular object. Color: Allows you to filter by any of the four colors for any calendar and any series of periods. Weight: Allows you to filter based on the set weight of an object. You can choose a number to match, either greater than or less than a number, or between any two numbers. Owners: Allows you to filter and search through the owners based on matching any or all terms as well as begins with or ends with. Performance Trend: Allows you to filter on objects with scores that are either trending upwards or downwards for a set of periods. 111
112 Specific Scorecard Objects: Allows you to filter by choosing as many specific objects as you require. Score: Allows you to filter based on the score of an object. You can choose to match a number, either greater than or less than a number, or between two numbers for any set of calendar periods. Updater: Allows you to filter and search performance measures through updaters based on matching any or all terms as well as begins with or ends with. Performance Measure Frequency: Allows you to filter performance measures by one or more of the calendar periods that have been created in the application. Update Type: Allows you to filter by manual or calculated performance measures. Data Type: Allows you to filter by percentage, currency, or standard data types for performance measures. Aggregation Type: Allows you to filter performance measures by sum, average, or no aggregation. Import Mapping Key: Allows you to filter performance measures based on their uniquely assigned import mapping key. Value: Allows you to filter performance measures based on their specific values for any set of calendar periods. Scoring Type: Allows you to filter performance measures based on whether they are scored or unscored. 112

113 Click on the type of filter you would like to add to your custom report. 113
114 You can now click Finished, or add more filters in the same manner. Now use the drop-down menus and checkboxes to choose the columns to be displayed for your custom report. If you choose any period-specific data, you can also chart your data in the report. Click on the see your new custom report. button at the bottom of the page and you will now 114

115 If you add this report to your bookmarks by using the Send To feature, you can always click on it from the Bookmarks section and you will have saved a new custom report. You can also click on the button and you can save this report to be used by anyone with View privileges to this organization. Saved reports can also be organized just like the Bookmarks tree by creating folders and dragging and dropping for clarity and ease. 115

116 Chart Writer: This allows you to create and view your own custom charts using the data found in QuickScore. First, click the drop-down menu next to Line Chart. This will bring up a list of chart styles that are available. Chart Writer offers the following chart types: Line Chart; Bar Chart; Stacked Bar Chart; Stacked 100% Bar Chart; Stacked Area Chart; Pie Chart; Doughnut Chart; Polar Chart; Combination Chart. Let s start with a Line Chart and Graph One Time Period. Next, click the button to get started. You will then have the opportunity to choose a scorecard object: 116

117 After you have chosen an object, you will see the line chart: At the bottom of the screen are several drop-down menus. Use these menus to change chart type; compare more than one time period; select additional scorecard objects; and to select Actual Value, Score, Red Flag, or Goal. You can also change the chart from Left Axis to Right Axis and add a Trendline Over Time. You can change the color of your graph s objects. Additionally, you can change the time periods reflected in your chart to show monthly, quarterly, or yearly data and show calendar periods by date or relative to selected period. Finally, move the scroll bar at the bottom to show more or less time in your chart. 117

118 Here are just a few examples of different chart types, comparing different time periods. Bar Chart: Note that in the above example, 2008 and 2009 data are being compared. 118

119 Stacked 100% Bar Chart Note that in the above example 2008 and 2009 data are being compared. 119
120 Doughnut Chart: Note that in the above example, 2005 and 2008 data are being compared. Once you have finished creating your chart, you can save the chart or send it to your My Bookmarks section just like the Report Writer. 120
121 The Dashboard Section This is the section where you can create and store all of your Dashboards. Dashboards are similar to Strategy Maps, in that they allow you to show your data in QuickScore. However, unlike Strategy Maps, Dashboards allows you to enter text, charts, strategy map bubbles, gauges, and background images. 121


122 Creating Your Dashboard The first thing you will have to do is create a Dashboard. When choosing an organization that doesn t yet have a Dashboard, this is the first screen you will see when choosing the section: Click on the button to create a new Dashboard. Give it a name: This will be the result: 122

123 Editing Your Dashboard Right click on your Dashboard name and you will see the following options. Select Edit. Now you can begin creating your Dashboard. By clicking on the icons across the top row, you can add speedometers, charts, strategy map bubbles, text, images, linked content and a background image to your Dashboard. You will also see options to Arrange and Align. You can use Arrange if you are creating two or more items. Simply, select an item, click Arrange, and then choose one of the following: To Align multiple items, either select the items you want by drawing them into a box across your screen 123

124 or simply Control + Click to select them This method is particularly useful if you want to select certain objects, but not others as above. Then, click Align and select from the following options. 124
125 You can also move and resize items on your Dashboard by clicking on them. If you want to delete an item, simply select the icon. As you complete your Dashboard, select either or and you will be prompted to save your Dashboard. 125
126 Adding a Gauge Click on the speedometer icon. A dialogue box will open. Select your gauge type. Speedometer is selected in the screenshot below. Then choose the performance measure you want represented by your speedometer. Once you ve selected what you want reflected in your speedometer, your speedometer will appear on your screen. You will also see a second row of options. By default, Name will be selected. You can choose to add Name, Organization, Score, Actual Value, and Thresholds to your speedometer. 126


127 Your screen will look like this: You can also select from one of the other gauge types. Instead of speedometer, let s select a horizontal bullet or slider. Then, select the object you want reflected in your horizontal bullet or slider. 127

128 Once you ve selected what you want reflected in your horizontal bullet or slider, your horizontal bullet or slider will appear on your screen. You will also see a second row of options. Click on Label and select the labels that you want to add to your horizontal bullet or slider. Your screen will now look something like this: 128
129 The previous gauge is actually a horizontal slider. To change it into a horizontal bullet, simply select the object and click on Type. Select Bullet. To create a vertical slider or bullet, simply make your selection in the gauge dropdown menu and follow the same steps for adding Labels or switching Types. 129

130 Adding a Chart You can also add a chart to your Dashboard. Click the chart icon on top of your screen. To begin building your chart, select Chart Type. 130
131 Line Charts QuickScore offers many different types of charts. In this case, we ve selected a Line Chart and have chosen Graph One Time Range. The next step is to click Series Data. This is where you select the objects that you want reflected in your chart. You can select as many as you want. In this case, two objects have been selected. 131
132 Next, select Time Ranges. You can show monthly, quarterly, and yearly periods. You can display the data Relative to Selected Period, as above. In this case, move the slider to increase or decrease the number of periods displayed. You can also display the data By Date and move the slider to increase or decrease the months displayed. (Select quarterly or yearly to be able to move the slider to increase or decrease the quarters or years displayed.) Next, click on Threshold Background and make your selection. And finally, click Legend. 132

133 Your line chart will look something like this: 133

134 Bar Charts You can also add a Bar Chart to your Dashboard. Simply, click on the chart icon. Click Chart Type and select Bar Chart from the drop-down menu. Then choose either Graph One Time Range or Compare Time Ranges. Next, click on Series Data. Select the scorecard objects you want displayed in your Bar Chart. Remember, you can add as many objects as you like. 134


135 Here, two scorecard objects were selected. Next, select Time Ranges. 135

136 You can show monthly, quarterly, and yearly periods. You can display the data Relative to Selected Period, as above. In this case, move the slider to increase or decrease the number of periods displayed. You can also display the data By Date and move the slider to increase or decrease the months displayed. (Select quarterly or yearly to be able to move the slider to increase or decrease the quarters or years displayed.) Next, click on Threshold Background and make your selection. And finally, click Legend. Your Bar Chart will now look something like this: QuickScore allows you to create many other chart types as well. The process is always the same. 136

137 First click on the chart icon. Then, select chart type from the drop-down menu. Next, click on Series Data to choose the objects you want reflected in your chart. Select Time Ranges to determine the ranges of time you want shown in your chart. Pick your Threshold Background and then choose the type of information you want in the Legend. Here are some examples of other chart types. Stacked Bar Chart 137

138 Stacked 100% Bar Chart 138

139 Stacked Area Chart 139


140 Pie Chart* * Note that at the Series Data step, you can separate the sections of your pie chart. Simply, click Separate Section in the Series Data dialog box, below. 140

141 Your pie chart will then look like this: 141

142 Doughnut Chart 142

143 Polar Chart 143
144 Combination Chart 144


145 Adding Linked Content You can add linked content to your Dashboard. This includes scorecard notes, initiative notes and reports. Click on the linked content icon. Scorecard and Initiative Notes A drop-down list will appear for you to select your scorecard or initiative note to add to the Dashboard. Select Scorecard Notes and/or Initiative Notes and select your object that your note is associated with. A reply or new note can be created from the Dashboard once you select Finish and select OK to save. Then Select Reply or New Note. All modifications to the notes on the Dashboard will be updated in the scorecard. 145


146 Reports A drop-down list will appear for you to select your report to add to the Dashboard. Select Reports and select a report that has been created under Saved Reports. The following is a sample of what a report may look like in your Dashboard. 146

147 Adding an Image You can add an image to your Dashboard. Click on the image icon. A drop-down list of downloaded images will appear. 147

148 Select the image you want and it will appear in your Dashboard. 148
149 Adding Text Click the text box option to enter text on your Dashboard. Your screen will look like this: Begin typing your text in the text box. Use the tool bar for formatting options, including bold, italics, underline, and redline as well to arrange and align multiple text boxes, delete, align text, and undo/redo edits. Number and Bullet lists, indents and outdents, links, font color and size are all options to use with text boxes. 149


150 Adding a Background Image You can also select a background image by clicking the arrow selector next to Background Image. A drop-down menu will appear. Select the image you want. Your screen will look like this: 150
151 Adding Strategy Map Bubbles You can add Strategy Map bubbles to your Dashboard by clicking the arrow selector next to the Strategy Map bubble icon. Dashboard, Briefing Book, Scorecard, Action Plan, Document and Report Strategy Map bubbles can be added to your Dashboard. Choose which Strategy Map bubbles you want to see. Once you ve selected your Strategy Map bubble, it will appear on your screen in front of your background image. Continue selecting until you have added all the Strategy Map bubbles you want on your Dashboard. 151


152 Your screen will look something like this: QuickScore also gives you the options to change the shape of your Strategy Map bubbles, select the font size, select a drilldown target, choose a label, and change the fill. Simply make your selections with the options below. You can use the Send To feature to send your Dashboards to a variety of locations. Just click in the upper right of your screen and select one of the following options. 152
Scoreboard User Guide Table of Contents (Hyperlinked)
") Scoreboard User Guide Table of Contents (Hyperlinked) Getting Started Login Screen Navigating the Sections of Scoreboard Icons My Bookmarks Section Briefing Pane Commonly Used Functions The Briefing Books
Scoreboard User Guide Table of Contents (Hyperlinked) Getting Started Login Screen Navigating the Sections of Scoreboard Icons My Bookmarks Section Briefing Pane Commonly Used Functions The Briefing Books
Table of Contents (Hyperlinked)
") Version 2.5 User Guide Table of Contents (Hyperlinked) Getting Started Login Screen Navigating the Sections of QuickScore Icons My Bookmarks Section Briefing Pane Commonly Used Functions The Briefing Books
Version 2.5 User Guide Table of Contents (Hyperlinked) Getting Started Login Screen Navigating the Sections of QuickScore Icons My Bookmarks Section Briefing Pane Commonly Used Functions The Briefing Books
Logging In. Use the link in the headed Trial Access and Instructions to reach the login panel. It will be in the format:
 Logging In This guide will help you get started with the application. It does not cover all of the functionality. Go to the last page for information about additional help. Use the link in the e-mail headed
Hands-On Lab. Lab: Developing BI Applications. Lab version: Last updated: 2/23/2011
 Hands-On Lab Lab: Developing BI Applications Lab version: 1.0.0 Last updated: 2/23/2011 CONTENTS OVERVIEW... 3 EXERCISE 1: USING THE CHARTING WEB PARTS... 5 EXERCISE 2: PERFORMING ANALYSIS WITH EXCEL AND
Working with Analytical Objects. Version: 16.0
 Working with Analytical Objects Version: 16.0 Copyright 2017 Intellicus Technologies This document and its content is copyrighted material of Intellicus Technologies. The content may not be copied or derived
ScholarOne Manuscripts. COGNOS Reports User Guide
 ScholarOne Manuscripts COGNOS Reports User Guide 1-May-2018 Clarivate Analytics ScholarOne Manuscripts COGNOS Reports User Guide Page i TABLE OF CONTENTS USE GET HELP NOW & FAQS... 1 SYSTEM REQUIREMENTS...
New Finance Officer & Staff Training
 New Finance Officer & Staff Training Overview MUNIS includes many programs and tools to allow for the management of the District financials. As newer finance officers and staff, you are charged with understanding,
User Guide. Web Intelligence Rich Client. Business Objects 4.1
 User Guide Web Intelligence Rich Client Business Objects 4.1 2 P a g e Web Intelligence 4.1 User Guide Web Intelligence 4.1 User Guide Contents Getting Started in Web Intelligence 4.1... 5 Log into EDDIE...
CREATING AN AD HOC QUERY
 Ad Hoc Reporting AD HOC REPORTS are custom reports that you create on the fly so that you can view specific information that is important to you. An ad hoc report is created from a query, which means that
Customizing and Administering Project Server Access
 WEB Customizing and Administering Project Server Access In this chapter Creating and Deleting Users from Project Server 2 Managing User Groups Project Server User Security 4 Using Categories to Control
Lesson 1: Creating and formatting an Answers analysis
 Lesson 1: Creating and formatting an Answers analysis Answers is the ad-hoc query environment in the OBIEE suite. It is in Answers that you create and format analyses to help analyze business results.
How to use the Sales Based Availability Dashboard
 How to use the Sales Based Availability Dashboard Supplier Guide Sept 2017 v1 1 Contents What is Sales Based Availability and why is it important?... 3 How is Sales Based Availability calculated and how
RITIS Training Module 9 Script
 RITIS Training Module 9 Script Welcome to the Regional Integrated Information System or RITIS Module 09 CBT. To begin, select the start button or press Shift+N on your keyboard. This training module will
My Sysco Reporting Job Aid for CMU Customers. My Sysco Reporting. For CMU Customers (Serviced by Program Sales)
") My Sysco Reporting For CMU Customers (Serviced by Program Sales) 1 Accessing My Sysco Reporting... 2 Logging In... 2 The Reporting Dashboard... 3 My Sysco Reporting Process... 6 Generating a Report...
My Sysco Reporting For CMU Customers (Serviced by Program Sales) 1 Accessing My Sysco Reporting... 2 Logging In... 2 The Reporting Dashboard... 3 My Sysco Reporting Process... 6 Generating a Report...
User Guide. Version
 User Guide Version 0.19 2-11-2008 StormPro Max User Guide Page 1 of 69 5/10/2008 Table of Contents 1. Overview... 4 1.1 Definition of StormPro Max Terms... 4 2. Accessing StormPro Max... 5 3. Navigating
DOING MORE WITH EXCEL: MICROSOFT OFFICE 2013
 DOING MORE WITH EXCEL: MICROSOFT OFFICE 2013 GETTING STARTED PAGE 02 Prerequisites What You Will Learn MORE TASKS IN MICROSOFT EXCEL PAGE 03 Cutting, Copying, and Pasting Data Basic Formulas Filling Data
EDITING AN EXISTING REPORT
 Report Writing in NMU Cognos Administrative Reporting 1 This guide assumes that you have had basic report writing training for Cognos. It is simple guide for the new upgrade. Basic usage of report running
Project and Portfolio Management Center
 Project and Portfolio Management Center Software Version: 9.42 Getting Started Go to HELP CENTER ONLINE http://admhelp.microfocus.com/ppm/ Document Release Date: September 2017 Software Release Date: September
Admissions & Intro to Report Editing Participants Guide
 IBM Cognos Analytics Admissions & Intro to Report Editing Participants Guide Welcome to Cognos - Admissions and Introduction to Report Editing! Today s objectives include: Gain a Basic Understanding of
FIN 850: UDW+ Finance Ad Hoc Reports Training Version 2.9
 FIN 850: UDW+ Finance Ad Hoc Reports Training Version 2.9 Program Services Office & Decision Support Group Table of Contents Subject Areas... 1 Criteria... 2 Exercise 1: Create a Budget Summary Report...
Doc. Version 1.0 Updated:
 OneStop Reporting Report Designer/Player 3.5 User Guide Doc. Version 1.0 Updated: 2012-01-02 Table of Contents Introduction... 3 Who should read this manual... 3 What s included in this manual... 3 Symbols
DecisionPoint For Excel
 DecisionPoint For Excel Getting Started Guide 2015 Antivia Group Ltd Notation used in this workbook Indicates where you need to click with your mouse Indicates a drag and drop path State >= N Indicates
Numbers Basics Website:
 Website: http://etc.usf.edu/te/ Numbers is Apple's new spreadsheet application. It is installed as part of the iwork suite, which also includes the word processing program Pages and the presentation program
Managing Your Website with Convert Community. My MU Health and My MU Health Nursing
 Managing Your Website with Convert Community My MU Health and My MU Health Nursing Managing Your Website with Convert Community LOGGING IN... 4 LOG IN TO CONVERT COMMUNITY... 4 LOG OFF CORRECTLY... 4 GETTING
BE Share. Microsoft Office SharePoint Server 2010 Basic Training Guide
 BE Share Microsoft Office SharePoint Server 2010 Basic Training Guide Site Contributor Table of Contents Table of Contents Connecting From Home... 2 Introduction to BE Share Sites... 3 Navigating SharePoint
OBIEE. Oracle Business Intelligence Enterprise Edition. Rensselaer Business Intelligence Finance Author Training
 OBIEE Oracle Business Intelligence Enterprise Edition Rensselaer Business Intelligence Finance Author Training TABLE OF CONTENTS INTRODUCTION... 1 USER INTERFACE... 1 HOW TO LAUNCH OBIEE... 1 TERMINOLOGY...
Outlook: Web Access. Outlook: Web Access AIS Vienna
 Outlook: Web Access AIS Vienna Table of Contents Introduction to OWA...1 Log On... 1 OWA Workspace... 2 Hiding/Displaying the Reading Pane... 3 Collapsing/Expanding the Outlook Bar... 4 Log Off... 5 Sending
Nintex Reporting 2008 Help
 Nintex Reporting 2008 Help Last updated: Thursday, 24 December 2009 1 Using Nintex Reporting 2008 1.1 Chart Viewer Web Part 1.2 Importing and Exporting Reports 1.3 Import Nintex report page 1.4 Item Level
Pages are static content, generally linked in your navigation. They are used for things like your about page and contact page.
 North Star Marketing Client : The Guthrie Group Deliverable : Website Training +++ LOGGING IN AND OUT +++++++++ 1. Go to http://tgg.northstarmarketing.com/wp admin/. This is the address for the staging
HTML REPORT VIEWER. Intellicus Enterprise Reporting and BI Platform. Intellicus Technologies
 HTML REPORT VIEWER Intellicus Enterprise Reporting and BI Platform Intellicus Technologies info@intellicus.com www.intellicus.com HTML Viewer i Copyright 2012 Intellicus Technologies This document and
Outlook Web Access. In the next step, enter your address and password to gain access to your Outlook Web Access account.
 Outlook Web Access To access your mail, open Internet Explorer and type in the address http://www.scs.sk.ca/exchange as seen below. (Other browsers will work but there is some loss of functionality) In
Microsoft Dynamics GP is a robust accounting package that can meet
 In This Chapter Chapter 1 What Microsoft Dynamics GP Does Best Familiarizing yourself with the Microsoft Dynamics GP window Understanding Dynamics GP terms Knowing how Dynamics GP keeps your CPA happy
User Guide. Version Exago Inc. All rights reserved.
 User Guide Version 2016.2 2016 Exago Inc. All rights reserved. Exago Reporting is a registered trademark of Exago, Inc. Windows is a registered trademark of Microsoft Corporation in the United States and
Style Report Enterprise Edition
 INTRODUCTION Style Report Enterprise Edition Welcome to Style Report Enterprise Edition! Style Report is a report design and interactive analysis package that allows you to explore, analyze, monitor, report,
User Manual. perfectionlearning.com/technical-support
 User Manual perfectionlearning.com/technical-support 1 User Manual Accessing Math X... 3 Login... 3 Forgotten Password... 3 Navigation Menu... 4 Logout... 4 Admin... 5 Creating Classes and Students...
Administrative Training Mura CMS Version 5.6
 Administrative Training Mura CMS Version 5.6 Published: March 9, 2012 Table of Contents Mura CMS Overview! 6 Dashboard!... 6 Site Manager!... 6 Drafts!... 6 Components!... 6 Categories!... 6 Content Collections:
Site Owners: Cascade Basics. May 2017
 Site Owners: Cascade Basics May 2017 Page 2 Logging In & Your Site Logging In Open a browser and enter the following URL (or click this link): http://mordac.itcs.northwestern.edu/ OR http://www.northwestern.edu/cms/
CCRS Quick Start Guide for Program Administrators. September Bank Handlowy w Warszawie S.A.
 CCRS Quick Start Guide for Program Administrators September 2017 www.citihandlowy.pl Bank Handlowy w Warszawie S.A. CitiManager Quick Start Guide for Program Administrators Table of Contents Table of Contents
Working with Pages... 9 Edit a Page... 9 Add a Page... 9 Delete a Page Approve a Page... 10
 Land Information Access Association Community Center Software Community Center Editor Manual May 10, 2007 - DRAFT This document describes a series of procedures that you will typically use as an Editor
Treasury Management User Guide. Online Banking
 Treasury Management User Guide Online Banking Released August 2018 Treasury Management... 4 Logging in to Treasury Management...5 Helpful Hints...10 User Menu... 12 Profile and Preferences... 12 Notification
VisualPST 2.4. Visual object report editor for PowerSchool. Copyright Park Bench Software, LLC All Rights Reserved
 VisualPST 2.4 Visual object report editor for PowerSchool Copyright 2004-2015 Park Bench Software, LLC All Rights Reserved www.parkbenchsoftware.com This software is not free - if you use it, you must
GreenFolders User Manual
 GreenFolders User Manual Welcome! Welcome to GreenFolders the Electronic Records Management Solution. GreenFolders allows you to store and retrieve files with many easy-to-use features for working with
Cougar Mountain Software Dashboards
 Cougar Mountain Software Dashboards Cougar Dtails User s Guide Copyright Notification At Cougar Mountain Software, Inc., we strive to produce high-quality software at reasonable prices. We can only do
3.2 Circle Charts Line Charts Gantt Chart Inserting Gantt charts Adjusting the date section...
 / / / Page 0 Contents Installation, updates & troubleshooting... 1 1.1 System requirements... 2 1.2 Initial installation... 2 1.3 Installation of an update... 2 1.4 Troubleshooting... 2 empower charts...
INSERVICE. Version 5.5. InService Easily schedule and monitor attendance for your training programs, even at remote locations.
 INSERVICE Version 5.5 InService Easily schedule and monitor attendance for your training programs, even at remote locations. 5/15/2014 Page 0 of 11 Table of Contents 1.1 Logging In... 2 1.2 Navigation...
[ Getting Started with Analyzer, Interactive Reports, and Dashboards ] ]
![[ Getting Started with Analyzer, Interactive Reports, and Dashboards ] ]](/thumbs/88/117545107.jpg "[ Getting Started with Analyzer, Interactive Reports, and Dashboards ] ]") Version 5.3 [ Getting Started with Analyzer, Interactive Reports, and Dashboards ] ] https://help.pentaho.com/draft_content/version_5.3 1/30 Copyright Page This document supports Pentaho Business Analytics
Version 5.3 [ Getting Started with Analyzer, Interactive Reports, and Dashboards ] ] https://help.pentaho.com/draft_content/version_5.3 1/30 Copyright Page This document supports Pentaho Business Analytics
Outlook Quick Start Guide
 Getting Started Outlook 2013 Quick Start Guide File Tab: Click to access actions like Print, Save As, etc. Also to set Outlook Options. Quick Access Toolbar: Add your mostused tool buttons to this customizable
Expedient User Manual Getting Started
 Volume 1 Expedient User Manual Getting Started Gavin Millman & Associates Pty Ltd 281 Buckley Street Essendon VIC 3040 Phone 03 9331 3944 Web www.expedientsoftware.com.au Table of Contents Logging In...
2016 TRTA Content Managers Resource Guide How to update and edit your local unit website. Roy Varney, TRTA Multimedia Specialist
 2016 TRTA Content Managers Resource Guide How to update and edit your local unit website. Roy Varney, TRTA Multimedia Specialist Table of Contents Introduction... 1 Basic information... 1 - How to log
Administrator Quick Guide
 1 Administrator Quick Guide Login Screen The first page employees will see when visiting their training site is the login screen. This is where employees must enter their username and password to access
Steps: 1. Log in to the Dmitri application through the following website URL, as appropriate:
 Dmitri Suite Getting Started Logging In and Logging Out Logging In Use the following steps to log in to the Dmitri application. Steps: 1. Log in to the Dmitri application through the following website
Table of Contents. Page 2 of 72. High Impact 4.0 User Manual
 Table of Contents Introduction 5 Installing High Impact email 6 Installation Location 6 Select Mail Client 6 Create a ReadyShare Account 6 Create a Default Profile 6 Outlook Configuration Message 6 Complete
2013 edition (version 1.1)
") 2013 edition (version 1.1) Contents 1 Introduction... 3 2 Signing in to your Office 365 account... 3 2.1 Acceptable Use Policy and Terms of Use... 4 3 Setting your profile and options... 4 3.1 Settings:
2013 edition (version 1.1) Contents 1 Introduction... 3 2 Signing in to your Office 365 account... 3 2.1 Acceptable Use Policy and Terms of Use... 4 3 Setting your profile and options... 4 3.1 Settings:
Keynote 08 Basics Website:
 Website: http://etc.usf.edu/te/ Keynote is Apple's presentation application. Keynote is installed as part of the iwork suite, which also includes the word processing program Pages and the spreadsheet program
The following instructions cover how to edit an existing report in IBM Cognos Analytics.
 IBM Cognos Analytics Edit a Report The following instructions cover how to edit an existing report in IBM Cognos Analytics. Navigate to Cognos Cognos Analytics supports all browsers with the exception
Table of Contents 1-4. User Guide 5. Getting Started 6. Report Portal 6. Creating Your First Report Previewing Reports 11-13
 Table of Contents Table of Contents 1-4 User Guide 5 Getting Started 6 Report Portal 6 Creating Your First Report 6-11 Previewing Reports 11-13 Previewing Reports in HTML5 Viewer 13-18 Report Concepts
Multi-NVR Manager. Quick Start Configuration Usage
 Multi-NVR Manager Quick Start Configuration Usage 2014. All rights are reserved. No portion of this document may be reproduced without permission. All trademarks and brand names mentioned in this publication
Chapter 2: Clients, charts of accounts, and bank accounts
 Chapter 2: Clients, charts of accounts, and bank accounts Most operations in BankLink Practice are client specific. These include all work on coding transactions, reporting, and maintaining chart of accounts
Overview and Instructions
 AE Mobility Tracking Tool July 30, 2013 Overview and Instructions Sheet-specific Instructions Welcome Instructions Common Qs & As MobilityLog & Data Entry Reports: Graphs & Charts Data for Website Entry
Introduction to Cascade Server (web content management system) Logging in to Cascade Server Remember me Messages Dashboard Home
 Logging in to Cascade Server Remember me Messages Dashboard Home") Introduction to Cascade Server (web content management system) Last Updated on Jul 14th, 2010 The College of Charleston's web site is being produced using a Content Management System (CMS) called Cascade
Introduction to Cascade Server (web content management system) Last Updated on Jul 14th, 2010 The College of Charleston's web site is being produced using a Content Management System (CMS) called Cascade
Ministry of Education
 Ministry of Education EFIS 2.0 - User Version 2.0 June 2015 Table of Contents 1 Document History... 4 2 Logon to EFIS 2.0... 5 2.1 Logon through Go Secure... 5 2.2 Bookmarking the Link... 6 3 Planning
A Document Created By Lisa Diner Table of Contents Western Quebec School Board October, 2007
 Table of Contents A Document Created By Lisa Diner Western Quebec School Board October, 2007 Table of Contents Some Basics... 3 Login Instructions... 4 To change your password... 6 Options As You Login...
Veco User Guides. Grids, Views, and Grid Reports
 Veco User Guides Grids, Views, and Grid Reports Introduction A Grid is defined as being a list of data records presented to the user. A grid is shown generally when an option is selected from the Tree
VUEWorks Report Generation Training Packet
 VUEWorks Report Generation Training Packet Thursday, June 21, 2018 Copyright 2017 VUEWorks, LLC. All rights reserved. Page 1 of 53 Table of Contents VUEWorks Reporting Course Description... 3 Generating
RITIS Training Module 4 Script
 RITIS Training Module 4 Script Welcome to the Regional Integrated Information System or RITIS Module 04 CBT. To begin, select the start button or press Shift+N on your keyboard. This training module will
Doc. Version 1.0 Updated:
 OneStop Reporting Report Composer 3.5 User Guide Doc. Version 1.0 Updated: 2012-01-02 Table of Contents Introduction... 2 Who should read this manual... 2 What s included in this manual... 2 Symbols and
MultiSite Suite: General Ledger
 MultiSite Suite: General Ledger User s Manual version 2.2.97 Copyright & Trademarks Copyright Notice and Trademarks 2003 by Brent Lawrence, LLC. All rights reserved. Reprinted and edited by MultiSite Systems,
Basic Intro to ETO Results
 Basic Intro to ETO Results Who is the intended audience? Registrants of the 8 hour ETO Results Orientation (this training is a prerequisite) Anyone who wants to learn more but is not ready to attend the
VIEWER LICENSE GUIDE FOR SERVICEPOINT 5X
 ADVANCED REPORTING TOOL (ART 3X) VIEWER LICENSE GUIDE FOR SERVICEPOINT 5X 2012 Bowman Systems L.L.C. All Rights Reserved. This document and the information contained herein are the property of Bowman Systems
NCMail: Microsoft Outlook User s Guide
 NCMail: Microsoft Outlook 2007 Email User s Guide Revision 1.1 3/9/2009 This document covers how to use Microsoft Outlook 2007 for accessing your email with the NCMail Exchange email system. The syntax
Calendar & Buttons Dashboard Menu Features My Profile My Favorites Watch List Adding a New Request...
 remitview User Guide 1 TABLE OF CONTENTS INTRODUCTION... 3 Calendar & Buttons... 3 GETTING STARTED.... 5 Dashboard.... 7 Menu Features... 8 PROFILE.... 10 My Profile... 10 My Favorites... 12 Watch List...
ADMINISTRATIVE USER GUIDE FOR THE APTI-LEARN LEARNING MANAGEMENT SYSTEM (LMS)
") ADMINISTRATIVE USER GUIDE FOR THE APTI-LEARN LEARNING MANAGEMENT SYSTEM (LMS) Software Version 2.6 September 2012 Prepared by EM-Assist This page left intentionally blank. Software Version 2.6; Document
ADMINISTRATIVE USER GUIDE FOR THE APTI-LEARN LEARNING MANAGEMENT SYSTEM (LMS) Software Version 2.6 September 2012 Prepared by EM-Assist This page left intentionally blank. Software Version 2.6; Document
RITIS Training Module 10 Script. To return to the Florida Analytics main page, select Florida Analytics Tools in the upper left corner of the page.
 RITIS Training Module 10 Script Welcome to the Regional Integrated Transportation Information System or RITIS Module 10 CBT. To begin, select the start button or press Shift+N on your keyboard. To return
User Manual instantolap
 User Manual instantolap Version 2.7.0 15.12.2010 Page 2 / 213 instantolap User Manual 2.7.0 instantolap User Manual 2.7.0 Page 3 / 213 Copyright Copyright (C) 2002-2010 Thomas Behrends Softwareentwicklung
Getting Started Guide. Sage MAS Intelligence 500
 Getting Started Guide Sage MAS Intelligence 500 Table of Contents Getting Started Guide... 1 Login Properties... 1 Standard Reports Available... 2 Financial Report... 2 Financial Trend Analysis... 3 Dashboard
Data Warehouse Business Objects (BOBJ) Ad Hoc Reporting User Guide
 Ad Hoc Reporting User Guide") Updated: 10/17/2018 Data Warehouse Business Objects (BOBJ) Ad Hoc Reporting User Guide Table of Contents Data Warehouse Business Objects (BOBJ) Ad Hoc Reporting... 3 Introduction... 3 Getting Started...
Updated: 10/17/2018 Data Warehouse Business Objects (BOBJ) Ad Hoc Reporting User Guide Table of Contents Data Warehouse Business Objects (BOBJ) Ad Hoc Reporting... 3 Introduction... 3 Getting Started...
DataPro Quick Start Guide
 DataPro Quick Start Guide Introduction The DataPro application provides the user with the ability to download and analyze data acquired using the ULTRA-LITE PRO range of Auto Meter products. Please see
MicroStrategy Desktop
 MicroStrategy Desktop Quick Start Guide MicroStrategy Desktop is designed to enable business professionals like you to explore data, simply and without needing direct support from IT. 1 Import data from
Excel 2013 Intermediate
 Excel 2013 Intermediate Quick Access Toolbar... 1 Customizing Excel... 2 Keyboard Shortcuts... 2 Navigating the Spreadsheet... 2 Status Bar... 3 Worksheets... 3 Group Column/Row Adjusments... 4 Hiding
Introduction to Cognos Participants Guide. Table of Contents: Guided Instruction Overview of Welcome Screen 2
 IBM Cognos Analytics Welcome to Introduction to Cognos! Today s objectives include: Gain a Basic Understanding of Cognos View a Report Modify a Report View a Dashboard Request Access to Cognos Table of
AN INTRODUCTION TO OUTLOOK WEB ACCESS (OWA)
") INFORMATION TECHNOLOGY SERVICES AN INTRODUCTION TO OUTLOOK WEB ACCESS (OWA) The Prince William County School Division does not discriminate in employment or in its educational programs and activities against
INFORMATION TECHNOLOGY SERVICES AN INTRODUCTION TO OUTLOOK WEB ACCESS (OWA) The Prince William County School Division does not discriminate in employment or in its educational programs and activities against
Intellicus Enterprise Reporting and BI Platform
 Designing Adhoc Reports Intellicus Enterprise Reporting and BI Platform Intellicus Technologies info@intellicus.com www.intellicus.com Designing Adhoc Reports i Copyright 2012 Intellicus Technologies This
Microsoft PowerPoint Tutorial
 Microsoft PowerPoint Tutorial Contents Starting MS PowerPoint... 1 The MS PowerPoint Window... 2 Title Bar...2 Office Button...3 Saving Your Work... 3 For the first time... 3 While you work... 3 Backing
User Manual For SmartRoom Managers
 User Manual For SmartRoom Managers Table of Contents 1.0 Login 2.0 Confidentiality Agreement 3.0 Software Installation 4.0 Dashboard 5.0 Document Review and Index Maintenance 5.1 View by Index 5.1.1 Index
Task Management User Guide
 Task Management User Guide Version 18 April 2018 Contents About This Guide... 5 Tasks Overview... 5 Create a Project for Task Management... 5 Project Templates Overview... 5 Add a Project Template...
You can also check the videos at the bottom of this page:
 This document is provided to give you an idea what R-Tag Version Control can do and how you can use it. If you decide that you need more information or you prefer to see a demo of the software please do
Ge#ng Started Guide New Users and Starter Edi/on
 Ge#ng Started Guide New Users and Starter Edi/on Goal Thank you for taking the time to use Viewpath as your project management solution. Our goal in providing this guide is to help streamline the process
Analysis and Reports. Safety Event Manager with QPrecision
 Analysis and Reports Safety Event Manager with QPrecision Analyzing Safety Event Data Safety Event Manager with QPrecision supports datadriven decision making through its Reports features. Reports leverage
Updated PDF Support Manual:
 Version 2.7.0 Table of Contents Installing DT Register... 4 Component Installation... 4 Install the Upcoming Events Module...4 Joom!Fish Integration...5 Configuring DT Register...6 General... 6 Display...7
Getting Started Guide
 Getting Started Guide Sage MAS Intelligence 90/200 Table of Contents Getting Started Guide... 1 Login Properties... 1 Standard Reports Available... 2 Financial Report... 2 Financial Trend Analysis... 3
Percussion Documentation Table of Contents
 Percussion Documentation Table of Contents Intro to the Percussion Interface... 2 Logging In to Percussion... 2 The Dashboard... 2 Managing Dashboard Gadgets... 3 The Menu... 4 The Finder... 4 Editor view...
To access BuckIQ, you must first be granted access. Send requests for permission to
 BuckIQ User s Guide Job Aid What is BuckIQ? Several years ago, Oracle took a look at the state of the Business Intelligence industry in terms of the different processes and applications that were required
Reading Sample. Creating New Documents and Queries Creating a Report in Web Intelligence Contents. Index. The Authors
 First-hand knowledge. Reading Sample In this sample chapter, you l l start in Chapter 2 by creating your first document and query in SAP BusinessObjects BI. In this process, we ll explore the query panel,
TECHNOLOGY TRAINING PROGRAM. Supplier Decision Support System. User Manual
 TECHNOLOGY TRAINING PROGRAM Supplier Decision Support System User Manual PREREQUISITE(S) A basic knowledge of Internet Explorer is recommended. You should be familiar with terms such as Address Bar, Hyperlink,
Scheduling Reports Launch the Scheduling Tool... 1 Description... 1 Overview of Scheduling Components... 2
 PeopleSoft Data Dictionary EPM: Scheduling Reports Table of Contents Scheduling Reports... 1 2 Launch the Scheduling Tool... 1 Description... 1 Overview of Scheduling Components... 2 Distribution... 2
Kaltura Video Package for Moodle 2.x Quick Start Guide. Version: 3.1 for Moodle
 Kaltura Video Package for Moodle 2.x Quick Start Guide Version: 3.1 for Moodle 2.0-2.4 Kaltura Business Headquarters 5 Union Square West, Suite 602, New York, NY, 10003, USA Tel.: +1 800 871 5224 Copyright
How to lay out a web page with CSS
 Activity 2.6 guide How to lay out a web page with CSS You can use table design features in Adobe Dreamweaver CS4 to create a simple page layout. However, a more powerful technique is to use Cascading Style
Outlook 2016 Guide. A Complete Overview for Connect Users
 Outlook 2016 Guide A Complete Overview for Connect Users Chapter 1: Introduction...8 Chapter 2: Getting Around Outlook...8 Quick Access Toolbar... 8 The Ribbon... 8 Backstage View... 9 Dialog Box Launcher...
HOSTED CONTACT CENTRE
 ---------------------------------------------------------------------------- ------ HOSTED CONTACT CENTRE ANALYTICS GUIDE Version 9.4 Revision 1.0 Confidentiality and Proprietary Statement This document
EFIS User Guide Family Support Programs User
 Ministry of Education EFIS 2.0 - User Guide Family Support Programs User Version 2.0 June 2015 Table of Contents 1 Document History... 1 2 Logon to EFIS 2.0... 2 2.1 Logon through Go Secure... 2 2.2 Bookmarking