Welcome to the Surface Water Data Viewer!
|
|
|
- Charla Marshall
- 6 years ago
- Views:
Transcription
1 1 Welcome to the Surface Water Data Viewer! The Surface Water Data Viewer is a mapping tool for the State of Wisconsin. It provides interactive web mapping tools for a variety of datasets, including chemistry, physical, and biological data. The data managed in layers that can be turned on and off as needed. The following page shows the homepage of the Surface Water Data Viewer (SWDV) with many commonly used features labeled. Descriptions of the features are as follows: Toolbars: There are a variety of toolbars with different themes to help complete tasks using the SWDV. The toolbars can be used to display the layers available to the map, add or remove shapes, text, or measurement features, identify points, print maps, and more! Search Bar: Using the search bar, you can search monitoring stations by number, locations by keyword, and waterbodies by WBIC. Be careful when using the search bar, partial matches do not always appear in the results. Navigation Pane: The navigation pane is where results will appear from searches, where you are able to select layers for the map, and features for printing. You will be able to refine the data that is shown here, if desired. You can hide the navigation pane by clicking the left-facing arrow at the top. Coordinates and Coordinate System: The coordinates will display for any point moused-over on the map. Click the black triangle to select your preferred method for displaying lat/long (DD, DMS, DDM, Mercator). The right-most option in this pane allows you to manually manage the scale of the map. Click on the scale tool, and selected the desired scale at which you wish to view the map. Select Go to implement changes. Scale Bar: The scale bar shows the current extent of the map. Whole State View: This view describes what is being shown on the main map relative to the entire state. A blue rectangle will cover the region of the state being shown on the map. You can also navigate the map by moving the blue square around the state-view map. If you print a map, this whole state view will print in the corner as a reference. You can minimize this view by clicking the corner-facing arrow in the top left edge of the box. Show/Hide Toolbar: Use this button to hide the toolbar for a larger view of the map. If you have hidden the toolbar, you can also use this button to show it again.
2 2

3 Toolbars Search Bar 3 Show/Hide Toolbar Navigation Pane Whole-State View Scale Bar Coordinates and Coordinate System
4 4 When using the Surface Water Data Viewer, there are a variety of Toolbars that can be applied. Toolbars give you the ability to plot points on the map, make drawings, label points, measure distances, etc. The most common Toolbars that you will use are: 1. Maps & Data 2. Basic Tools 3. Locate & Identify 4. Draw & Measure 5. Additional Resources

5 5 The Maps & Data Toolbar Upload Data: Use this tool to temporarily upload data from your computer to the map. Select the Upload Data tool. A dialogue box will appear. Use the Browse button to search for the file that you would like to upload. Once you have selected the file, select Upload to temporarily add the data to the map. Print: This tool will print the current extent of the map, including all plotted points and drawings within that extent. The printed map will also include the Whole State View. Export: This tool will export your current map to an image format. Formats include: BMP, JPEG, PNG, TIFF, GeoTIFF, and PDF. Select Include Georeference Data to download the spatial reference information embedded in the map. Checking this box will be helpful for maps downloaded for later use in other mapping applications. Share: Use this tool to share your map via or social media platform such as Facebook or Twitter.
6 6 The Basic Toolbar Home: The home button can be found in two places. The first is in the Basic Tools Toolbar. The second is in the ribbon at the bottom of the Navigation Pane. Clicking on Home will open up the basic description of the SWDV in the Navigation Pane. If you have search results, don t worry, clicking Home does not lose your results. You can return to your results by clicking the Results tab in the bottom ribbon. Home does not change the view on the map. Show Layers: This tool opens a list in the navigation pane of data layers that can be applied to the map. See the following page for a screenshot of the Show Layers pane. These layers can be turned on or off to apply different datasets to the map. Map Legend: The Map Legend describes each of the features on the map. As more layers are added to the map, it will become more complicated and more features will be added to the legend. When a map is printed, the legend will print alongside it. The accompanying image shows the initial map legend before additional layers have been applied to the map.
7 This is the list of layers that will appear when the Show Layers tool is selected. Scroll down through the Navigation Pane to view all available layer categories. Select the + on a layer category to view available layers within that category. Monitoring Sites & Data is a common layer category that you may use in the SWDV. Here is an expanded view of the layers within that category. 7
 8 Subbasins.")
8 8 Looking at the list of layers that you can apply, the variety can get overwhelming! There are a few that you may use more often than others. For Citizen-based Stream Monitoring projects, regions are separated by HUC (Hydrologic Unit Code) 8 Subbasins. To view the HUC 8s in Wisconsin, scroll through the list of layers to Watershed Boundaries. Click on the + sign to expand. Select the checkbox for Watershed Boundaries as well as the 8-digit HUCs (Subbasins) option. It will take a few seconds for the map to populate with this layer information. You can use the Point Identify tool to learn more about each of these subbasins. You will learn more about the Point Identify tool in the following pages. To turn off the HUC 8 layer, uncheck the box(es).

9 9 Another interesting map layer is the Great Lakes and Mississippi Basins layer. This layer delineates the major basins into which the subwatersheds of Wisconsin drain. To turn on this layer, navigate again to the line of text that reads Watershed Boundaries and click the + to expand. Check the box for Great Lakes and Mississippi Basins. The map will take a few seconds to populate with the data layer. You can use the Point Identify tool to learn more about each of these basins. You will learn more about the Point Identify tool in the following pages. To turn off the Great Lakes and Mississippi Basins layer, uncheck the box(es).

10 10 The most common map layer that you will likely use is the one that shows current and historic monitoring station points. This layer is very helpful when looking for monitoring data or if you are looking to set up a new monitoring location. In this section, you will see what the layer looks like, and how to turn it on and off. As you learn more about the toolbars, you will learn more about the features of this data layer. To turn on this data layer, expand the text for Monitoring Sites & Data. To view all existing monitoring stations, check the boxes for Monitoring Sites & Data Monitoring Station Points Monit. Station Pts w/ Data Monit. Station Pts w/o Data This layer contains a lot of data. It may take up to a minute or two to populate the map. Each time you zoom to a new extent of the map, it may have to reload all of the points. Be patient! Monitoring Station Point

11 11 Pan: Use the pan tool to drag the map, or to move your view across the map without selecting features or zooming. Zoom In: Use this tool to enlarge a selected location. This can also be done by clicking on the + symbol adjacent to the Navigation Pane on the map. Zoom Out: Use this tool to view a broader extent of the map. This can also be done by clicking on the symbol adjacent to the Navigation Pane on the map. Previous Extent: Use this tool to return to the previous view of the map. For example, if you were zoomed in on Waukesha County, and then you panned west to Grant County, Previous Extent will return you to a view of Waukesha County. Next Extent: After selecting Previous Extent, use this tool to return forward to the last extent viewed. Using the previous example, this tool would return you to the view of Grant County. Full Extent: Full State will zoom the map out to view the entire state. Any layers you have applied to map will remain. Bookmarks: Use this tool to bookmark the current map extent. After creating bookmarks, select the Bookmarks tool to return to your saved map extents. Point Identify: Use the Point Identify tool to gather information about features on the map. Select the tool, then click on the feature. Information will appear in the Navigation pane to the left. For example, given this extent on the map, you have already turned on the Monitoring Station Points layer. To learn more about the selected monitoring station, click on the Point Identify tool. Use the mouse to click on the yellow triangle representing the monitoring station.

12 12 Results Box In the navigation pane to the left, a series of information appears. In this case, you are presented with the name of the monitoring station and the waterbody on which the station lies. The small map next to the name of the feature can be used to pan to the feature on the map. The results will also appear in the Results Box at the top of the map. The selected result in the Results Box will be marked on the map with a red marker icon. Use the left and right arrows to scroll to the result of your chose. The Point Identify tool can be used on any waterbody or map feature.
13 13 For more information about the monitoring station, click on the name of the station. Further information will appear in the Navigation Pane. Click on the List Symbol for further options regarding the identified point. The following options will appear: List Symbol Show Expanded View: Use this tool to open an expanded view of the feature details. This view will open as a pane in the bottom half of your screen. Show Buffer Options: Use this tool to identify nearby features within a desired buffer zone of the identified point. Zoom to Feature: Use this tool to zoon to the selected feature on the map. Pan: This tool will pan the map to your selected feature. Remove from Results: This option will remove this feature from the current set of results. The feature will still show up in future result sets.

14 14 To access monitoring data from this station, click Link to Monitoring Data. A new tab will open in your browser through the SWIMS database, displaying a table of monitoring data for the selected site. This data can be sorted by parameter using the Show specific parameter dropdown menu.

15 15 If you use the Results Box to select the waterbody, in this case the Yahara River, the entire body of water will be highlighted.

16 16 To learn more about the selected waterbody, click the link About the Water. You will be directed to a new page.
17 17 The Locate & Identify Toolbar The Locate & Identify Toolbar contains a variety of tools to complete similar functions. In the same way that you can use the Point Identify tool in the Basic Toolbar to select a single point on which to gather more details, most of the tools in this toolbar will garner similar results. To use the Identify tools, first select the Identify tool button. The Identify tool button is not named on the toolbar. Instead, it appears as whatever identification form you have selected. The basic tool is Point. The Point tool will be the default in the Locate & Identify Toolbar until changed by the user. From here, there are a variety of options for identification. Use the dropdown arrow to navigate these options. Each tool also has a series of accompanying options explained below. Point: This tool functions the same as the Point Identify tool in the Basic Toolbar. This tool can be used to identify a single point on the map. Select the tool, and then select the desired location on the map. Any available, relevant information will appear in the results pane on the left side of the viewer. Enable Buffering: This tool appears as an option for each Identify tool type. If you select Enable Buffering, the Buffer Options will appear in the Navigation Pane. Enter the buffer distance, and the distance units. Click Continue to apply the buffer. This will add any results to the results pane within the buffer zone of your drawn feature.
18 18 Enable Snapping: Snapping accounts for inaccuracy in your identified location. If Enable Snapping is selected, the Identify Tool will snap the point identifier to a feature within the circular snapping tool. Enable Snapping is available on all Identify tools except Rectangle. Select Snapping Layers: This tool will open a list of Snappable Layers in the Navigation Pane. Select the layers to which you want the Enable Snapping tool to snap. The snapping tool will only snap to selected layers. This tool is available on all Identify tools except Rectangle. Identifiable Layers: This option will produce a list of Identifiable Layers in the Navigation Pane. Select the layers for which you would like results to appear when using Identify tools. This option is available on all Identify tool types. Freehand: Use this tool to freehand-draw a shape around a select area on the map. Any available, relevant information about features within the selected area (including, but not limited to monitoring station points, WBICs, municipality names, etc.) will appear in a list in the results pane on the left side of the viewer. Line: Use this tool to draw a line or set of connected lines on the map. Relevant, available information about features through which the line passes will populate the results pane on the left side of the viewer. To begin drawing the line, click in the desired location on the map. To complete drawing the line, double click. To create adjoining lines, single click between line segments.
19 19 Polygon: Use this tool to draw a polygon around a desired location on the map. Relevant, available information about features within the drawn polygon will populate the results pane on the left side of the viewer. To draw the polygon, select a location for the starting vertex. Click on the map to place additional vertices. Double click to complete the polygon. Rectangle: Use this tool to draw a rectangle around a desired location on the map. Relevant, available information about features within the rectangle will appear in the results pane on the left side of the viewer. To draw the rectangle, select a location for the starting vertex, and drag the mouse until the rectangle reaches the desired size. Clear Selected: Use this tool to clear all Identify drawings from the map. Query: Use this tool to perform an advanced search for a feature. Selecting Query will open a process in the Navigation Pane. Select the Data Source on which you would like to perform the Query. Conditions for the Query can then be changed for the Data Source. Select any of the conditions to provide a dropdown menu for Query options. If necessary, Add Another Condition. You can filter the search results spatially. Results can either be gathered from the entire map or from the current extent being viewed using the Spatial Filter dropdown menu. Click Search to run the Query. Filter: Use this tool to filter results. The conditions for this tool are similar to those in the the Query tool.
20 20 Find Location: Use this tool as a search feature to find specific features on the map. Selecting Find Location will generate a list of search options in the Navigation Pane. To find a location, select the feature radio button, and click Find. Common Find Location options you may use could include: City, Town, Village: Use this option to return results on a desired city, town, or village. Enter the location name into the Name search bar. Select Find to run the search. Coordinates DD: Search for a location using decimal degrees. Enter the Lat and Long into the respective search bars. Select the desired Zoom To size, and click Find. Zoom To will define the extent of the map returned when you click Find. Coordinates DMS: Search for a location using the degrees, minutes, seconds format. Enter the values for Latitude and Longitude. Select the desired Zoom To size, and click Find. Coordinates WTM: Search for a location using the Wisconsin Transverse Mercator projection. Enter the values for X and Y. Select the desired Zoom To size, and click Find.
21 21 Rivers and Streams: Search for a River or Stream with this tool. Use the Search Type dropdown to select the parameter by which you would like to perform the search: Name or WBIC. If the Name or WBIC is known, enter it into the Value field. Use the County dropdown to select your search region. Click Find to run the search. SWIMS Station: Use this tool to search by SWIMS Station ID. The monitoring stations used for the WAV Program are Points. Select the appropriate Search Type from the dropdown menu, SWIMS ID or Name. Enter the Value into the search bar. Click Find to run the search and return results. Watershed: Use this tool to locate a specific watershed on the map. Select the desired Watershed from the dropdown menu. Click Find to return results.
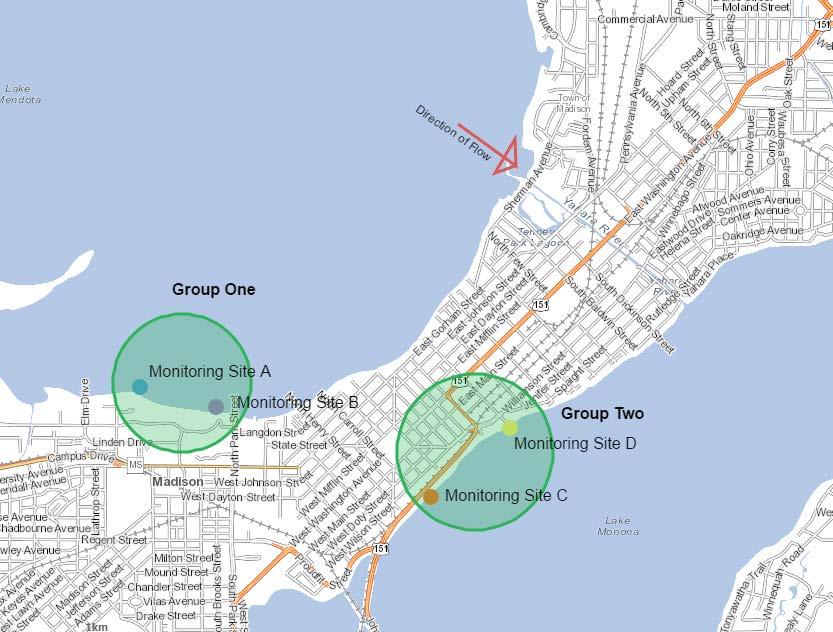
22 22 The Draw & Measure Toolbar The Draw & Measure Toolbar is an excellent tool for making your own custom maps. It is very helpful to show where individual monitoring sites are you can type the names of the sites next to their identification points or color-code them! It is also useful if you need to perform calculations of area or distance on the map. Draw Tools To use any of the drawing tools, first select the desired tool from the Draw tool options. Similar to the Identify tool, use the dropdown to select the desired tool. The tool options will change once one of the nine drawing tools has been selected. A new section will appear with options for the drawing that you will apply to the map. The Drawing Options for each tool include Enable Snapping, Select Snapping Layers, and Styles. The Styles will differ based on each tool selected.
23 23 Point Styles Text Styles Freehand Shape Styles, Ellipse Styles, Circle Styles, Polygon Styles, Rectangle Styles Line Styles, Freehand Styles See the following page for examples of the Drawing Tools as used on the map.
24 24

25 25 Measure Tools To use any of the measuring tools, first select the desired tool from the Measure tool options. Similar to the Identify tool, use the dropdown to select the desired tool. The tool options will change once one of the seven Measure tools has been selected. A new section will appear with options for the measurement that you will apply to the map. The Measuring Options for each tool include Distance Units, Area Units, Enable Snapping, and Select Snapping Layers. Line: Use this tool to find the distance between points on the map. To begin measuring, select the Line tool, then click on your starting location on the map. Click each subsequent location to measure a distance. Distances will appear on the map along the drawn measurement line. The Total displays the sum of the distances that you have measured. Similar to the Line tool in the Draw Tools, to complete a Line measurement, double click the mouse.


26 26 Freehand Line: Use this tool to find the distance between points on the map not connected by a straight line. Click and drag your mouse along the desired measurement path. The Total will display the traced distance of the Freehand Line. Use the following tools to find area over a specific region on the map. When using the area tools, Freehand Shape, Ellipse, Circle, Polygon, and Rectangle two types of information are generated: Perimeter and Area. Freehand Shape: Similar to the Freehand Line, to use this tool, click and drag the mouse around the area to be measured. Release the mouse to complete the measurement. The Ellipse and Circle tools work in the same way for measurements as they do for drawing. Draw the shape on the map over the location for which you would like to measure Area or Perimeter. The drawing will appear with measurement information upon release of the mouse.


27 27 Rectangle: Draw a Rectangle the same way that you would using the Draw Tools. When a Rectangle measurement is placed on the map, the length of each side of the rectangle will appear on the map as well as the total Perimeter and the Area of the shape. Polygon: Use this tool in the same way you would the polygon tool in the Draw Tools. Click on the map at the point you wish to place the starting vertex. Continue to place vertices by clicking on the map until you have drawn the desired area. Double click to complete the measurement. Lengths will generate on the map for each leg of the drawing.


28 28 Edit Graphics To make changes to the graphics added to the map from the Draw Tools or Measure Tools, use the Edit Graphics dropdown menu. There are three options for editing drawings and measurements made on the map: Edit: Use this tool to edit a single feature created using the Draw Tools or Measure Tools. Editing works differently for each feature. Some features can be moved, resized, text added, angle changed, or a combination of the former. It is possible to change the Style of all drawings. To edit a feature, select Edit and then click on the drawn feature that you would like to change. Editing Text When editing Text, first make changes to the content of the Text. Select OK to move on to change the size, angle or location of the Text. Editing Drawings or Measurements Erase: To erase a single feature created using the Draw Tools or Measure Tools, select Erase, and then click on the single feature that you would like to remove from the map. Clear: Use this tool to clear all drawings on the map. While most drawings created using the Draw Tools can be moved during editing, Points cannot. If you would like to move a Point, you must Erase the drawing and create a new one in the desired location. Export Drawings: Use this tool to export the drawings and measurements that you have created on the map as a shapefile for later use.
29 29 The Additional Features Toolbar Help & FAQ Tools: If you need to troubleshoot any issues with the Surface Water Data Viewer, or would like to learn more about the features of the viewer, you can toggle through the resources in the Help & FAQ Tools. If you encounter a problem with the Surface Water Data Viewer, use the Contact tool to send a message to the Surface Water Data Viewer Team. Other DNR Viewers Use these tools to launch other DNR mapping applications. Water Condition Viewer: The Water Condition Viewer is a mapping tool that focuses on water condition, monitoring, assessment and management data. Lakes and AIS Viewer: The Lakes Condition Viewer allows users to search and map monitoring locations for lakes and aquatic invasive species (AIS) Watershed Viewer: The Watershed Restoration Viewer is a mapping tool designed to help users view water quality improvement projects across the state. Water Use Viewer: The Water Use Viewer is a mapping tool that allows the public to view the locations and volumes of high capacity wells and surface water withdrawals.

30 30 Other Features There are a few Surface Water Data Viewer features that are not housed in a Toolbar or Navigation Pane. Right Click: Use this tool to generate a dropdown menu of options for the location selected on the map. Right Click a location to select. A small map marker will drop on the site. Find data on the map: This tool works in a similar way to Point Identify. Selecting Find data on the map will return results for identifiable features at the selected location in the Navigation Pane. Draw Point: Use this tool to draw a Point at the selected location. Edit this Point as you would any other Point drawn using the Draw Tools. Plot a Coordinate: Use this tool to plot the coordinates of the selected location on the map. Plotted coordinates will appear in the Navigation Pane. Add Some Text: Use this tool to add Text at the selected location. Edit this Text as you would any other Text created using the Draw Tools. Center the Map Here: Use this tool to maintain the current extent of the map while panning to center the selected location on your screen.
31 31 Help Text: This tool will appear at the bottom of the screen when you use a map tool. The Help Text is meant to serve as a guide to using the features of the Surface Water Data Viewer. Here are some examples of Help Text. When editing in Plot Coordinate When creating a Freehand Shape When using Zoom Out When using Polygon to find Area Thank you for using the Water Action Volunteers Guide to the Surface Water Data Viewer! If you have any further questions about using the viewer, do not hesitate to contact your WAV Coordinator.
Guide to Mapping Website (Public) December 2016 GC_236594
 December 2016 GC_236594") Guide to Mapping Website (Public) December 2016 GC_236594 Table of Contents Guide to Mapping Website (Public)... 1 December 2016... 1 Quick Start... 3 Map Layers... 4 How do I?... 5 Draw on the Map...
Guide to Mapping Website (Public) December 2016 GC_236594 Table of Contents Guide to Mapping Website (Public)... 1 December 2016... 1 Quick Start... 3 Map Layers... 4 How do I?... 5 Draw on the Map...
City of La Crosse Online Mapping Website Help Document
 City of La Crosse Online Mapping Website Help Document This document was created to assist in using the new City of La Crosse online mapping sites. When the website is first opened, a map showing the City
Biodiversity GIS (BGIS) Internet Mapping User Guide
 Internet Mapping User Guide") Biodiversity GIS (BGIS) Internet Mapping User Guide http://bgis.sanbi.org Contents 1 Basic Introduction to BGIS Website (http://bgis.sanbi.org)... 6 1.1 LUDS... 6 1.2 Projects... 6 1.3 Services... 6 1.4
Biodiversity GIS (BGIS) Internet Mapping User Guide http://bgis.sanbi.org Contents 1 Basic Introduction to BGIS Website (http://bgis.sanbi.org)... 6 1.1 LUDS... 6 1.2 Projects... 6 1.3 Services... 6 1.4
RAPIDMAP Geocortex HTML5 Viewer Manual
 RAPIDMAP Geocortex HTML5 Viewer Manual This site was developed using the evolving HTML5 web standard and should work in most modern browsers including IE, Safari, Chrome and Firefox. Even though it was
Press the Plus + key to zoom in. Press the Minus - key to zoom out. Scroll the mouse wheel away from you to zoom in; towards you to zoom out.
 Navigate Around the Map Interactive maps provide many choices for displaying information, searching for more details, and moving around the map. Most navigation uses the mouse, but at times you may also
Getting Started with VicMap
 Getting Started with VicMap This is a brief overview of some of the tools and features available on VicMap. At any time you can right click on the map and click Identify What s Here to find more information
Parkland County s Public Interactive Mapping Application USER MANUAL
 Parkland County s Public Interactive Mapping Application USER MANUAL Geographic Information Systems Discover Parkland v3.0 Updated: January 2017 Table of Contents I. Welcome to v3.0... 3 II. Discover Parkland
Estuary Data Viewer User Guide
 1. Introduction 2. Page Layout 3. Navigation Tools 4. Table of Contents Tabs 5. Action Tools 6. System Requirements Estuary Data Viewer User Guide 1. Introduction Welcome to the Estuary Planner Data Viewer.
Chapter 1 : Getting Started with Integrity... Chapter 2 : Interface Layout... Chapter 3 : Navigation... Chapter 4 : Printing...
 .0 User s Manual Table of Contents Chapter : Getting Started with Integrity... Chapter : Interface Layout... Chapter : Navigation... Chapter : Printing... Chapter : Quick Search and Results Pane... Results
Insight: Measurement Tool. User Guide
 OMERO Beta v2.2: Measurement Tool User Guide - 1 - October 2007 Insight: Measurement Tool User Guide Open Microscopy Environment: http://www.openmicroscopy.org OMERO Beta v2.2: Measurement Tool User Guide
To the GeoView System Overview Online Training Course
 Welcome! To the GeoView System Overview Online Training Course The Alberta Department of Energy provides GeoView as a mapping system to enable users to find geographic information in Alberta. GeoView retrieves
The Preparing for Success Online Mapping Tool
 The Preparing for Success Online Mapping Tool Baker Polito Administration The Executive Office of Housing and Economic Development and MassGIS Questions & Comments? Please contact MassWorks@state.ma.us
Greenville County Internet Mapping System User s Guide
 Greenville County Internet Mapping System User s Guide Version 2.0 Greenville County Geographic Information Systems May 30, 2006 Table of Contents NAVIGATING TO THE ONLINE MAPPING APPLICATIONS...- 3 -
Version 1.0 August Users Guide
 Version 1.0 August 2016 Users Guide HABISask Users Guide First Edition 2016 Published by: Fish and Wildlife Branch Ministry of Environment 3211 Albert Street Regina, Saskatchewan S4S 5W6 SUGGESTED CITATION
Using Syracuse Community Geography s MapSyracuse
 Using Syracuse Community Geography s MapSyracuse MapSyracuse allows the user to create custom maps with the data provided by Syracuse Community Geography. Starting with the basic template provided, you
Development Authority of the North Country (DANC) Internet Mapping Application Instructions Public Viewer 1. Purpose. 2. Logging-in. 3.
 Internet Mapping Application Instructions Public Viewer 1. Purpose. 2. Logging-in. 3.") Development Authority of the North Country (DANC) Internet Mapping Application Instructions Public Viewer 1. Purpose The purpose of this document is to outline basic functionality of the DANC Internet
Development Authority of the North Country (DANC) Internet Mapping Application Instructions Public Viewer 1. Purpose The purpose of this document is to outline basic functionality of the DANC Internet
How to view details for your project and view the project map
 Tutorial How to view details for your project and view the project map Objectives This tutorial shows how to access EPANET model details and visualize model results using the Map page. Prerequisites Login
COGCC GIS Online Map Instructions - Internet Site April 10, 2018
 COGCC GIS Online Map Instructions - Internet Site April 10, 2018 Table of Contents Page Section Page Section 1 Introduction 8 Clear Selection 2 Double Click 8 Buffer 3 Arrow Tip Information 9 Select within
Guide to Bruce County Maps (Public) January 2018
 January 2018") Guide to Bruce County Maps (Public) January 2018 For any unanswered questions about Bruce County Maps not covered by this document, please contact Justin Kraemer at gis@brucecounty.on.ca or phone 519-534-2092
Guide to Bruce County Maps (Public) January 2018 For any unanswered questions about Bruce County Maps not covered by this document, please contact Justin Kraemer at gis@brucecounty.on.ca or phone 519-534-2092
Tutorial for Lane County Mapping Applications
 Tutorial for Lane County Mapping Applications Contents Overview... 2 Tools... 2 Navigation Tools... 3 Display Tools... 5 Information Tools... 6 Sharing Tools... 7 Common Tasks... 9 Identify or Show Data
Greater Bridgeport Regional Council Municipal GIS Viewer Training April 2015
 Greater Bridgeport Regional Council Municipal GIS Viewer Training April 2015 GBRC GIS Web Training Table of Contents Introduction........................................................... 3 Viewer Components.......................................................
Page 1 of 16 CONTENTS:
 Page 1 of 16 CONTENTS: HOME-BOX -- (PG.2) o PROPERTY OWNERSHIP o ADDRESS SEARCH o I WANT TO AERIAL IMAGERY AND BASE MAPS -- (PG.2) o IMAGERY WITH LABELS ON/OFF o TOPOGRAPHY ON/OFF o TRANSPARENCY ZOOM IN
MANITOBA LAND USE AND DEVELOPMENT WEB APPLICATION: How-to guide and help document
 MANITOBA LAND USE AND DEVELOPMENT WEB APPLICATION: How-to guide and help document 2 Index Index... 2 Layout & View... 3 Overview... 3 Layers... 4 Municipal Relations Data Layers... 4 Application Toolbar...
St. Joseph County. GIS Department FetchGIS Web Map Tutorial
 St. Joseph County GIS Department FetchGIS Web Map Tutorial 2 Table of Contents Contents Slide #(s) Where to Find the Web Map 3 Disclaimer 4 Turning On and Off Map Layers 5 Searching for Parcels 6 More
OnCOR Silverlight Viewer Guide
 Getting Around There are many ways to move around the map! The simplest option is to use your mouse in the map area. If you hold the left button down, then click and drag, you can pan the map to a new
Each primary search has an auto-fill that will filter out results as the user continues to type.
 The Town of Farmville has recently requested a GIS parcel viewer and Timmons Group, based out of Richmond, VA, was selected to design and host this new website. This website allows users to look up parcel
PWC County Mapper XM User Instruction (AS OF 12/03/2009)
") PWC County Mapper XM User Instruction (AS OF 12/03/2009) MAP NAVIGATION There are several ways to navigate the map, you can use your keyboard/mouse combination, use the Navigation toolbar, use the slider
PWC County Mapper XM User Instruction (AS OF 12/03/2009) MAP NAVIGATION There are several ways to navigate the map, you can use your keyboard/mouse combination, use the Navigation toolbar, use the slider
IntraMaps End User Manual
 IntraMaps End User Manual For IntraMaps Version 8 Date: 6 th July 2014 Contents Introduction... 4 What is IntraMaps?... 4 Application... 5 Main Toolbar... 6 View... 7 Original View:... 7 Pan:... 7 Zoom
Overview of ArcGIS Online Applications. Champaign County
 Overview of ArcGIS Online Applications Champaign County Champaign County GIS Consortium Updated: April 2017 Table of Contents ArcGIS Online Application Overview... 3 Map Interface Symbology and Terminology...
Full Search Map Tab. This map is the result of selecting the Map tab within Full Search.
 Full Search Map Tab This map is the result of selecting the Map tab within Full Search. This map can be used when defining your parameters starting from a Full Search. Once you have entered your desired
Working with PDF s. To open a recent file on the Start screen, double click on the file name.
 Working with PDF s Acrobat DC Start Screen (Home Tab) When Acrobat opens, the Acrobat Start screen (Home Tab) populates displaying a list of recently opened files. The search feature on the top of the
REDI 5.0 User Manual
 REDI 5.0 User Manual OBJECTIVE: REDI (Regional Economic Development Information System) provides a quick, convenient and easy way of accessing the City of San Diego Business Incentive Zones (BIZ) information.
Mn/DOT MnCMAT Crash Analysis Application Help
 Mn/DOT MnCMAT Crash Analysis Application Contents Login... 5 User Login Dialog... 5 Login... 5 Request Access Dialog... 5 Forgotten Password Dialog... 6 Create/Open Project... 7 Create/Open Project Dialog...
ArcView QuickStart Guide. Contents. The ArcView Screen. Elements of an ArcView Project. Creating an ArcView Project. Adding Themes to Views
 ArcView QuickStart Guide Page 1 ArcView QuickStart Guide Contents The ArcView Screen Elements of an ArcView Project Creating an ArcView Project Adding Themes to Views Zoom and Pan Tools Querying Themes
FlexMLS Maps Quick Reference Guide
 FlexMLS Maps Quick Reference Guide Full Search Map Tab Features Define Search Areas box Map tab in Full Search Radius Search tool from an address Show/Hide Property List, Locate Address, and Define Search
1. NJDEP Landscape 3.3 Viewer Interface
 Using the Landscape Project through NJDEP Landscape 3.3 Viewer Google Chrome or Mozilla Firefox are recommended for the use of this app. Navigate to the NJDEP-DFW s Landscape Project web page at www.njfishandwildlife.com/ensp/landscape/
Draft FPC Hatchery Release Data Mapping Application
 Draft FPC Hatchery Release Data Mapping Application 1 Table of Contents To open the Hatchery Release Data Mapping Query 4 Quick Reference Instructions to Search for Hatchery Release Data 5 Notes about
COMMISSION OF TEXAS MAY
 GIS Viewer RAILROAD COMMISSION OF TEXAS MAY 2017 Table of Contents GIS Viewer Basics... 1 Basics... 1 Screen Overview... 2 Tools... 5 Visibility... 5 Measure Tool... 7 Identify Tool... 10 Coordinates Tool...
Instructions for Using the Interactive Map:
 Instructions for Using the Interactive Map: Basic Overview This interactive maps displays all major active projects and permits that are processed at Snohomish County's Planning and Development Services
NorWeST ArcGIS Online Map Help Document
 Overview of the Online Map NorWeST ArcGIS Online Map Help Document Sharon (Parkes) Payne November 1, 2017 There are tabs available along the left under the map name and tools in the upper left-hand corner
User Manual Mobile client User Interface Version 5.0. Powered by
 User Manual Mobile client User Interface Version 5.0 Powered by Cartographic browser Gomap 4 1 Access control 5 1.1 Public access 5 1.2 Secured access 5 1.3 Multiple applications 5 2 Organisation 6 3 Parameters
Using Mapmaker s Toolkit. In this tutorial, you will learn the following basic elements of Mapmaker s Toolkit:
 Using Mapmaker s Toolkit Mapmaker s Toolkit is a useful piece of software that allows you and your students to create customized physical, cultural and historical maps of hundreds of countries, states
FAQ & Troubleshooting
 FAQ & Troubleshooting What is the most common issue users have when using the site? Pop-Up Blocker!!! Any link external to the viewer requires a new window to be opened in the browser. See My map or report
Full Search Map Tab Overview
 FlexMLS Map Server Full Search Map Tab Overview The Full Search Map tab is a need to know module. It is accessible when you use Full Search under Search in the Main Menu tree of FlexMLS. This map can
To show toolbars, double-click in the banner at the top or click the tools icon
 8/15/2013 Welcome to Culver City s GIS Property Information Search 2.0. This instructional document provides an overview of most commonly used functionality in this streamlined, enhanced web map application.
WAIPA DISTRICT COUNCIL. Maps Online 9. Updated January This document contains an overview of IntraMaps/Maps Online version 9.
 WAIPA DISTRICT COUNCIL Maps Online 9 Updated January 2018 This document contains an overview of IntraMaps/Maps Online version 9.0 Contents Starting Maps Online... 3 Menu Bar... 4 Tools... 5 View Tab...
Minnesota Pollution Control Agency TTY or
 www.pca.state.mn.us Guidance document for the use of the MS4 Mapping Tool The Municipal Separate Storm Sewer System (MS4) Mapping Tool is an electronic mapping tool powered by Geographic Information Systems
Vizit Pro User Manual
 Vizit Pro User Manual 1 Table of Contents Vizit Pro User Manual... 1 Using Vizit Pro... 3 The Vizit Pro User Interface... 3 Toolbars... 4 File Tab Toolbar... 4 Edit Tab Toolbar... 5 Annotations Tab Toolbar...
Exercise 1: An Overview of ArcMap and ArcCatalog
 Exercise 1: An Overview of ArcMap and ArcCatalog Introduction: ArcGIS is an integrated collection of GIS software products for building a complete GIS. ArcGIS enables users to deploy GIS functionality
Biodiversity Interactive Map
 Powered by MapShare Biodiversity Interactive Map (BIM) User Tips The Biodiversity Interactive Map (BIM) is accessible via the Department of Environment and Primary Industries (DEPI) website at www.depi.vic.gov.au.
Search Results Tabs. List Tab Options
 Search Results Tabs The Search Results screen is sectioned by tabs. These tabs contain information and tools that are vital in how you configure listing information to package and sell to your clients.
COGCC GIS Online Map Tools-Intranet Site July 12, 2011
 COGCC GIS Online Map Tools-Intranet Site July 12, 2011 Table of Contents Page Section Page Section 1 Introduction 7 Clear Selection 2 Double Click 7 Buffer 2 Arrow Tip Information 8 Select within 3 Busy
in the help area and if you click on MapViewer.
 ARCTIC VIEWER INSTRUCTIONS The Arctic Viewer is an Internet mapping application built using ArcIMS by Environmental Systems Research institute (ESRI). The first time you use call up the viewer on your
SAFMC Habitat and Ecosystem Viewer
 SOUTH ATLANTIC FISHERY MANAGEMENT COUNCIL SAFMC Habitat and Ecosystem Viewer Integrating Management Resources This document provides an overview of the SAFMC Habitat and Ecosystem Viewer data sources and
Juniata County, Pennsylvania
 GIS Parcel Viewer Web Mapping Application Functional Documentation June 21, 2017 Juniata County, Pennsylvania Presented by www.worldviewsolutions.com (804) 767-1870 (phone) (804) 545-0792 (fax) 115 South
Office of Geographic Information Systems
 Office of Geographic Information Systems Print this Page Fall 2012 - Working With Layers in the New DCGIS By Kent Tupper The new version of DCGIS has access to all the same GIS information that our old
Introduction to GIS & Mapping: ArcGIS Desktop
 Introduction to GIS & Mapping: ArcGIS Desktop Your task in this exercise is to determine the best place to build a mixed use facility in Hudson County, NJ. In order to revitalize the community and take
Swan Creek BMP Retrofit Database User s Manual
 Swan Creek BMP Retrofit Database User s Manual Toledo Metropolitan Area Council of Governments Lucas County Soil and Water Conservation District September, 2012 This project was funded through the Lake
This user guide covers select features of the desktop site. These include:
 User Guide myobservatory Topics Covered: Desktop Site, Select Features Date: January 27, 2014 Overview This user guide covers select features of the desktop site. These include: 1. Data Uploads... 2 1.1
US Geo-Explorer User s Guide. Web:
 US Geo-Explorer User s Guide Web: http://usgeoexplorer.org Updated on October 26, 2016 TABLE OF CONTENTS Introduction... 3 1. System Interface... 5 2. Administrative Unit... 7 2.1 Region Selection... 7
NMCRIS Map Service Application Feature Editing
 NMCRIS Map Service Application Feature Editing Exercise goal: Users will edit the polygonal boundaries for activities and resources in the NMCRIS Map Service. Important: This exercise is a sample presentation
Map Direct Lite. Contents. Quick Start Guide: Map Navigation 8/17/2015
 Map Direct Lite Quick Start Guide: Map Navigation 8/17/2015 Contents Quick Start Guide: Map Navigation... 1 Map Navigation in Map Direct Lite.... 2 Pan the Map by Dragging It.... 3 Zoom the Map In by Dragging
Step by Step How to Manual
 www.quintewestmaps.com Step by Step How to Manual Click on to accept the disclaimer and go to the web GIS Step by Step Web Based GIS Interface Layout of Web Based GIS Save your Favorite Map Views Link
BC Spatial Member Map Viewer. Version 2.0. User Guide. May 2015
 BC Spatial Member Map Viewer Version 2.0 User Guide May 2015 1 P a g e Revised: 16 June 2015 Contents Contents... 2 Introduction... 4 System Requirements... 5 BC Spatial Map Viewer... 6 I. Navigation Tools...
LeeSpInS 2.0 Help Guide
 LeeSpInS 2.0 Help Guide http://leegis.leegov.com/leespins/ E-mail us at gis@leegov.com with any questions or issues using this site Navigation Tools Pan arrows scroll the map in the arrow direction or
Geographical Information Systems Institute. Center for Geographic Analysis, Harvard University. LAB EXERCISE 1: Basic Mapping in ArcMap
 Harvard University Introduction to ArcMap Geographical Information Systems Institute Center for Geographic Analysis, Harvard University LAB EXERCISE 1: Basic Mapping in ArcMap Individual files (lab instructions,
Getting Started with the NH Stone Wall Mapper January 2019
 Getting Started with the NH Stone Wall Mapper January 2019 Stone walls are significant cultural and historical features of the New England landscape. Creating a statewide inventory of existing stone walls
INTERACTIVE MAP TUTORIAL
 Wisconsin Breeding Bird Atlas II INTERACTIVE MAP TUTORIAL General Information There are two versions of the map, the PC Desktop Version, and the Mobile/Mac Version. Most of this guide will assume you are
Microsoft Visio 2010: An Introduction
 Microsoft Visio 2010: An Introduction This document provides an introduction to using Microsoft Visio 2010. Microsoft Visio is software designed to translate complex information from text and tables into
Map Viewer User Guide. January 2018
 January 2018 Revision History Map Viewer 3.0.1 Revision Date Author / Reviewer Description of Changes 1 April 6, 2017 RWE Addition of Known Issues, format changes. 2 April 11, 2017 RWE Revision for PROD
U N I V E R S I T Y O F K E N T U C K Y. efacts 2-click Interactive Building Information Map ~ Help Guide ~ Revised January 20, 2016
 U N I V E R S I T Y O F K E N T U C K Y efacts 2-click Interactive Building Information Map ~ Help Guide ~ Revised January 20, 2016 Contents BUILDING SEARCH... 3 A. FIND A CAMPUS LOCATION... 3 GRAPHICAL
All data is in Universal Transverse Mercator (UTM) Zone 6 projection, and WGS 84 datum.
 Zone 6 projection, and WGS 84 datum.") 111 Mulford Hall, College of Natural Resources, UC Berkeley (510) 643-4539 EXPLORING MOOREA DATA WITH QUANTUM GIS In this exercise, you will be using an open-source FREE GIS software, called Quantum GIS,
111 Mulford Hall, College of Natural Resources, UC Berkeley (510) 643-4539 EXPLORING MOOREA DATA WITH QUANTUM GIS In this exercise, you will be using an open-source FREE GIS software, called Quantum GIS,
IHS Enerdeq Desktop International Training Guide
 IHS > Decision Support Tool IHS Enerdeq Desktop International Training Guide May 2009 Version 1.5.2 2009 IHS, All Rights Reserved. All trademarks belong to IHS or its affiliated and subsidiary companies,
City of Richmond Interactive Map (RIM) User Guide for the Public
 User Guide for the Public") Interactive Map (RIM) User Guide for the Public Date: March 26, 2013 Version: 1.0 3479477 3479477 Table of Contents Table of Contents Table of Contents... i About this
Interactive Map (RIM) User Guide for the Public Date: March 26, 2013 Version: 1.0 3479477 3479477 Table of Contents Table of Contents Table of Contents... i About this
A Practical Guide to Using QGIS
 A Practical Guide to Using QGIS 1.1 INTRODUCTION Quantum GIS (QGIS) is a useful mapping software that enables the compilation and displaying of spatial data in the form of a map. Gaining experience in
Climate-Smart New Orleans
 Climate-Smart New Orleans Table of Contents GETTING THERE... 2 Accessing the site... 2 Logging into the site... 2 Navigating the Map... 2 Zoom & Pan... 2 Change the map background... 3 Interacting in the
Help Guide Rev
 Help Guide Rev. 1.0 07152014 Home Page The home page displays your vehicle(s) on a satellite map. The information box, showing vehicle information will already be opened. The information box displays your
The following instructions cover how to edit an existing report in IBM Cognos Analytics.
 IBM Cognos Analytics Edit a Report The following instructions cover how to edit an existing report in IBM Cognos Analytics. Navigate to Cognos Cognos Analytics supports all browsers with the exception
Tutorial 01 Quick Start Tutorial
 Tutorial 01 Quick Start Tutorial Homogeneous single material slope No water pressure (dry) Circular slip surface search (Grid Search) Intro to multi scenario modeling Introduction Model This quick start
Census Small Area Population Statistics (SAPS) A Guide to using the SAPMAP web application
 A Guide to using the SAPMAP web application") Census Small Area Population Statistics (SAPS) A Guide to using the SAPMAP web application 1 When you open the application you will see this page. This screen gives a brief description of the application.
Census Small Area Population Statistics (SAPS) A Guide to using the SAPMAP web application 1 When you open the application you will see this page. This screen gives a brief description of the application.
Manitowoc County, WI Advanced Access GIS Viewer User Documentation
 Manitowoc County, WI Advanced Access GIS Viewer User Documentation Introduction Extensive time was put into developing this website both from a display, and from a printing and scaling perspective. This
Map Direct Lite. Quick Start Guide: Search Results 05/14/2018
 Map Direct Lite Quick Start Guide: Search Results 05/14/2018 Contents Quick Start Guide: Search Results... 1 Search Results in Map Direct Lite.... 2 Where is the Search Results Panel?... 3 Search Result
Step by Step GIS. Section 1
 Step by Step GIS Section 1 Contact the web page given below for the data required to do the exercises (http://www.pasda.psu.edu/default.asp) Before beginning the tutorials please visit the Preparation
User Guide. ExploreHRM ICT BIDS. 0 P a g e
 User Guide ICT BIDS 0 P a g e Contents Introduction... 2 Top Left Panel Navigation and Search Widgets... 3 Search... 3 Zoom In/Out... 3 Home... 3 Zoom Extent... 3 Right Panel Information and Print Widgets...
How To Guide for Using Maryland Incentive Zone Interactive Map
 How To Guide for Using Maryland Incentive Zone Interactive Map http://www.dhcd.state.md.us/gis/revitalize/index.html Purpose This How To guide is intended to: Determine if addresses are located within
PLATE TECTONICS DATA VIEWER Developed by Claudia Owen and Eric Sproles
 PLATE TECTONICS DATA VIEWER Developed by Claudia Owen and Eric Sproles What is a Data Viewer? A data viewer is a program to view maps on the Internet that were generated by a Geographic Information System
Citizens MapViewer User Manual
 Citizens MapViewer User Manual This guide has been designed with step-by-step instructions to help familiarize you with using the city s Citizens MapViewer. Each of the controls (menus and buttons) is
Undo Button Clicking this tool will undo the last action. Clicking on this tool multiple times will undo all subsequent changes that were made.
 SMS Featured Icons: Editor Window This document includes a brief description of the tools in the SMS Desktop Software Editor windows, as well as showing you the toolbar shortcuts to easily access these
Revision History. Last saved by: Leanne Mowat. Last save time: 1/25/2019 3:39 PM. Revision Date Author Description
 Revision History Last saved by: Leanne Mowat Last save time: 1/25/2019 3:39 PM Revision Date Author Description 0.1 2018-12-18 Leanne Mowat Initial version 0.2 2019-01-11 Leanne Mowat Updated the Register
4. If you are prompted to enable hardware acceleration to improve performance, click
 Exercise 1a: Creating new points ArcGIS 10 Complexity: Beginner Data Requirement: ArcGIS Tutorial Data Setup About creating new points In this exercise, you will use an aerial photograph to create a new
Interwrite Workspace v. 8.7 Intermediate Technology Integration Center
 Interwrite Workspace v. 8.7 Intermediate The Toolbar... 2 Moving the Toolbar... 2 Resizing the Toolbar... 2 Toolbar Settings... 2 Enable the K-6 Toolbar... 2 Enable Properties with Right Click... 2 Customized
HBS Training - IT Solutions. PlanWeb. Intermediate
 HBS Training - IT Solutions PlanWeb Intermediate CONTENTS Logging on to the system...3 The PlanWeb Window...5 The Tool Bar...6 The Status Bar...6 The Map Window...6 The Information Window...7 Changing
In this exercise, you will convert labels into geodatabase annotation so you can edit the text features.
 Instructions: Use the provided data stored in a USB. For the report: 1. Start a new word document. 2. Follow an exercise step as given below. 3. Describe what you did in that step in the word document
Getting Started with the NH Coastal Viewer March, 2015, v0
 Getting Started with the NH Coastal Viewer March, 2015, v0 The NH Coastal Viewer contains a comprehensive user interface with many tools and functions. This document summarizes some of the basic site functionality,
BDM s Annotation User Guide
 ETS :Foothill De Anza CC District April 17, 2014 1 BDM s Annotation User Guide Users with Read/Write access can annotate (markup) documents if they retrieve the document using Microsoft s Internet Explorer
MAP ASPEN Training Manual. Navigate back to City of Aspen Home, GIS Home, Map Aspen Home or the Data Catalog from any page in the site.
 Home Page Features: Top Navigation Bar MAP ASPEN Training Manual Navigate back to City of Aspen Home, GIS Home, Map Aspen Home or the Data Catalog from any page in the site. Search Bar Search for all content
I. An Intro to ArcMap Version 9.3 and 10. 1) Arc Map is basically a build your own Google map
 Arc Map is basically a build your own Google map") I. An Intro to ArcMap Version 9.3 and 10 What is Arc Map? 1) Arc Map is basically a build your own Google map a. Display and manage geo-spatial data (maps, images, points that have a geographic location)
I. An Intro to ArcMap Version 9.3 and 10 What is Arc Map? 1) Arc Map is basically a build your own Google map a. Display and manage geo-spatial data (maps, images, points that have a geographic location)
User Guide Android App. Get the most out of the MapItFast app on your Android device with this user guide.
 User Guide Android App Get the most out of the MapItFast app on your Android device with this user guide. Last Updated: January 2017 Disclaimer The use of GPS devices, tablets and smartphones with MapItFast
Welcome to the Rainfall Atlas of Hawai i interactive map!
 Welcome to the Rainfall Atlas of Hawai i interactive map! This guide will walk you through all of the capabilities of the interactive map so that you can make the most of all it has to offer. Conditions
HBS Training - IT Solutions. PlanWeb. Introduction
 HBS Training - IT Solutions PlanWeb Introduction CONTENTS Logging on to the system...3 The PlanWeb Window...5 The Tool Bar...6 The Status Bar...6 The Map Window...6 The Information Window...7 Changing