Introduction 3. Why LUCIA BI? 3 Before You Start 4. Does LUCIA BI Require an Internet Connection? 4 Getting StartedI 5
|
|
|
- Shannon Sharp
- 6 years ago
- Views:
Transcription

1 User s Guide
2 2 Contents Introduction 3 Why LUCIA BI? 3 Before You Start 4 Does LUCIA BI Require an Internet Connection? 4 Getting StartedI 5 Logging in for the first time 5 Retrieving forgotten password 6 Changing your password 7 Getting to know the user interface 8 Bookmarking dashboard views 10 Using the faceted filter navigator 11 Using the time filter 13 Indication of your selections in the filter navigator 16 Visualizing your data 18 Sales Dashboard 19 Viewing your sales performance 19 Filtering your sales data 20 Outlet Analysis 20 Accumulate Line Graph 22 Reach Dashboard 23 Viewing your outlets distribution 23 Stock Holding Dashboard 25 Viewing your inventory performance 25 Stock Movement Dashboard 29 Viewing your stock on hand 29 Fill Rate Dashboard 31 Fill Rate Value 31 Fill Rate Diagnostics Dashboard 33 Service Failure Cases 33 Interacting with your data 35 Showing the tooltip 35 Zoom in/out the charts 36 Country 36 o Region 36 Area 36 Working with the legend 37 Sorting data on any column 38 Viewing underlying data 39 Filtering views based on criteria 40 Setting number of entries per page 40 Viewing specific columns 41 Exporting 41 Installing the latest flash player 41
3 3 Introduction LUCIA BI is an on-demand business intelligence application that offers an inexpensive but powerful sales and supply chain analytics solutions. LUCIA BI provides real-time visibility across your sales and supply network - but also seamless dissemination of master data, pricing and promotions. Why LUCIA BI? Some of the reasons LUCIA BI works for you : Real-time, detailed data LUCIA's synchronisation component allows for collation of timely detailed information from your distribution centres and sites. Visibility of entire distribution network Sales and supply chain relevant data is continuously harvested and uploaded to realtime management dashboards. Manage the distribution network LUCIA facilitates disseminating the right information from your HQ down to your distribution centres or distributors. Cost-effective No capital investment. No license fees, no operating system license fees or hardware investments required. Practical Built by operators for operators. Best practices applied with a dose of practicality. Extensible LUCIA easily integrates into any existing Business Intelligence, analytics or reporting infrastructure that might already be in place.
4 4 Before You Start LUCIA BI collects data from virtually any source - local and third-party - exportable to a CSV format and undergoes an automation process to cleanse, normalise and integrate your data to a hosted service. Implementation process is not dependent on any IT staff. Upon implementation, you will be supplied with a login to a secure page that directly allows you the access to the data according to your level of administrative access. Does LUCIA BI Require an Internet Connection? Yes, LUCIA BI requires an active internet connection to download the most up-to-date data. For an uninterrupted browsing experience, it is recommended to have a high-speed internet connection/broadband.

5 5 Getting Started Logging in for the first time 1. Log into the LUCIA BI home page. 2. In the Username box, enter your address. 3. In the Password box, type in your password, and then click the LOG IN button. 4. Once your login is authenticated, your Home page will be displayed. Note: Username and Password are case-sensitive.
6 6 Retrieving forgotten password 1. In case you have lost/forgotten your password, click on the Forgot your password? link available at the Home page. 2. On the subsequent screen, enter the address with which your LUCIA BI account had been set up. 3. You will be getting an with a link to change your password. 4. Enter your new password in the Password box. 5. Confirm your new password in the Confirm Password box, and then click the Reset button. Note: The you will be receiving will be sent from cot.notification@lcalink.com. You may want to add this address to your safe list to prevent it from being labeled as Spam.
7 7 Changing your password 1. At the upper-right section of your screen, click on your username. 2. Edit your profile details by filling in the respective textboxes. 3. When you are done, click on the Update button.

8 8 Getting to know the user interface A. The User bar shows the Principal selection list, selected dashboard, switching dashboard list, and links to:, user profile, LUCIA BI blog, Control Panel, logout and internet speed indicator. To select a different dashboard, simply click on Switch Dashboard and select the corresponding tab from the drop down list. B. The X-AXIS and MEASURE measures offer different ways to view your data. Click the % icon to view percentage against selected measures. C. The faceted filter navigator enables you to set the granularity (detail level) of your selection in (B). Clicking on a filter bar shows the facets arranged side by side to show hierarchy. Click the small arrow at the bottom to hide or unhide the filter navigator. D. Title header for graph indicates selection, usually based on time. Clicking on an icon in VIEWS toggles your view of the data (table only, graph only, graph with table) E. Placing your mouse cursor over a graph displays a tooltip containing key information. F. Clicking on an x-axis label displays more information in a tabular format. G. Placing your mouse over the icon provides a brief description of your connection speed, as shown in the following image. Clicking on the

9 9 icon directs you to a web page with more details of the connection speed between your browser and the server. I n addition, dashboard preloader which appears before your dashboard loads completely is added to indicate your connection speed. As illustrated below, the color of the text is based on the connection speed between your browser and the server from which you are accessing your data.
 the respective graphs and tables on your browser, giving you a one-click button on your Bookmarks/Links")
10 10 Bookmarking dashboard views Because the dashboard user interface is customizable in all sorts of ways, each user may have a set of preferences on how he/she wants to view the data. LUCIA BI makes it easy to keep track of your important dashboard views by bookmarking (Ctrl+D) the respective graphs and tables on your browser, giving you a one-click button on your Bookmarks/Links toolbar that minimizes the hassle of having to reselect your preferences next time you access the dashboard. Bookmarking is easy. All web browsers provide this feature. 1. On your keyboard, press CTRL + D at the same time. 2. A pop-up dialog box will appear almost similar to the screenshot above (taken in IE8), depending on the web browser you use. 3. Fill in an appropriate title for the specific view you wish to bookmark. 4. It is recommended to organize your bookmarks into folders. For example, you may have a folder for your Sales dashboard with several of your more important Sales dashboard views in it and another folder for views related to your Inventory dashboard. To update your previously bookmarked dashboard views so you can navigate to your favourite dashboard views faster: 1. Edit the url from your Bookmark/Links toolbar or from the Bookmark manager. or 2. Re-capture your bookmarks once again.

 of the graph drawn below. For example, selecting AREA will break down sales figures according to respective areas, i.e. Sabah, Sarawak, Brunei, North, South, East and Central.")
11 11 Using the faceted filter navigator The faceted filter navigator is located below the X-AXIS and MEASURE selection menu. A. Facet option - Allows user to quickly select all items listed in each facet, or select none at all. The number indicator in the same gray box, for example, in the third column AREA(7/7) the numbers indicate selected items/the number of total items. B. Selecting granularity - These buttons determines the granularity (detail level) of the graph drawn below. For example, selecting AREA will break down sales figures according to respective areas, i.e. Sabah, Sarawak, Brunei, North, South, East and Central. C. Facet hierarchy - Facet lists are arranged side by side according to their respective hierarchy, arranged from left to right, e.g. Country > Region > Area > Distributor > Site > Representative. D. Sites filter based on status Allows user to filter out sites based on status (active or inactive). A site is considered inactive if the distributor no longer distributes the principal product or if the warehouse is closed. By default, all sites will be selected. E. Search Box - Type in the preferred keywords you wish to select/deselect. As you are typing in a query in the search box, you will instantaneously see the filtered results.
12 12 The faceted navigator allows user to select preferred filters (Location, Channel, Product Category) and click the SUBMIT button to load the updated graph and table. This way, user is given the ability to load their preferred dashboard view and filter out items that are irrelevant.
, yearly, monthly, weekly and daily sales figures (by clicking on the corresponding detail level")
13 13 Using the time filter Selecting one date range 1. Select x-axis detail level of choice You can select: all (treats the selected duration as one period), yearly, monthly, weekly and daily sales figures (by clicking on the corresponding detail level icons). In the example above, YEAR is selected. 2. Select date range Whenever ONE DATE RANGE is selected, the date range is automatically set to Month-to-date (1st to last day of the month). You can select date range shortcuts beside the textboxes for: a. one day b. one month (one month from today's date) c. month-to-date (1st to last day of the month) d. one year (from today's date) e. year-to-date (1st to last day of the financial year). You can also select ANY date range by clicking on the start and/or the end date textboxes. A calendar widget will be displayed to input your preferred dates as shown in the image below. Users can also type the date into the textboxes.


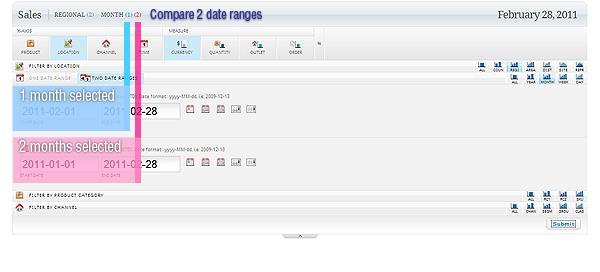
14 14 3. Click on the SUBMIT button Your screen will now reload the graph. Selecting two date ranges 1. Click on TWO DATE RANGE icon. This will automatically populate two date range fields. The 1st date range field will be set to month-to-date by default - the start date is set to the 1st day of

15 15 the current month and the end date is set to the last day of the current month. 2. The 2nd date range field will be set to year-to-date by default - the start and end dates are set to the 1st and last days of the financial year. Clicking on the MONTH-TO-DATE icon (3rd icon) will change the start and end dates to current month-to-date by default. 3. In this example, a month-to-month comparison for September and October is to be made. Use the calendar widget to set the start and end dates of the 1st date range to October 1 and October 31 and the 2 nd to September 1 and September Close the calendar widget. Then, click on ALL detail level icon in the Location filter. 5. Click on the SUBMIT button. The graph will now reload to show daily sales figures for the month of September and October.


16 16 Indication of your selections in the filter navigator This is to make it easy for you to have a glance of your current dashboard view. We have added a filter navigator selection label. Located at the header bar (blue-coloured) beside your dashboard title, the filter navigator selection label shows you your current dashboard view in this format - {primary filter detail level} {secondary filter detail level}. As you drill down a detail level, the label will now have numbers beside it to indicate the number of fully selected items for that particular level. And if you are comparing 2 date ranges, the label numbers will be colourcoded according to its date range group.
17 17
18 18 Visualizing your data Sometimes there are more effective ways to look at your data than rows in a table. For example, when your data contains monthly numerical figures, viewing the data on a graph with dots connected by lines may reveal patterns in the data that are otherwise very hard to see. LUCIA BI offers visualizations that will help you explore your data more effectively. You can switch between either of a set of view options available for comfortable viewing. Each layout view has special usage feature and can be used depending on how you view your data. In the dashboards, the following options are provided for toggling different views. The available views are (from L-R): Table only, Graph only, and Graph with table.

19 19 Sales Dashboard You use the Sales dashboard to track sales performance on a daily basis. Sales information consolidated from distributors is refreshed real-time, so sales trends are immediately revealed as well as highest and lowest sales figures by sales representatives, by product categories, or by sales channel. Sales trend is configurable to help you review based on your preferred time period. You can also compare your sales performance over two different, predetermined time periods. Viewing your sales performance Whenever you log on to LUCIA BI, the Sales dashboard loads as your starting page. Please ensure the Sales tab is highlighted.

 for each filter as per your comfortable viewing. 5.")
20 20 Filtering your sales data 1. Click on an icon on the X-AXIS selection menu. Your selection determines how you will view your graph s x-axis. 2. Notice how your selection will move the corresponding filter to the top of the faceted navigator. For example, if you select the icon labeled PRODUCT, the FILTER BY PRODUCT CATEGORY filter moves right to the top of the faceted navigator. 3. Click on an icon on the MEASURE selection menu. Your selection determines how you will view your graph s MEASURE 4. Select the granularity (detail level) for each filter as per your comfortable viewing. 5. On the facet lists, select the items you wish to view. 6. After you are done with your selection, click on the SUBMIT button to refresh the graph. Outlet Analysis 1. Find the column OUTLET COUNT in the table view.


21 21 2. Click on the OUTLET COUNT value and a table will pop up. 3. A table showing OUTLEVEL ANALYSIS will pop up. This table showed a detailed analysis of each outlet. It will tell how many orders have been made and how many have been delivered. You can track a miss sale when your DELIVERED QUANTITY is less than your ORDERED QUANTITY. 4. You may click a link at the bottom left of the pop up window. You will be redirected to the OUTLET LEVEL ANALYSIS page.

22 22 Accumulate Line Graph 1. ACCUMULATE LINE GRAPH is currently implemented only on Sales Dashboard. 2. ACCUMULATE LINE GRAPH is only enabled when x-axis is on TIME 3. You can see that the graph is always growing upwards only, this is because the graph adds up all the previous values to the current value. 4. Since Sales Dashboard have PERCENTAGE and ACCUMULATE LINE GRAPH features, only 1 of them can be enabled at one time. Please refer to Using the faceted filter navigator section for more details. It is highly recommended to utilize the filters as this affects the dashboard s loading time. The more items selected in your faceted list, the longer it will take to load your dashboard.

23 23 Reach Dashboard You use the Reach dashboard to compare your sales distribution against its monthly outlet universe coverage to measure your organization s ability to reach your current and prospective customers, within a given area. Outlet coverage is measured by the number of outlets that have ordered at least once in a user-specified time period. In a way, Reach measures the number of outlets ordering on a monthly basis. Viewing your outlets distribution 1. Click on the Reach tab. 2. Click on an icon on the X-AXIS selection menu. Your selection determines how you will view your graph s x-axis. 3. Notice how your selection will move the corresponding filter to the top of the faceted navigator. For example, if you select the icon labeled PRODUCT, the FILTER BY PRODUCT CATEGORY filter moves right to the top of the faceted navigator.
24 24 4. Select the granularity (detail level) for each filter as per your comfortable viewing. 5. On the facet lists, select the items you wish to view. 6. After you are done with your selection, click on the SUBMIT button to refresh the graph.

25 25 Stock Holding Dashboard You use the Inventory dashboard to provide you an overview of the supply chain s overall inventory performance which enables you to maintain sufficient stocks to meet market demand and achieve better balance in your warehouses between slow moving and fast moving goods, and across all distributors. Viewing your inventory performance 1. Click on the INVENTORY tab.
 b.")
26 26 2. Pick the desired date for Stock on Head using the stock on hand date selector: a. Click on the tab SOH Date, a floating date picker will display below the tab (you may click on the tab again to hide the floating date picker) b. Click on a date to confirm your selection and to reload the dashboard with updated data. You will notice the date in the tab will be updated to what you have selected. The picker enables you to look at a historical snapshot of inventory data. This is sort of like a time machine which allows inventory data to be viewed at a different date. This might be useful for someone who wants to compare inventory performance of yesterday/last week/2 months ago to that of today. By default, the Inventory dashboard captures current day s Stock on hand. 3. Click on an icon in the X-AXIS selection menu. 4. Notice how your selection will move the corresponding filter to the top of the faceted navigator. For example, if you select the icon labeled PRODUCT, the FILTER BY PRODUCT CATEGORY filter moves right to the top of the faceted navigator.
 b.")

27 27 5. Select the sales period using the sales period date range selector: a. Click on the tab SALES PERIOD, a floating panel will display below the tab (you may click on the tab again to hide the floating panel) b. Click on the 'start date' inputbox to display the date picker c. Click on the 'end date' inputbox to display the date picker d. Click on the DONE button to confirm your selection and to reload the dashboard with updated data. You will notice that the date range in the tab will be updated to what you have selected. 6. Select the granularity (detail level) for each filter as per your comfortable viewing. 7. In the product category filter, product status provide additional options to filter your SKU items. Available options are Active, To be discontinued, Discontinued, Inactive. By default, Active is only selected. 8. On the facet lists, select the items you wish to view. 9. After you are done with your selection, click on the SUBMIT button to refresh the graph. The Inventory dashboard introduces the 'traffic light' system based on target tolerance settings. For example, Region A s ideal target day range is days. In this scenario, SKU-sites which fall within the range are labeled as Ideal(green), below range as Under(red), and above as Over(yellow).
 to drill down")
28 Click on the underlined numerical figures (in %) to drill down your data to show a list of SKU-site in tabular format.
, and how many stocks sold each day (Sales). Viewing your stock on hand 1. Click on the Stock Movement tab 2.")
29 29 Stock Movement Dashboard You use the stock movement dashboard to monitor your stock on hand by week, month, or year. On a daily basis, you can view the stocks you have on hand, new incoming stocks (Received), and how many stocks sold each day (Sales). Viewing your stock on hand 1. Click on the Stock Movement tab 2. Click on an icon on the MEASURE selection menu. Your selection determines how you will view your graph s MEASURE.
30 30 3. Select the granularity (detail level) for each filter as per your comfortable viewing. 4. On the facet lists, select the items you wish to view. 5. After you are done with your selection, click on the SUBMIT button to refresh the graph.

31 31 Fill Rate Dashboard Fill Rate Value You use the fill rate dashboard to keep track of each of your sales order item whether it is full fill or not based on the original sales order. When this condition is met, it is call In-Full. The On-Time is to keep track of sales order created date and delivery date. If the order arrived within 3 days or less, it is considered On-Time. When both In-Full and On-Time condition is full fill then it is considered as On-Time-In-Full which in short is called OTIF. 1. FILL RATE is measured by TIME only in the x-axis

32 32 2. Click on an icon on the MEASURE selection menu. Your selection determines how you will view your graph s MEASURE. 3. FR VALUE will use the total sales value if it is full fill. 4. FR LINE will compare quantity, but if full fill it will consider 1 else FR ORDER keeps track based on each order. It checks whether the order is full fill and on time or not. 6. You can select multiple measures by performing Ctrl+Click on your selected measures, 2 at a time: a. Click on the tab TIME to pick your x-axis. b. Then click on either FR VALUE, FR LINE or FR ORDER and perform Ctrl+Click on any other Measure that you want to select in order to view multiple graph of both.

33 33 Fill Rate Diagnostics Dashboard You use the fill rate diagnostics dashboard to monitor your service failure. This dashboard is linked with Fill Rate, it analyzes the reason behind the failure to full fill the condition of In-Full or On-Time. This is to help you identify the main cause of your service failure and improve on it. Service Failure Cases 1. FILL RATE DIAGNOSTICS can be monitored against 2 measures which are CURRENCY or QUANTITY, one at a time.
34 34 2. There can be 4 types of service failure cases: i. Stock Allocation Confirmed Quantity < Ordered Quantity ii. Inventory Management Confirmed Quantity < Picked Quantity iii. Despatched Picked Quantity < Packed Quantity iv. Received Packed Quantity < Received Quantity

35 35 Interacting with your data There are many ways that you can interact with the widgets in the dashboards to help analyze your data. These include: Showing the tooltip Zoom in/out the charts Working with the legend Sorting data on any column Viewing underlying data Filtering views based on criteria Setting number of entries per page Viewing specific columns Exporting Each of these is described below: Showing the tooltip Graphs provide a way to reveal patterns of your data points. Tooltips supplement graphs with quick information to help you analyze your data. Place your mouse over a graph and the relevant information will display in a box as shown in the above graph.

36 36 Zoom in/out the charts This is a quick way to drill down and analyze a specific set of data. To start using this feature, all you need to do is click on a graph. A context menu will appear next to your mouse cursor. This feature will only affect your main filter navigator; your secondary filter navigator will remain fixed. In the zoom-in example below, location is set as x-axis and the hierarchy is as follows: Country o Region Area Figure 1. View by Country. Click on the graph to view all Regions in that country
, click on any graph and select 'Zoom out'.")

37 37 Figure 2. View by Region. Click on the East graph to view all Areas within East. Figure 3. View by Area. To return to previous view (Region), click on any graph and select 'Zoom out'. Working with the legend Graphs that display more than one series will display a legend to help you keep track of the elements. When the graph loads, the legend is located at the right side of the graph The legend can be hidden by ticking on the legend checkbox on top.


38 38 You can also click on a legend item(s) to instantly hide it from the chart. The MEASURE will scale to the remaining visible legend items once an item is hidden, as shown in the following image. Sorting data on any column LUCIA BI lets you sort data on any column in your table.


39 39 You can click on a column header and apply the appropriate sort option. The table also supports multiple column sorting. To enable it, press & hold on to the SHIFT in your keyboard, and click on the column headers you wish to sort. Viewing underlying data Want to drill down and find out a more detailed representation? LUCIA BI offers a few ways for you to click on a relevant data point and see the underlying data. On the graph Clicking on an x-axis label displays a table with more information about the clicked data point. On the table

40 40 As seen in the Inventory dashboard, there are numerical figures in the table that are underlined. Clicking on it displays another table relevant to the numerical figure clicked. Filtering views based on criteria LUCIA BI provides a filter tool in the table to create dynamic views based on your criteria selection. 1. Click on the magnifying lens icon. A Filter row will appear. 2. Select from the dropdown list the criteria you wish to filter. Different criteria will provide for a different combination of input. For example, for columns that contain numerical data, an additional dropdown list will appear to enable you to select an operator to filter your data with. Setting number of entries per page To help view a set of data in your table comfortably, you can set the number of rows a table should show per page.


41 41 Viewing specific columns Show or hide specific columns in your table to help you compare the data that is relevant for you. Exporting Tables can be exported into Excel and saved as a CSV format. Click on an icon to save the data in the table into the selected format you wish. Installing the latest flash player The export feature requires the latest Flash Player installed on your machine. Installing it is easy, follow the steps below and you are on your way to exporting your data in no time.

42 42 If you do not have the Flash installed, or if your Flash version is not the latest, you will encounter a message, Install latest flash. Click on the message to get an express installation of the latest Flash Player. Once the installation is done, close your web browser. When you re-open the browser, go back to your dashboard home page and click on the table. You will be able to see the two icon options: Save to.csv and.xls formats. This function is not supported by Internet Explorer.
43 43 Thank You For Using LUCIA BI
InView 5 User Guide v 1.8
 InView 5 User Guide v 1.8 Tushar Bhamare Version 1.0 05-May-2017 Contents 1 Introduction... 4 2 Overview... 5 3 Sitemap and Navigation... 7 4 General... 8 4.1 Access Inview... 8 4.2 Customer, Hub and Client
Product Documentation SAP Business ByDesign August Analytics
 Product Documentation PUBLIC Analytics Table Of Contents 1 Analytics.... 5 2 Business Background... 6 2.1 Overview of Analytics... 6 2.2 Overview of Reports in SAP Business ByDesign... 12 2.3 Reports
User Interface Document version
 User Interface Document version 1.6 2018 Table of contents 1 General information 1.1 General technical remarks 1.2 User interface composition 1.3 Profile settings 1.4 Structure of the main menu 2 User
CHRIS Introduction Guide
 1 Introduction... 3 1.1 The Login screen... 3 1.2 The itrent Home page... 5 1.2.1 Out of Office... 8 1.2.2 Default User Preferences... 9 1.2.3 Bookmarks... 10 1.3 The itrent Screen... 11 The Control Bar...
PRISM - FHF The Fred Hollows Foundation
 PRISM - FHF The Fred Hollows Foundation ANALYTICAL INTERFACE USER MANUAL Version 1.1 TABLE OF CONTENTS INTRODUCTION... 6 OVERVIEW... 6 THE FHF-PRISM LOGIN SCREEN... 8 LOGGING INTO THE FHF-PRISM... 8 RECOVERING
USER GUIDE. Document ID: D. Abbott Point of Care Inc. Abbott Park, IL 60064
 USER GUIDE Document ID: 732029-00D Abbott Point of Care Inc. Abbott Park, IL 60064 This page intentionally left blank. Table of Contents Preface 1 1 - Getting started 1-1 1.1 Point-of-Care testing (POCT)
RITIS Training Module 9 Script
 RITIS Training Module 9 Script Welcome to the Regional Integrated Information System or RITIS Module 09 CBT. To begin, select the start button or press Shift+N on your keyboard. This training module will
 www.insightsoftware.com for JD Edwards World and EnterpriseOne Version: 2.1 Last Updated: August 31, 2011 Contents 1. Introduction... 4 Welcome... 4 Using this Guide... 4 2. The Console Interface... 5
Nintex Reporting 2008 Help
 Nintex Reporting 2008 Help Last updated: Thursday, 24 December 2009 1 Using Nintex Reporting 2008 1.1 Chart Viewer Web Part 1.2 Importing and Exporting Reports 1.3 Import Nintex report page 1.4 Item Level
UBS-SFA Online. User guide. Page 1 of 36
 UBS-SFA Online User guide Page 1 of 36 Contents 1. Introduction... 3 2. Logging in... 4 2.1 How to log in... 4 2.2 Changing the PIN on your token... 4 3. Finances Check on your portfolio(s) and assets...
QUICK START GUIDE. Welcome to EDGAR Pro, your access to SEC filings and more! We ve created this user guide to facilitate your use of this service.
 Welcome to EDGAR Pro, your access to SEC filings and more! We ve created this user guide to facilitate your use of this service. If at any point you need additional assistance, contact our Customer Support
Customer Relationship Management Software Version 1.0. Administrator Guide Guide Version ITarian 1255 Broad Street Clifton, NJ 07013
 Customer Relationship Management Software Version 1.0 Administrator Guide Guide Version 1.0.111218 ITarian 1255 Broad Street Clifton, NJ 07013 Table of Contents 1. Introduction to CRM...5 1.1.Open the
Propel PRO User Guide
 Propel PRO User Guide Propel PRO Version 3.2.0a Page 1 Welcome to the latest version of Propel PRO which offers fast performance and easy navigation. Please refer to this user guide for common features
Business Online Banking User Guide
 Business Online Banking User Guide Table of Contents Contents Overview... 2 Logging In... 2 Additional Login Information... 5 Home/Dashboard... 6 Top Line Tool Bar... 6 Bulletins... 7 Dashboard... 8 Accounts...
TDNet Discover User Manual
 TDNet Discover User Manual 2014 Introduction Contents 1 Introduction... 3 1.1 TDNet Discover... 3 1.2 TDNet Index... 3 1.3 Personalization... 3 1.4 TDNet Widgets... 4 2 Logging In... 5 2.1 Browsing without
ACTIVE Net Insights user guide. (v5.4)
") ACTIVE Net Insights user guide (v5.4) Version Date 5.4 January 23, 2018 5.3 November 28, 2017 5.2 October 24, 2017 5.1 September 26, 2017 ACTIVE Network, LLC 2017 Active Network, LLC, and/or its affiliates
ACTIVE Net Insights user guide (v5.4) Version Date 5.4 January 23, 2018 5.3 November 28, 2017 5.2 October 24, 2017 5.1 September 26, 2017 ACTIVE Network, LLC 2017 Active Network, LLC, and/or its affiliates
Creating Dashboard Widgets. Version: 16.0
 Creating Dashboard Widgets Version: 16.0 Copyright 2017 Intellicus Technologies This document and its content is copyrighted material of Intellicus Technologies. The content may not be copied or derived
SPS COMMERCE UNIVERSAL CATALOG FOR RETAILERS
 SPS COMMERCE UNIVERSAL CATALOG FOR RETAILERS 2 Table of Contents WELCOME... 2 ITEM SEARCH... 3 CATALOGS...14 SCHEDULES...18 BASKET...34 Welcome Welcome to the SPS Commerce Universal Catalog Service. The
Using the Style Scope App
 Using the Style Scope App The following sections explain how to use dashboards on an Android device. 1 of 1269 Installing the Style Scope App To install the Style Scope app on your Android tablet, follow
FactSet Quick Start Guide
 FactSet Quick Start Guide Table of Contents FactSet Quick Start Guide... 1 FactSet Quick Start Guide... 3 Getting Started... 3 Inserting Components in Your Workspace... 4 Searching with FactSet... 5 Market
RONA e-billing User Guide
 RONA e-billing Contractor Self-Service Portal User Guide RONA e-billing User Guide 2015-03-10 Table of Contents Welcome to RONA e-billing What is RONA e-billing?... i RONA e-billing system requirements...
TECHNOLOGY TRAINING PROGRAM. Supplier Decision Support System. User Manual
 TECHNOLOGY TRAINING PROGRAM Supplier Decision Support System User Manual PREREQUISITE(S) A basic knowledge of Internet Explorer is recommended. You should be familiar with terms such as Address Bar, Hyperlink,
Production Assistance for Cellular Therapies (PACT) PACT Application System User s Guide
 PACT Application System User s Guide") Production Assistance for Cellular Therapies (PACT) PACT Application System User s Guide Version 1.0 February 9, 2017 Version 1.0 TABLE OF CONTENTS 1.0 Getting Started... 1 1.1 Access to the Internet...
Production Assistance for Cellular Therapies (PACT) PACT Application System User s Guide Version 1.0 February 9, 2017 Version 1.0 TABLE OF CONTENTS 1.0 Getting Started... 1 1.1 Access to the Internet...
ScholarOne Manuscripts. COGNOS Reports User Guide
 ScholarOne Manuscripts COGNOS Reports User Guide 1-May-2018 Clarivate Analytics ScholarOne Manuscripts COGNOS Reports User Guide Page i TABLE OF CONTENTS USE GET HELP NOW & FAQS... 1 SYSTEM REQUIREMENTS...
Bill Analyser User Guide
 Bill Analyser User Guide emobile.ie/business Contents 1.0 Basic Concepts... 3 1.1 Users and Roles... 3 Standard Users... 3 Global Users... 3 eircom User Roles... 3 Available user roles... 3 1.2 Data Structure...
Visual Insights system
 Visual Insights system Supplier User Guide Packaged (Pick by store) version Date: September 2016 1 Contents Visual Insights system... 1 Supplier User Guide... 1 Grocery version... 1 1.0 Overview and Purpose...
This guide provides information to help you learn about navigating your way through the itrent Human Resources Management and Payroll system.
 1 Introduction The software system that holds and maintains employment and payroll information for staff at the University of Cambridge is called itrent. The project to bring about changes regarding access
My Sysco Reporting Job Aid for CMU Customers. My Sysco Reporting. For CMU Customers (Serviced by Program Sales)
") My Sysco Reporting For CMU Customers (Serviced by Program Sales) 1 Accessing My Sysco Reporting... 2 Logging In... 2 The Reporting Dashboard... 3 My Sysco Reporting Process... 6 Generating a Report...
My Sysco Reporting For CMU Customers (Serviced by Program Sales) 1 Accessing My Sysco Reporting... 2 Logging In... 2 The Reporting Dashboard... 3 My Sysco Reporting Process... 6 Generating a Report...
ClientNet Admin Guide. Boundary Defense for
 ClientNet Admin Guide Boundary Defense for Email DOCUMENT REVISION DATE: Feb 2012 ClientNet Admin Guide / Table of Contents Page 2 of 36 Table of Contents OVERVIEW... 3 1 INTRODUCTION... 3 1.1. AUDIENCE
you choose and by the roles the users are allowed to fulfill within the system. Finances Enter the monthly savings and costs for the project.
 Oracle Instantis EnterpriseTrack Quick Reference Guide for Release 8.5 Create a Proposal From the Top Navigation Bar, click Create Proposals/Charters. Enter all the required fields and click Save to save
Altus Call Recording. Dashboard Admin User Guide. Document Version Maryland Way, Suite 300 Brentwood, TN Tel
 Altus Call Recording Dashboard Admin User Guide Document Version 1.3 5121 Maryland Way, Suite 300 Brentwood, TN 37027 Tel +1 615.465.4001 WWW.ALTUSUC.COM Table of Contents About This Document... 5 1.1
New BoundTree.com User Guide Fall Version 6
 New BoundTree.com User Guide Fall 2016 Version 6 Table of Contents Overview Navigating the Home Page Creating an Account Logging into an Existing Account Forgot Your Password? Reviewing Your Account Editing
ASTRA USER GUIDE. 1. Introducing Astra Schedule. 2. Understanding the Data in Astra Schedule. Notes:
 ASTRA USER GUIDE 1. Introducing Astra Schedule Astra Schedule is the application used by Academic Space Scheduling & Utilization to schedule rooms for classes and by academic colleges, schools, and departments
VIEWER LICENSE GUIDE FOR SERVICEPOINT 5X
 ADVANCED REPORTING TOOL (ART 3X) VIEWER LICENSE GUIDE FOR SERVICEPOINT 5X 2012 Bowman Systems L.L.C. All Rights Reserved. This document and the information contained herein are the property of Bowman Systems
Customer Relationship Management Software Version 1.0
 Customer Relationship Management Software Version 1.0 Administrator Guide Guide Version 1.0.111218 Comodo Security Solutions 1255 Broad Street Clifton, NJ 07013 Table of Contents 1. Introduction to CRM...5
PRISM - FHF The Fred Hollows Foundation
 PRISM - FHF The Fred Hollows Foundation MY WORKSPACE USER MANUAL Version 1.2 TABLE OF CONTENTS INTRODUCTION... 4 OVERVIEW... 4 THE FHF-PRISM LOGIN SCREEN... 6 LOGGING INTO THE FHF-PRISM... 6 RECOVERING
Luxor CRM 2.0. Getting Started Guide
 Luxor CRM 2.0 Getting Started Guide This Guide is Copyright 2009 Luxor Corporation. All Rights Reserved. Luxor CRM 2.0 is a registered trademark of the Luxor Corporation. Microsoft Outlook and Microsoft
Load Watch SM Distributed Resources System Operations Center
 DTE Energy Generator and Energy Monitoring Services Load Watch SM Distributed Resources System Operations Center Users Guide V.8 March 00 For Technical Support or Questions Call --5-5590 Log-in Screen
Group Administrators
 Hosted VoIP Phone System Blue Platform Admin Portal Guide for Group Administrators Table of Contents 1 About this Guide... 6 2 Accessing the Hosted VoIP Phone System Admin Portal... 7 3 Hosted VoIP Admin
PowerPlay Studio. User Documentation
 PowerPlay Studio User Documentation June 2013 POWERPLAY STUDIO PowerPlay Studio... 1 Supported browsers... 1 Logging On... 2 The Cognos Table of Contents... 3 Working in PowerPlay Studio... 5 Open a Cube...
Style Report Enterprise Edition
 INTRODUCTION Style Report Enterprise Edition Welcome to Style Report Enterprise Edition! Style Report is a report design and interactive analysis package that allows you to explore, analyze, monitor, report,
Teaching and Learning Dashboard Guide
 Teaching and Learning Dashboard Guide Contents Introduction... 2 Dashboard Basics... 3 How to use the University of Manchester Teaching and Learning Dashboard... 11 NSS Overview... 11 To filter:... 12
DASHBOARD PERFORMANCE INDICATOR DATABASE SYSTEM (PIDS) USER MANUAL LIBERIA STRATEGIC ANALYSIS TABLE OF CONTETABLE OF CONT. Version 1.
 USER MANUAL LIBERIA STRATEGIC ANALYSIS TABLE OF CONTETABLE OF CONT. Version 1.") UNITED STATES AGENCY FOR INTERNATIONAL DEVELOPMENT TABLE OF CONTETABLE OF CONT PERFORMANCE INDICATOR DATABASE SYSTEM (PIDS) LIBERIA STRATEGIC ANALYSIS DASHBOARD USER MANUAL Version 1.0 PERFORMANCE INDICATOR
UNITED STATES AGENCY FOR INTERNATIONAL DEVELOPMENT TABLE OF CONTETABLE OF CONT PERFORMANCE INDICATOR DATABASE SYSTEM (PIDS) LIBERIA STRATEGIC ANALYSIS DASHBOARD USER MANUAL Version 1.0 PERFORMANCE INDICATOR
Supplier SAP SNC User Guide
 Supplier SAP SNC User Guide Version 1.0 July 29, 2014 AGCO Corporation Page 1 1 Introduction AGCO has chosen SAP Supplier Network Collaboration (SNC) to improve visibility and capability in North America
Wise Technologies Ltd.,
 User manual Wise Timetable online system Wise Technologies Ltd., In front of you is a short document for all the users and administrators of Wise Timetable, describing the important part of the whole system:
OBIEE. Oracle Business Intelligence Enterprise Edition. Rensselaer Business Intelligence Finance Author Training
 OBIEE Oracle Business Intelligence Enterprise Edition Rensselaer Business Intelligence Finance Author Training TABLE OF CONTENTS INTRODUCTION... 1 USER INTERFACE... 1 HOW TO LAUNCH OBIEE... 1 TERMINOLOGY...
Inventory Module & Wireless Device. User Quick Start Guide
 Inventory Module & Wireless Device User Quick Start Guide Published on: 3/14/2007 Copyright and Disclaimer Copyright 2007 Pace Systems Group, Inc., 1902 2 nd Avenue North, Jacksonville Beach, Florida,
3.2 Circle Charts Line Charts Gantt Chart Inserting Gantt charts Adjusting the date section...
 / / / Page 0 Contents Installation, updates & troubleshooting... 1 1.1 System requirements... 2 1.2 Initial installation... 2 1.3 Installation of an update... 2 1.4 Troubleshooting... 2 empower charts...
Comodo Customer Relationship Management Software Version 1.0
 Comodo Customer Relationship Management Software Version 1.0 Administrator Guide Guide Version 1.0.082417 Comodo Security Solutions 1255 Broad Street Clifton, NJ 07013 Table of Contents 1. Introduction
USER MANUAL. TapCRM TABLE OF CONTENTS. Version: 1.4
 USER MANUAL TABLE OF CONTENTS Introduction... 1 Benefits of TapCRM... 1 Prerequisites... 1 Installation & Configuration... 2 TapCRM Plug-in Installation... 2 Front Side Instructions... 9 Contact Us...
Wholesale Lockbox User Guide
 Wholesale Lockbox User Guide August 2017 Copyright 2017 City National Bank City National Bank Member FDIC For Client Use Only Table of Contents Introduction... 3 Getting Started... 4 System Requirements...
INTRODUCTION. InetSoft Mobile App
 INTRODUCTION InetSoft Mobile App Welcome to the InetSoft mobile app! The mobile app allows you to easily access your dashboards on your tablet or phone. This document explains how to configure and use
Tabular Building Template Manager (BTM)
") Tabular Building Template Manager (BTM) User Guide IES Vi rtual Environment Copyright 2015 Integrated Environmental Solutions Limited. All rights reserved. No part of the manual is to be copied or reproduced
Tabular Building Template Manager (BTM) User Guide IES Vi rtual Environment Copyright 2015 Integrated Environmental Solutions Limited. All rights reserved. No part of the manual is to be copied or reproduced
Version Operator Orientation. TIMMS Client. A guide to using the TIMMS System. Training & Navigation Notes
 Version 7.2.4 Operator Orientation TIMMS Client A guide to using the TIMMS System Training & Navigation Notes Disprax Pty Ltd 2015 WHAT IS TIMMS? TIMMS Stands for: Total Industry Management and Marketing
Batch Scheduler. Version: 16.0
 Batch Scheduler Version: 16.0 Copyright 2018 Intellicus Technologies This document and its content is copyrighted material of Intellicus Technologies. The content may not be copied or derived from, through
VEDATRAK CRM 3.0. User Guide
 VEDATRAK CRM 3.0 User Guide 2 (C) 2006-2012 SUI SOLUTIONS Ltd. All rights reserved. 3 Contents Overview...9 System Requirements...12 Installation Notes...13 Vedatrak Basics...14 User Roles...14 System
Copyrights and Trademarks. Copyrights and Trademarks. Sage One Invoicing Getting Started Guide 1
 Copyrights and Trademarks Copyrights and Trademarks Sage One Invoicing Getting Started Guide 1 Copyrights and Trademarks Copyright 2002-2017 by Us. We hereby acknowledge the copyrights and trademarks of
Getting Started with EMS Desktop Client
 Getting Started with EMS Desktop Client Getting Started with EMS Desktop Client What is the EMS Desktop Client? Reservations and Bookings What is an Everyday User Reservation? Starting EMS Managing Database
Chapter 2: Clients, charts of accounts, and bank accounts
 Chapter 2: Clients, charts of accounts, and bank accounts Most operations in BankLink Practice are client specific. These include all work on coding transactions, reporting, and maintaining chart of accounts
OPS Webportal User Guide - Reporting v.2.1
 OPS Webportal User Guide - Reporting v.2.1 Contents OPS Reporting... 3 OPS Web Portal... 4 Running Reports... 5 Report Navigation... 5 Group (Client) Selection... 6 Reporting Period... 7 Downloading the
User Guide Product Design Version 1.7
 User Guide Product Design Version 1.7 1 INTRODUCTION 3 Guide 3 USING THE SYSTEM 4 Accessing the System 5 Logging In Using an Access Email 5 Normal Login 6 Resetting a Password 6 Logging Off 6 Home Page
Employee self-service guide
 Employee self-service guide August 2016 (V.2) Contents Important note... 4 Login... 5 How do I know I am on the correct site and my connection is secure?... 5 How do I login?... 6 Username and password...
Sourcing - How to Create a Negotiation
 Martin Baker Secure Source-To-Pay Sourcing - How to Create a Negotiation December 07 Contents To Create a Project... To Create a Negotiation... 5 Attachments... 7 Private File Archive... 7 Creating Lines,
DEVELOPMENT ASSISTANCE DATABASE FOR COMOROS (DAD COMOROS)
") DEVELOPMENT ASSISTANCE DATABASE FOR COMOROS (DAD COMOROS) ANALYTICAL INTERFACE USER MANUAL Version 1.3 COPYRIGHT 2001-2014 SYNERGY INTERNATIONAL SYSTEMS INC ALL RIGHTS RESERVED DAD COMOROS ANALYTICAL INTERFACE
DEVELOPMENT ASSISTANCE DATABASE FOR COMOROS (DAD COMOROS) ANALYTICAL INTERFACE USER MANUAL Version 1.3 COPYRIGHT 2001-2014 SYNERGY INTERNATIONAL SYSTEMS INC ALL RIGHTS RESERVED DAD COMOROS ANALYTICAL INTERFACE
User s Guide. (Virtual Terminal Edition)
") User s Guide (Virtual Terminal Edition) Table of Contents Home Page... 4 Receivables Summary... 4 Past 30 Day Payment Summary... 4 Last 10 Customer Transactions... 4 View Payment Information... 4 Customers
User s Guide (Virtual Terminal Edition) Table of Contents Home Page... 4 Receivables Summary... 4 Past 30 Day Payment Summary... 4 Last 10 Customer Transactions... 4 View Payment Information... 4 Customers
SPS Commerce Dashboards & Alerts User Guide
 SPS Commerce Dashboards & Alerts User Guide 1 Table of Contents Introduction... 3 Additional Resources... 3 Logging In... 4 Changing your password... 4 The Portal Homepage... 5 Administration... 5 My Reports...
TungSpot User Manual Last Update 5/20/2013
 TungSpot User Manual Last Update 5/20/2013 TungSpot User Manual 1. Introduction... 2 1.1 Overview... 2 1.2 Login... 2 1.3 Navigation Tools... 3 2. Homepage... 4 2.1 Overview of Home Page... 4 2.2 My Purchases...
Working with PDF s. To open a recent file on the Start screen, double click on the file name.
 Working with PDF s Acrobat DC Start Screen (Home Tab) When Acrobat opens, the Acrobat Start screen (Home Tab) populates displaying a list of recently opened files. The search feature on the top of the
Comodo One Software Version 3.3
 rat Comodo One Software Version 3.3 Patch Management Module Administrator Guide Guide Version 2.2.101316 Comodo Security Solutions 1255 Broad Street STE 100 Clifton, NJ 07013 Table of Contents 1 Introduction
User Manual instantolap
 User Manual instantolap Version 2.7.0 15.12.2010 Page 2 / 213 instantolap User Manual 2.7.0 instantolap User Manual 2.7.0 Page 3 / 213 Copyright Copyright (C) 2002-2010 Thomas Behrends Softwareentwicklung
Logging Into ipart Enter the Store ID
 Logging Into ipart Enter the Store ID Using your computers web browser, navigate to the ipart homepage URL: https://ipart.amador.ca which will look similar to the image above. Enter the Store ID requested
Training Manual and Help File
 Training Manual and Help File 30.06.2011 Update Manage Grow Welcome to your new Juniper Website Management System with CMS Introduction The Juniper Website Management System with CMS (Website Content Management
Enhanced new user experience with simple to use navigation and better buying experience. Trade accounts will see current order status, and history
 NEW FEATURES AT ATLANTIC.REXEL.CA What s New? Enhanced new user experience with simple to use navigation and better buying experience Updated search functionality Trade accounts will see current order
CloudFM Viewer. User guide version /2013. Web viewer of measured data FIEDLER-MÁGR ELEKTRONIKA PRO EKOLOGII
 CloudFM Viewer User guide version 1.04 09/2013 Web viewer of measured data FIEDLER-MÁGR ELEKTRONIKA PRO EKOLOGII Web viewer of measured data User Guide 2 elektronika pro ekologii FIEDLER-MÁGR Web viewer
START GUIDE CDMNext V.3.0
 1 START GUIDE CDMNext V.3.0 2018 CEIC Data. All rights reserved. 2 TABLE OF CONTENTS 1. PRODUCT OVERVIEW... 3 2. Starting CDMNEXT... 3 2.1 Login... 3 2.2 Prerequisites... 4 2.3 Landing Page... 4 3. creating
Sections in this manual
 1 Sections in this manual Argus Analytics 2 The service 2 Benefits 2 Launching Argus Analytics 3 Search Interface breakdown 4 Add-in Navigation 5 Search: Free text & Facet 5 Search: Facet filter 6 Filters
GolfNow Central. Marketing User Guide. February 2018
 Marketing User Guide 2018 1 Table of Contents Course management Player Rules Booking Engine settings Connecting to your Social Media accounts How to send and schedule a one-time campaign How to send and
TRAINING GUIDE. Web App End User Training
 TRAINING GUIDE Web App End User Training Web Application End-User Training In this booklet, we will introduce you to the Lucity Web application. The Web system allows you to utilize customized views, forms,
Houghton Mifflin Harcourt and its logo are trademarks of Houghton Mifflin Harcourt Publishing Company.
 Guide for Teachers Updated September 2013 Houghton Mifflin Harcourt Publishing Company. All rights reserved. Houghton Mifflin Harcourt and its logo are trademarks of Houghton Mifflin Harcourt Publishing
Scoreboard User Guide Table of Contents (Hyperlinked)
") Scoreboard User Guide Table of Contents (Hyperlinked) Getting Started Login Screen Navigating the Sections of Scoreboard Icons My Bookmarks Section Briefing Pane Commonly Used Functions The Briefing Books
Scoreboard User Guide Table of Contents (Hyperlinked) Getting Started Login Screen Navigating the Sections of Scoreboard Icons My Bookmarks Section Briefing Pane Commonly Used Functions The Briefing Books
Sitecore Experience Platform 8.0 Rev: September 13, Sitecore Experience Platform 8.0
 Sitecore Experience Platform 8.0 Rev: September 13, 2018 Sitecore Experience Platform 8.0 All the official Sitecore documentation. Page 1 of 455 Experience Analytics glossary This topic contains a glossary
Steps: 1. Log in to the Dmitri application through the following website URL, as appropriate:
 Dmitri Suite Getting Started Logging In and Logging Out Logging In Use the following steps to log in to the Dmitri application. Steps: 1. Log in to the Dmitri application through the following website
CyberSource Business Center
 CyberSource Business Center CS3-609-06-16-09 Copyright 2009 Harris Connect, LLC. all rights reserved. Reproduction in any form without the express written consent of Harris Connect, LLC. is strictly prohibited
Central Skills Log For Learners
 Central Skills Log For Learners To access the Central Skills Log open a Web Browser, go to http://www.cqual.org and click on the Central Skills Log link in the top menu. Then click the CSL Login button.
RL6 - WORKING WITH REPORTS
 RL6 - WORKING WITH REPORTS If you have RL6 Risk questions please contact: RL_support@wrha.mb.ca or (204) 926-1070 WRHA Quality Improvement & Patient Safety Version: 3.0, November 2, 2018 WORKING WITH REPORTS
Table of Contents. Adding Files Select File...20 Metadata...20 A to Z...21
 ptools Manual Table of Contents Welcome to ptools... 1 To login:...1 Adding in Active X... 2 To Install XStandard:...2 Locations... 2 New Categories or Locations...2 A to Z...5 Primary Document...5 Documents...
Welcome to Shopfront. Your distributor will supply your user name, password, and the website address for your login page.
 User Guide Table of Contents Login... 3 Choose a Location... 4 Home Page... 5 Header Bar... 6 My Catalog... 6 Menu Bar... 7 My Profile... 8 Contact Us... 9 Change Location... 10 Shopping Lists... 11 Quick
Chapter 1 : Getting Started with Integrity... Chapter 2 : Interface Layout... Chapter 3 : Navigation... Chapter 4 : Printing...
 .0 User s Manual Table of Contents Chapter : Getting Started with Integrity... Chapter : Interface Layout... Chapter : Navigation... Chapter : Printing... Chapter : Quick Search and Results Pane... Results
(APPLIES ONLY TO CLIENTS WHO ENABLE THIS FEATURE)
") V 4.6.1.January2018 Document version 01-10-2018-02 End of Year LMS Updates Admin Guide NOTE: This DRAFT guide should provide a brief overview and screenshots of the End of Year LMS updates. All items in
V 4.6.1.January2018 Document version 01-10-2018-02 End of Year LMS Updates Admin Guide NOTE: This DRAFT guide should provide a brief overview and screenshots of the End of Year LMS updates. All items in
Working with Actions Stratum.Viewer 6
 Working with Actions Stratum.Viewer 6 Getting Started Access to Actions Accessing Actions Functionality Introduction to Actions Quick Start Set up an Action Tasks Add an Email Action Add a File Share Action
Finance Systems Finance. PowerBudget. Learner Guide for FedUni Staff
 Finance Systems Finance PowerBudget Learner Guide for FedUni Staff Prepared by: Chrissy Dunn Finance Systems Finance Chief Operating Office Status: Final Version: 1 Date: 30/11/2014 Table of Contents Introduction
Morningstar Advisor Workstation SM Quick Start Guide
 Morningstar Advisor Workstation provides financial advisors with tools for security research, portfolio analysis, and sales presentations. This is designed to get you up and running quickly, taking you
Construction IC User Guide
 Construction IC User Guide The complete source of project, company, market and theme information for the global construction industry clientservices.construction@globaldata.com https://construction.globaldata.com
Assessment Data Online: User s Guide
 Assessment Data Online: User s Guide Welcome to the new Assessment Data Online. This User s Guide is intended to help you understand the functionality of the website, access the various dashboards available,
Monitoring and Evaluation Tool
 Monitoring and Evaluation Tool USER MANUAL March, 2014 www.menarid.icarda.org THIS PAGE LEFT EMPTY INTENTIONALLY USER MANUAL Definitions and abbreviations Chart... Graphical representation of M&E project
SCOUT SUSPENSE TRACKER Version 10.0
 SCOUT SUSPENSE TRACKER Version 10.0 USER S MANUAL For Civilian Personnel Management Service (CPMS) HPC-COM LLC Help Desk 800-795-1902 Updated: February 2011 Table of Contents SCOUT Suspense Tracker V10.0
Copyrights. Copyright 2015 Yotpo Ltd. All rights reserved.
 Copyrights Copyright 2015 Yotpo Ltd. All rights reserved. Information in this document is subject to change without notice. No part of this publication may be reproduced, stored in a retrieval system,
MANAGING ACTIVITIES...
 Sales Center Guide GETTING STARTED... 2 LOGGING INTO LASSO... 2 FINDING YOUR WAY AROUND... 3 CONTACTING SUPPORT... 3 ACCESSING THE SALES CENTER... 3 SALES CENTER TIPS... 5 SEARCHING FOR A REGISTRANT...
HOSTED CONTACT CENTRE
 ---------------------------------------------------------------------------- ------ HOSTED CONTACT CENTRE ANALYTICS GUIDE Version 9.4 Revision 1.0 Confidentiality and Proprietary Statement This document
Getting Started Quick Start Guide
 Getting Started Quick Start Guide This guide provides tips for users new to using the Learning Environment. It discusses how to navigate the main areas and how to change your personal preferences and settings.