Excel Tips for Compensation Practitioners Weeks Pivot Tables
|
|
|
- Bethany Hampton
- 6 years ago
- Views:
Transcription

1 Excel Tips for Compensation Practitioners Weeks Pivot Tables Week 23 Creating a Pivot Table Pivot tables are one of the most amazing and powerful tools in Excel, but many users do not know how to create them, or are not aware of some of the incredible features that are available in the pivot table. In the next six weeks I will cover how to draw up a pivot table, how to change the layout of or fields in the pivot, how to group and ungroup data, refresh data, edit field settings, show pages (a remarkable feature with wide applications), sort data in the pivot, show source data in a pivot table category and create a pivot chart. To begin, what are pivot tables? They are interactive tables that enable you to summarise and analyse data in a multitude of ways. They take seconds to create, no matter how large the size of your database, and are enormously flexible. Simply by dragging headings from row to column to page area, and by dragging fields in or out of the table, you can in an instant change the complete layout and look of your data. To demonstrate creating a pivot table, let s use the following data and assume that we wish to analyse total basic cash costs and average basic cash by division and grade. The data for the pivot must always be in a table with a single row of headings at the top.


2 To create the pivot, first select the data in the table. Next, in Excel 2007, click Insert, Pivot Table, and in the screen below click OK. This will create an empty pivot table. In Excel 2003 click Data, Pivot Table and Pivot Chart Report, Next, Next - this will take you to the screen shot below. At this stage, you can either select Layout or you can click Finish, which will create an empty pivot table, as in Excel 2007, and you can do the layout in the empty table. We will work first with selecting Layout at this point, and then work with doing the layout in an empty pivot table. Select Click the Layout button. Then, as per the screen shot below, drag the Grade box into Row. Drag the Division box into Column. Drag the Basic Cash box into Data.

3 Click OK. Leave the default option to place the pivot table in a new worksheet. Click Finish. If you had created an empty pivot table, you would do exactly the same actions in this table, dragging Grade from the Pivot Table Field List to where it says Drop Row Fields Here, Division to where it says Drop Column Fields Here and Basic Cash into where it says Drop Data Items Here. Using either of these methods, you will create a pivot table giving you the sum of basic cash by division and grade. The pivot table should look like the screen shot below.


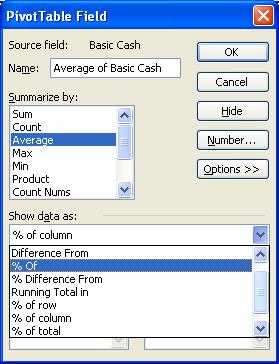
4 If you decided that you preferred to have division in the row area and grade in the column area, you can simply drag the word Division to where Grade is, and Grade to where Division is. The pivot table will change to look like this. This provides truly amazing flexibility! Simply by double clicking on the word Sum of Basic Cash in the top left corner of the pivot, you can change the pivot to a Count, Average, Max, Min, Product etc. as per the screen shot below. You can choose the number of decimal places by clicking Number in this screen, (Number Format in 2007), then Number again, and specifying the decimal places.
5 You can also have more than one field in the row, column, page or data area at one time. The fields will be shown next to each other or below each other. Next week we will look at the use of the page area in the pivot table, i.e. what happens when you drag a field to where it says Drop Page Fields Here. We will explore how to show pages, i.e. how to get the pivot to create one sheet for every category in the page field, and how to ensure that each sheet is in a consistent format.
6 Week 24 Using the Page Area and Show Pages function in the Pivot Table Last week we showed how to create a pivot table, analysing basic cash by division and grade using the row and column areas of the table. This week we will explore how to use the page area of the pivot table, and how to use the show pages function. Using the same set of data as last week, create a pivot table by clicking Data, Pivot Table and Pivot Chart Report, Next, Next, Finish in Excel 2003, or Insert, Pivot Table, OK in Excel In the empty pivot table created, see screen shot below, do the following layout. Drag Division from the Pivot Table Field List to where it says Drop Page Fields Here, Grade to where it says Drop Row Fields Here and Basic Cash into where it says Drop Data Items Here.. You will now have created a pivot table giving you the sum of basic cash by grade for all divisions. The pivot table should look like the screen shot below.
, you will be able to see the sum of basic cash for each division at a time.")

7 When a field is in the page area, it enables you to see all the fields combined, or to see one of the fields at a time. If, in this pivot table, you click on the down arrow to the right of Division (All), you will be able to see the sum of basic cash for each division at a time. For example, if you click on Human Resources, OK, your pivot table will change to look like this. Once a field is in the page area, you can use an immensely powerful function called Show Pages. This creates one sheet for each field in your page area. To use this function, in Excel 2003 click on the down arrow next to Pivot Table in your Pivot Table toolbar and select Show Pages as per the screen shot below. The Pivot Table toolbar should open automatically when you create a pivot table, but if you have accidentally closed it, open it up again by clicking View, Toolbars, Pivot Table. You need to select a cell inside the pivot table for this toolbar to be active. If you select a cell outside of the pivot table, the icons in the toolbar will be recessed.


8 In Excel 2007, click in the pivot table. Then select Options from the top menu, and in the Pivot Table category on the left of the toolbar, click the down arrow next to Options, and click Show Report Filter Pages as per the screen shot below. After selecting Show Pages or Show Report Filter Pages, you will be given an option of choosing any fields that are in the page area. In this example, you only have one field, Division in the page area, see below, so just click OK. Excel will now create 7 sheets, each with the name of a division and containing a pivot table for that division.


9 Where there is no data, for example, in Human Resources, there is no data for Grades 1, 2 and 7, the pivot will only show the fields for which there is data. However, if you would like all the pivot tables to have a consistent layout, and include fields even where there is no data, this can be easily done. In your original pivot table, point at Grade, right click and select Field Settings in Excel 2003, or, Field Settings, then Layout & Print in Excel Check the box which says Show items with no data, as per the screen shots below, the first for Excel 2003, the second for Excel Click OK.


10 Then again follow the procedure for Show Pages or Show Report Filter Pages, as outlined above. You will now have a pivot table sheet per Division, but each one will have a consistent layout and show grades, even where there is no data, as per the example below.
11 The Show Pages function is immensely powerful, as it can be used as a time saving measure, even when you are not wanting to create pivot tables. For example, say you need to produce a separate sheet of data for 20 different departments. Instead of inserting and naming each sheet with the name of the department, use a pivot table and the Show Pages function to create them. Then select all 20 sheets, by selecting the first sheet, holding down the Shift key and selecting the last sheet. Select the whole sheet by clicking Control A or clicking in the top left hand corner. Convert the pivot tables to values by clicking copy, paste values, and then delete them. If you do not convert to values first, you will not be able to delete them. You will now have 20 blank but named sheets, and you can then copy your table or graph into each sheet and edit it as needed. This is much quicker than creating and naming each sheet separately. You can also create a heading in all 20 sheets at once, using the name of the sheet, by doing the following. Select all 20 sheets. Then use the ASAP-Utilities menu, menu option 4, then 5, (see Week 5 for this add in menu option) to put the sheet name into a specific cell in each sheet, say cell E1. Then create a heading in each sheet, say in cell B1, that reads something like = Table of Data for &E1. Each sheet will then have a heading saying Table of Data for Human Resources, Table of Data for Marketing etc.
12 Week 25 Field Settings Options in the Pivot Table In pivot tables, you often want to compare data across different areas, e.g. average salary for a grade or job category across functions, divisions or regions, and you can do this by using a variety of field setting options. To demonstrate this, using the same set of data as in the first two weeks, create a pivot table by clicking Data, Pivot Table and Pivot Chart Report, Next, Next, Finish in Excel 2003 or Insert, Pivot Table, OK in Excel In the empty pivot table created, drag Division from the Pivot Table Field List to where it says Drop Column Fields Here, Grade to where it says Drop Row Fields Here and Basic Cash into where it says Drop Data Items Here. Your pivot table should look like the one below. Either double click on Sum of Basic Cash, or point anywhere inside the pivot table, right click, and select Field Settings in Excel 2003 or Value Field Settings in Excel In Excel 2003 select Average, click on Options >>, then under where it says Show data as:, select % of column as per the screen shot below.


13 In Excel 2007, select Average, click the Show values as tab, and under where it says Show values as, select % of column as per the screen shot below. Click on Number in Excel 2003, or Number Format in Excel 2007, change the decimal places from 2 to 0, then click OK, OK. You will now have a pivot table that looks like this.


14 This pivot shows the average basic cash for each grade/ division as a % of the average for the whole grade. The table is a little clouded though by the 0% s where there is no data. To not view the zeros, in Excel 2003 click Tools, Options, View. Uncheck the Zero values box, to not show zero values see below. In Excel 2007, click the Microsoft Office Button,, click Excel Options, and then the Advanced category on the left. Scroll down and, under Display options, uncheck the box for Show a zero in cells that have zero value see below.


15 The pivot table will now look like this. You can now see quite clearly that Info Technology basic salaries are 9% to 14% above the average at each grade, while Sales basic salaries are 11% to 25% below the average, because they exclude commission. Dependent on how your pivot table is set up, you could instead choose to look at averages as a % of the row, of the total, as a % of a specific field or as the difference from another field, as per the options below. You can combine this with conditional formatting, which we will cover in a later column, to highlight anomalies. This provides an immensely powerful tool for presenting comparative data across regions, functions, divisions or any other category in your organisation.
16
 or Refresh (Excel 2007).")
17 Week 26 Refreshing and grouping data in the pivot table Refreshing data in the pivot table Once you have created a pivot table, your original data may change, and you then want to update the pivot table. Note that this update does not happen automatically. To update the pivot, simply click anywhere in the pivot table, right click and click Refresh data (Excel 2003) or Refresh (Excel 2007). Alternatively, in Excel 2003, click the red exclamation mark in the pivot table toolbar see below. All pivot tables in that workbook will then update with the new data. You can also choose to automatically refresh the pivot table each time you open the workbook. To do this in Excel 2003, point anywhere inside the pivot table, right click and select Table Options. Check the bottom box that says Refresh on open. See below. To do this in Excel 2007, point anywhere inside the pivot table, right click and select Pivot Table Options. Click the Data tab. Check the box that says Refresh data when opening the file. See below.

18 Grouping data in the pivot table You might want to group data in your pivot table into broader categories. Let s say for example that you wished to group grades 1 to 4 in the pivot table below into Non Exempt, and grades 5 to 7 into Exempt. (I apologise if this grouping does not make sense - we do not use these categories in SA, so am surmising!) Select the row headings 1 to 4. Right click. Select Group and Show Detail, Group in Excel 2003, or just Group in Excel This will create a new heading above 1 to 4 headed Group 1. Edit this to say Non Exempt. Next select the row headings 5 to 7. Right click. Select Group and Show Detail, Group in Excel 2003, or just Group in Excel This will create a new heading above 5 to 7 headed Group 2. Edit this to say Exempt. Your data should look like the pivot table below.


19 To collapse the categories, double click on the word Non Exempt, and on the word Exempt or in Excel 2007, click on the minus sign to the left of the words. Your pivot will then look like the one below, and you will have a summary of the data by Exempt and Non Exempt categories. To open them up again, simply double click on the words Non Exempt and / or Exempt, or in Excel 2007, click on the plus signs to the left of the words.

20 Week 27 Sorting data and selecting specific fields in the pivot table Sorting data in the pivot table Once you have created a pivot table, the default sort order in the pivot is ascending, but allows a manual over ride. You can change this sort order by simply dragging field categories to a different place. For example, in the pivot table below, you could drag the word Finance after Human Resources, or the word Sales before Marketing, to change the order. You can also change the default sort order by doing the following. In Excel 2003 point at the field name in the row or column area, for example, Division. Right click and select Field Settings. In the screen as per the one below, click Advanced Check the box for the desired sort order, Ascending or Descending, and choose which field you wish to sort by, in this case Division or Sum of Basic Cash, as per the screen shot below.


21 If you chose Descending by Sum of Basic Cash, the pivot table would change to look as follows. The division order would be based on which division had the highest sum of basic cash. You would therefore be able to clearly see which division was costing the most in basic cash salaries. You can do a similar operation in Excel Point at the field name in the row or column area, for example, Division. Right click and select Sort. You can choose to sort A to Z or Z to A on that field, or choose More Sort Options. In this screen you could choose the same option as above, Descending by Sum of Basic Cash, see screen shot below.


22 Selecting specific fields in the pivot table Once you have created a pivot table, the default will be to show all categories in each field in the row, column or page areas. You can however choose to omit some fields in the row or column areas if you wish. For example, in the table above, you might wish to exclude Technical and Logistics, because you are looking only at the cost of head office support staff. To do this, click on the down arrow next to Division, and uncheck the boxes for the categories that you do not want as per the screen shot below. Click OK. Your pivot table will now exclude those categories.


23 Week 28 Showing source data in a pivot table category and creating pivot charts Showing the source data in a pivot table category Let us assume we have created the following pivot table, and wish to know which employees are making up the total cash cost in Technical Exempt, as this amount is very high. Just double click on the number next to Technical and under Exempt in the pivot. A new spreadsheet will be created showing the source data (in this case employees) in this category see below. The fields that are shown in this sheet, in this case, Grade, Division, Name, Job Title and Basic Cash, will be the ones that were selected when the pivot table was created. For this reason it is a good idea when creating a pivot table to select all the fields in the table, not only those that you wish to put into the page, column, row and data areas.

24 Creating pivot charts Once you have created a pivot table, you can also if you wish, create a pivot chart. To do this, in Excel 2007, click on the pivot table, then select Options from the top menu, and click on the Pivot Chart icon in the Tools category. In Excel 2003, click on the pivot table, then click on the chart icon in the pivot toolbar see below or the chart icon in the standard toolbar. In Excel 2007, you will be given a choice of chart types when you click on the pivot chart icon. In Excel 2003, the pivot chart automatically creates a stacked column chart, but you can change the chart type afterwards by clicking Chart, Chart type and choosing a different chart type. Let s assume your pivot table looks like the one shown at the beginning of the column with Exempt and Non Exempt data by Division. From this table Excel 2003 will create the following pivot chart. You can edit the pivot chart in exactly the same manner as the pivot table. In Excel 2003, you can drag fields in or out, and move them from the row to the column to the page area. You can also click on the down arrow next to the field name, for example, Division, to exclude certain categories in that field. In Excel 2007, you can do the same, but not in the chart itself, you do the editing in the Pivot Table Field List and Pivot Chart Filter Pane outside of the chart. See example below

25 Note that whatever you do to the chart will alter the layout of the original table from which the chart is created. You can also edit the chart using your normal chart editing options. In Excel 2003 you can close the pivot table field list and the pivot toolbar to improve the look of the chart. To get them back again, click View, Toolbars, Pivot Table. Then, in the toolbar click the last icon on the right, Show Field List. To conclude on pivot tables, although I have devoted 6 columns to them, and have demonstrated the most important features, I have still not shown all the options that are available. The best way to discover these is to experiment with the Pivot Table Options and the Field Settings, and to explore the many additional features. Most of what I have learnt about pivot tables has come from wondering if something can be done in a pivot, and experimenting to find out!
Excel Tips for Compensation Practitioners Weeks Data Validation and Protection
 Excel Tips for Compensation Practitioners Weeks 29-38 Data Validation and Protection Week 29 Data Validation and Protection One of the essential roles we need to perform as compensation practitioners is
Excel Tips for Compensation Practitioners Month 1
 Excel Tips for Compensation Practitioners Month 1 Introduction This is the first of what will be a weekly column with Excel tips for Compensation Practitioners. These tips will cover functions in Excel
Excel Tables & PivotTables
 Excel Tables & PivotTables A PivotTable is a tool that is used to summarize and reorganize data from an Excel spreadsheet. PivotTables are very useful where there is a lot of data that to analyze. PivotTables
Excel Tables and Pivot Tables
 A) Why use a table in the first place a. Easy to filter and sort if you only sort or filter by one item b. Automatically fills formulas down c. Can easily add a totals row d. Easy formatting with preformatted
Excel Tips for Compensation Practitioners Weeks 9-12 Working with Lookup Formulae
 Excel Tips for Compensation Practitioners Weeks 9-12 Working with Lookup Formulae Week 9 Using lookup functions Microsoft Excel is essentially a spreadsheet tool, while Microsoft Access is a database tool.
Basic tasks in Excel 2013
 Basic tasks in Excel 2013 Excel is an incredibly powerful tool for getting meaning out of vast amounts of data. But it also works really well for simple calculations and tracking almost any kind of information.
Excel Tips for Compensation Practitioners Weeks Text Formulae
 Excel Tips for Compensation Practitioners Weeks 70-73 Text Formulae Week 70 Using Left, Mid and Right Formulae When analysing compensation data, you generally extract data from the payroll, the HR system,
Creating a Pivot Table
 Contents Introduction... 1 Creating a Pivot Table... 1 A One-Dimensional Table... 2 A Two-Dimensional Table... 4 A Three-Dimensional Table... 5 Hiding and Showing Summary Values... 5 Adding New Data and
Making Excel Work for Your Tribal Community
 Making Excel Work for Your Tribal Community Excel Basics: Intermediate Skills PHONE: 1-800-871-8702 EMAIL: INFO@CBC4TRIBES.ORG WEB: TRIBALINFORMATIONEXCHANGE.ORG MAKING EXCEL WORK FOR YOUR TRIBAL COMMUNITY
Intermediate Excel 2016
 Intermediate Excel 2016 Relative & Absolute Referencing Relative Referencing When you copy a formula to another cell, Excel automatically adjusts the cell reference to refer to different cells relative
File Name: Pivot Table Labs.xlsx
 File Name: Pivot Table Labs.xlsx Lab Session 1: Create Simple Pivot Table with a Date Grouping Note: Instructions for the first lab are very detailed because it might be the first time you have created
Tutorial 5: Working with Excel Tables, PivotTables, and PivotCharts. Microsoft Excel 2013 Enhanced
 Tutorial 5: Working with Excel Tables, PivotTables, and PivotCharts Microsoft Excel 2013 Enhanced Objectives Explore a structured range of data Freeze rows and columns Plan and create an Excel table Rename
Excel. Spreadsheet functions
 Excel Spreadsheet functions Objectives Week 1 By the end of this session you will be able to :- Move around workbooks and worksheets Insert and delete rows and columns Calculate with the Auto Sum function
EXCEL TUTORIAL.
 EXCEL TUTORIAL Excel is software that lets you create tables, and calculate and analyze data. This type of software is called spreadsheet software. Excel lets you create tables that automatically calculate
Creating an Excel resource
 Excel Mobile Excel Mobile is a Microsoft application similar to Excel, but designed to run on handhelds. This mobile version of Excel is a spreadsheet application that allows you to manipulate numbers,
The Menu and Toolbar in Excel (see below) look much like the Word tools and most of the tools behave as you would expect.
 look much like the Word tools and most of the tools behave as you would expect.") Launch the Microsoft Excel Program Click on the program icon in Launcher or the Microsoft Office Shortcut Bar. A worksheet is a grid, made up of columns, which are lettered and rows, and are numbered.
Launch the Microsoft Excel Program Click on the program icon in Launcher or the Microsoft Office Shortcut Bar. A worksheet is a grid, made up of columns, which are lettered and rows, and are numbered.
MS Office 2016 Excel Pivot Tables - notes
 Introduction Why You Should Use a Pivot Table: Organize your data by aggregating the rows into interesting and useful views. Calculate and sum data quickly. Great for finding typos. Create a Pivot Table
New Perspectives on Microsoft Excel Module 5: Working with Excel Tables, PivotTables, and PivotCharts
 New Perspectives on Microsoft Excel 2016 Module 5: Working with Excel Tables, PivotTables, and PivotCharts Objectives, Part 1 Explore a structured range of data Freeze rows and columns Plan and create
Microsoft Excel XP. Intermediate
 Microsoft Excel XP Intermediate Jonathan Thomas March 2006 Contents Lesson 1: Headers and Footers...1 Lesson 2: Inserting, Viewing and Deleting Cell Comments...2 Options...2 Lesson 3: Printing Comments...3
Chapter 4. Microsoft Excel
 Chapter 4 Microsoft Excel Topic Introduction Spreadsheet Basic Screen Layout Modifying a Worksheet Formatting Cells Formulas and Functions Sorting and Filling Borders and Shading Charts Introduction A
Using Tables, Sparklines and Conditional Formatting. Module 5. Adobe Captivate Wednesday, May 11, 2016
 Slide 1 - Using Tables, Sparklines and Conditional Formatting Using Tables, Sparklines and Conditional Formatting Module 5 Page 1 of 27 Slide 2 - Lesson Objectives Lesson Objectives Explore the find and
Candy is Dandy Project (Project #12)
") Candy is Dandy Project (Project #12) You have been hired to conduct some market research about M&M's. First, you had your team purchase 4 large bags and the results are given for the contents of those
Candy is Dandy Project (Project #12) You have been hired to conduct some market research about M&M's. First, you had your team purchase 4 large bags and the results are given for the contents of those
Good Byer Stores Australia Ltd Inventory - Whitegoods department
 Managing Data Lists Chapter 1 Excel has some excellent features that make working with lists easy. Lists of records can be sorted, searched and filtered to produce useful information. Good Byer Stores
Excel 2007/2010. Don t be afraid of PivotTables. Prepared by: Tina Purtee Information Technology (818)
") Information Technology MS Office 2007/10 Users Guide Excel 2007/2010 Don t be afraid of PivotTables Prepared by: Tina Purtee Information Technology (818) 677-2090 tpurtee@csun.edu [ DON T BE AFRAID OF
Information Technology MS Office 2007/10 Users Guide Excel 2007/2010 Don t be afraid of PivotTables Prepared by: Tina Purtee Information Technology (818) 677-2090 tpurtee@csun.edu [ DON T BE AFRAID OF
Microsoft Excel Microsoft Excel
 Excel 101 Microsoft Excel is a spreadsheet program that can be used to organize data, perform calculations, and create charts and graphs. Spreadsheets or graphs created with Microsoft Excel can be imported
2013 ADVANCED MANUAL
 2013 ADVANCED MANUAL C B C H O U S E 2 4 C A N N I N G S T R E E T E D I N B U R G H E H 3 8 E G 0 1 3 1 2 7 2 2 7 9 0 W W W. I T R A I N S C O T L A N D. C O. U K I N F O @ I T R A I N S C O T L A N D.
Pivot Tables, Lookup Tables and Scenarios
 Introduction Format and manipulate data using pivot tables. Using a grading sheet as and example you will be shown how to set up and use lookup tables and scenarios. Contents Introduction Contents Pivot
Basics of Spreadsheet
 106 :: Data Entry Operations 6 Basics of Spreadsheet 6.1 INTRODUCTION A spreadsheet is a large sheet having data and information arranged in rows and columns. As you know, Excel is one of the most widely
Microsoft Excel Basics Ben Johnson
 Microsoft Excel Basics Ben Johnson Topic...page # Basics...1 Workbook and worksheets...1 Sizing columns and rows...2 Auto Fill...2 Sort...2 Formatting Cells...3 Formulas...3 Percentage Button...4 Sum function...4
ABOUT PIVOTTABLES TABLE OF CONTENTS
 University of Southern California Academic Information Services Excel 2007 - PivotTables ABOUT PIVOTTABLES PivotTables provide an excellent means of analyzing data stored in database format by rearranging
Introduction to Excel 2007
 Introduction to Excel 2007 These documents are based on and developed from information published in the LTS Online Help Collection (www.uwec.edu/help) developed by the University of Wisconsin Eau Claire
Sort, Filter, Pivot Table
 Sort, Filter, Pivot Table Sort A common database task is to rearrange the information based on a header/field or headers/fields. This is called Sorting or Filtering. Sorting rearranges all of the information
Tips & Tricks: MS Excel
 Tips & Tricks: MS Excel 080501.2319 Table of Contents Navigation and References... 3 Layout... 3 Working with Numbers... 5 Power Features... 7 From ACS to Excel and Back... 8 Teacher Notes: Test examples
Microsoft How to Series
 Microsoft How to Series Getting Started with EXCEL 2007 A B C D E F Tabs Introduction to the Excel 2007 Interface The Excel 2007 Interface is comprised of several elements, with four main parts: Office
Excel 2007 New Features Table of Contents
 Table of Contents Excel 2007 New Interface... 1 Quick Access Toolbar... 1 Minimizing the Ribbon... 1 The Office Button... 2 Format as Table Filters and Sorting... 2 Table Tools... 4 Filtering Data... 4
1. Right-click the worksheet tab you want to rename. The worksheet menu appears. 2. Select Rename.
 Excel 2010 Worksheet Basics Introduction Page 1 Every Excel workbook contains at least one or more worksheets. If you are working with a large amount of related data, you can use worksheets to help organize
INFORMATION SHEET 24002/1: AN EXCEL PRIMER
 INFORMATION SHEET 24002/1: AN EXCEL PRIMER How to use this document This guide to the basics of Microsoft Excel is intended for those people who use the program, but need or wish to know more than the
Microsoft Excel 2010 Step-by-Step Exercises PivotTables and PivotCharts: Exercise 1
 Microsoft Excel 2010 Step-by-Step Exercises PivotTables and PivotCharts: Exercise 1 In this exercise you will learn how to: Create a new PivotTable Add fields to a PivotTable Format and rename PivotTable
EXCEL ADVANCED Linda Muchow
 EXCEL ADVANCED 2016 Alexandria Technical and Community College Customized Training Technology Specialist 1601 Jefferson Street, Alexandria, MN 56308 320-762-4539 Linda Muchow lindac@alextech.edu 1 Table
Objective: Class Activities
 Objective: A Pivot Table is way to present information in a report format. The idea is that you can click drop down lists and change the data that is being displayed. Students will learn how to group data
Excel Contents. MS Excel /3/2011 JSD#2-Neptune Page 1
 Excel 2013 Contents Contents... 1 Opening Start Screen... 2 Formatting cells... 2 Modifying information in a cell... 2 Autofil... 3 Merge and Center Headings and Merge Cells... 3 Auto Calculation... 3
GCSE CCEA GCSE EXCEL 2010 USER GUIDE. Business and Communication Systems
 GCSE CCEA GCSE EXCEL 2010 USER GUIDE Business and Communication Systems For first teaching from September 2017 Contents Page Define the purpose and uses of a spreadsheet... 3 Define a column, row, and
IFTA Staff Excel Training Manual
 IFTA Staff Excel Training Manual 1 INTRODUCTION Microsoft Excel is a program designed to create spreadsheets. A spreadsheet is a large sheet of squared paper where the squares can be used in calculation
INSERT SUBTOTALS Database Exercise Sort the Data Department Department Data Tab Sort and Filter Group
 INSERT SUBTOTALS Subtotals are used to summarize data in a range of data. This command offers many kinds of summary information, including counts, sums, averages, minimums, and maximums. When this feature
WEEK NO. 12 MICROSOFT EXCEL 2007
 WEEK NO. 12 MICROSOFT EXCEL 2007 LESSONS OVERVIEW: GOODBYE CALCULATORS, HELLO SPREADSHEET! 1. The Excel Environment 2. Starting A Workbook 3. Modifying Columns, Rows, & Cells 4. Working with Worksheets
INTRODUCTION... 1 UNDERSTANDING CELLS... 2 CELL CONTENT... 4
 Introduction to Microsoft Excel 2016 INTRODUCTION... 1 The Excel 2016 Environment... 1 Worksheet Views... 2 UNDERSTANDING CELLS... 2 Select a Cell Range... 3 CELL CONTENT... 4 Enter and Edit Data... 4
Excel 2013 PivotTables and PivotCharts
 Excel 2013 PivotTables and PivotCharts PivotTables... 1 PivotTable Wizard... 1 Creating a PivotTable... 2 Groups... 2 Rows Group... 3 Values Group... 3 Columns Group... 4 Filters Group... 5 Field Settings...
Excel Level 1
 Excel 2016 - Level 1 Tell Me Assistant The Tell Me Assistant, which is new to all Office 2016 applications, allows users to search words, or phrases, about what they want to do in Excel. The Tell Me Assistant
SAMaRT User Guide Microsoft Excel (Advanced version)
") SAMaRT User Guide Microsoft Excel (Advanced version) Before you start...2 Macros...2 Exploring the tool...2 Using the tool for the first time...3 Introduction page...3 Changing the drop down list options...3
SAMaRT User Guide Microsoft Excel (Advanced version) Before you start...2 Macros...2 Exploring the tool...2 Using the tool for the first time...3 Introduction page...3 Changing the drop down list options...3
Excel Format cells Number Percentage (.20 not 20) Special (Zip, Phone) Font
 Special (Zip, Phone) Font") Excel 2013 Shortcuts My favorites: Ctrl+C copy (C=Copy) Ctrl+X cut (x is the shape of scissors) Ctrl+V paste (v is the shape of the tip of a glue bottle) Ctrl+A - or the corner of worksheet Ctrl+Home Goes
Excel 2013 Shortcuts My favorites: Ctrl+C copy (C=Copy) Ctrl+X cut (x is the shape of scissors) Ctrl+V paste (v is the shape of the tip of a glue bottle) Ctrl+A - or the corner of worksheet Ctrl+Home Goes
Formulas, LookUp Tables and PivotTables Prepared for Aero Controlex
 Basic Topics: Formulas, LookUp Tables and PivotTables Prepared for Aero Controlex Review ribbon terminology such as tabs, groups and commands Navigate a worksheet, workbook, and multiple workbooks Prepare
THE EXCEL ENVIRONMENT... 1 EDITING...
 Excel Essentials TABLE OF CONTENTS THE EXCEL ENVIRONMENT... 1 EDITING... 1 INSERTING A COLUMN... 1 DELETING A COLUMN... 1 INSERTING A ROW... DELETING A ROW... MOUSE POINTER SHAPES... USING AUTO-FILL...
How to insert table in Excel?
 What is Table in Excel? Tables allow you to analyze your data in Excel quickly and easily. How to insert table in Excel? To insert a table, execute the following steps. 1. Click any single cell inside
To complete this workbook, you will need the following file:
 CHAPTER 4 Excel More Skills 13 Create PivotTable Reports A PivotTable report is an interactive, cross-tabulated Excel report used to summarize and analyze data. PivotTable reports are used to ask questions
MS Excel Advanced Level
 MS Excel Advanced Level Trainer : Etech Global Solution Contents Conditional Formatting... 1 Remove Duplicates... 4 Sorting... 5 Filtering... 6 Charts Column... 7 Charts Line... 10 Charts Bar... 10 Charts
Patricia Andrada Quick Guide Excel 2010 Data Management-July 2011 Page 1
 Patricia Andrada Quick Guide Excel 2010 Data Management-July 2011 Page 1 Excel 2010 Data Management AutoFill and Custom Lists AutoFill 1. Select the range that contains the initial value(s) of the series
Module 4 : Spreadsheets
 Module 4 : Spreadsheets What is a spreadsheet program? A spreadsheet program allows you to store, organise and analyse information. Applications of spreadsheets focus on generating numeric information
M i c r o s o f t E x c e l A d v a n c e d. Microsoft Excel 2010 Advanced
 Microsoft Excel 2010 Advanced 0 Working with Rows, Columns, Formulas and Charts Formulas A formula is an equation that performs a calculation. Like a calculator, Excel can execute formulas that add, subtract,
Working with Data in Microsoft Excel 2010
 Working with Data in Microsoft Excel 2010 This document provides instructions for using the sorting and filtering features in Microsoft Excel, as well as working with multiple worksheets in the same workbook
Working with Data and Charts
 PART 9 Working with Data and Charts In Excel, a formula calculates a value based on the values in other cells of the workbook. Excel displays the result of a formula in a cell as a numeric value. A function
Teach yourself... PivotTables and PivotCharts. with. Microsoft Excel Easy to follow Step-by-step instructions Written in plain English
 Easy Way Teach yourself... PivotTables and PivotCharts with Microsoft Excel 2013 Easy to follow Step-by-step instructions Written in plain English A Cheryl Price Publication Easy Way PivotTables and PivotCharts
Data Should Not be a Four Letter Word Microsoft Excel QUICK TOUR
 Toolbar Tour AutoSum + more functions Chart Wizard Currency, Percent, Comma Style Increase-Decrease Decimal Name Box Chart Wizard QUICK TOUR Name Box AutoSum Numeric Style Chart Wizard Formula Bar Active
Introduction to the workbook environment
 L E S S O N 7 Introduction to the workbook environment Lesson objectives Suggested teaching time To begin using the three-dimensional aspect of the Excel workbook, you will: 60-70 minutes a b c d Work
Frequency tables Create a new Frequency Table
 Frequency tables Create a new Frequency Table Contents FREQUENCY TABLES CREATE A NEW FREQUENCY TABLE... 1 Results Table... 2 Calculate Descriptive Statistics for Frequency Tables... 6 Transfer Results
IP4 - Running reports
 To assist with tracking and monitoring HRIS recruitment and personnel, reports can be run from Discoverer Plus. This guide covers the following process steps: Logging in... 2 What s changed? Changed reference
A Tutorial for Excel 2002 for Windows
 INFORMATION SYSTEMS SERVICES Data Manipulation with Microsoft Excel 2002 A Tutorial for Excel 2002 for Windows AUTHOR: Information Systems Services DATE: August 2004 EDITION: 1.0 TUT 130 UNIVERSITY OF
Microsoft Excel for Lawyers - The Fundamentals Reference Guide
 Microsoft Excel for Lawyers - The Fundamentals Reference Guide This guide includes step by step procedures for fundamental Excel commands and accompanies the Microsoft Excel for Lawyers -The Fundamentals
Spreadsheet definition: Starting a New Excel Worksheet: Navigating Through an Excel Worksheet
 Copyright 1 99 Spreadsheet definition: A spreadsheet stores and manipulates data that lends itself to being stored in a table type format (e.g. Accounts, Science Experiments, Mathematical Trends, Statistics,
NUMERICAL COMPUTING For Finance Using Excel. Sorting and Displaying Data
 NUMERICAL COMPUTING For Finance Using Excel Sorting and Displaying Data Outline 1 Sorting data Excel Sort tool (sort data in ascending or descending order) Simple filter (by ROW, COLUMN, apply a custom
2013 INTERMEDIATE MANUAL
 C B C H O U S E 2 4 C A N N I N G S T R E E T E D I N B U R G H E H 3 8 E G 0 1 3 1 2 7 2 2 7 9 0 W W W. I T R A I N S C O T L A N D. C O. U K I N F O @ I T R A I N S C O T L A N D. C O. U K CONTENTS CHAPTER
Quick Guide for Excel 2015 Data Management November 2015 Training:
 http://pfw.edu Quick Guide for Excel 2015 Data Management November 2015 Training: http://pfw.edu/training Excel 2016 Data Management AutoFill and Custom Lists AutoFill 1. Select the range that contains
USING MICROSOFT EXCEL 2016 Guided Project 4-3
 Guided Project 4-3 Clemenson Imaging analyzes expense reports from field representatives as well as patient and image data. To complete the worksheets, you format data as a table and build an advanced
Data. Selecting Data. Sorting Data
 1 of 1 Data Selecting Data To select a large range of cells: Click on the first cell in the area you want to select Scroll down to the last cell and hold down the Shift key while you click on it. This
EXCEL BASICS. Helen Mills META Solutions
 EXCEL BASICS Helen Mills META Solutions OUTLINE Introduction- Highlight Basic Components of Microsoft Excel Entering & Formatting Data, Numbers, & Tables Calculating Totals & Summaries Using Formulas Conditional
Teach Yourself Microsoft Office Excel Topic 17: Revision, Importing and Grouping Data
 www.gerrykruyer.com Teach Yourself Microsoft Office Excel Topic 17: Revision, Importing and Grouping Data In this topic we will revise several basics mainly through discussion and a few example tasks and
Basic Microsoft Excel 2007
 Basic Microsoft Excel 2007 Contents Starting Excel... 2 Excel Window Properties... 2 The Ribbon... 3 Tabs... 3 Contextual Tabs... 3 Dialog Box Launchers... 4 Galleries... 5 Minimizing the Ribbon... 5 The
Relativity. User s Guide. Contents are the exclusive property of Municipal Software, Inc. Copyright All Rights Reserved.
 Relativity User s Guide Contents are the exclusive property of Municipal Software, Inc. Copyright 2006. All Rights Reserved. Municipal Software, Inc. 1850 W. Winchester, Ste 209 Libertyville, IL 60048
Excel 2010: Getting Started with Excel
 Excel 2010: Getting Started with Excel Excel 2010 Getting Started with Excel Introduction Page 1 Excel is a spreadsheet program that allows you to store, organize, and analyze information. In this lesson,
VII. Data Management Essentials
 VII. Sort Excel recognizes a list or data set if the data in the list is contiguous, bordered by blank cells or an edge of the worksheet, and has labels that are differentiated in some way from the data.
Advanced Excel Skills
 Advanced Excel Skills Note : This tutorial is based upon MSExcel 2000. If you are using MSExcel 2002, there may be some operations which look slightly different (e.g. pivot tables), but the same principles
The HOME Tab: Cut Copy Vertical Alignments
 The HOME Tab: Cut Copy Vertical Alignments Text Direction Wrap Text Paste Format Painter Borders Cell Color Text Color Horizontal Alignments Merge and Center Highlighting a cell, a column, a row, or the
CHAPTER TWO: SPREADS HEETS WITH EXCEL 1
 CHAPTER TWO: SPREADS HEETS WITH EXCEL 1 CHAPTER 2 SPREADSHEETS WITH EXCEL TOPIC Create Pivot Tables Create and Modify Charts Sort and Filter CHAPTER TWO: SPREADS HEETS WITH EXCEL 2 CREATE AND MODIFY CHARTS
COMPUTER TECHNOLOGY SPREADSHEETS BASIC TERMINOLOGY. A workbook is the file Excel creates to store your data.
 SPREADSHEETS BASIC TERMINOLOGY A Spreadsheet is a grid of rows and columns containing numbers, text, and formulas. A workbook is the file Excel creates to store your data. A worksheet is an individual
Microsoft Excel 2013 Unit 1: Spreadsheet Basics & Navigation Student Packet
 Microsoft Excel 2013 Unit 1: Spreadsheet Basics & Navigation Student Packet Signing your name below means the work you are turning in is your own work and you haven t given your work to anyone else. Name
How to Create Custom Name Badge Inserts with a Mail Merge in Microsoft Word 2007
 Many people know that you can use the Mail Merge feature in Microsoft Word 2007 to easily create mailing labels, but did you know you can use it to quickly create custom name badge inserts? Here, you will
Using Interactive Reports and Dashboards
 Using Interactive Reports and Dashboards Typical interactive features Use onscreen filters to modify a dashboard or report and choose whether to see all or only some of the data available. The screen will
1. Managing Information in Table
 1. Managing Information in Table Spreadsheets are great for making lists (such as phone lists, client lists). The researchers discovered that not only was list management the number one spreadsheet activity,
You can clear the sample data from the table by selecting the table and pressing Delete.
 Making Quick Tables Choose Insert tab. Then click Table. Then click Quick Tables. Select the style of table from the Quick Tables Gallery. You can clear the sample data from the table by selecting the
1. Managing Information in Table
 1. Managing Information in Table Spreadsheets are great for making lists (such as phone lists, client lists). The researchers discovered that not only was list management the number one spreadsheet activity,
IT ACADEMY LESSON PLAN
 IT ACADEMY LESSON PLAN 10 Microsoft Excel Lesson 4 Turn potential into success Lesson 4: Working with Multiple Workbooks Learning Goals//The goal of this lesson is for students to successfully work with
7. Apply a Range of Table Features
 Word Processing 5N1358 7. Apply a Range of Table Features Contents Apply a Range of Table Features Including: 1. Creating Tables... 1 2. Resizing... 4 3. Merging Cells... 5 4. Inserting or Deleting columns
THE AMERICAN LAW INSTITUTE Continuing Legal Education
 67 THE AMERICAN LAW INSTITUTE Continuing Legal Education Using Everyday Tech Tools To Maximize Your Law Practice Plus Ethics April 26, 2018 Philadelphia, Pennsylvania Utilizing Microsoft Excel for a More
Advanced Excel for EMIS Coordinators
 Advanced Excel for EMIS Coordinators Helen Mills helenmills@metasolutions.net 2015 Metropolitan Educational Technology Association Outline Macros Conditional Formatting Text to Columns Pivot Tables V-Lookup
Skills Exam Objective Objective Number
 Overview 1 LESSON SKILL MATRIX Skills Exam Objective Objective Number Starting Excel Create a workbook. 1.1.1 Working in the Excel Window Customize the Quick Access Toolbar. 1.4.3 Changing Workbook and
Excel 2013 Intermediate
 Excel 2013 Intermediate Quick Access Toolbar... 1 Customizing Excel... 2 Keyboard Shortcuts... 2 Navigating the Spreadsheet... 2 Status Bar... 3 Worksheets... 3 Group Column/Row Adjusments... 4 Hiding
Excel Intermediate. Click in the name column of our Range of Data. (Do not highlight the column) Click on the Data Tab in the Ribbon
 Click on the Data Tab in the Ribbon") Custom Sorting and Subtotaling Excel Intermediate Excel allows us to sort data whether it is alphabetic or numeric. Simply clicking within a column or row of data will begin the process. Click in the name
Custom Sorting and Subtotaling Excel Intermediate Excel allows us to sort data whether it is alphabetic or numeric. Simply clicking within a column or row of data will begin the process. Click in the name
CIPHR Report Designer
 CIPHR Report Designer [version 7.0.1] CIPHR Report Designer 1 October 2013 Table of Contents Introduction... 3 Example 1: Listing report using a Subset... 7 Example 2: Report in a specific Order (Sorting)...
Microsoft Access 2010
 Microsoft Access 2010 Chapter 2 Querying a Database Objectives Create queries using Design view Include fields in the design grid Use text and numeric data in criteria Save a query and use the saved query
Microsoft Excel 2010
 Microsoft Excel 2010 omar 2013-2014 First Semester 1. Exploring and Setting Up Your Excel Environment Microsoft Excel 2010 2013-2014 The Ribbon contains multiple tabs, each with several groups of commands.
The Basics of PowerPoint
 MaryBeth Rajczewski The Basics of PowerPoint Microsoft PowerPoint is the premiere presentation software. It enables you to create professional presentations in a short amount of time. Presentations using