Visualizing Crime in San Francisco During the 2014 World Series
|
|
|
- Chastity Stafford
- 6 years ago
- Views:
Transcription
1 Visualizing Crime in San Francisco During the 2014 World Series John Semerdjian and Bill Chambers Description The scope and focus of our project evolved over the course of its lifetime. Our goals were to continue building experience with d3.js and to create a standalone data driven web application. We envisioned a tool that would allow for creating different kinds of comparisons using spatial data. This led us to explore the crime incident dataset published by the city of San Francisco. Initially, we liked the idea of a tool that would allow a user to draw a geographic area and quickly analyze crime trends against a normalized crime rate. The front end of our first prototype was built with d3.js and leaflet.js, which leveraged our RESTful API built with Flask. The UI allowed a user to create and analyze data for events of their choosing.
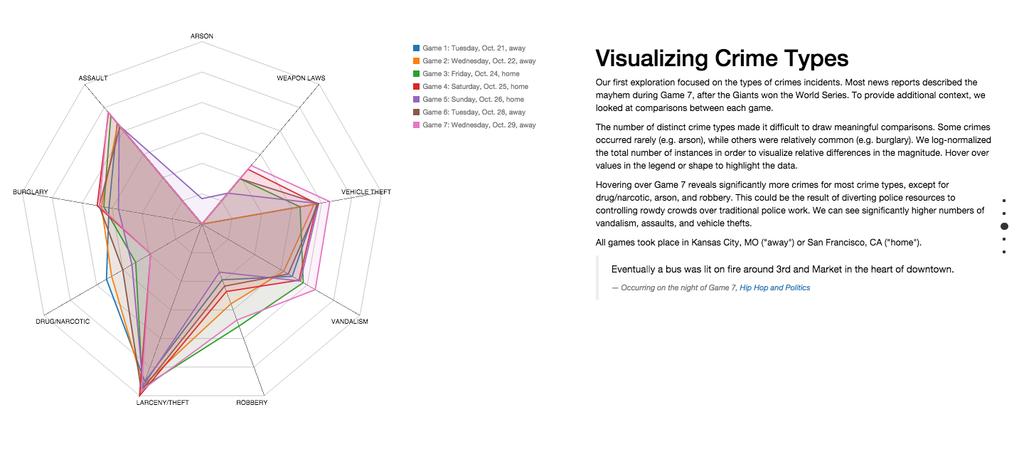
2 Figure 0: First version of our visualization/tool. Users draw a polygon on a map, define specific dates, and analyze data. Given all the possible types of analyses one may conduct, we had difficulty deciding upon the specific types of interactions we wanted to support. We eventually pivoted our project to focus on just a single set of events: all seven games of the 2014 World Series between the San Francisco Giants and Kansas City Royals. Shifting the focus of our project from analysis tool to a story driven visualization simplified our project tremendously. We felt that a single narrative was more conducive to a visualization, but we still wanted to preserve some aspects of our original idea of an analysis tool. The data itself had lacked context around the incidents and only offered a few fields that merited deeper analysis. For example, we knew the time and day and incident was reported, but we didn t know how many individuals were or the severity of the incident. We were still able to represent the same data in various ways based on visualization concepts from the course. We started our visualization with references to news reports of crime during the World Series. We used a simple map along with markers indicating points of interest and a short narrative. Figure 1: Story Introduction We presented the area of our analysis, and wanted to show a high level comparison of the different types of crime that came up during the world Series. After experimenting with some different graph types we selected a spider graph.

3 Figure 2: Radar chart of crime types for each World Series game. The radar chart seemed the most conducive to comparative analysis of different games. By hovering over the legend or the chart area, a user could see all of the general shapes of each game while still being able to select and focus on one specific game. We then used a small multiple visualization with total crimes on the y axis and hour of day as the x axis. This allowed the user to compare points in time across every game, simply by hovering over a point in time. Additionally, we provided a table for the user to reference characteristics of the games. Scanning the visualization horizontally shows how different Game 7 is from the other games. The significant rise in crime was something that many of our users noted. They suggested we include a vertical line in the graphs to highlight the start and end of each game. Unfortunately, we weren t able to include it in our final version.

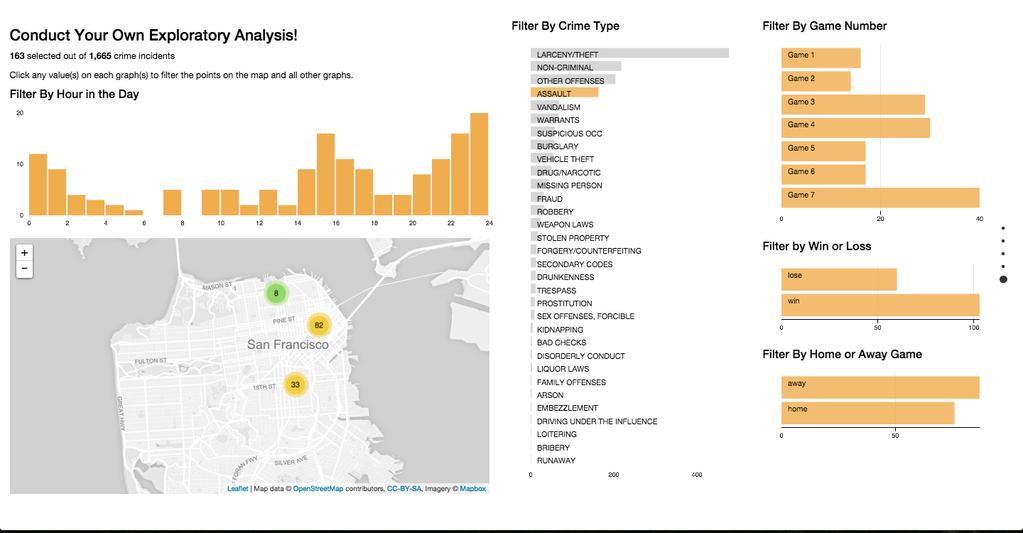
4 Figure 3: Small multiples total crimes per hour Our visualization ends with our exploratory dashboard. We were able to preserve this aspect of our initial design. It brings out a lot of interactivity and opportunities for further exploration. After reading our short analysis, users quickly analyzed the data for themselves. Frequently, users started by filtering by crime types. Vandalism and assault were usually the first filters that people selected given the references from the new reports we linked to. Combining the filters of crime type with specific games also yielded interesting insights for our users. Users can jump between specific regions of the map and combine multiple filters in order to test multiple hypotheses. Figure 4: Interactive dashboard


5 Related Work San Francisco crime data has been analyzed and visualized by numerous individuals and groups. After some research, we discovered that most visualization merely reduce the data to points on a map, choropleths, or aggregate statistics for the entire city. We provide a few examples of these visualizations below. Trulia created a heatmap and provided aggregate crime statistics. This approach doesn t lend itself to user driven analysis as it s mostly just summary statistics. Figure 5: Trula crime heatmap Crimespotting improves their crime visualization by providing the user additional tools for exploration. Users can filter the data by time, day/week, and type. However, it s not designed for comparing specific dates/times with each other, nor do they provide any aggregate level data. Lastly, the user doesn t have the ability to define a specific geographic region of interest. Figure 6: Crimespotting

6 Some experimental crime data visualizations express the crime rate through 3D representations of elevation. The shadows cast by the high crime rates can evoke an emotional response that a bar chart or heatmap can t. This, although informative, didn t allow for the exploration that we were looking for. Additionally there is no interactivity for people to better understand Figure 7: 3D crime visualization The 3D visualization also has some serious drawbacks. Despite the small multiples, it s still very difficult to compare the peaks by area and category given the view. It also lacks the ability to filter by time. Data San Francisco Crime Data supplied by the San Francisco Local Government. Tools We relied heavily on d3.js and dc.js, a high level JavaScript visualization library that leverages the quick tabular filtering capabilities of crossfilter.js and d3.js. We used dc.js for our dashboard visualization. We used Leaflet and Leaflet.draw for our mapping and drawing polygons. The first version of our visualization used an API that returned GeoJSON which we built using Flask, PostgreSQL and PostGIS. Steps The first step was to understand the data. We did a quick exploratory analysis, created some plots, but set aside all data accuracy issues for this assignment. We imported the data into our database, and then developed the API. We created a front end that read data from the API after the user created a polygon on our map. We started designing the front end on paper, but after iterating through several versions, we scraped our tool and began developing a story around the data. There were a few stories we initially considered. Bay to Breakers, Outside Lands, the World Series, etc. News reports of violence after Game 7 of the 2014 World Series gave us something compelling to investigate, so we started drawing potential prototypes. We borrowed the code for our dashboard from our first visualization and added other
7 visualizations. Over the course of this process we solicited feedback from our classmates and refined the story and the interactions of our visualization. Results & Feedback We worked with some of our peers to make sure our message was getting across clearly. People seemed to understand our thought process and also offered several improvements. We struggled with the complexity associated with building a general purpose tool, even if it was for a specific dataset. This iterative process occupied much of our time early on. At times, we received mixed feedback on the types of features users would like to see on our tool. There was some consensus around adding a baseline comparison features (e.g. compare Game 7 to the average number of crimes committed on a Wednesday in 2014). However, we had already shifted away from a World Series vs. San Francisco visualization to comparing World Series games with each other. The overall story of the visualization focuses on the progression of each game, between wins and losses, all the way to the climactic ending. Adding regional baseline data would certainly add more context, but we feld that it would potentially distract the user from our story. If we continued working on our general purpose tool, the need for a baseline comparison feature would be far greater. Demo and Thumbnail A live demo is available at: final/ Software Created All of the software we created is on the GitHub organization that we created which can be found at: There are three repositories, one for the final version of the visualization for the World Series that we created, one for the original viewer code that we used during the tool building phase, and lastly one for the database that we created that stores all the crime data.
8 Work Distribution Work Person Description Database John Set up the database using Postgres and Postgis, created the crime table, and demonstrating the ability to run spatial queries Bill Added a separate table for user generated events, which did not make its way into the final visualization API John Created the first draft of the API using Flask, which returned JSON of aggregate statistics based on the longitude and latitude of a spatial query First draft visualization Copy and layout Bill John Bill John Bill Fleshed out the API to return GeoJSON, made it production ready Worked on dashboard page using leaflet.js and dc.js Created the event creation page and functionality for returning data from the API using Backbone.js. Edited copy and additional details/styling Visualization layout using scrolling, first draft of copy Radar graph Bill Developed radar chart Small multiple John Modified existing code to fit our dataset Dashboard John Munged data using Python to create dashboard; Used dc.js to create graphs Bill Added clustered map feature to improve map readability; improved dashboard and styling.

9 Appendix
10
11
12
13
Data Analyst Nanodegree Syllabus
 Data Analyst Nanodegree Syllabus Discover Insights from Data with Python, R, SQL, and Tableau Before You Start Prerequisites : In order to succeed in this program, we recommend having experience working
Geobarra.org: A system for browsing and contextualizing data from the American Recovery and Reinvestment Act of 2009
 Geobarra.org: A system for browsing and contextualizing data from the American Recovery and Reinvestment Act of 2009 Ben Cohen, Michael Lissner, Connor Riley May 10, 2010 Contents 1 Introduction 2 2 Process
Good enough to great: A quick guide for better data visualizations
 Good enough to great: A quick guide for better data visualizations Contents Charts...4 Color... 11 Size... 16 Text...20 Dashboard layout...24 Conclusion...30 Good enough to great In today s world, successful
TDWI strives to provide course books that are contentrich and that serve as useful reference documents after a class has ended.
 Previews of TDWI course books offer an opportunity to see the quality of our material and help you to select the courses that best fit your needs. The previews cannot be printed. TDWI strives to provide
What s New in Spotfire DXP 1.1. Spotfire Product Management January 2007
 What s New in Spotfire DXP 1.1 Spotfire Product Management January 2007 Spotfire DXP Version 1.1 This document highlights the new capabilities planned for release in version 1.1 of Spotfire DXP. In this
Data Analyst Nanodegree Syllabus
 Data Analyst Nanodegree Syllabus Discover Insights from Data with Python, R, SQL, and Tableau Before You Start Prerequisites : In order to succeed in this program, we recommend having experience working
MiPhone Phone Usage Tracking
 MiPhone Phone Usage Tracking Team Scott Strong Designer Shane Miller Designer Sierra Anderson Designer Problem & Solution This project began as an effort to deter people from using their phones in class.
NewsConnect is a web application that allows users to see global connections in news, and makes it easy to find only the news you want to read.
 I. Project name NewsConnect II. Team members Meghana Bhat is a sophomore in Course 6 at MIT. For the NewsConnect project, Meghana created the code that made the app a reality. She worked to incorporate
The Observatory Tool Dashboard Guide
 To paraphrase Donella Meadows, we can't impose our will on Internet. We can listen to what Internet tells us, and discover how its properties and our values can work together to bring forth something much
Uber Push and Subscribe Database
 Uber Push and Subscribe Database June 21, 2016 Clifford Boyce Kyle DiSandro Richard Komarovskiy Austin Schussler Table of Contents 1. Introduction 2 a. Client Description 2 b. Product Vision 2 2. Requirements
Visual System Implementation
 Visual System Implementation Shamal AL-Dohuki and Ye Zhao Shamal AL-Dohuki Ph.D. candidate in the Department of Computer Science at Kent State University, Ohio, USA. Software Development Lead of TrajAnalytics
Scottish Improvement Skills
 Scottish Improvement Skills Creating a run chart on MS Excel 2007 Create and save a new Excel worksheet. Some of the details of steps given below may vary slightly depending on how Excel has been used
CPSC 444 Project Milestone III: Prototyping & Experiment Design Feb 6, 2018
 CPSC 444 Project Milestone III: Prototyping & Experiment Design Feb 6, 2018 OVERVIEW... 2 SUMMARY OF MILESTONE III DELIVERABLES... 2 1. Blog Update #3 - Low-fidelity Prototyping & Cognitive Walkthrough,
DKAN. Data Warehousing, Visualization, and Mapping
 DKAN Data Warehousing, Visualization, and Mapping DKAN User Manual Data warehousing, visualization, and mapping 1 Acknowledgements We d like to acknowledge the NuCivic team, led by Andrew Hoppin, which
Learning Objectives for Data Concept and Visualization
 Learning Objectives for Data Concept and Visualization Assignment 1: Data Quality Concept and Impact of Data Quality Summarize concepts of data quality. Understand and describe the impact of data on actuarial
Built for Speed: Comparing Panoply and Amazon Redshift Rendering Performance Utilizing Tableau Visualizations
 Built for Speed: Comparing Panoply and Amazon Redshift Rendering Performance Utilizing Tableau Visualizations Table of contents Faster Visualizations from Data Warehouses 3 The Plan 4 The Criteria 4 Learning
RethinkDB. Niharika Vithala, Deepan Sekar, Aidan Pace, and Chang Xu
 RethinkDB Niharika Vithala, Deepan Sekar, Aidan Pace, and Chang Xu Content Introduction System Features Data Model ReQL Applications Introduction Niharika Vithala What is a NoSQL Database Databases that
Product Requirements for Data Dwarf. Revisions
 Product Requirements for Data Dwarf Prepared by Sean Spearman Cody Brown Ray Smets Aimee Galang Tim Shen Mercury Squad seanmspeaman@gmail.com codybrwn551@aol.com rayjsmets@gmail.com aimeegalang@gmail.com
Eurostat Regions and Cities Illustrated: Usage guide
 Eurostat Regions and Cities Illustrated: Usage guide With Regions and Cities Illustrated, you can easily visualise regional indicators and view data for regions you are most interested in. This interactive
ODK Tables Maps. Christopher Gelon
 ODK Tables Maps Christopher Gelon Department of Computer Science and Engineering University of Washington, Seattle, WA [USA] cgelon@cse.uw.edu ABSTRACT Open Data Kit (ODK) [1] is a set of open source tools
Transit Signal Priority on the California 1 Bus Line
 Transit Signal Priority on the California 1 Bus Line INFO 247 Information Visualization Final Project Sai Dulla, Paul Sohn, and Jong kai Yang Introduction The San Francisco Municipal Transportation Authority
ATRIS User Guide. Table of Contents
 ATRIS User Guide Table of Contents Overview of ATRIS... 4 Purpose of ATRIS... 4 About this Manual... 4 Intended Audience... 5 Definitions... 5 Overview of the ATRIS Screen Layout... 6 Search Screen...
CPU DB Data Visualization Senior Project Report
 CPU DB Data Visualization Senior Project Report Marek Moreno ( mmoren14@calpoly.edu ) Ruchita Patel ( rpatel31@calpoly.edu ) 16 June 2017 Introduction Project Overview/Executive Summary Given the CPU database
Proposal: Judicial Case Law History Timeline viewer CPSC 547
 Proposal: Judicial Case Law History Timeline viewer CPSC 547 Ken Mansfield kenmansfield@gmail.com 1 Overview I am working with the local startup Knomos to provide a solution to visualizing the citations
Product Manager Visualization Final Report
 Project Title: The Product Manager Dashboard Product Manager Visualization Final Report Students: Becca Stanger and Project Goals: To offer agile development Product Managers visualizations tools to monitor
Chapter 2: Understanding Data Distributions with Tables and Graphs
 Test Bank Chapter 2: Understanding Data with Tables and Graphs Multiple Choice 1. Which of the following would best depict nominal level data? a. pie chart b. line graph c. histogram d. polygon Ans: A
SAVI Advanced The Basics
 SAVI Advanced The Basics Help Topics The Basics Getting Started System Requirements Getting Started Using SAVI Advanced Exploring the Data in SAVI Advanced Viewing Change Over Time Identifying Target Geographies
Visual Analytics Tools for the Global Change Assessment Model. Ross Maciejewski Arizona State University
 Visual Analytics Tools for the Global Change Assessment Model Ross Maciejewski Arizona State University GCAM Simulation After running thousands or even hundreds of simulations through GCAM this process
Lehigh Walking Wizard Final Report Steven Costa & Zhi Huang
 Lehigh Walking Wizard Final Report Steven Costa & Zhi Huang Table of Contents I. Executive Summary II. Introduction & Motivation a. What is the Problem? b. Why is it interesting/important? c. How do you
TrajAnalytics: A software system for visual analysis of urban trajectory data
 TrajAnalytics: A software system for visual analysis of urban trajectory data Ye Zhao Computer Science, Kent State University Xinyue Ye Geography, Kent State University Jing Yang Computer Science, University
User-Centered Design. Jeff Bos, Design Insights BlackBerry
 User-Centered Design Jeff Bos, Design Insights BlackBerry Overview Real World Design Challenges UX Design Principles Cognitive Demand Techniques for reducing workload Discount Usability Techniques Best
Implementing ITIL v3 Service Lifecycle
 Implementing ITIL v3 Lifecycle WHITE PAPER introduction GSS INFOTECH IT services have become an integral means for conducting business for all sizes of businesses, private and public organizations, educational
Automated Testing of Tableau Dashboards
 Kinesis Technical Whitepapers April 2018 Kinesis CI Automated Testing of Tableau Dashboards Abstract Companies make business critical decisions every day, based on data from their business intelligence
Migrating from ArcIMS to ArcGIS Server Atlanta Regional Commission, Atlanta, GA. Brock Kingston Latitude Geographics
 Migrating from ArcIMS to ArcGIS Server Atlanta Regional Commission, Atlanta, GA Brock Kingston Latitude Geographics Agenda GIS at ARC ARC s initial foray into web-gis (ArcIMS) Successes & Challenges Next
D&B Market Insight Release Notes. July 2016
 D&B Market Insight Release Notes July 2016 Table of Contents User Experience and Performance 3 Mapping.. 4 Visualizations.... 5 User Experience and Performance Speed Improvements Improvements have been
The Process of Interaction Design DECO1200
 The Process of Interaction Design DECO1200 Outline Practical issues in interaction design Who are the users? What are their needs? How are interactive products designed? The four basic activities of interaction
BETA DEMO SCENARIO - ATTRITION IBM Corporation
 BETA DEMO SCENARIO - ATTRITION 1 Please Note: IBM s statements regarding its plans, directions, and intent are subject to change or withdrawal without notice at IBM s sole discretion. Information regarding
Analysis Tool Project
 Tool Overview The tool we chose to analyze was the Java static analysis tool FindBugs (http://findbugs.sourceforge.net/). FindBugs is A framework for writing static analyses Developed at the University
Data 100. Lecture 5: Data Cleaning & Exploratory Data Analysis
 Data 100 Lecture 5: Data Cleaning & Exploratory Data Analysis Slides by: Joseph E. Gonzalez, Deb Nolan, & Joe Hellerstein jegonzal@berkeley.edu deborah_nolan@berkeley.edu hellerstein@berkeley.edu? Last
PYRAMID April 2018 Release
 PYRAMID 2018.03 April 2018 Release The April release of Pyramid brings a list of over 40 new key features and numerous functional upgrades, designed to make Pyramid s OS the leading solution for customers
Analysing crime data in Maps for Office and ArcGIS Online
 Analysing crime data in Maps for Office and ArcGIS Online For non-commercial use only by schools and universities Esri UK GIS for School Programme www.esriuk.com/schools Introduction ArcGIS Online is a
DATA ANALYTICS BOOT CAMP
 The UofT SCS DATA ANALYTICS BOOT CAMP Curriculum Overview Over the past decade, the explosion of data has transformed nearly every industry known to man. Whether it s marketing, healthcare, government,
SQL, Scaling, and What s Unique About PostgreSQL
 SQL, Scaling, and What s Unique About PostgreSQL Ozgun Erdogan Citus Data XLDB May 2018 Punch Line 1. What is unique about PostgreSQL? The extension APIs 2. PostgreSQL extensions are a game changer for
DSC 201: Data Analysis & Visualization
 DSC 201: Data Analysis & Visualization Exploratory Data Analysis Dr. David Koop What is Exploratory Data Analysis? "Detective work" to summarize and explore datasets Includes: - Data acquisition and input
PYRAMID Headline Features. April 2018 Release
 PYRAMID 2018.03 April 2018 Release The April release of Pyramid brings a big list of over 40 new features and functional upgrades, designed to make Pyramid s OS the leading solution for customers wishing
Concept Production. S ol Choi, Hua Fan, Tuyen Truong HCDE 411
 Concept Production S ol Choi, Hua Fan, Tuyen Truong HCDE 411 Travelust is a visualization that helps travelers budget their trips. It provides information about the costs of travel to the 79 most popular
Visualization of EU Funding Programmes
 Visualization of EU Funding Programmes 186.834 Praktikum aus Visual Computing WS 2016/17 Daniel Steinböck January 28, 2017 Abstract To fund research and technological development, not only in Europe but
Extension Web Publishing 3 Lecture # 1. Chapter 6 Site Types and Architectures
 Chapter 6 Site Types and Architectures Site Types Definition: A public Web site, an Internet Web site, an external Web site or simply a Web site is one that is not explicitly restricted to a particular
MIS0855: Data Science In-Class Exercise for Mar Creating Interactive Dashboards
 MIS0855: Data Science In-Class Exercise for Mar 25-27 Creating Interactive Dashboards Objective: Create a dashboard with interactive data filtering using Tableau Learning Outcomes: Understand how to create
1. Start ArcMap by going to the Start menu > All Programs > ArcGIS > ArcMap.
 Learning ArcGIS: Introduction to ArcMap 10.1 The Map Document Feature Manipulation Navigating ArcMap Map Documents, Layers, and Features Shapes, Location, and Attribute Data Symbology Zoom, Pan and Map
Esri and MarkLogic: Location Analytics, Multi-Model Data
 Esri and MarkLogic: Location Analytics, Multi-Model Data Ben Conklin, Industry Manager, Defense, Intel and National Security, Esri Anthony Roach, Product Manager, MarkLogic James Kerr, Technical Director,
Excel Tutorial 4: Analyzing and Charting Financial Data
 Excel Tutorial 4: Analyzing and Charting Financial Data Microsoft Office 2013 Objectives Use the PMT function to calculate a loan payment Create an embedded pie chart Apply styles to a chart Add data labels
FLORIDA DEPARTMENT OF TRANSPORTATION PRODUCTION BIG DATA PLATFORM
 FLORIDA DEPARTMENT OF TRANSPORTATION PRODUCTION BIG DATA PLATFORM RECOMMENDATION AND JUSTIFACTION Executive Summary: VHB has been tasked by the Florida Department of Transportation District Five to design
Create Awesomeness: Use Custom Visualizations to Extend SAS Visual Analytics to Get the Results You Need
 Paper SAS1800-2018 Create Awesomeness: Use Custom Visualizations to Extend SAS Visual Analytics to Get the Results You Need Robby Powell and Renato Luppi, SAS Institute Inc., Cary, NC ABSTRACT SAS Visual
MicroStrategy Academic Program
 MicroStrategy Academic Program Creating a center of excellence for enterprise analytics and mobility. GEOSPATIAL ANALYTICS: HOW TO VISUALIZE GEOSPATIAL DATA ON MAPS AND CUSTOM SHAPE FILES APPROXIMATE TIME
THE DATA ANALYTICS BOOT CAMP
 THE DATA ANALYTICS BOOT CAMP CURRICULUM OVERVIEW Over the course of the past decade, the explosion of data has transformed nearly every industry known to man. Whether it s in marketing, healthcare, government,
Seamless Dynamic Web (and Smart Device!) Reporting with SAS D.J. Penix, Pinnacle Solutions, Indianapolis, IN
 Reporting with SAS D.J. Penix, Pinnacle Solutions, Indianapolis, IN") Paper RIV05 Seamless Dynamic Web (and Smart Device!) Reporting with SAS D.J. Penix, Pinnacle Solutions, Indianapolis, IN ABSTRACT The SAS Business Intelligence platform provides a wide variety of reporting
Paper RIV05 Seamless Dynamic Web (and Smart Device!) Reporting with SAS D.J. Penix, Pinnacle Solutions, Indianapolis, IN ABSTRACT The SAS Business Intelligence platform provides a wide variety of reporting
Ovation Process Historian
 Ovation Process Historian Features Designed to meet the needs of precision, performance, scalability and historical data management for the Ovation control system Collects historical data of Ovation process
INDEX UNIT 4 PPT SLIDES
 INDEX UNIT 4 PPT SLIDES S.NO. TOPIC 1. 2. Screen designing Screen planning and purpose arganizing screen elements 3. 4. screen navigation and flow Visually pleasing composition 5. 6. 7. 8. focus and emphasis
UCF DATA ANALYTICS AND VISUALIZATION BOOT CAMP
 UCF DATA ANALYTICS AND VISUALIZATION BOOT CAMP CURRICULUM OVERVIEW Over the past decade, the explosion of data has transformed nearly every industry known to man. Whether it s marketing, healthcare, government,
Texas Death Row. Last Statements. Data Warehousing and Data Mart. By Group 16. Irving Rodriguez Joseph Lai Joe Martinez
 Texas Death Row Last Statements Data Warehousing and Data Mart By Group 16 Irving Rodriguez Joseph Lai Joe Martinez Introduction For our data warehousing and data mart project we chose to use the Texas
SECURITY AUTOMATION BEST PRACTICES. A Guide on Making Your Security Team Successful with Automation SECURITY AUTOMATION BEST PRACTICES - 1
 SECURITY AUTOMATION BEST PRACTICES A Guide on Making Your Security Team Successful with Automation SECURITY AUTOMATION BEST PRACTICES - 1 Introduction The best security postures are those that are built
We turn hard problems into great software.
 We turn hard problems into great software. We are passionate individuals focused on crafting impactful solutions to our clients most complex problems. CPO and Cofounder Ingrid Alongi 2 We Develop Applications
Rediscover Charts IN THIS CHAPTER NOTE. Inserting Excel Charts into PowerPoint. Getting Inside a Chart. Understanding Chart Layouts
 6 Rediscover Charts Brand new to Office 2007 is the new version of Charts to replace the old Microsoft Graph Chart and the Microsoft Excel Graph both of which were inserted as OLE objects in previous versions
16 Data Visualizations. to Improve Your Application
 16 Data Visualizations to Improve Your Application Table of Contents Best data visualizations to boost customer satisfaction Introduction 2 Types of Visualizations 3 Static vs. Animated Charts 6 Drilldowns
Outline. The Collaborative Research Platform for Data Curation and Repositories: CKAN For ANGIS Data Portal. Open Access & Open Data.
 Outline The Collaborative Research Platform for Data Curation and Repositories: CKAN For ANGIS Data Portal Open Access & Open Data ANGIS data portal New developed features Future works Hsiung-Ming Liao,
Data 100 Lecture 5: Data Cleaning & Exploratory Data Analysis
 OrderNum ProdID Name OrderId Cust Name Date 1 42 Gum 1 Joe 8/21/2017 2 999 NullFood 2 Arthur 8/14/2017 2 42 Towel 2 Arthur 8/14/2017 1/31/18 Data 100 Lecture 5: Data Cleaning & Exploratory Data Analysis
PROJECT REPORT. TweetMine Twitter Sentiment Analysis Tool KRZYSZTOF OBLAK C
 PROJECT REPORT TweetMine Twitter Sentiment Analysis Tool KRZYSZTOF OBLAK C00161361 Table of Contents 1. Introduction... 1 1.1. Purpose and Content... 1 1.2. Project Brief... 1 2. Description of Submitted
Process Book. Website Github Repo. By Claudia Huang, Raul Jordan and Jacques van Rhyn
 PyCoin: Process Book Website Github Repo By Claudia Huang, Raul Jordan and Jacques van Rhyn Our Project We live in a period of unprecedented change, a time where viable challenges to some of core belief
Optimize Online Testing for Site Optimization: 101. White Paper. White Paper Webtrends 2014 Webtrends, Inc. All Rights Reserved
 Optimize Online Testing for Site Optimization: 101 White Paper Overview Understanding the differences between A/B and multivariate testing helps marketers select the proper method for reaching optimization
CS Equalizing Society - Assignment 8. Interactive Hi-fi Prototype
 CS 147 - Equalizing Society - Assignment 8 Interactive Hi-fi Prototype Crystal Escolero - Design and Product Management Jessica Guo - Development and User Testing Trevor Rex - Development and User Testing
The main website for Henrico County, henrico.us, received a complete visual and structural
 Page 1 1. Program Overview The main website for Henrico County, henrico.us, received a complete visual and structural overhaul, which was completed in May of 2016. The goal of the project was to update
Cognitive Walkthrough Evaluation
 Columbia University Libraries / Information Services Digital Library Collections (Beta) Cognitive Walkthrough Evaluation by Michael Benowitz Pratt Institute, School of Library and Information Science Executive
SAS Visual Analytics 8.2: What s New in Reporting?
 ABSTRACT SAS 1916-2018 SAS Visual Analytics 8.2: What s New in Reporting? Rajiv Ramarajan and Jordan Riley Benson, SAS Institute Inc., Cary, NC SAS Visual Analytics 8.2 extends the unified SAS user experience
Google FusionTables for Global Health User Manual
 Google FusionTables for Global Health User Manual Version: January 2015 1 1. Introduction... 3 Use Requirements... 3 Video Tutorials... 3 2. Getting started with Google FusionTables... 4 2.1. Setup...
Blitz: Automating Interaction in Visualization
 Blitz: Automating Interaction in Visualization Catherine Mullings Stanford University cmulling@stanford.edu Ben-han Sung Stanford University bsung93@stanford.edu Andrei Terentiev Stanford University andreit1@stanford.edu
MGMT 3125 Introduction to Data Visualization
 MGMT 3125 Introduction to Data Visualization John Sokol, MS Week 2 1/30/2019 Chapter 2: Choose an effective visual Agenda Chapter 2: Choose an effective visual Introduction to Tableau Week 2 action items
SOFTWARE REQUIREMENTS ENGINEERING LECTURE # 7 TEAM SKILL 2: UNDERSTANDING USER AND STAKEHOLDER NEEDS REQUIREMENT ELICITATION TECHNIQUES-IV
 1 SOFTWARE REQUIREMENTS ENGINEERING LECTURE # 7 TEAM SKILL 2: UNDERSTANDING USER AND STAKEHOLDER NEEDS REQUIREMENT ELICITATION TECHNIQUES-IV 12 th June, 2013 Instructor Information 2 Course Instructor:
SECURITY AUTOMATION BEST PRACTICES. A Guide to Making Your Security Team Successful with Automation
 SECURITY AUTOMATION BEST PRACTICES A Guide to Making Your Security Team Successful with Automation TABLE OF CONTENTS Introduction 3 What Is Security Automation? 3 Security Automation: A Tough Nut to Crack
Dynamic Aggregation to Support Pattern Discovery: A case study with web logs
 Dynamic Aggregation to Support Pattern Discovery: A case study with web logs Lida Tang and Ben Shneiderman Department of Computer Science University of Maryland College Park, MD 20720 {ltang, ben}@cs.umd.edu
Viságe.BIT. An OLAP/Data Warehouse solution for multi-valued databases
 Viságe.BIT An OLAP/Data Warehouse solution for multi-valued databases Abstract : Viságe.BIT provides data warehouse/business intelligence/olap facilities to the multi-valued database environment. Boasting
MIS 0855 Data Science (Section 006) Fall 2017 In-Class Exercise (Day 15) Creating Interactive Dashboards
 Fall 2017 In-Class Exercise (Day 15) Creating Interactive Dashboards") MIS 0855 Data Science (Section 006) Fall 2017 In-Class Exercise (Day 15) Creating Interactive Dashboards Objective: Create a dashboard with interactive data filtering using Tableau Learning Outcomes: Understand
MIS 0855 Data Science (Section 006) Fall 2017 In-Class Exercise (Day 15) Creating Interactive Dashboards Objective: Create a dashboard with interactive data filtering using Tableau Learning Outcomes: Understand
Chapter 2 Example Modeling and Forecasting Scenario
 Chapter 2 Example Modeling and Forecasting Scenario This scenario is for a hypothetical project that aims to re-launch a website. It demonstrates the thinking process and practical implementation of using
Spreadsheet and Graphing Exercise Biology 210 Introduction to Research
 1 Spreadsheet and Graphing Exercise Biology 210 Introduction to Research There are many good spreadsheet programs for analyzing data. In this class we will use MS Excel. Below are a series of examples
EXCEL DASHBOARD AND REPORTS BASIC SKILLS
 Let s Reach For Excellence! TAN DUC INFORMATION TECHNOLOGY SCHOOL JSC Address: 103 Pasteur, Dist.1, HCMC Tel: 08 38245819; 38239761 Email: traincert@tdt-tanduc.com Website: www.tdt-tanduc.com; www.tanducits.com
Media Transparency - An Interactive Visualization of Advertisement Money Flows between Governmental Organizations and Austrian Media Companies
 Media Transparency - An Interactive Visualization of Advertisement Money Flows between Governmental Organizations and Austrian Media Companies Raphael Jüttner * Bernhard Potuzak Ramon Miftari ABSTRACT
USER EXPERIENCE DESIGN GA.CO/UXD
 General Assembly Course Curriculum USER EXPERIENCE DESIGN User Experience Design Table of Contents 3 Overview 4 Students 5 Curriculum Projects & Units 11 Frequently Asked Questions 12 Contact Information
Operations Dashboard for ArcGIS Monitoring GIS Operations. Michele Lundeen Esri
 Operations Dashboard for ArcGIS Monitoring GIS Operations Michele Lundeen Esri mlundeen@esri.com What is a dashboard? Conceptual term, can mean different things to different audiences Dashboards provide
SobekCM Digital Repository : A Retrospective
 SobekCM Digital Repository : A Retrospective By Mark Sullivan (12/11/2014) As 2014 draws to a close, the time is ripe for a retrospective on the accomplishments of the SobekCM community over the last twelve
Integrated Clinical Systems, Inc. announces JReview 13.1 with new AE Incidence
 Integrated Clinical Systems, Inc. announces JReview 13.1 with new AE Incidence Table (nested descending sort AE Table) Report Template, additional Graph Types, and a major new area Data Quality Analysis
SuperStream speeds up time to market for new product by 25%
 SuperStream speeds up time to market for new product by 25% The company strongly supports global companies from Japan with the relaunch of management foundational solution SuperStream-NX Carrying out a
Participants. Results & Recommendations. Summary of Findings from User Study Round 3. Overall. Dashboard
 Summary of Findings from User Study Round 3 Participants 6 people total 4 Product users Jay Nicole Chris Nic 2 Non Product users Karine (QB ProAdvisor) Ellen (pilot test) Results & Recommendations Overall
MicroStrategy Desktop
 MicroStrategy Desktop Quick Start Guide MicroStrategy Desktop is designed to enable business professionals like you to explore data, simply and without needing direct support from IT. 1 Import data from
GPS/GIS Activities Summary
 GPS/GIS Activities Summary Group activities Outdoor activities Use of GPS receivers Use of computers Calculations Relevant to robotics Relevant to agriculture 1. Information technologies in agriculture
1. I NEED TO HAVE MULTIPLE VERSIONS OF VISUAL STUDIO INSTALLED IF I M MAINTAINING APPLICATIONS THAT RUN ON MORE THAN ONE VERSION OF THE.
 CUSTOMER PAIN POINTS 1. I NEED TO HAVE MULTIPLE VERSIONS OF VISUAL STUDIO INSTALLED IF I M MAINTAINING APPLICATIONS THAT RUN ON MORE THAN ONE VERSION OF THE.NET FRAMEORK. THAT S TAKING UP SPACE ON MY HARDDRIVE
Introduction to Health Informatics
 Introduction to Health Informatics Introduction to Hospital Episode Statistics (HES) Session 3 - Looking at several diagnoses for each age - Merging data files Date: 21/08/07 16:37:09 Written by: Robin
Qlik s Associative Model
 White Paper Qlik s Associative Model See the Whole Story that Lives Within Your Data January, 2017 qlik.com Table of Contents Introduction 3 Qlik s associative model 3 Query-based visualization tools only
METIER Course n februray Introduction to ArcView 3
 METIER Course n 2 Information Management in Environmental Sciences 19-23 februray 2007 Introduction to ArcView 3 tél : (33) 04 67 54 87 54 Maison de la Télédétection en Languedoc-Roussillon fax : (33)
Real-Time & Big Data GIS: Leveraging the spatiotemporal big data store
 Real-Time & Big Data GIS: Leveraging the spatiotemporal big data store Suzanne Foss Product Manager, Esri sfoss@esri.com Ricardo Trujillo Real-Time & Big Data GIS Developer, Esri rtrujillo@esri.com @rtrujill007
Market Insight Excelsior 2 Module Training Manual v2.0
 Market Insight Excelsior 2 Module Training Manual v2.0 Excelsior 2 Module Manual Version: 2.0 Software Release: Data Set: 2016 Q4 Training (US) Excel Version: Office 365 D&B Market Insight is powered by