Objective: Class Activities
|
|
|
- Charlotte McCormick
- 6 years ago
- Views:
Transcription
1 Objective: A Pivot Table is way to present information in a report format. The idea is that you can click drop down lists and change the data that is being displayed. Students will learn how to group data using pivot tables. Class Activities With your Excel worksheet open type in the following data (I have created a spreadsheet with the data in it called Pivot_Table_Data that you can open and do a copy/paste into your spreadsheet) 1

2 Create Pivot Table Highlight the data that will be going in to your Pivot Table (cells A1 to D37).On the Excel Ribbon, click the Insert tab. From the Insert tab, locate Pivot Tables. The Create Pivot Tables dialogue box appears: 2

3 In the dialogue box select the default data which you previously selected is in the Table/Range textbox. You can select different cells by clicking the icon to the right of the Table/Range textbox. You can also specify an external data source, such as a text file, for the data in your Pivot Table. Selected a New Worksheet as the place where the Pivot Table will be placed. Click OK. When you click OK, Excel presents you with a rather complex layout. The area on the right should look something like this one below: 3
4 4


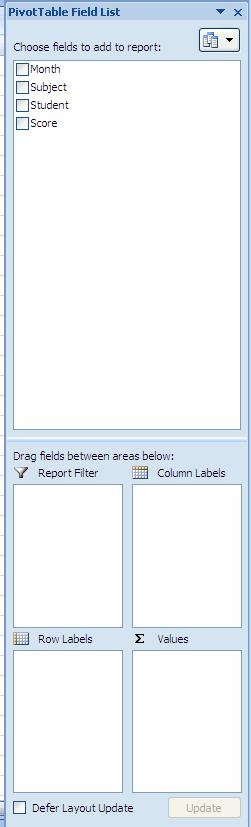
5 Now take a look at the Pivot Table Field List. It has tick boxes for Month, Subject, Student, and Score. These are column headings from the original spreadsheet data. You will put the Month in cell A4 on our Pivot Table, Subject is in cell B4, Student is in cell B1, and Score is the Average scores in cells B5 to G7. You'll see how it works, though. First tick all four boxes in the field list: Excel will create a basic (and messy) Pivot Table for you. But you're going to put the 4 fields into the 4 areas below. Here are the 4 areas you can drag to: For the Report Filter, you want the name of a Student. For the Column Labels, the Subject, and for the Row Labels, the Month. The Values will be the Average scores. If you look at the Field areas after you have ticked all four boxes, however, you may see something like this: 5

6 Month, Subject and Student have all been grouped under Row Labels. You can drag and drop these in order to move them to a new location. If you don't fancy dragging and dropping, simply click the Student item with your left button. From the menu that appears, select Move to Report Filter. You first want to move Student in the Row Labels box. Hold down your left mouse button, and then drag it in to the Report Filter box. Move Subject from Row Labels to the Column Labels area. 6

7 The Pivot Table on your spreadsheet will look a lot different, too. It should look like the graphic below: Change Sum Total to Average The reason why the scores from our Pivot Table are so strange is because Excel is using the wrong formula. It's using a Sum total when you want it to use an Average. The numbers have all been added up. But we want averages, instead. To change the formula, click on Grand Total Value and select Value Field Settings: 7


8 You'll then see the following dialogue box: Change the Formula from Sum to Average, and then click OK. Your Average formula won't be formatted to any decimal places. 8


9 Format Decimal Places To format your decimal place highlight you data in the Grand Total row. On the Home tab in Excel, locate the Format, Format Cells panel. Select Number and Decimal places 0 to format your Averages so that it has no decimal places. Format student grades and Grand Total numbers to no decimal places. 9

10 Your Pivot Table will then look like this: Add Descriptive Names Look at cells that contain the words "Average of Score," "Column Labels," and "Row Labels." These are not descriptive names. You can click inside of these cells and type your own headings, in exactly the same way as you would to enter text in a normal cell. Change the following cells to" Average of Score - Student Averages Column Labels - Subject Row Labels - Month Center Data in Cells Next you will center the data in the cells for subject names, student grades, and the Grand Total cell. Select all the data in these specific cells and center align them using the center align button on the home tab. The data that you should center is outlined in red below. Your table should now look like this: 10

11 Criteria Excellent(10) Good(6) Poor(3) Values are entered into Worksheet cells A1 to D37 Data is in or in incorrect columns Columns are missing Month, Subject, Student and Score Fields are selected Student appears under Report Subject appears under Column Labels Month appears under Row Labels Sum of Score appears under Values Sum is formatted with no decimal places Student grades and Grand Total data are formatted with no decimal places Field names have been changed to Student Average, Column Label, Row Labels Subject names, student grades, and Grand Total cell are center aligned Missing one of the fields Student is inaccurately displayed Subject is inaccurately displayed Month is inaccurately displayed Some is done incorrectly Sum contains decimal places Grades and total contains decimal places One field name has not been changed One field is not center aligned Missing two or more fields Two or more fields have not been changed Two or more fields are not center aligned 11
Creating Automated Dashboard Excel 2013 Contents
 Creating Automated Dashboard Excel 2013 Contents Summarize Data Using Pivot Table... 2 Constructing Report Summary... 2 Create a PivotTable from worksheet data... 2 Add fields to a PivotTable... 2 Grouping
Candy is Dandy Project (Project #12)
") Candy is Dandy Project (Project #12) You have been hired to conduct some market research about M&M's. First, you had your team purchase 4 large bags and the results are given for the contents of those
Candy is Dandy Project (Project #12) You have been hired to conduct some market research about M&M's. First, you had your team purchase 4 large bags and the results are given for the contents of those
Excel Tables and Pivot Tables
 A) Why use a table in the first place a. Easy to filter and sort if you only sort or filter by one item b. Automatically fills formulas down c. Can easily add a totals row d. Easy formatting with preformatted
Graded Project. Excel 2016
 Excel 2016 PENN FOSTER, INC. 2016 INTRODUCTION CONTENTS INTRODUCTION 2 INSTRUCTIONS 2 SCORING GUIDELINES 6 SUBMITTING YOUR PROJECT 8 PAGE 1 GRADED PROJECT EXCEL 2016 INTRODUCTION This project requires
Microsoft Excel 2010 Training. Excel 2010 Basics
 Microsoft Excel 2010 Training Excel 2010 Basics Overview Excel is a spreadsheet, a grid made from columns and rows. It is a software program that can make number manipulation easy and somewhat painless.
Excel Tables & PivotTables
 Excel Tables & PivotTables A PivotTable is a tool that is used to summarize and reorganize data from an Excel spreadsheet. PivotTables are very useful where there is a lot of data that to analyze. PivotTables
Pivot Tables, Lookup Tables and Scenarios
 Introduction Format and manipulate data using pivot tables. Using a grading sheet as and example you will be shown how to set up and use lookup tables and scenarios. Contents Introduction Contents Pivot
Excel. Spreadsheet functions
 Excel Spreadsheet functions Objectives Week 1 By the end of this session you will be able to :- Move around workbooks and worksheets Insert and delete rows and columns Calculate with the Auto Sum function
Excel 2013 PivotTables and PivotCharts
 Excel 2013 PivotTables and PivotCharts PivotTables... 1 PivotTable Wizard... 1 Creating a PivotTable... 2 Groups... 2 Rows Group... 3 Values Group... 3 Columns Group... 4 Filters Group... 5 Field Settings...
Creating a Pivot Table
 Contents Introduction... 1 Creating a Pivot Table... 1 A One-Dimensional Table... 2 A Two-Dimensional Table... 4 A Three-Dimensional Table... 5 Hiding and Showing Summary Values... 5 Adding New Data and
Microsoft Excel Pivot Tables & Pivot Table Charts
 Microsoft Excel 2013 Pivot Tables & Pivot Table Charts A pivot table report allows you to analyze and summarize a million rows of data in Excel 2013 without entering a single formula. Pivot Tables let
PivotTable Reports. Notice that PivotTable Tools tabs appear on the Ribbon, which include the Options and Design tabs.
 PivotTable Reports This exercise will help you practice creating and working with PivotTable reports in Excel. To complete this assignment, you will need to open the PivotTable Assignment from the Community
Step 3: Type the data in to the cell
 Simple Instructions for using Microsoft Excel The goal of these instructions is to familiarize the user with the basics of Excel. These directions will cover data entry, formatting, formulas and functions,
An Introduction to Microsoft Excel For Adult Learners. A Project-Based Approach
 An Introduction to Microsoft Excel For Adult Learners A Project-Based Approach Introduction Why should you use Microsoft Excel? Microsoft Excel is one of the most common tools in any business. It may be
SPREADSHEET (Excel 2007)
") SPREADSHEET (Excel 2007) 1 U N I T 0 4 BY I F T I K H A R H U S S A I N B A B U R Spreadsheet Microsoft Office Excel 2007 (or Excel) is a computer program used to enter, analyze, and present quantitative
SPREADSHEET (Excel 2007) 1 U N I T 0 4 BY I F T I K H A R H U S S A I N B A B U R Spreadsheet Microsoft Office Excel 2007 (or Excel) is a computer program used to enter, analyze, and present quantitative
Microsoft Excel Microsoft Excel
 Excel 101 Microsoft Excel is a spreadsheet program that can be used to organize data, perform calculations, and create charts and graphs. Spreadsheets or graphs created with Microsoft Excel can be imported
plus ltd Reports- PIVOT Essentials # Quick Instructions- (ie Click On [CO]) Notes / screenshots Runs your PM data into Excel
![plus ltd Reports- PIVOT Essentials # Quick Instructions- (ie Click On [CO]) Notes / screenshots Runs your PM data into Excel](/thumbs/83/87076989.jpg "plus ltd Reports- PIVOT Essentials # Quick Instructions- (ie Click On [CO]) Notes / screenshots Runs your PM data into Excel") # Quick Instructions- (ie Click On [CO]) Notes / screenshots 1. SIMS Reports Run Report +Focus Student find the Report: PM to PIVOT (date) E (May need to CO Enable Content button on a yellow Ribbon bar
# Quick Instructions- (ie Click On [CO]) Notes / screenshots 1. SIMS Reports Run Report +Focus Student find the Report: PM to PIVOT (date) E (May need to CO Enable Content button on a yellow Ribbon bar
Pivot Tables. This is a handout for you to keep. Please feel free to use it for taking notes.
 Class Description This is an introduction to using Pivot Tables in spreadsheets, focusing on Microsoft Excel. Attendees should have a good basic knowledge of spreadsheets. Class Length One and one half
Excel 2010-Part. Two
 Jefferson Parish Library Computer Training Team Excel 2010-Part Two August 2011 Symbols Used in Formulas Add Subtract Divide Multiply + - / * When working with formulas in Excel you will use basic keyboard
2. This is a cell; this cell is designated as A1.
 Queen s Learning Commons: Microsoft Excel Basics 1. These are the columns. 2. This is a cell; this cell is designated as A1. 3. Let s make a table. Click on the box you want to put text in and simply begin
Using Numbers, Formulas, and Functions
 UNIT FOUR: Using Numbers, Formulas, and Functions T o p i c s : Using the Sort function Create a one-input data table Hide columns Resize columns Calculate with formulas Explore functions I. Using the
A cell is highlighted when a thick black border appears around it. Use TAB to move to the next cell to the LEFT. Use SHIFT-TAB to move to the RIGHT.
 Instructional Center for Educational Technologies EXCEL 2010 BASICS Things to Know Before You Start The cursor in Excel looks like a plus sign. When you click in a cell, the column and row headings will
Word 2007 Tables Part 2
 Word 2007 Tables Part 2 In this lesson you will learn to use formulas within tables, change the size and positions of a tables, convert information from table form to text form and vice versa, insert clipart
Advanced Excel for EMIS Coordinators
 Advanced Excel for EMIS Coordinators Helen Mills helenmills@metasolutions.net 2015 Metropolitan Educational Technology Association Outline Macros Conditional Formatting Text to Columns Pivot Tables V-Lookup
Sort, Filter, Pivot Table
 Sort, Filter, Pivot Table Sort A common database task is to rearrange the information based on a header/field or headers/fields. This is called Sorting or Filtering. Sorting rearranges all of the information
4. Spreadsheet Design Features: Formatting
 Spreadsheet Methods 5N1977 4. Spreadsheet Design Features: Formatting Contents 1. Recognise the Features Available on Toolbars... 1 2. Insert and Delete Rows and Columns... 2 3. Adjust Column and Row Widths...
MS Office 2016 Excel Pivot Tables - notes
 Introduction Why You Should Use a Pivot Table: Organize your data by aggregating the rows into interesting and useful views. Calculate and sum data quickly. Great for finding typos. Create a Pivot Table
Mathematical Operators for Excel
 EXCEL ADVANCED 1 Mathematical Operators for Excel < > = >=
Printing spreadsheets is easy. Microsoft Excel has lots of options available so you can print exactly what you want.
 Page Setup and Print Chapter 4 Printing spreadsheets is easy. Microsoft Excel has lots of options available so you can print exactly what you want. Print Preview is available so that you can check how
Lab 7 Statistics I LAB 7 QUICK VIEW
 Lab 7 Statistics I This lab will cover how to do statistical calculations in excel using formulas. (Note that your version of excel may have additional formulas to calculate statistics, but these formulas
A B C D E F G H I J K L M 1 Student Test 1 Test 2 Test 3 Test 4 Total AVG. Joe Smith
 5.05 Instructions Part 1: Modifying the Worksheet 1. Click on the F in the shaded area at the top of the spreadsheet. This should cause the entire column to become highlighted. 2. Click on the Home tab
INSERT SUBTOTALS Database Exercise Sort the Data Department Department Data Tab Sort and Filter Group
 INSERT SUBTOTALS Subtotals are used to summarize data in a range of data. This command offers many kinds of summary information, including counts, sums, averages, minimums, and maximums. When this feature
Intermediate Excel Training Course Content
 Intermediate Excel Training Course Content Lesson Page 1 Absolute Cell Addressing 2 Using Absolute References 2 Naming Cells and Ranges 2 Using the Create Method to Name Cells 3 Data Consolidation 3 Consolidating
Microsoft Excel 2010 Step-by-Step Exercises PivotTables and PivotCharts: Exercise 1
 Microsoft Excel 2010 Step-by-Step Exercises PivotTables and PivotCharts: Exercise 1 In this exercise you will learn how to: Create a new PivotTable Add fields to a PivotTable Format and rename PivotTable
Excel 2007 New Features Table of Contents
 Table of Contents Excel 2007 New Interface... 1 Quick Access Toolbar... 1 Minimizing the Ribbon... 1 The Office Button... 2 Format as Table Filters and Sorting... 2 Table Tools... 4 Filtering Data... 4
Rio Hondo Prep Computer Applications Class
 Open up document 10-1 (this is the one you worked on in the previous assignment). It should look like this: We have one column that is blank; the Avg Speed (this leg), column C. The formula for C2 is pretty
Homework 1 Excel Basics
 Homework 1 Excel Basics Excel is a software program that is used to organize information, perform calculations, and create visual displays of the information. When you start up Excel, you will see the
IITS Workshop Creating a Gradebook in Microsoft Office Excel 2007
 IITS Workshop Creating a Gradebook in Microsoft Office Excel 2007 Table of Contents Our Gradebook Example:... 3 Set Up a New Gradebook... 3 Adding Formulas (Averages and Final Grades)... 4 Formatting data...
Microsoft Excel 2013/2016 Pivot Tables
 Microsoft Excel 2013/2016 Pivot Tables Creating PivotTables PivotTables are powerful data analysis tools. They let you summarize data in various ways and instantly change the view you use. A PivotTable
Excel 2007/2010. Don t be afraid of PivotTables. Prepared by: Tina Purtee Information Technology (818)
") Information Technology MS Office 2007/10 Users Guide Excel 2007/2010 Don t be afraid of PivotTables Prepared by: Tina Purtee Information Technology (818) 677-2090 tpurtee@csun.edu [ DON T BE AFRAID OF
Information Technology MS Office 2007/10 Users Guide Excel 2007/2010 Don t be afraid of PivotTables Prepared by: Tina Purtee Information Technology (818) 677-2090 tpurtee@csun.edu [ DON T BE AFRAID OF
Creating an expenses record spreadsheet in Excel
 Creating an expenses record spreadsheet in Excel 1. Open a new workbook in Microsoft Excel. 2. Highlight the first row of cells (each small box on the screen is called a cell) from A to Q. To do this,
Introduction. Understanding charts. Excel 2016
 Excel 2016 Charts Introduction It can be di icult to interpret Excel workbooks that contain a lot of data. Charts allow you to illustrate your workbook data graphically, which makes it easy to visualize
Excel 2007 Fundamentals
 Excel 2007 Fundamentals Introduction The aim of this document is to introduce some basic techniques for using Excel to enter data, perform calculations and produce simple charts based on that information.
Are your spreadsheets filled with unnecessary zero s, cluttering your information and making it hard to identify significant results?
 Declutter your Spreadsheets by Hiding Zero Values Are your spreadsheets filled with unnecessary zero s, cluttering your information and making it hard to identify significant results? Undertaking data
Watch the video below to learn more about freezing panes in Excel. *Video removed from printing pages. To freeze rows:
 Excel 06 Freezing Panes and View Options Introduction Whenever you're working with a lot of data, it can be di icult to compare information in your workbook. Fortunately, Excel includes several tools that
Intermediate Microsoft Excel 2010 Tables and Printing
 John W. Jacobs Technology Center 450 Exton Square Parkway Exton, PA 19341 610.280.2666 ccljtc@ccls.org www.ccls.org Intermediate Microsoft Excel 2010 Workshop Topics: Tables o Create tables, use automatic
Good Byer Stores Australia Ltd Inventory - Whitegoods department
 Managing Data Lists Chapter 1 Excel has some excellent features that make working with lists easy. Lists of records can be sorted, searched and filtered to produce useful information. Good Byer Stores
EXCEL BASICS. Helen Mills META Solutions
 EXCEL BASICS Helen Mills META Solutions OUTLINE Introduction- Highlight Basic Components of Microsoft Excel Entering & Formatting Data, Numbers, & Tables Calculating Totals & Summaries Using Formulas Conditional
Excel Level 1
 Excel 2016 - Level 1 Tell Me Assistant The Tell Me Assistant, which is new to all Office 2016 applications, allows users to search words, or phrases, about what they want to do in Excel. The Tell Me Assistant
Checking whether the protocol was followed: gender and age 51
 Checking whether the protocol was followed: gender and age 51 Session 4: Checking whether the protocol was followed: gender and age In the data cleaning workbook there are two worksheets which form the
Pivot Tables in Excel Contents. Updated 5/19/2016
 Pivot Tables in Excel 2010 Updated 5/19/2016 Contents Setup a Pivot Table in Excel 2010... 2 General Field List Features... 4 Summing and Counting Together... 6 Grouping Date Data... 7 Grouping Non-Date
Introduction to Microsoft Excel
 Create it Introduction to Microsoft Excel It's the beginning of the year (or you just got your new computer) and you want to create an electronic grade book to keep track of student achievement and do
Tricking it Out: Tricks to personalize and customize your graphs.
 Tricking it Out: Tricks to personalize and customize your graphs. Graphing templates may be used online without downloading them onto your own computer. However, if you would like to use the templates
M i c r o s o f t E x c e l A d v a n c e d P a r t 3-4. Microsoft Excel Advanced 3-4
 Microsoft Excel 2010 Advanced 3-4 0 Absolute references There may be times when you do not want a cell reference to change when copying or filling cells. You can use an absolute reference to keep a row
Microsoft Office Excel 2010: Basic. Course Overview. Course Length: 1 Day. Course Overview
 Microsoft Office Excel 2010: Basic Course Length: 1 Day Course Overview This course teaches the basic functions and features of Excel 2010. After an introduction to spreadsheet terminology and Excel's
2013 ADVANCED MANUAL
 2013 ADVANCED MANUAL C B C H O U S E 2 4 C A N N I N G S T R E E T E D I N B U R G H E H 3 8 E G 0 1 3 1 2 7 2 2 7 9 0 W W W. I T R A I N S C O T L A N D. C O. U K I N F O @ I T R A I N S C O T L A N D.
MICROSOFT EXCEL BIS 202. Lesson 1. Prepared By: Amna Alshurooqi Hajar Alshurooqi
 MICROSOFT EXCEL Prepared By: Amna Alshurooqi Hajar Alshurooqi Lesson 1 BIS 202 1. INTRODUCTION Microsoft Excel is a spreadsheet application used to perform financial calculations, statistical analysis,
Basics: How to Calculate Standard Deviation in Excel
 Basics: How to Calculate Standard Deviation in Excel In this guide, we are going to look at the basics of calculating the standard deviation of a data set. The calculations will be done step by step, without
Excel Tips for Compensation Practitioners Weeks Pivot Tables
 Excel Tips for Compensation Practitioners Weeks 23-28 Pivot Tables Week 23 Creating a Pivot Table Pivot tables are one of the most amazing and powerful tools in Excel, but many users do not know how to
UNIT ONE: The Worksheet. Workbook Window Excel Worksheet Fill handle Automatic fill Column widths Opening a file Saving a file
 UNIT ONE: The Worksheet T o p i c s : Workbook Window Excel Worksheet Fill handle Automatic fill Column widths Opening a file Saving a file I. Start Excel: 1. Click the Start button in the lower-left corner
Use of in-built functions and writing expressions
 LECTURE SCHEDULE 9 Use of in-built functions and writing expressions In-built Functions A function is an in-built program, which is used to do a particular task. Functions take the input the input and
WEEK NO. 12 MICROSOFT EXCEL 2007
 WEEK NO. 12 MICROSOFT EXCEL 2007 LESSONS OVERVIEW: GOODBYE CALCULATORS, HELLO SPREADSHEET! 1. The Excel Environment 2. Starting A Workbook 3. Modifying Columns, Rows, & Cells 4. Working with Worksheets
THE EXCEL ENVIRONMENT... 1 EDITING...
 Excel Essentials TABLE OF CONTENTS THE EXCEL ENVIRONMENT... 1 EDITING... 1 INSERTING A COLUMN... 1 DELETING A COLUMN... 1 INSERTING A ROW... DELETING A ROW... MOUSE POINTER SHAPES... USING AUTO-FILL...
CHAPTER TWO: SPREADS HEETS WITH EXCEL 1
 CHAPTER TWO: SPREADS HEETS WITH EXCEL 1 CHAPTER 2 SPREADSHEETS WITH EXCEL TOPIC Create Pivot Tables Create and Modify Charts Sort and Filter CHAPTER TWO: SPREADS HEETS WITH EXCEL 2 CREATE AND MODIFY CHARTS
Microsoft Excel 2007 Beginning The information below is devoted to Microsoft Excel and the basics of the program.
 Microsoft Excel 2007 Beginning The information below is devoted to Microsoft Excel and the basics of the program. Starting Excel Option 1: Click the Start button on the taskbar, then Programs>Microsoft
How to Create and Use a Pivot Table in Excel
 How to Create and Use a Pivot Table in Excel Nikki Casasanto What you need Microsoft Office: Excel 2013 Data Why use a Pivot Table? Microsoft Excel pivot tables offer a way to quickly summarize data. It
CMPF124 Microsoft Excel Tutorial
 Lab 5: Microsoft Excel Tutorial Excel Worksheet Microsoft Excel works as account ledger. An Excel Workbook (1) could have multiple Worksheets (2). A cell in Excel is referred by its Column and Row naming
Graded Project. Computer Applications
 Computer Applications PENN FOSTER, INC. 2016 INTRODUCTION CONTENTS INTRODUCTION 2 INSTRUCTIONS 2 SCORING GUIDELINES 10 SUBMITTING YOUR PROJECT 13 PAGE 1 COMPUTER APPLICATIONS INTRODUCTION This project
Microsoft Office Excel 2007: Basic. Course Overview. Course Length: 1 Day. Course Overview
 Microsoft Office Excel 2007: Basic Course Length: 1 Day Course Overview This course teaches the basic functions and features of Excel 2007. After an introduction to spreadsheet terminology and Excel's
Microsoft Excel 2016
 เพ มภาพตามเน อหาของแต ละบท Microsoft Excel 2016 Benjamas Panyangam and Dr. Dussadee Praserttitipong Adapted in English by Prakarn Unachak 204100 IT AND MODERN LIFE 1. Excel Basics 2. Calculation and Formula
Graded Project. Microsoft Excel
 Graded Project Microsoft Excel INTRODUCTION 1 PROJECT SCENARIO 1 CREATING THE WORKSHEET 2 GRAPHING YOUR RESULTS 4 INSPECTING YOUR COMPLETED FILE 6 PREPARING YOUR FILE FOR SUBMISSION 6 Contents iii Microsoft
1. Managing Information in Table
 1. Managing Information in Table Spreadsheets are great for making lists (such as phone lists, client lists). The researchers discovered that not only was list management the number one spreadsheet activity,
Excel: Tables, Pivot Tables & More
 Excel: Tables, Pivot Tables & More February 7, 2019 Sheldon Dueck, MCT dueck21@gmail.com http://bit.ly/pivottables_fmi (Booklet) 1 Contents Tables... 3 Different ways of creating pivot tables... 4 Compact,
Making Tables and Graphs with Excel. The Basics
 Making Tables and Graphs with Excel The Basics Where do my IV and DV go? Just like you would create a data table on paper, your IV goes in the leftmost column and your DV goes to the right of the IV Enter
Filter and PivotTables in Excel
 Filter and PivotTables in Excel FILTERING With filters in Excel you can quickly collapse your spreadsheet to find records meeting specific criteria. A lot of reporters use filter to cut their data down
THE AMERICAN LAW INSTITUTE Continuing Legal Education
 67 THE AMERICAN LAW INSTITUTE Continuing Legal Education Using Everyday Tech Tools To Maximize Your Law Practice Plus Ethics April 26, 2018 Philadelphia, Pennsylvania Utilizing Microsoft Excel for a More
Skittles Excel Project
 Skittles Excel Project Entering Your Data and Creating Data Displays 1. Open Microsoft Excel 2. Create a table for your Skittles colors: a. In cell A1 type in a title for your chart b. In cell A2 type
Rev. C 11/09/2010 Downers Grove Public Library Page 1 of 41
 Table of Contents Objectives... 3 Introduction... 3 Excel Ribbon Components... 3 Office Button... 4 Quick Access Toolbar... 5 Excel Worksheet Components... 8 Navigating Through a Worksheet... 8 Making
Reference Services Division Presents. Excel Introductory Course
 Reference Services Division Presents Excel 2007 Introductory Course OBJECTIVES: Navigate Comfortably in the Excel Environment Create a basic spreadsheet Learn how to format the cells and text Apply a simple
Excel Advanced
 Excel 2016 - Advanced LINDA MUCHOW Alexandria Technical & Community College 320-762-4539 lindac@alextech.edu Table of Contents Macros... 2 Adding the Developer Tab in Excel 2016... 2 Excel Macro Recorder...
Formulas, LookUp Tables and PivotTables Prepared for Aero Controlex
 Basic Topics: Formulas, LookUp Tables and PivotTables Prepared for Aero Controlex Review ribbon terminology such as tabs, groups and commands Navigate a worksheet, workbook, and multiple workbooks Prepare
Ms excel. The Microsoft Office Button. The Quick Access Toolbar
 Ms excel MS Excel is electronic spreadsheet software. In This software we can do any type of Calculation & inserting any table, data and making chart and graphs etc. the File of excel is called workbook.
Advanced Microsoft Excel 2010
 Agenda: 1. Introduction 2. Complex formulas & cell references 3. Functions 4. Charts 5. Pivot Tables 6. Practice and Questions In order to keep computer literacy programs running in the future, we must
Basic Excel. Helen Mills OME-RESA
 Basic Excel Helen Mills OME-RESA Agenda Introduction- Highlight Basic Components of Microsoft Excel Entering & Formatting Data, Numbers, & Tables Calculating Totals & Summaries Using Formulas Conditional
Excel 2010 Formulas Not Work In 2003 Copying Down Correctly
 Excel 2010 Formulas Not Work In 2003 Copying Down Correctly Invest a few minutes and learn how to correctly use relative and absolute cell How relative and absolute cell references work in conditional
COMPUTER TECHNOLOGY SPREADSHEETS BASIC TERMINOLOGY. A workbook is the file Excel creates to store your data.
 SPREADSHEETS BASIC TERMINOLOGY A Spreadsheet is a grid of rows and columns containing numbers, text, and formulas. A workbook is the file Excel creates to store your data. A worksheet is an individual
Module 4 : Spreadsheets
 Module 4 : Spreadsheets What is a spreadsheet program? A spreadsheet program allows you to store, organise and analyse information. Applications of spreadsheets focus on generating numeric information
Advanced Excel Charts : Tables : Pivots
 Advanced Excel Charts : Tables : Pivots Protecting Your Tables/Cells Protecting your cells/tables is a good idea if multiple people have access to your computer or if you want others to be able to look
Using Excel for a Gradebook: Advanced Gradebook Formulas
 Using Excel for a Gradebook: Advanced Gradebook Formulas Objective 1: Review basic formula concepts. Review Basic Formula Concepts Entering a formula by hand: Always start with an equal sign, and click
Using pivot tables in Excel (live exercise with data)
") Using pivot tables in Excel (live exercise with data) In chapter four, we used B.C. s political donations data to learn how to build pivot tables, which group elements in your data and summarize the information
Using pivot tables in Excel (live exercise with data) In chapter four, we used B.C. s political donations data to learn how to build pivot tables, which group elements in your data and summarize the information
The Menu and Toolbar in Excel (see below) look much like the Word tools and most of the tools behave as you would expect.
 look much like the Word tools and most of the tools behave as you would expect.") Launch the Microsoft Excel Program Click on the program icon in Launcher or the Microsoft Office Shortcut Bar. A worksheet is a grid, made up of columns, which are lettered and rows, and are numbered.
Launch the Microsoft Excel Program Click on the program icon in Launcher or the Microsoft Office Shortcut Bar. A worksheet is a grid, made up of columns, which are lettered and rows, and are numbered.
Using Microsoft Excel
 Using Microsoft Excel in Excel Although calculations are one of the main uses for spreadsheets, Excel can do most of the hard work for you by using a formula. When you enter a formula in to a spreadsheet
Using Pivot Tables in Excel (Live Exercise with Data)
") Chapter 4 Using Pivot Tables in Excel (Live Exercise with Data) In chapter four, we used B.C. s political donations data to learn how to build pivot tables, which group elements in your data and summarize
Chapter 4 Using Pivot Tables in Excel (Live Exercise with Data) In chapter four, we used B.C. s political donations data to learn how to build pivot tables, which group elements in your data and summarize
Microsoft Excel Using Excel in the Science Classroom
 Microsoft Excel Using Excel in the Science Classroom OBJECTIVE Students will take data and use an Excel spreadsheet to manipulate the information. This will include creating graphs, manipulating data,
Microsoft Excel 2007
 Kennesaw State University Information Technology Services Microsoft Excel 2007 Special Topics PivotTable IF Function V-lookup Function Copyright 2010 KSU Dept. of Information Technology Services This document
Using Microsoft Excel
 Using Microsoft Excel Files in Microsoft Excel are referred to as Workbooks. This is because they can contain more than one sheet. The number of sheets a workbook can contain is only limited by your computer
Creating a data file and entering data
 4 Creating a data file and entering data There are a number of stages in the process of setting up a data file and analysing the data. The flow chart shown on the next page outlines the main steps that
Prepared by: Prof. Dr Bahaman Abu Samah Department of Professional Development and Continuing Education Faculty of Educational Studies Universiti
 Prepared by: Prof. Dr Bahaman Abu Samah Department of Professional Development and Continuing Education Faculty of Educational Studies Universiti Putra Malaysia Serdang MS Access is an application within
How to Create Excel Dashboard used in Solutions Conference By Matt Mason
 How to Create Excel Dashboard used in Solutions Conference 2017 By Matt Mason The following is a step by step procedure to create the Dashboard presented by Matt Mason in the Excel Tips and Tricks session
Introduction to Excel 2013 Part 2
 Introduction to Excel 2013 Part 2 Open a file Select File from the Menu bar, select Open from the drop down menu, navigate to the place where the file was stored, double-left click on the file name. Modify