Table of Contents (Hyperlinked)
|
|
|
- Cordelia Berry
- 6 years ago
- Views:
Transcription
 Getting Started Login Screen Navigating the Sections of QuickScore Icons My Bookmarks Section Briefing Pane Commonly Used Functions The Briefing Books")
1 Version 2.5 User Guide Table of Contents (Hyperlinked) Getting Started Login Screen Navigating the Sections of QuickScore Icons My Bookmarks Section Briefing Pane Commonly Used Functions The Briefing Books Section The Balanced Scorecards Section Building the Organizations Building Balanced Scorecards Navigation Subsection Executive View Subsection Overview Subsection Performance Measure Report Subsection Notes Subsection Analysis Subsection Tasks Subsection Related Items Subsection The Strategy Maps Section The Strategic Initiatives Section Gantt Chart Subsection Overview Subsection Tasks Subsection Related Items Subsection The Documents Section Overview Subsection Related Items Subsection The Reports Section Out of the Box Reports Report Writer Chart Writer The Dashboard Section Creating Your Dashboard Editing Your Dashboard My Alerts Section

2 Getting Started Login Screen: This is the first screen you will see and how you access the application: Type your username and password. If you have more than one database available, choose the correct database from the drop-down menu and then click the Submit button. 2


3 Navigating the Sections of QuickScore: QuickScore is broken down into different sections and subsections for easy navigation. Once you log in, check the top-left part of your screen and look for the following location: This indicates that you are currently looking at the My Bookmarks section. If you would like to change the section, either click on the My Bookmarks text or the small arrow icon to the right. This will pull up a drop-down menu, allowing you to choose another section of the application: Choose the appropriate section and the newly selected section will now display at the top. Some sections also have available subsections. In this case, we are in the Balanced Scorecards section and viewing the Navigation subsection. You can choose a different subsection in the same manner. There is a lot of data that will be period specific in QuickScore. To change the calendar period, simply click on the date and the calendar selector will appear: The following page contains a list of the icons that you will find throughout QuickScore and what they represent: 3
4 Icons: Administration Section My Alerts Section Archive Balanced Scorecard Balanced Scorecards Section My Bookmarks Section Briefing Book Section Calendar Empty Notes Populated Notes Copy Cut Delete Documents Section Edit Erase Error Excel External Link Go up one level Group Help History Image Last Period Next Period Linked Object Locked Milestone New Task Objective Order Down Order Up Organization Unpopulated Organization Paste PDF Performance Measure Perspective PowerPoint Print Promote Red Performance Measure Indicator Reports Section Report Send To Sort Down Sort Up Strategic Initiative Strategy Map Strategy Map Section Task Un-archive User Warning Weight Word 4

5 My Bookmarks Section This is the default section in which the application opens. You can also return to this section at any time by clicking on the section. Any time you wish to log out of the application, you can click on in the upper right-hand corner of the screen. You will be asked to confirm if you wish to log off. Administrator Message: Within this section you can add messages in the right-hand pane under Administrator Message by clicking on if you have the appropriate privileges. When you do so, you will see the text editor activate: Just enter the appropriate information and formatting, and then click Save. 5


6 Briefing Pane: This is where your bookmarks are saved. They are easily accessible as soon as you log in to the application. Simply click on the one that you would like to see, and it will be displayed in the briefing pane to the right. You can also right-click to create new bookmarks or folders. Creating folders and subfolders is a great way to keep your bookmarks organized. If you would like to reorder the items, simply left-click and hold the object you would like to move and then drag it to another location in the bookmarks tree. Let go and you have successfully moved the object. 6


7 Commonly Used Functions: These shortcuts are provided on your home bookmark link to allow you easy access to the most commonly used functions inside the application: Just click the expand icon to the left of the function to view its contents: You can check on the Tasks you have been assigned from My Tasks. You may also monitor metrics you own by clicking the expand icon associated with Metrics I Own. Additionally, you may update or import specific metrics you are associated with by clicking on Metrics I Update. You may also change your password by clicking My Settings. Finally, the image in the center of the briefing pane may be changed to any picture you want, as described in the Admin User Guide. 7


8 The Briefing Books Section This is the section where you can store all of your briefing books. Briefing books are a collection of slides that you can pull from different parts of the application to create one or more sets of screens for the purposes of demonstrating information found in QuickScore. The first thing you will have to do is create a briefing book. When choosing an organization that doesn t yet have a briefing book, this is the first screen you will see when choosing the section: 8

9 Click on the button to create a new briefing book. Give it a name: This will be the result: 9
10 By selecting the Send Page To button and choosing briefing book, you can add as many slides to your briefing book as you like. This is what the wizard looks like when you select the Send Page To button and select Briefing Book. Completing the New Briefing Book Slide wizard: Type a Slide Name. Select a Calendar and the Slide Period. Selecting Relative allows you to select the current period or a past or future period. The Normal slide period allows you to select an actual calendar period. For example, you can select March Select an organization where an existing briefing book is located or where you wish to create a new briefing book to send the slide to. Select an Existing briefing book name or Select New and type a name for a new briefing book. 10

11 Once you have created all your slides, you can view your briefing book in full screen by selecting the Send Page To button and selecting Full Screen Display. Then, you will see the slide show functionality available at the bottom of the new screen. You can click left or right to view the next slide or jump to any available slide: 11

12 This is the result: In this full screen view, look to the bottom of the screen for the controls to move between slides. The left and right arrows navigate you to the previous and next slides. The button closes the Full Screen Display mode. The drop-down arrow next to the slide name and slide number allows you to select a specific slide to view. 12
13 The Balanced Scorecards Section This is the section in which most of the data in the application can be found. You can return to this section at any time by clicking on the section. 13


14 Building the Organizations: If you have not defined any organizations when you navigate to the Balanced Scorecards section, you will see: You can then click on the Top-Level Organization button: When you first click on the button, you will see a dialog box prompting you to enter the name of the highest-level unit in your organization: Enter the name of the highest-level unit of your organization, and you will see the beginning of your organization: 14


15 Once you have created the highest-level unit, you can right-click on the name and see the following choices: By clicking on the New Organization link, you can add organization units directly under the unit you have clicked. A dialog box will appear, prompting you to give a name to your new organization. You can add as many levels as you need to represent your organization structure: 15

16 Once you have created your organization hierarchy, you now have more options when you click on an organization unit: New Organization: adds an organization directly under the current choice. Promote To Top Level: moves the organization to the top-level organization. Cut: enables you to cut an organization to be moved somewhere else. Paste: lets you paste a cut organization in another spot. Edit: allows you to edit the name of the organization. Delete: allows you to delete the organization and the balanced scorecard created for that organization. NOTE: If you have sub organizations, those organizations will be deleted as well. In the figure below, if the Accounting organization is selected to be deleted, the AP and AR sub organizations will be deleted as well. NOTE: In order to change the organizational structure, you can use the drag-and-drop feature. Simply click, drag, and drop the organization to where you would like it to go. 16

17 As soon as you click on the Balanced Scorecards section, select an organization you would like to see. Selecting an organization on the left-hand side of the screen will select an organization for you to view. The right-side of the screen allows you to select the balanced scorecard name or expand all/collapse all. By selecting the organization name button that appears above the balanced scorecard name on the right-hand side of the screen, the software will display the balanced scorecard and a subsection view, for example the Overview screen. 17
18 Building Balanced Scorecards: The Balanced Scorecards section will allow you to build a balanced scorecard structure for each organization unit. Click on the Balanced Scorecards section: Choose the appropriate organization. You can now create your new balanced scorecard. Click on the New Balanced Scorecard button: A dialog box will appear. A balanced scorecard name is required. A description can be entered if applicable. Under the Advanced section you may add Tags. Tags entered may be selected when creating reports as well as searching for information within the software. 18
19 Select Save to continue or select Save and Add Owners to add Owners to the balanced scorecard root. To add Owners to the balanced scorecard root (the top-level object of the balanced scorecard): Select a user from the drop-down menu. Select the Add Owner button. Check the checkbox Notify Users/Groups of Assignment/Unassignment. This will send an to the user or group notifying them that they have been assigned as an Owner of the balanced scorecard root (object). This is optional. Select the Finished button or select additional users to assign as Owners. 19


20 Once you have created the root (top-level) of the balanced scorecard, you will see the balanced scorecard name: Right-click on the balanced scorecard name and you will display a menu with several options: 20
21 New Perspective: creates a new perspective object under a balanced scorecard object that you have selected. Name and Object Type are required and Description is optional. Under the Advanced menu you can specify when your perspective will start and end within your balanced scorecard. This information allows the balanced scorecard structure to change over time. For example, you may wish to display a perspective from January 1, 2011 until December 31, When January 1, 2012 is selected, that perspective object will not be visible. The Start Date would be January 1, 2011 and the Archive Date would be December 31, NOTE: Archiving balanced scorecard objects will not change the weighting of the object or objects above them. The software utilizes a global weighting system in which a balanced scorecard object s configured weight exists for all periods of time even when the item is archived. Adding Tags will assist in searching for information as well as give users the ability to use the Tags in the Report section of the software. You also have the option of assigning Owners if they are applicable: 21

22 New Objective: creates an objective under a balanced scorecard object that you have selected. Name and Object Type are required and Description is optional. Under the Advanced menu you can specify when your objective will start and end within your balanced scorecard. This information allows the balanced scorecard structure to change over time. For example, you may wish to display an objective from January 1, 2011 until December 31, When January 1, 2012 is selected, this objective will not be visible. The Start Date would be January 1, 2011 and the Archive Date would be December 31, NOTE: Archiving balanced scorecard objects will not change the weighting of the object or objects above them. The software utilizes a global weighting system in which a balanced scorecard object s configured weight exists for all periods of time even when the item is archived. Adding Tags will assist in searching for information as well as give users the ability to use Tags in the Report section of the software. You also have the option of assigning Owners if they are applicable: 22

23 New Theme: creates a new theme under a balanced scorecard object that you have selected. Name and Object Type are required and Description is optional. Under the Advanced menu you can specify when your theme will start and end within your balanced scorecard. This information allows the balanced scorecard structure to change over time. For example, you may wish to display a theme from January 1, 2011 until December 31, When January 1, 2012 is selected the theme will not be visible. The Start Date would be January 1, 2011 and the Archive Date would be December 31, NOTE: Archiving balanced scorecard objects will not change the weighting of the object or objects above them. The software utilizes a global weighting system in which a balanced scorecard object s configured weight exists for all periods of time even when the item is archived. Adding Tags will assist in searching for information as well give users the ability to use Tags in the Report section of the software. You also have the option of assigning Owners if they are applicable: 23
24 New Performance Measure: When you start adding performance measures, the first dialog box you will see is: Name: Enter the name of your performance measure. Calendar: Choose the update frequency for the performance measure based on the calendars you have defined. NOTE: Calendars are created in the Administration section of the software. Description: Optional. Type a description for the performance measure. Start and Archive Date: Under the Advanced menu you can specify when your performance measure will start and end within your balanced scorecard. This information allows the balanced scorecard structure to change over time. For example, you may wish to display a performance measure from January 1, 2011 until December 31, When January 1, 2012 is selected the performance measure will not be visible. The Start Date would be January 1, 2011 and the Archive Date would be December 31, NOTE: Archiving balanced scorecard objects will not change the weighting of the object or objects above them. The software utilizes a global weighting system where a balanced scorecard object s configured weight exists for all periods of time even when the item is archived. Tags: Adding Tags will assist in searching for information as well give users the ability to use Tags in the Report section of the software. 24

25 Select the Next button to continue. The second dialog box you will see is How is your Performance Measure Scored. In QuickScore, we offer 11 different scoring options. Select a Scoring Type for the performance measure. Examples and explanations of each Scoring Type are listed on the following pages. 25

26 Yes/No: something is done or it isn't. This type of scoring is ideal for performance measures that either are or aren t done. For example, did you or didn t you finish your project on time. It can also work for performance measures where the desired outcome is negative: Did any employees quit this month? 2 Color: between worst and goal is red and between goal and best is green. This type of scoring is ideal for situations where you want to give a more continuous range of scores. For example, when tracking revenue, gradations are important because it is crucial to see just how close you are getting to your revenue goal. 26

27 2 Color Goal Only: red if you are under goal, green if you are above. This type of scoring is not used as often as the 2 Color option above, likely because it does not offer the ability to see a continuous range of scores. 3 Color: stoplight coloring where you specify where the absolute worst and best value is. This scoring option allows you to specify where the best and worst value is, like in the 2 Color option, but it allows for even more gradations because of the yellow band. Note that the Red Flag value is the point at which yellow changes to red. 27
28 Goal/Red Flag: stoplight where you have red below a least acceptable value, yellow between that value and goal with green at goal and above. This is the scoring type most often recommended to QuickScore Users. This type of scoring only requires that you specify Goal and Red Flag. The system creates the best and the worst automatically in such a way that all three fields are the same size. 4 Color (Red-Orange-Yellow-Green): like stoplight except you include a wider range from worst to best. This scoring option is similar to the 3 Color type, but with the addition of the orange field to show an additional warning that orange will soon turn to red. 28
29 4 Color (Red-Yellow-Green-Blue): like stoplight except blue is where things are TOO good and no more effort should be expended. This scoring option is similar to the previous 4 Color type, but instead of orange nearing red, you ve denoted the point at which things are, perhaps, too good and you might want to focus less effort there. Stabilize (Red-Green-Red): for performance measures like inventory where too much is bad and too little is also bad. This type of scoring is useful for when you want to have exactly a certain value. For example, a warehouse might need to have exactly a certain amount of items on its shelves. Too much and too little would both cause problems. In this type of scenario, the best score is dead center while one end of the speedometer is Low Worst and the other end is High Worst. 29

30 Stabilize (Red-Yellow-Green-Yellow-Red): for performance measures where there is some flexibility about what is too much and too little. This is similar to the previous type of scoring, but allows for more gradations. Unscored: This type of scoring is useful for when you have data you want to report on, but don t have a target. For example, perhaps you don t want to set targets for revenue or expenses (both unscored), but you do score your profits. Then, using the Unscored option for revenue and expenses won t affect the roll up of the objects higher in the tree. 30
31 The third dialog box will ask you to make a few more decisions. *Required Fields Data Type: How do you want your information displayed? Standard means a real number. Percentage and Currency are self-explanatory. Aggregation Type: Select from sum, average, or last value. This selection determines how values are aggregated for calendar periods that span lengths of time that are larger than this performance measure s native calendar period. How do you want your data to be displayed over a period of time? For example, if you enter your data monthly and you select an Annual calendar to display your data, selecting Sum will add your data across the time period, Average will average the data, and Last Value will display the last value entered for the measure. Import Mapping Key: Enter a user defined "key" for use with CSV imports. This is optional. Decimal Precision: Enter the number of decimal places to display for this individual performance measure. If you leave this blank, the application will apply whatever the default has been set for. Update Type: Select Manual or Calculated. If you choose Manual for Red Flag and Goal, you may also add a Default Value. Calculated allows you to create performance measures whose values are calculated based on performance measures elsewhere in the hierarchy. 31

32 If you select Calculated, you will see the following dialog box: This screenshot shows sample equations for Actual Value, Red Flag, and Goal. NOTE: If you select calculated for actual value and thresholds, you must enter a calculation. If you do not need to create a calculation, leave the option set to manual. To create the Actual Value equation shown above, first, select the organization you want on the left-side of the screen. Then, select a performance measure from the rightside. Click Add. Then click, choose your next performance measure and click Add. You can select as many performance measures as you want in the same manner. Make sure that you have selected Actual Value and Current Period in the drop-down menus at the bottom of the dialog box. Click Finished when you are done. To create the Red Flag equation shown above, first convert your value into a decimal. In this case, we changed 90% into.9, and then click. Then select (i.e., the one you are currently editing) from the top of the right-hand column. Instead of Current Period in the drop-down menu at the bottom of the dialog box, select 12 Periods Earlier. Your equation will be.9*m(-12p). To create the Goal equation shown above, again convert your value into a decimal. In this case, we changed 125% to 1.25, and then click. Then select (i.e., the one you are currently editing) from the top of the righthand column. Instead of Current Period in the drop-down menu at the bottom of the dialog box, select 12 Periods Earlier. Your equation will be 1.25*M(-12p). 32
33 Aside from the default functions to choose from while creating an equation in the Calculated Performance Measure dialog box, you may also use functions from the following charts in your equations: Trigonometric Functions Log and Exponential Functions Statistical Functions 33
34 Rounding Functions Miscellaneous Functions 34

35 NOTE: When calculating Sum and Average of a series of performance measures, make sure to use the appropriate function. By using the function itself, you will ensure that any performance measure marked N/A or with a null value is not calculated in the equation even if it is included in the equation itself. Your screen should look something like the following figure. The calculations used are listed in the Balanced Scorecards Overview section. The calculations created may be located by selecting the Data Used in Calculations heading. 35

36 For period-specific Actual and Threshold Values, select the button in the Actual and Threshold Values section and you will see the following dialog box. To make the performance measure N/A, select No in the drop-down menu for Include in Calculations. NOTE: This option may not be available if the Ignore gray scorecard objects for color roll-up option is selected in Application Administration in the Administration section. If this option is selected, all performance measures that do not have a value will not be part of the color rollup of the balanced scorecard. 36
37 The following chart denotes the operational symbols to use within QuickScore: Click Finished or you can go ahead and Add Owners and Updaters as well. To add Owners and Updaters, select the Add Owners and Updaters button. Select a user under Owners and select the Add Owner button or select a user under Updaters and select the Add Updater button. Check the option Allow update of scoring threshold values if the Updater should have permission to update period-specific threshold values. Click the X to the right of the name to delete a user as an Owner or Updater. 37
.")
38 New Linked Object: This functionality allows you to create a virtual link in your balanced scorecard structure that references another object in the system. All of the characteristics of the linked object will be linked to the object you ve selected to link to (i.e., object score, value and thresholds, color). Creating Linked Objects: Right-click on the balanced scorecard name, perspective, or objective and select New Linked Object. Select Choose for the Source Object. Select an organization on the left and the object to link on the right. You can use the same name and description from the source object or uncheck the checkbox to change the name and add a new description. You can also select a Start and Archive date and add tags under the Advanced section. 38
.")

39 Copying Balanced Scorecards or Balanced Scorecard Objects Copying balanced scorecards or balanced scorecard objects allows you to duplicate your structure without having to manually type the information again. (Using Connect is another option for creating structure without manually creating it within the software). Copying balanced scorecards or balanced scorecard objects does NOT copy the actual data or thresholds of the original object. The structure is copied but the data is not. Copying the Entire Balanced Scorecard To copy an entire balanced scorecard, first select the organization where the balanced scorecard resides. Right-click on the balanced scorecard name (the top-level of the balanced scorecard). Select Copy from the menu. Select an organization that does not have a balanced scorecard assigned to it. Select the Paste Balanced Scorecard button on the right-hand side of the window. The balanced scorecard structure is now copied to the new organization. If the new organization already has a balanced scorecard assigned and you wish to copy a balanced scorecard to it, first delete the existing balanced scorecard and then follow the above steps to copy and paste the new balanced scorecard. (Reminder: Only one balanced scorecard per organization may be created). 39
40 Copying a Balanced Scorecard Object To copy a balanced scorecard object, first select the organization where the balanced scorecard object resides. Right-click on the balanced scorecard object and select Copy from the menu. Select an organization where you wish to copy the object to. Right-click on a balanced scorecard object in the balanced scorecard where the copied object is to reside and select Paste from the menu. NOTE: If you select a perspective that has objectives and performance measures under it, those objects will be copied to the new location as well. The same is true for objectives that have performance measures under them and performance measures that have sub measures. 40

41 Relocating Balanced Scorecards and Balanced Scorecard Objects If you choose to remove a balanced scorecard or balanced scorecard objects from one organization and wish to relocate them to another, you would follow the same steps as you would to Copy but instead you select Cut from the menu instead of Copy. Deleting Balanced Scorecards and Balanced Scorecard Objects Right-click on the balanced scorecard name or object and select Delete from the menu. Changing the Balanced Scorecard Object Weight You may wish to change the weighting of a balanced scorecard object. Weighting puts more or less importance on a balanced scorecard object. Weighting is global within the software and changes made will affect all time periods. Right-click on the balanced scorecard object in the balanced scorecard tree that you wish to change the weight. Select Edit Weight. The Edit Weight dialog box appears: All the balanced scorecard objects underneath the object of the balanced scorecard tree that has been selected will be displayed. For example, if you selected a measure and there are three measures under an objective, all three measures will be displayed, allowing you to adjust the weights of all three measures. Select Submit when you are finished editing the weights. NOTE: Archiving balanced scorecard objects will not change the weighting of the object or objects above them. The software utilizes a global weighting system in which a balanced scorecard object s configured weight exists for all periods of time even when the item is archived. For example, if you select a measure to be archived, and you view the balanced scorecard for a period that the archived object is not being displayed, the weighting of the archived object still affects the other objects above it. The other object weights do not adjust their weights if an object is archived. 41
, you will notice that the information on the right-hand pane (content pane) will change to reflect your changes.")

42 Navigation Subsection: This Navigation subsection is an auto-generated, color-enhanced display of the parts of your balanced scorecard. As you click and expand your balanced scorecard in the left-hand pane (navigation pane), you will notice that the information on the right-hand pane (content pane) will change to reflect your changes. This information is all dependent on the calendar period that you have chosen to view it in. To see what calendar period you are currently viewing, look for the date at the top left-center of your screen: To change the date period, simply click on the current date and the calendar options will display: Choose the calendar and period you would like to see and click Go. The date will change on the top left-center. Likewise, the data you will now be seeing will reflect the new calendar and period. 42


43 To identify the colors in the software and what they mean: Exceeds Goals No Data Met Goals Warning Poor Needs Attention 43


44 Executive View Subsection: The Executive View is another auto-generated display of the information for your balanced scorecard. You can view all balanced scorecard items including performance measures and sub measures within this view. To add this as a bookmark to the My Bookmarks section, click on the Send Page To button near the top of the content pane. Then choose My Bookmarks from the drop-down list: 44


45 Give your new bookmark a name and then click OK. You have now added the new bookmark to your My Bookmark section. There are a number of icons displayed on this subsection, and clicking on the link in the top-right of the content frame will display their meanings. In addition to using the navigation pane, you can also expand and contract the +/- icons in the content frame to see more or less information. Clicking on any of the icons on the right will display expanded information about that balanced scorecard object. 45


46 Selecting a trend arrow displays the Scores Over Time or Performance Measure Value Over Time analysis reports. Selecting the Performance Measure Present icon displays performance measures associated with the balanced scorecard object selected. The current period s value, update frequency, and period thresholds are displayed. Selecting the notes bubble reply, edit, or delete notes. displays the notes dialog box in which you can create, 46


47 Selecting the Owners icon object. displays the Owners assigned to the balanced scorecard Selecting the Associated with one or more external links icon Web address that is related to the balanced scorecard object. opens an external 47


48 Overview Subsection: The Overview subsection is where the most detailed information for your balanced scorecard will be displayed. You can use the navigation pane on the left to drill-down to specific balanced scorecard objects. Once you have drilled-down to the performance measure level, you will find even more options and information. 48
49 Updating Performance Measures in the Balanced Scorecards Overview Subsection Updating Default Values If you have the permission to do so, you can update performance measures from this screen by clicking on the button or right-clicking on the performance measure in the balanced scorecard tree and selecting Edit. Changes to the performance measure default threshold values pre-populate the future/past periods. Editing the performance measure by selecting Edit Performance Measure allows you to make global performance measure changes. Updating Period Specific Performance Measures The button is only for entering period-specific data. Any actual and threshold values entered there are only applicable for that period. Updating performance measure data only updates the data for the currently selected period. Make sure you have the correct calendar period selected from the upper left-center of the screen. Modify Owners and Updaters in the Balanced Scorecards Overview Section You can assign Owners (i.e., User who is accountable for the performance measure) and Updaters (i.e., User who is responsible for updating the performance measure). You can also assign groups to balanced scorecard objects and send notification s when a User is assigned as an Owner/Updater. Select the Modify Owners or Modify Updaters button in the Performance Measure Info section. Owners: Select a user or users from the drop-down menu. Select the Notify Users of Assignment/Unassignment checkbox (optional). Select Add Owner. Updaters: Select a user or users from the drop-down menu. Select the Allow update of scoring threshold values checkbox (optional). This allows the user to update periodspecific threshold values when updating actual performance measure values. Select the Notify Users of Assignment/Unassignment checkbox (optional). Select Add Updater. 49
50 Creating/Editing and Replying to Notes To create notes, you can click on button and it will bring up the text editor for you to use. Type a note, format using the tools on the note toolbar, select the current time period or All Periods for the note to apply to, and select the Save button to save. When notes have been created, you can edit the note, delete the note, or reply to the note. All these options are located under the Notes section of the Balanced Scorecards Overview subsection. 50


51 To print or export valuable information, click on the Send Page To button, and then choose Printer from the drop-down list. You also have the option of exporting the page to , Microsoft Word, Excel, or PowerPoint, creating a PDF file or sending to the Briefing Book or My Bookmarks section. To export the information out of QuickScore into an external application, click on the button near the top of the page. You will then choose where to export to from the drop-down menu. Choose the application you would like to export to and then either choose Open or Save in the next dialog box: 51

52 You will also notice that all of the sections of the Overview subsection are collapsible for your usability. You can click on the name of the section or the small triangle next to it to open or close those sections of the display pane: The Historical Performance part of the Overview subsection also has its own special set of features. You can change the amount of time displayed in the chart. Use the slider to set the amount of time displayed: 52


53 You can also modify the data displayed on the chart itself. Click on the button to bring up the chart builder. You may also select the button to reset your changes. Here you can add series, change the axis, as well as a number of other configurations. All changes are made real-time, and you can see the new chart as you work. Click the button to save your changes or click the link at the top of the page to go back to the Overview subsection. 53

54 Performance Measure Report Subsection: The Performance Measure Report allows you to view information, in a balanced scorecard view, associated with any part of the balanced scorecard. Click and you can choose the amount of information to view by opening Display Options. You can increase or decrease the number of calendar periods displayed by using the drop-down option and select the data you would like to view in the report by selecting the various checkbox options. Assigned Calendar: Calendar that was selected when creating the performance measure (How often are the measures to be updated). Owner(s): Displays the Owners of the performance measure. Variance To Goal: The distance away from the Goal. Show Parents: Displays all of the balanced scorecard objects for the performance measure such as balanced scorecard name, perspectives, objectives, etc. Show Sub-Metrics: Displays sub-metrics that reside under a metric. Impact: How much a balanced scorecard object impacts the overall balanced scorecard score. Dependent on the weighting of each balanced scorecard object. Actual Value: Displays the actual value for the period selected. Goal: Displays the Goal threshold for the performance measure. % of Goal: Displays the percentage the value is to the Goal. % Variance To Goal: Displays the percentage distance away from the Goal. Show Tags: Displays Tags that are created for the performance measure. 54

55 Notes Subsection: The Notes subsection displays all notes that have been created for the balanced scorecard or a specific balanced scorecard object. Simply select the balanced scorecard name to display all the notes that have been created for all the balanced scorecard objects or select a specific balanced scorecard object to view the notes created for that object. Select the New Note button to create a new note, the Edit Notes button to edit your note, the Delete Note button to delete a note or the Reply button to reply to the note. Notes will have the calendar period listed that note applies to, the balanced scorecard object name the note is created for, the name of the user who created or replied to the note as well as the date the note was created. Notes can be printed, ed, or exported by selecting the Send Page To button. All notes and replies to notes made within the software will be displayed in the Notes Subsection. Notes may also be added to reports. See the Reports section for additional information. 55


56 Analysis Subsection: The Analysis subsection contains a variety of graphical representations of your data. Clicking on any of these icons will produce a different type of analysis graph. Also, these results will dynamically change to match whichever object you select from the balanced scorecard structure on the Navigation pane. All of the graphs may be exported, sent to My Bookmarks or a briefing book and saved as a JPEG image by selecting the Send Page To button. The following are examples of each Analysis graph. Select a balanced scorecard object to view the Analysis graph options. Click the Select Analysis Report heading to select a different Analysis report. Scores Over Time Analysis Report Displays scores over a period of time for the balanced scorecard object selected. 56


57 Underlying Detail Analysis Report Displays the balanced scorecard objects below the object selected as well as the actual values. Performance Measure Scores Analysis Report Displays the scores for a balanced scorecard object selected and all objects below it. Objective Scores Analysis Report Displays the scores for the balanced scorecard objectives. 57
58 Underlying Scores Analysis Report This report displays a bar chart with the scores of balanced scorecard objects below the balanced scorecard object selected. For example, if you select the balanced scorecard name, the perspectives and scores will be graphed. If a perspective is selected, the objectives will be graphed, and so on. Scores Breakdown Analysis Report This Analysis report displays a pie chart with the weights of balanced scorecard objects below the balanced scorecard object selected. For example, if you select the balanced scorecard name, the perspectives and weights will be graphed. If a perspective is selected, the objectives will be graphed, and so on. 58

59 Scores Color Ratio Analysis Report This Analysis report displays a pie chart with the scores color ratio. For example, if you select an objective with five performance measures under it, the performance measure color will be displayed in a pie chart for the percentage of performance measures that are red, yellow, and green or other colors depending on the scoring type. If you have five performance measures, one is red, two are yellow, and two are green. The red slice of the pie is 20%, the yellow and green both will be 40%, totaling 100%. Underlying Speedometers Analysis Report This Analysis report displays the speedometers for a balanced scorecard object selected. For example, if you select an objective the performance measure speedometers for that objective will be displayed. If the balanced scorecard name is selected, the perspective speedometers will be displayed. If you select a performance measure that has sub measures, the sub measure speedometers for that performance measure will be displayed. 59

60 Performance Measure Value Over Time Analysis Report This report is available when you select performance measures. The report displays a performance measure s values over a period of time. 60

 and Show as One List (see")
61 Tasks Subsection: Tasks: Show by Status The Tasks subsection will display any overdue, ongoing, completed, or archived tasks that have been related to the balanced scorecard object that is displayed. There are two toggled views here: Show by Status (see above figure) and Show as One List (see figure below). The view you choose will determine how data is displayed. Tasks: Show as One List 61


62 If it has been enabled in the Application Administration part of the Administration section, you will see the ability to Add to Calendar. By clicking on the link, you can add this date to your desktop calendar. Below is the first screen that appears after clicking the button. Choose to open the file: Now you can use all of the available tools from your default calendar application to save the appointment. **Disclaimer The screen shot below is of a popular calendar software and it s use in this guide is in no way promoting the purchase or use of such software and is in no way connected to Spider Strategies, Inc.** 62

63 Related Items Subsection: In the Related Items subsection, you can relate a balanced scorecard object to other balanced scorecard objects, strategy maps, strategic initiatives, documents, or external Web addresses. Relating Balanced Scorecard Objects to Other Balanced Scorecard Objects Click the button. Select Scorecard Object from the drop-down menu. Select the organization where the existing balanced scorecard object is located that you want to relate another balanced scorecard object to. Next, select a balanced scorecard object. 63
64 Relating Strategy Maps to Balanced Scorecard Objects (At least one strategy map must be created before you can relate it to a balanced scorecard object). Click the button. Select Strategy Map from the drop-down menu. Select the organization where the balanced scorecard object is located that you want to relate a strategy map to. Next, select a strategy map. Relating Strategic Initiatives to Balanced Scorecard Objects (At least one strategic initiative, task, or milestone must be created before you can relate it to a balanced scorecard object). Click the button. Select Strategic Initiative from the drop-down menu. Select an organization where the strategic initiative is located that you want to relate the balanced scorecard object to and then select a strategic initiative. 64
65 Relating Documents to Balanced Scorecard Objects (At least one document must be uploaded prior to relating it to a balanced scorecard object). Click the button. Select Document from the drop-down menu. Select an organization where the document is located that you want to relate the balanced scorecard object to and then select a document. Relating External Web Addresses to Balanced Scorecard Objects Click the button. Select Web Address from the drop-down menu. Type a name for the Web Address and enter the full Web Address. Click Save 65

66 Deleting a Related Item To remove a related item, select the Delete button to the right of the related item. This will remove the relationship between the balanced scorecard object and the related item. 66

67 The Strategy Maps Section 67

68 This section is where you can view your custom Strategy Maps. You can also return to this section at any time by clicking on the section. The above illustration is an example of a Strategy Map with the trend indicators turned on. The Strategy Map will automatically be populated with color based on the calendar period that you have chosen in the top right. Clicking on any of the balanced scorecard objects will take you to the appropriate drill-down target identified in the application configuration part of the application. As soon as you click on the Strategy Map section, the application will ask you to choose which organization you would like to see. Choose the appropriate organization. 68

69 Building Strategy Maps: Click on the New Strategy Map button: You will be prompted to give your Strategy Map a name: Once you give your Strategy Map a name, the new map/chart applet will open automatically. Make sure that your pop-up blocker is not turned on. If there is a balanced scorecard associated with that organization, then that Balanced Scorecard tree will appear under the organization on the left: 69


70 If the Balanced Scorecard tree is empty or if you want to create a map from objects in different balanced scorecards, click on the button in the most upper left-hand corner of the application to open the Organization tree. Once you have opened the Organization tree, you can click on any object and select the balanced scorecard objects associated with that object: You can now drag and drop any element in the Balanced Scorecard tree onto the Strategy Map: 70

71 At this point, you are ready to create your Strategy Map. Following is a listing of the tools on the Strategy Map toolbar and each of their respective actions: Right click on an element and you will see a menu of further options: These options allow you to adjust the font size and the shape of the element, edit the label, change the way background colors appear, manually select a drill-down target, or remove the selected element. More options: This button saves the Strategy Map. This button turns on the select cursor. This button turns on the draw arrow cursor. This button will undo the last action. You may undo as many actions as have been completed up until the point at which you d started to undo them. This button will redo the last action that was undone. This button will delete the selected element. This button will zoom to normal view. This button will zoom in to enlarge the size of the full image. This button will zoom out to reduce the size of the full image. You are now ready to create your maps and connect the objects with cause and effect arrow indicators. To do so, click the draw arrow button; now click on the element that you want the arrow to come from and drag it to the element that you want the arrow to go to. When you release, your map will have an arrow connecting the two performance measures together. 71

72 The other feature the Strategy Map edit applet holds is the ability to set a background image for your charts. Uploading, saving, previewing, and switching in and out images is covered in the Images section as well as the Application Administration section of the Admin User Guide. To add images to your map, simply select the image from the dropdown list: Click the Save button in the top left-hand corner before closing the applet. Once you have created a Strategy Map, you have the option to edit or delete it at any time. Just go to the Strategy Map section and right-click the Strategy Map that you would like to edit and you will see these options as well as the ability to drag and drop to reorder: 72
73 The Strategic Initiatives Section This section is where your custom strategic initiatives can be viewed. You can also return to this section at any time by clicking on the section. As soon as you click on the Strategic Initiatives section, the application will ask you to choose which organization you would like to see. Choose the appropriate organization. 73

74 Gantt Chart Subsection: This is the first section that will be displayed when you choose the Strategic Initiatives section. By default, the All Strategic Initiatives option will display as a Gantt chart. This will display all the strategic initiatives, tasks, and milestones that have been created for this organization. You can also add strategic initiatives, tasks, and milestones from this subsection. Rightclick on the parent object of the object that you would like to create and you will see the following menu. NOTE: Communication and View Only Users cannot delete or archive strategic initiatives, tasks, or milestones. Creating a New Strategic Initiative Right-click on the All Strategic Initiatives button and select New Strategic Initiative. Title and Strategic Initiative Type are the only required fields. 74
75 A description may be added and can be viewable when creating Strategy Map Bubbles within a dashboard. In order to enter dates for the Start, Due, and Completion date fields, click on the appropriate box. This will bring up the calendar dialog box. Click on a date in the calendar and this will populate the appropriate field. Select the Next button to assign users or groups to the strategic initiative or select the Finished button to skip the Assign Users or Groups dialog box. Assigning Users/Groups to a Strategic Initiative Select a user or group from the drop-down menu Select the Assign User or Assign Group button after each user or group. Select the Notify Users/Groups of Assignment/Unassignment checkbox (optional). Select the Finished button. To delete users or groups, select the X to the right of the name. 75
76 Creating a New Task Right-click on a strategic initiative that has been created and select New Task. Title and Strategic Initiative Type are the only required fields. A description may be added and can be viewable when creating Strategy Map Bubbles within a dashboard. In order to enter dates for the Start, Due, and Completion date fields, click on the appropriate box. This will bring up the calendar dialog box. Click on a date in the calendar and this will populate the appropriate field. Select the Next button to assign users or groups to the task or select the Finished button to skip the Assign Users or Groups window. 76
77 Assigning Users/Groups to a Task Select a user or group from the drop-down menu Select the Assign User or Assign Group button after each user or group. Select the Notify Users/Groups of Assignment/Unassignment checkbox (optional). Select the Finished button. To delete users or groups, select the X to the right of the name. Creating a New Milestone Right-click on a strategic initiative, task or milestone that has been created and select New Milestone. Title and Strategic Initiative Type are the only required fields. 77
78 A description may be added and can be viewable when creating Strategy Map Bubbles within a dashboard. In order to enter dates for the Start, Due, and Completion date fields, click on the appropriate box. This will bring up the calendar dialog box. Click on a date in the calendar and this will populate the appropriate field. Select the Next button to assign users or groups to the milestone or select the Finished button to skip the Assign Users or Groups window. Assigning Users/Groups to a Milestone Select a user or group from the drop-down menu Select the Assign User or Assign Group button after each user or group. Select the Notify Users/Groups of Assignment/Unassignment checkbox (optional). Select the Finished button. To delete users or groups, select the X to the right of the name. NOTE: Strategic initiatives, tasks and milestones may be deleted by right-clicking the object in the tree on the left-side of the screen and selecting the Delete option. You may also move objects in the tree by clicking, dragging and dropping the objects. 78
79 Gantt Chart Colors: What Do They Mean? Task Colors BLUE % complete has not been entered RED for ANY of these cases when the % complete has been entered: Overdue (past due date, not yet completed) Projected to be overdue (based on % complete) Over budget GREEN when BOTH are true: Not over budget Completed; or projected to be completed on time (based on % complete) Milestone Colors RED for ANY of these cases: Overdue (past due date, not yet completed) Projected to be overdue. (based on % complete) Over budget PURPLE % complete not entered; and not over budget GREEN Not over budget Completed; or projected to be completed on time (based on % complete) 79

80 Overview Subsection: From the Overview subsection, you have much more detailed information displayed as well as the ability to create, and/or modify strategic initiatives, tasks, or milestones. You can create these objects in the same way described in the Gantt chart section: by rightclicking the object and using the drop-down menu. Or you can navigate using the tree navigation on the left and clicking on the button. 80

81 A description may be added and can be viewable when creating Strategy Map Bubbles within a dashboard. In order to enter dates for the Start, Due, and Completion date fields, click on the appropriate box. This will bring up the calendar dialog box. Click on a date in the calendar and this will populate the appropriate field. Select the Next button to assign users or groups to the strategic initiative, task, or milestone or select the Finished button to skip the Assign Users or Groups window. Modifying Users/Groups You can modify assigned users or groups by clicking on their respective buttons. Select a user or group from the drop-down menu Select the Assign User or Assign Group button after each user or group. Select the Notify Users/Groups of Assignment/Unassignment checkbox (optional). Select the Finished button. To delete users or groups, select the X to the right of the name. 81

82 Adding Notes You can create and edit a message for a strategic initiative, task, or milestone. Select the Edit Message button in the Notes section located below the Modify Users button. Type and format your message and select the Save button. To edit your message, select the Edit Message button again, type and format, click Save. Archiving Strategic Initiatives, Tasks, and Milestones Archiving does not delete the object but rather the object will not appear in the Strategic Initiatives tree structure. The archived object will be displayed in the Archived Actions section of the Tasks subsection. Communication and View Only Users may not archive or unarchive objects. There are two ways to archive. The first option is to right-click on the strategic initiative, task, or milestone on the left and select Archive from the dialog box. A dialog box will appear asking you to confirm that you wish to archive the strategic initiative, task, or milestone and all objects below it. Select the Yes button. 82

83 The second way to archive is to select the Archive button in the strategic initiative, task, or milestone Info window. Once again, you will be asked to confirm that you wish to archive the strategic initiative, task, or milestone and all objects below it. Select the Yes button. Unarchiving Strategic Initiatives, Tasks, and Milestones To unarchive a strategic initiative, task, or milestone, select the Task subsection of the Strategic Initiatives section. Select a strategic initiative, task, or milestone name under Archived Tasks. 83

84 The software navigates you back to the Overview subsection. In the Strategic Initiative, Task, or Milestone window you will see an Unarchive button. Select this button and you will be prompted to confirm that you wish to unarchive the object. Select Yes. The object is now displayed in the Strategic Initiative tree. 84


85 Tasks Subsection: The Tasks subsection will display any overdue, ongoing, completed, or archived tasks that have been created. There are two toggled views here: Show by Status and Show as One List. The view you choose will determine how data is displayed. Tasks: Show by Status Tasks: Show as One List NOTE: The Tasks subsection is where you will locate the Archived Task section. To unarchive tasks listed in this section, click on the Task Name. You will be relocated to the Overview subsection. Click the Unarchive button in the Task Info window. 85

86 If it has been enabled in the Application Administration part of the Administration section, you will see the ability to Add to Calendar. By clicking on the link, you can add this date to your desktop calendar. Below is the first screen that appears after clicking the button. Choose to open the file: Now you can use all of the available tools from your default calendar application to save the appointment. **Disclaimer The screen shot below is of a popular calendar software and it s use in this guide is in no way promoting the purchase or use of such software and is in no way connected to Spider Strategies, Inc.** 86

87 Related Items Subsection: The Related Items subsection lists the links associated with a strategic initiative and another object within the software. You can link a strategic initiative, task, or milestone to balanced scorecard objects, strategy maps, other strategic initiatives, documents, or external Web addresses. Relating Balanced Scorecard Objects to Strategic Initiatives Click the button. Select Scorecard Object from the drop-down menu. Select an organization where the balanced scorecard object is located that you want to relate the strategic initiative to and then select a balanced scorecard object. 87
88 Relating Strategy Maps to Strategic Initiatives (At least one strategy map must be created before you can relate it to a strategic initiative). Click the button. Select Strategy Map from the drop-down menu. Select the organization where the strategic initiative is located that you want to relate a strategy map to. Next, select a strategy map. Relating Strategic Initiatives to Other Strategic Initiatives (At least one strategic initiative must be created before you can relate it to another strategic initiative). Click the button. Select Strategic Initiative from the drop-down menu. Select an organization where the strategic initiative is located that you want to relate the selected strategic initiative to and then select a strategic initiative. 88
89 Relating Documents to Strategic Initiatives (At least one document must be uploaded prior to relating it to a strategic initiative). Click the button. Select Document from the drop-down menu. Select an organization where the document is located that you want to relate the strategic initiative to and then select a document. Relating External Web Addresses to Strategic Initiatives Click the button. Select Web Address from the drop-down menu. Type a name for the Web Address and enter the full Web Address. Click Save. 89

90 Deleting a Related Item To remove a related item, select the Delete button to the right of the related item. This will remove the relationship between the strategic initiative and the related item. 90


91 New Task Button Strategic initiatives, tasks, and milestones can be created at anytime if you are displaying any subsection of the Strategic Initiatives section, all Balanced Scorecards subsections with the exception of the Analysis subsection, and the Documents section. By selecting the New Task button, you can create strategic initiatives, tasks, and milestones in these sections of the software and the object will be created in real time. When using the Add Task button, follow the prior instructions on how to add a strategic initiative, task, or milestone. Exporting Action Plans Strategic initiatives can be exported to Microsoft Project by selecting the Send Page To button at the top of the page and then selecting Microsoft Project. Strategic initiatives may also be sent to My Bookmarks and Briefing Books. They may also be printed, ed, displayed in Full Screen mode, and exported to Microsoft Word, Excel and PowerPoint. You can select Acrobat PDF and JPEG image as well. 91
92 The Documents Section This section is where your uploaded documents can be viewed. You can also return to this section at any time by clicking on the section. As soon as you click on the Documents section, the application will ask you to choose which organization you would like to see. Choose the appropriate organization. Organizations with blue bubbles to the left of their names indicate documents have been uploaded for those organizations. Gray bubbles indicate that there are no documents uploaded. 92


93 Overview Subsection: Adding a New Document Click on the dialog box will appear. button to upload a new document into the application. A Type a Description for the file you are uploading. Click on the button to locate the file on your local environment. And then click the button. You can then click on your document on the left navigation pane. You should see this in the content pane: To view a document, select the document name in the content window. 93


94 Revising Documents To revise the file, simply upload a newer version of the file in the New Revision section. All revisions will be listed in the Revisions section. Documents uploaded are not updated when revisions are made to the native document outside of the software. You must upload the revised file for the revisions to be viewable inside the software. Renaming or Deleting Documents To rename or delete the document, add a new document, or view a document s history, right-click on the document name in the navigation pane and make your selection. 94
95 Related Items Subsection: The Related Items subsection lists the links associated with the document and another object within the software. You can link a document to balanced scorecard objects, strategy maps, strategic initiatives, other documents, or external Web addresses. Relating Documents to Balanced Scorecard Objects Click the button. Select Scorecard Object from the drop-down menu. Select an organization where the balanced scorecard object is located that you want to relate the document to and then select a balanced scorecard object. 95
. Click the button.")


96 Relating Documents to Strategy Maps (At least one strategy map must be created before you can relate it to a document). Click the button. Select Strategy Map from the drop-down menu. Select the organization where the document is located that you want to relate a strategy map to. Next, select a strategy map. Relating Documents to Strategic Initiatives (At least one strategic initiative must be created before you can relate it to a document). Click the button. Select Strategic Initiative from the drop-down menu. Select an organization where the strategic initiative is located that you want to relate the selected document to and then select a strategic initiative to relate to. 96
97 Relating Documents to Other Documents (At least one document must be uploaded prior to relating it to a document). Click the button. Select Document from the drop-down menu. Select an organization where the document is located that you want to relate the document to and then select a document. Relating External Web Addresses to Documents Click the button. Select Web Address from the drop-down menu. Type a name for the Web Address and enter the full Web Address. Click Save 97
98 Deleting a Related Item To remove a related item, select the Delete button to the right of the related item. This will remove the relationship between the document and the related object. 98


99 The Reports Section This section is where you can create/view reports in the application. You can also return to this section at any time by clicking on the section. There are eight out-of-the-box reports available for you to choose from: Scorecard Object Owner/Updater Report, Annual Performance Measure Data Report, Balanced Scorecard Structure Report, Red Performance Measure Report, Gray Performance Measure Report, Performance Measure Update Frequency Report, Performance Measure Comparison Report, and the Strategic Initiatives Report. There is also a Report Writer that allows you to create and save your own custom report options and a Chart Writer that allows you to create and save your own custom charts. If permission has been given to you in the Administration module, you will have access to the SQL Console which is used with SQL Queries. You can find all of these reports by clicking on the button. You will then see: 99

100 Important Notes about Reports Select an organization for which you wish to create reports or charts. Reports created and saved will be saved to the organization that is selected. If you want to save reports but not have them visible to other users, save the report to an organization with restricted view access. Another option is not to save the report but send it to My Bookmarks where you will have access to it but other users will not. Creating Folders and Subfolders You can create folders and subfolders to organize your reports and charts. Right-click on the Saved Reports folder and select New Folder. Type a folder name and click Save. To add sub folders, right-click on a folder name and select Create a New Folder. Type a folder name and click Save. Adding Reports to Folders When reports or charts are created and saved, they appear under the list of folders on the left-side of the window. To add the report to a folder, click, drag and drop the report or chart name into a folder. The red arrow next to the report or chart name will turn green if you have a folder properly selected in which to drop the report. Creating New Reports: Click the button and select a report to create. The following pages list the different reports available. 100

101 Scorecard Object Owner/Updater Report: This report will allow you to create and view Owners and/or Updaters associated with users, organizations, and balanced scorecards that you select. Select a User: Select All Users or a single User. Select an Organization: Select All Organizations or a single Organization. Responsibility Type: Select Owners and Updaters, Owners Only or Updaters Only. Include Performance Measures Only: Check the box if you want to display only the performance measures. Uncheck if you want to display all balanced scorecard objects. Click the button when your options have been selected. Scorecard Object Owner/Updater Report Results: Once your report is created you can select Save and type a report name or simply click New Report without saving. If the results are not what you are looking for you can select Modify This Search to select new options and then click Search to create the report. 101
102 Annual Performance Measure Data Report: This report allows you to create and view annual performance measure data based on the selections that you make: Display Options Select a Balanced Scorecard: Select the balanced scorecard for which you are looking to create the report. Select a Period: Select the calendar period (e.g., 2012). Select the Calendar Breakdown: Weekly, Monthly, Annual, etc. Select the checkboxes for the information that you would like to display in the report. Assigned Calendar: Calendar that was selected when creating the performance measure (How often are the performance measures to be updated). Owners: Displays the Owners of a performance measure. Variance To Goal: The distance away from the Goal. Show Parents: Displays all of the balanced scorecard objects for the performance measure such as perspective, objective, etc. Show Sub-Metrics: Displays sub metrics that reside underneath a metric. Impact: How much a balanced scorecard object impacts the overall balanced scorecard score. Dependent on the weighting of each balanced scorecard object. Actual Value: Displays the actual value for the period selected. Goal: Displays the Goal threshold for the performance measure. % of Goal: Displays the percentage the value is to the Goal. % Variance To Goal: Displays the percentage distance away from the Goal. Show Tags: Displays Tags that are created for the metric. 102

103 Annual Performance Measure Data Report Results Once your report is created you can select Save and type a report name or simply click New Report without saving. If the results are not what you are looking for you can select Edit Report to select new options and then click Get Report to create the report. 103
104 Balanced Scorecard Structure Report: This allows you to view a report outlining the structure of a balanced scorecard. If you are using Connect for importing data or structure, you can export the Balanced Scorecard Structure Report to Excel. Select Choose to select an organization and then the balanced scorecard or object of the balanced scorecard you wish to display in the report. If you select the balanced scorecard name, the entire balanced scorecard structure will display. If you select any part below the name, that object and anything below what you select will display. Description: If you added a description for any balanced scorecard objects, the description will appear on the report. Performance Measure Thresholds: The scoring thresholds will appear if selected. For example, the Goals and Red Flag thresholds will be displayed. Owners: The Owner name will appear if checked. Updaters: The Updater name will appear if checked. Weight: The Weight of the balanced scorecard object will appear if checked. Import Mapping Key: The Import Mapping Key value is initially populated with the ID value, but the Import Mapping Key value CAN be changed. Also, it is possible to use an alpha-numeric value (e.g., A1234). This value was used for CSV Imports but with Spider Connect this no longer needed. Performance Measure Frequency: How often are the performance measures updated? (e.g., monthly) 104
105 Selecting Show descendants of linked objects will display any linked objects that have been added to your balanced scorecard and any objects that are part of the link. For example, if you have an objective that is a linked object and it has three measures associated with it, those measures will appear in the report as well. Leave this checkbox unchecked to view the linked object and not the objects associated with it. The following figures will show how the report changes when this option is selected Show descendants of linked objects box unchecked Show descendants of linked objects box checked 105
106 Balanced Scorecard Structure Report Results: Once your report is created, you can select Save and type a report name or simply click New Report without saving. If the results are not what you are looking for, you can select Modify This Search to select new options and then click Submit to create the report. You can select the Send Page To button for export options. 106

107 Red Performance Measure Report: This allows you to view a report displaying the performance measures with red scores for a specific time period. Select Choose to select an organization and then the balanced scorecard or object of the balanced scorecard you wish to display in the report. If you select the balanced scorecard name, the entire balanced scorecard structure will display. If you select any part below the name, that object and anything below what you select will display. You may also select additional organizations and balanced scorecard objects to create a report across organizational balanced scorecards. Continue selecting organizations and balanced scorecard objects that you wish to view in the report. To delete an object, select the X to the right of the object. When you have your selections made, select Finished. 107

108 Selecting Show descendants of linked objects will display any linked objects that have been added to your balanced scorecard and any objects that are part of the link. For example, if you have an objective that is a linked object and it has three measures associated with it, those measures will appear in the report as well. Leave this checkbox unchecked to view the linked object and not the objects associated with it. Select a calendar period to display. The calendars listed are created in the Administration module. Select By Date to select a Beginning and Ending period by date or Relative to select the date by number of periods earlier or later. The final step is to select the information that you would like to display in the report. Selecting from the following checkboxes will add the information to the report. Click Submit when all options that you wish to display have been selected. Id: The system generated ID assigned to the measure will be displayed. Name: The name of the performance measure will be displayed. Organization: The organization the performance measure is created under will be displayed. Value: The actual performance measures s value for the calendar period selected will be displayed. Owners: The Owner(s) of the performance measure will be displayed. Updaters: The Updater(s) of the performance measure will be displayed. Red Performance Measure Report Results Editing of your report is discussed in the Report Writer. Once your report is created you can select Save and type a report name or simply click New Report without saving. You can select the Send Page To button for export options. 108
109 Gray Performance Measure Report: This allows you to view a report displaying the performance measure with gray scores for a specific time period. Gray scores are performance measures that do not have data updated for the calendar period selected. Select Choose to select an organization and then the balanced scorecard or object of the balanced scorecard you wish to display in the report. If you select the balanced scorecard name, the entire balanced scorecard structure will display. If you select any part below the name, that object and anything below what you select will display. You may also select additional organizations and balanced scorecard objects to create a report across organizational balanced scorecards. Continue selecting organizations and balanced scorecard objects that you wish to view in the report. To delete an object, select the X to the right of the object. When you have your selections made, select Finished. Selecting Show descendants of linked objects will display any linked objects that have been added to your balanced scorecard and any objects that are part of the link. For example, if you have an objective that is a linked object and it has three measures associated with it, those measures will appear in the report as well. Leave this checkbox unchecked to view the linked object and not the objects associated with it. 109

110 Select a calendar period to display. The calendars listed are created in the Administration module. Select By Date to select a Beginning and Ending period by date or Relative to select the date by number of periods earlier or later. The final step is to select the information that you would like to display in the report. Selecting from the following checkboxes will add the information to the report. Click Submit when all options that you wish to display have been selected. Id: The system generated ID assigned to the measure will be displayed. Name: The name of the performance measure will be displayed. Organization: The organization the performance measure is created under will be displayed. Value: The actual performance measure s value for the calendar period selected will be displayed. Owners: The Owner(s) of the performance measure will be displayed. Updaters: The Updater(s) of the performance measure will be displayed. Gray Performance Measure Report Results Editing of your report is discussed in the Report Writer. Once your report is created you can select Save and type a report name or simply click New Report without saving. You can select the Send Page To button for export options. 110
111 Performance Measure Update Frequency Report: This allows you to view a report displaying the performance measures and their update frequency. For example, if you want to create a report for all performance measures that are updated on a monthly basis, then you would select Monthly. Select Choose to select an organization and then the balanced scorecard or object of the balanced scorecard you wish to display in the report. If you select the balanced scorecard name, the entire balanced scorecard s performance measures will display. You may select a single perspective or objective and all performance measures below those will display or you can select a single performance measure. You may also select additional organizations and balanced scorecard objects to create a report across organizational balanced scorecards. Continue selecting organizations and balanced scorecard objects that you wish to view in the report. To delete an object, select the X to the right of the object. When you have your selections made, select Finished. Next select the metric update frequencies you would like to display in the report. If you want to know what metrics are updated monthly, select Monthly. (If you have a Monthly calendar created in the Administration module). The calendar listed in the above image is for example only. Your calendars may vary from this image. The last step is the select the data that you would like displayed in the report. The ID number is a system-created number for each measure. The Name is the name of the performance measure. Click Submit to create the report. 111

112 Performance Measure Update Frequency Report Results Editing of your report is discussed in the Report Writer. Once your report is created you can select Save and type a report name or simply click New Report without saving. You can select the Send Page To button for export options. 112


113 Performance Measure Comparison Report: This allows you to view a report displaying performance measures from two or more similar balanced scorecards from different organizations side by side. Select the New Report button. Select a Calendar from the drop-down menu. Select a Calendar Period from the drop-down menu. Select two or more organizations to compare side by side. Select the Submit button. Performance Measures Comparison Report Results Once your report is created, you can select Save and type a report name or simply click New Report without saving. You can select the Send Page To button for export options. 113

114 Strategic Initiatives Report: This allows you to view a report displaying strategic initiatives, tasks, or milestones based on a specific set of parameters. Select a user: You can create a report by all users or for a specific user. Select a group: You can create a report by all groups or for a specific group. Select an Organization: You can create a report by all Organizations or for a specific Organization. Due Date after or before: Optional. Select a date when is the initiative due. Completion Date after or before: Optional. Select a date for the initiative completion date. Completion Status: Select Completed and Uncompleted, Uncompleted Only, or Completed Only. Archive Status: Select Not Archived, Archived Only, or All (Archived and Not Archived). Select the button. 114

115 Strategic Initiatives Report Results Once the report is created you have several options. Click any of the column headings to sort the column data. Click a related item in the Related Items column. This takes you to the related item in the software. Click Add to Calendar to add to your calendar. Click Notes to create or edit a strategic initiative note. Click Archive to archive the strategic initiative, click Update to update the strategic initiative, or click History to view the history of the strategic initiative. 115

116 Reordering Reports in the Reports List or in a Folder If you need to reorder your reports, click and drag the report name and drop above or below another report. As you are dragging to move the report, you will notice a red or green arrow to the left of the report name. The green arrow allows you to drop the report in the new location. The red arrow will not allow you to drop the report in that location. Copying Reports There may be times you need to copy reports and paste them to another organization or folder. There is not a copy option to copy reports. You can perform the actions below to create a duplicate report. Click on the report you want to copy. Click the Save button on the right-side of the window. Click Save As New Report. You can leave the report name the same or create a new report name. Select OK Once the report has been saved, you can click and drag it into another folder within the same organization, or right-click and select Cut. Then select another organization and right-click on a folder and select Paste. There is not a copy and paste function within the software. This is how you copy and paste reports from one location to another. 116
117 Report Writer: This feature allows you to create your own custom reporting. You can select as many or as few filters as you wish and then decide what columns you want to be displayed on the report. 117

118 Start by expanding the first step and then clicking on the button at the top of the page. Filters allow you to narrow your search for information. You will see the following: Name: Allows you to filter based on the physical name of the object. You can choose contains any of the terms, contains all of the terms, begins with, or ends with. Description: Allows you to filter based on the description of the object. You can choose contains any of the terms, contains all of the terms, begins with, or ends with. 118

119 Scorecard Object Type: Allows you to filter based on the object type. You can choose Balanced Scorecard Root, Perspective, Performance Measure, Theme, Objective, or Linked. You can also have multiple choices selected here. Descendant Of: Allows you to choose any set of objects that are subordinate to a particular object. For example, if you select the balanced scorecard name, all parts of the balanced scorecard will be included in the report. 119
120 Color: Allows you to filter by any of the seven colors for any Calendar and any series of periods. Weight: Allows you to filter based on the set weight of an object. You can choose a number to match, either greater than or less than a number, or between any two numbers. 120
 Performance Trend: Allows you to filter on objects with scores that are either trending upward or downward for a set of periods.")
121 Owners: Allows you to filter and search through the owners based on matching any or all terms as well as begins with or ends with. (e.g., contains William) Performance Trend: Allows you to filter on objects with scores that are either trending upward or downward for a set of periods. (Trending upward means performance improved during the beginning and ending periods.) 121
122 Specific Scorecard Objects: Allows you to filter by choosing as many specific objects as you require. You may select objects from various parts of a single balanced scorecard or across various balanced scorecards. Click on an object, then an additional object or objects to select. Score: Allows you to filter based on the score of an object. You can choose to match a number, either greater than or less than a number, or between two numbers for any set of calendar periods. Select a Calendar and period dates. 122
 Performance Measure Frequency: Allows you to filter performance measures by one or more of the calendar periods that have been created in the application.")
123 Tags: Allows you to filter based on the tags you assigned to balanced scorecard objects. Contains any of the tags or Contains all of the tags are the options to select. Type your tag or tags to search for. Updater: Allows you to filter and search performance measures through updaters based on matching any or all terms as well as begins with or ends with. (e.g., filter the name William) Performance Measure Frequency: Allows you to filter performance measures by one or more of the calendar periods that have been created in the application. 123


124 Update Type: Allows you to filter by manual or calculated performance measures. Data Type: Allows you to filter by percentage, currency, or standard data types for performance measures. Aggregation Type: Allows you to filter performance measures by Sum, Average, or Last Value (already aggregated). 124

125 Import Mapping Key: Allows you to filter performance measures based on their uniquely assigned import mapping key. Value: Allows you to filter performance measures based on their specific values for any set of calendar periods. 125

126 Scoring Type: Allows you to filter performance measures based on their scoring types. Once you have selected the filters you want, use the drop-down menus and checkboxes in Step 2 to choose the columns to be displayed for your custom report. 126


127 You must define a calendar period range when choosing to display the Score, Color, Performance Measure Value, Performance Measure Threshold, Period Specific Notes, Goal, Variance To Goal, % Variance To Goal, % of Goal and YTD. If you choose any period-specific data, Step 3 will allow you to chart your data in the report. Click on the custom report. button at the bottom of the page and you will now see your new If you add this report to your bookmarks by using the Send To feature, you can always click on it from the Bookmarks section and you will have saved a new custom report. You can also click on the button and you can save this report to be used by anyone with View privileges to this organization. 127
128 Chart Writer: This allows you to create and view your own custom charts using the data found in QuickScore. First, click the drop-down menu next to Line Chart. This will bring up a list of chart styles that are available. Chart Writer offers the following chart types: Line Chart; Bar Chart; Stacked Bar Chart; Stacked 100% Bar Chart; Stacked Area Chart; Pie Chart; Doughnut Chart; Polar Chart; and Combination Chart. 128
129 Let s start with a Line Chart and Graph One Time Period. Click the button to get started. You will then have the opportunity to choose a balanced scorecard object: 129

130 After you have chosen an object, you will see the chart: At the bottom of the screen are several drop-down menus. Use these menus to change chart type; compare more than one time period; select additional balanced scorecard objects; and to select Actual Value, Score, Red Flag, or Goal. You can also change the chart from Left Axis to Right Axis and add a Trendline Over Time. You can change the color of your graph s objects. Additionally, you can change the time periods reflected in your chart to show monthly, quarterly, or yearly data and show calendar periods by date or relative to selected period. Finally, move the scroll bar at the bottom to show more or less time in your chart. 130

131 Here are just a few examples of different chart types, comparing different time periods. Bar Chart: Note that in the above example, 2008 and 2009 data are being compared. 131

132 Stacked 100% Bar Chart: Note that in the above example 2008 and 2009 data are being compared. 132

133 Doughnut Chart: Note that in the above example, 2005 and 2008 data are being compared. Once you have finished creating your chart, you can save the chart or send it to your My Bookmarks section just like the Report Writer. 133

134 The Dashboard Section This is the section where you can create and store all of your dashboards. Dashboards are powerful tools that allow you to show your data in QuickScore by entering text, charts, strategy map bubbles, speedometers, sliders and bullets, Gantt charts, linked content, images, and background images. 134

135 Creating Your Dashboard: The first thing you will have to do is create a dashboard. When choosing an organization that doesn t yet have a dashboard, this is the first screen you will see when choosing the section: Click on the button to create a new dashboard. Give it a name: This will be the result: 135
, text, images, and a background image to your dashboard.")
136 Editing Your Dashboard: Right-click on your dashboard name and you will see the following options. Select Edit. Now you can begin creating your dashboard. By clicking on the icons across the top row, you can add speedometers, charts, strategy map bubbles, Gantt charts, linked content (e.g., notes, reports), text, images, and a background image to your dashboard. You will also see options to Arrange and Align. You can use Arrange if you are creating two or more items. Simply, select an item, click Arrange, and then choose one of the following: 136


137 To Align multiple items, either select the items you want by drawing them into a box across your screen. Or simply hold down the Ctrl key + left click with your mouse to select them. This method is particularly useful if you want to select certain objects, but not others as above. Then, click Align and select an option from the menu to align your selected objects. You can also move and resize items on your dashboard by clicking on them. If you want to delete an item, select the item and then select either the delete button on the keyboard or the delete button on the Dashboard toolbar. As you complete your dashboard, select either or and you will be prompted to save your dashboard. 137

138 Adding a Gauge Click on the speedometer icon. A dialog box will open. Choose the object you want represented by your speedometer. Once you ve selected what you want reflected in your speedometer, your speedometer will appear on your screen. You will also see a second row of options. By default, Name will be selected. You can choose to add Organization, Score, Actual Value, and Thresholds to your speedometer. Your screen will look something like this: 138


139 You can also select from one of the other gauge types. Instead of speedometer, let s select a horizontal bullet or slider. Then, select the object you want reflected in your horizontal bullet or slider. Once you ve selected what you want reflected in your horizontal bullet or slider, your horizontal bullet or slider will appear on your screen. You will also see a second row of options. Click on Label and select the labels that you want to add to your horizontal bullet or slider. 139


140 Your screen will now look something like this: The previous gauge is actually a horizontal slider. To change it into a horizontal bullet, simply select the object and click on Type. Select Bullet. To create a vertical slider or bullet, simply make your selection in the gauge drop-down menu and follow the same steps for adding Labels or switching Types. 140
141 Adding a Chart You can also add a chart to your dashboard. Click the chart icon on top of your screen. To begin building your chart, select Chart Type. 141
142 Line Charts QuickScore offers many different types of charts. In this case, we ve selected a Line Chart and have chosen Graph One Time Range. The next step is to click Series Data. This is where you select the objects that you want reflected in your chart. You can select as many as you want. In this case, two objects have been selected. 142
143 Next, select Time Ranges. You can show monthly, quarterly, and yearly periods. You can display the data Relative to Selected Period, as above. In this case, move the slider to increase or decrease the number of periods displayed. You can also display the data By Date and move the slider to increase or decrease the months displayed. (Select quarterly or yearly to be able to move the slider to increase or decrease the quarters or years displayed.) Next, click on Background Colors and make your selection. And finally, click Legend. 143

144 Your line chart will look something like this: 144

145 Bar Charts You can also add a Bar Chart to your dashboard. Simply, click on the chart icon. Click Chart Type and select Bar Chart from the drop-down menu. Then choose either Graph One Time Range or Compare Time Ranges. Next, click on Series Data. Select the balanced scorecard objects you want displayed in your Bar Chart. Remember, you can add as many objects as you like. 145


146 Here, two balanced scorecard objects were selected. 146
147 Next, select Time Ranges. You can show monthly, quarterly, and yearly periods. You can display the data Relative to Selected Period, as above. In this case, move the slider to increase or decrease the number of periods displayed. You can also display the data By Date and move the slider to increase or decrease the months displayed. (Select quarterly or yearly to be able to move the slider to increase or decrease the quarters or years displayed.) Next, click on Background Colors and make your selection. And finally, click Legend. 147

148 Your Bar Chart will now look something like this: QuickScore allows you to create many other chart types as well. The process is always the same. First click on the chart icon. Then, select chart type from the drop-down menu. Next, click on Series Data to choose the objects you want reflected in your chart. Select Time Periods to determine the periods of time you want shown in your chart. Pick your Background Color and then choose the type of information you want in the Legend. Here are some examples of other chart types. 148

149 Stacked Bar Chart 149

150 Stacked 100% Bar Chart 150

151 Stacked Area Chart 151


152 Pie Chart NOTE: At the Series Data step, you can separate the sections of your pie chart. Simply, click Separate Section in the Series Data dialog box, below. 152

153 Your pie chart will then look like this: 153

154 Doughnut Chart 154

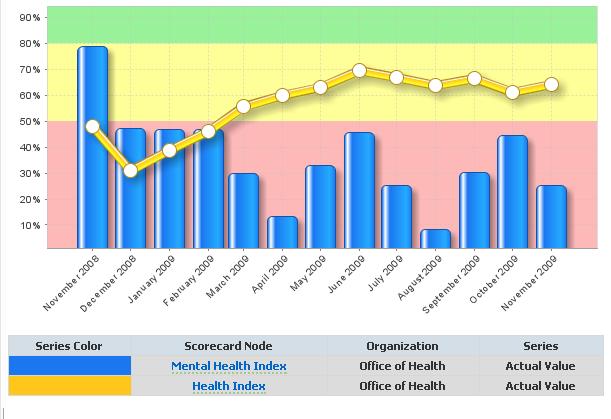
155 Polar Chart Combination Chart 155

156 Adding Strategy Map Bubbles You can add Strategy Map bubbles to your dashboard by clicking the arrow selector next to the Strategy Map bubble icon. Dashboard, Briefing Book, Balanced Scorecard, Strategic Initiative, Document and Report Strategy Map bubbles can be added to your dashboard. Choose which Strategy Map bubbles you want to see. Once you ve selected your Strategy Map bubble, it will appear on your screen in front of your background image. Continue selecting until you have added all the Strategy Map bubbles you want on your dashboard. 156
")

157 Your screen will look something like this: QuickScore also gives you the options to change the shape of your Strategy Map bubbles, select the font size, select a drilldown target, choose a label (Name, Description, Actual Value, Score and Trend) under the showing menu, and change the fill. Simply make your selections with the options below. You can use the Send To feature to send your dashboards to a variety of locations. Just click in the upper-right of your screen and select one of the following options. 157

158 Adding Gantt Charts You can add Gantt Charts to the dashboard that displays your Strategic Initiatives. Click the Gantt Chart icon on the toolbar. Select an organization and then a strategic initiative, task, or milestone. A Gantt chart will be added to the dashboard. Your screen will look something like this: Multiple Gantt charts may be added to a single dashboard. To delete a Gantt chart from the dashboard, select the Delete button on your keyboard or select the X on the toolbar. 158

159 Adding Text Boxes Click the text box option to enter text on your dashboard. Your screen will look like this: Begin typing your text in the text box. Use the tool bar for formatting options, including bold, italics, underline, and redline as well to arrange and align multiple text boxes, delete, align text, and undo/redo edits. Number and Bullet lists, indents and outdents, links, font color, and size are all options to use with text boxes. 159
160 Adding Linked Content You can add linked content to your dashboard. This includes Balanced Scorecard Notes, Strategic Initiative Notes, and Reports. Click on the linked content icon. Balanced Scorecard and Strategic Initiative Notes A drop-down list will appear for you to select your balanced scorecard or strategic initiative note to add to the dashboard. Select Balanced Scorecard Notes and/or Strategic Initiative Notes and select the object that your note is associated with. A reply or new note can be created from the dashboard once you select Finish and select OK to save. Then Select Reply or New Note. All modifications to the notes on the dashboard will be updated in the balanced scorecard. 160
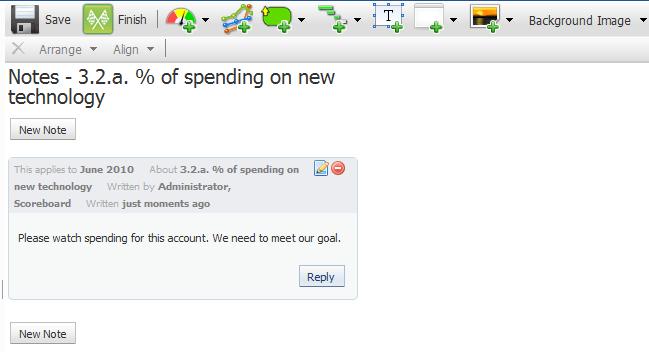
161 161

162 Reports A drop-down list will appear for you to select your report to add to the dashboard. Select Reports and select a report that has been created under Saved Reports. The following is a sample of what a report may look like in your dashboard. 162


163 Adding an Image You can add an image to your dashboard. Click on the image icon. A drop-down list of downloaded images will appear. Select the image you want and it will appear in your dashboard. 163


164 Adding a Background Image You can also select a background image by clicking the arrow selector next to Background Image. A strategy map background image can be created outside of the software, saved as an image, imported into the software, and used to create strategy maps in the dashboard. A drop-down menu will appear. Select the image you want. Your screen will look like this: 164
165 My Alerts Section There is a brand new section in the software called My Alerts. Users can choose to be notified when a wide variety of things happen in the software. Regardless of what section of the application a user is viewing, there is a display at the top of the screen showing how many unread alerts there are for that user. Clicking on this display area takes the user directly into the Alerts section. Users can choose to be notified when a metric value falls below a specified value, when a score reaches a particular limit, or when a comment is added to a balanced scorecard object. Administrators can even send instant alerts, letting users or groups know about important events. For users who don t want to have to log into the software to see if they have alerts, the software can automatically users when something triggers an alert. Users can also choose to group multiple alerts into a single to avoid too many alert s. Select My Alerts from the main menu: 165

166 My Alerts Inbox The My Alerts Inbox lists all of the alerts that the user has created as well as any administrator alerts. To Delete alert messages, select the X to the right of the message or select the delete all button to remove all messages. Creating User Alert Subscriptions Select the My Alert Subscriptions button. Under Preferences in the My Alert Subscriptions window, a user can select how often they wish to receive alert notifications. The options are Never, Immediately, Every night, and Every week on a day of the week selected by the user. Click the Save button to save the selection. 166

167 Creating a New Alert Subscription Select the button. Select an option to create an alert. Options are to send an alert when a score has been changed, when a metric value has been changed, or when notes have been added. Score Changed Alert Select the Choose button and then select an organization and a balanced scorecard object. 167


168 Next, select below or equal to or above or equal to for Send an alert when score is dropdown field. Enter an actual score and select that the alert is for the balanced scorecard object selected or for the metrics under the balanced scorecard object. Select the Save button to create the alert. Once an alert has been created, it will be displayed on the My Alert Subscriptions window. Select the Edit or Delete button under Actions to the right of the alert to edit the alert settings or to remove the alert subscription. 168
169 Metric Value Changed Alert Select the Choose button and then select an organization and a metric to create the alert for. Next, select Send an alert when metric is below or equal to or above or equal to and enter an actual value. Select the Save button to create the alert subscription. 169
170 Notes Added Alert Select the Choose button to select an organization and balanced scorecard object to create a Notes Added alert. If you select the balanced scorecard name, all notes created for the entire balanced scorecard will be sent as alerts to the user. Select the Save button to create the alert. 170


171 Alert Subscription Locations All alert subscriptions for the User will be displayed on the My Alert Subscriptions window under the My Alert Subscriptions section. You can edit and delete the alerts by selecting the Edit and Delete buttons under Actions. Alerts also will appear on the Balanced Scorecards Overview subsection. When you select a balanced scorecard object that has alerts created for it, the alert subscriptions will appear in the My Alerts Subscriptions section. The user can also create a new subscription from this section. At either location, the user can edit or delete the alert. Simply, select the Edit or Delete buttons under the Actions column heading. 171


172 Alert Subscription Notifications When the user has chosen to receive alert s, the user will be alerted several different ways. Unread alerts will be displayed in the software header bar. No matter what section of the software the user is displaying, the unread alerts notification will be visible. The user can select the unread alerts link to navigate to the Alerts Inbox, or select My Alerts from the main menu and select Inbox. The My Alerts Inbox displays all alert s that have been received. The messages with a bold border around them are new and the messages without the bold border have been read. The user can delete a message by selecting the X to the right of the message. Another location that users will be notified of their alerts is in their personal inbox outside of the software. This allows users to view the alerts without having to be logged into the software application. Notes will be displayed in the message. 172

173 Sending an Instant Alert Select My Alerts from the main menu. Select My Alert Subscriptions and select the button. 173

174 Select a user from the drop-down menu and select the Add User button. If you do not select the Add User button, a User will not be selected. You may continue to add additional users and select Add User after each user has been selected. Type a message and format the message as you wish. Select the button to send the alert. Notes regarding Alerts: All of the alerts that were discussed are for individual users. Global alerts that apply to all users are created in the Administration section under Application Administration Notification. If an object in the software application is deleted, all alert subscriptions for the object will be automatically deleted. The alerts themselves will not be deleted. 174
Scoreboard User Guide Table of Contents (Hyperlinked)
") Scoreboard User Guide Table of Contents (Hyperlinked) Getting Started Login Screen Navigating the Sections of Scoreboard Icons My Bookmarks Section Briefing Pane Commonly Used Functions The Briefing Books
Scoreboard User Guide Table of Contents (Hyperlinked) Getting Started Login Screen Navigating the Sections of Scoreboard Icons My Bookmarks Section Briefing Pane Commonly Used Functions The Briefing Books
QuickScore. Version 2.3 User Guide. Table of Contents (Hyperlinked)
") QuickScore Version 2.3 User Guide Table of Contents (Hyperlinked) Getting Started Login Screen Navigating the Sections of QuickScore Icons My Bookmarks Section Administrator Message Briefing Pane Commonly
QuickScore Version 2.3 User Guide Table of Contents (Hyperlinked) Getting Started Login Screen Navigating the Sections of QuickScore Icons My Bookmarks Section Administrator Message Briefing Pane Commonly
Logging In. Use the link in the headed Trial Access and Instructions to reach the login panel. It will be in the format:
 Logging In This guide will help you get started with the application. It does not cover all of the functionality. Go to the last page for information about additional help. Use the link in the e-mail headed
Hands-On Lab. Lab: Developing BI Applications. Lab version: Last updated: 2/23/2011
 Hands-On Lab Lab: Developing BI Applications Lab version: 1.0.0 Last updated: 2/23/2011 CONTENTS OVERVIEW... 3 EXERCISE 1: USING THE CHARTING WEB PARTS... 5 EXERCISE 2: PERFORMING ANALYSIS WITH EXCEL AND
User Guide. Version
 User Guide Version 0.19 2-11-2008 StormPro Max User Guide Page 1 of 69 5/10/2008 Table of Contents 1. Overview... 4 1.1 Definition of StormPro Max Terms... 4 2. Accessing StormPro Max... 5 3. Navigating
AN INTRODUCTION TO OUTLOOK WEB ACCESS (OWA)
") INFORMATION TECHNOLOGY SERVICES AN INTRODUCTION TO OUTLOOK WEB ACCESS (OWA) The Prince William County School Division does not discriminate in employment or in its educational programs and activities against
INFORMATION TECHNOLOGY SERVICES AN INTRODUCTION TO OUTLOOK WEB ACCESS (OWA) The Prince William County School Division does not discriminate in employment or in its educational programs and activities against
MicroStrategy Desktop
 MicroStrategy Desktop Quick Start Guide MicroStrategy Desktop is designed to enable business professionals like you to explore data, simply and without needing direct support from IT. 1 Import data from
ScholarOne Manuscripts. COGNOS Reports User Guide
 ScholarOne Manuscripts COGNOS Reports User Guide 1-May-2018 Clarivate Analytics ScholarOne Manuscripts COGNOS Reports User Guide Page i TABLE OF CONTENTS USE GET HELP NOW & FAQS... 1 SYSTEM REQUIREMENTS...
Working with Analytical Objects. Version: 16.0
 Working with Analytical Objects Version: 16.0 Copyright 2017 Intellicus Technologies This document and its content is copyrighted material of Intellicus Technologies. The content may not be copied or derived
Mobileworld Touring Driver Roadmap Explore Scoreboard from Multiple User Perspectives October 23, 2017
 Mobileworld Touring Driver Roadmap Explore Scoreboard from Multiple User Perspectives October 23, 2017 www.spiderstrategies.com Preface Welcome to the Touring Driver Test Drive and Roadmap! This document
DataPro Quick Start Guide
 DataPro Quick Start Guide Introduction The DataPro application provides the user with the ability to download and analyze data acquired using the ULTRA-LITE PRO range of Auto Meter products. Please see
ADMINISTRATIVE USER GUIDE FOR THE APTI-LEARN LEARNING MANAGEMENT SYSTEM (LMS)
") ADMINISTRATIVE USER GUIDE FOR THE APTI-LEARN LEARNING MANAGEMENT SYSTEM (LMS) Software Version 2.6 September 2012 Prepared by EM-Assist This page left intentionally blank. Software Version 2.6; Document
ADMINISTRATIVE USER GUIDE FOR THE APTI-LEARN LEARNING MANAGEMENT SYSTEM (LMS) Software Version 2.6 September 2012 Prepared by EM-Assist This page left intentionally blank. Software Version 2.6; Document
Excel 2013 Intermediate
 Excel 2013 Intermediate Quick Access Toolbar... 1 Customizing Excel... 2 Keyboard Shortcuts... 2 Navigating the Spreadsheet... 2 Status Bar... 3 Worksheets... 3 Group Column/Row Adjusments... 4 Hiding
econnect Baccarat User Guide EC7 June 2017
 econnect Baccarat User Guide EC7 June 2017 Table of Contents Baccarat Camera View A. Card Displayed on Virtual Table B. Bet Session Recording C. How to open a camera D. What is displayed on Data View E.
IBM Notes Client V9.0.1 Reference Guide
 IBM Notes Client V9.0.1 Reference Guide Revised 05/20/2016 1 Accessing the IBM Notes Client IBM Notes Client V9.0.1 Reference Guide From your desktop, double-click the IBM Notes icon. Logging in to the
User Manual. perfectionlearning.com/technical-support
 User Manual perfectionlearning.com/technical-support 1 User Manual Accessing Math X... 3 Login... 3 Forgotten Password... 3 Navigation Menu... 4 Logout... 4 Admin... 5 Creating Classes and Students...
Keynote 08 Basics Website:
 Website: http://etc.usf.edu/te/ Keynote is Apple's presentation application. Keynote is installed as part of the iwork suite, which also includes the word processing program Pages and the spreadsheet program
MultiSite Suite: General Ledger
 MultiSite Suite: General Ledger User s Manual version 2.2.97 Copyright & Trademarks Copyright Notice and Trademarks 2003 by Brent Lawrence, LLC. All rights reserved. Reprinted and edited by MultiSite Systems,
Monitoring and Evaluation Tool
 Monitoring and Evaluation Tool USER MANUAL March, 2014 www.menarid.icarda.org THIS PAGE LEFT EMPTY INTENTIONALLY USER MANUAL Definitions and abbreviations Chart... Graphical representation of M&E project
Outlook Quick Start Guide
 Getting Started Outlook 2013 Quick Start Guide File Tab: Click to access actions like Print, Save As, etc. Also to set Outlook Options. Quick Access Toolbar: Add your mostused tool buttons to this customizable
DOING MORE WITH EXCEL: MICROSOFT OFFICE 2013
 DOING MORE WITH EXCEL: MICROSOFT OFFICE 2013 GETTING STARTED PAGE 02 Prerequisites What You Will Learn MORE TASKS IN MICROSOFT EXCEL PAGE 03 Cutting, Copying, and Pasting Data Basic Formulas Filling Data
DecisionPoint For Excel
 DecisionPoint For Excel Getting Started Guide 2015 Antivia Group Ltd Notation used in this workbook Indicates where you need to click with your mouse Indicates a drag and drop path State >= N Indicates
Overview and Instructions
 AE Mobility Tracking Tool July 30, 2013 Overview and Instructions Sheet-specific Instructions Welcome Instructions Common Qs & As MobilityLog & Data Entry Reports: Graphs & Charts Data for Website Entry
Task Management User Guide
 Task Management User Guide Version 18 April 2018 Contents About This Guide... 5 Tasks Overview... 5 Create a Project for Task Management... 5 Project Templates Overview... 5 Add a Project Template...
INSERVICE. Version 5.5. InService Easily schedule and monitor attendance for your training programs, even at remote locations.
 INSERVICE Version 5.5 InService Easily schedule and monitor attendance for your training programs, even at remote locations. 5/15/2014 Page 0 of 11 Table of Contents 1.1 Logging In... 2 1.2 Navigation...
Administrative Training Mura CMS Version 5.6
 Administrative Training Mura CMS Version 5.6 Published: March 9, 2012 Table of Contents Mura CMS Overview! 6 Dashboard!... 6 Site Manager!... 6 Drafts!... 6 Components!... 6 Categories!... 6 Content Collections:
Login: Quick Guide for Qualtrics May 2018 Training:
 Qualtrics Basics Creating a New Qualtrics Account Note: Anyone with a Purdue career account can create a Qualtrics account. 1. In a Web browser, navigate to purdue.qualtrics.com. 2. Enter your Purdue Career
Ministry of Education
 Ministry of Education EFIS 2.0 - User Version 2.0 June 2015 Table of Contents 1 Document History... 4 2 Logon to EFIS 2.0... 5 2.1 Logon through Go Secure... 5 2.2 Bookmarking the Link... 6 3 Planning
Project and Portfolio Management Center
 Project and Portfolio Management Center Software Version: 9.42 Getting Started Go to HELP CENTER ONLINE http://admhelp.microfocus.com/ppm/ Document Release Date: September 2017 Software Release Date: September
Contents OVERVIEW... 3
 Contents OVERVIEW... 3 Feature Summary... 3 CONFIGURATION... 4 System Requirements... 4 ConnectWise Manage Configuration... 4 Configuration of Manage Login... 4 Configuration of GL Accounts... 5 Configuration
Help Contents Manual
 Help Contents Manual TimeClick 18 018 Last Updated: February 18 1 Table of Contents WHAT TO EXPECT WITH THIS MANUAL... 4 Resources Found on Website and Blog... 4 Contact Customer Support Team... 4 PREFERENCES...
Viewing Reports in Vista. Version: 7.3
 Viewing Reports in Vista Version: 7.3 Copyright 2015 Intellicus Technologies This document and its content is copyrighted material of Intellicus Technologies. The content may not be copied or derived from,
Scheduling Reports Launch the Scheduling Tool... 1 Description... 1 Overview of Scheduling Components... 2
 PeopleSoft Data Dictionary EPM: Scheduling Reports Table of Contents Scheduling Reports... 1 2 Launch the Scheduling Tool... 1 Description... 1 Overview of Scheduling Components... 2 Distribution... 2
Intellicus Enterprise Reporting and BI Platform
 Designing Adhoc Reports Intellicus Enterprise Reporting and BI Platform Intellicus Technologies info@intellicus.com www.intellicus.com Designing Adhoc Reports i Copyright 2012 Intellicus Technologies This
Introduction to 9.0. Introduction to 9.0. Getting Started Guide. Powering collaborative online communities.
 Introduction to 9.0 Introduction to 9.0 Getting Started Guide Powering collaborative online communities. TABLE OF CONTENTS About FirstClass...3 Connecting to your FirstClass server...3 FirstClass window
Ge#ng Started Guide New Users and Starter Edi/on
 Ge#ng Started Guide New Users and Starter Edi/on Goal Thank you for taking the time to use Viewpath as your project management solution. Our goal in providing this guide is to help streamline the process
New Finance Officer & Staff Training
 New Finance Officer & Staff Training Overview MUNIS includes many programs and tools to allow for the management of the District financials. As newer finance officers and staff, you are charged with understanding,
Pages are static content, generally linked in your navigation. They are used for things like your about page and contact page.
 North Star Marketing Client : The Guthrie Group Deliverable : Website Training +++ LOGGING IN AND OUT +++++++++ 1. Go to http://tgg.northstarmarketing.com/wp admin/. This is the address for the staging
EUROPEAN ORGANISATION FOR THE SAFETY OF AIR NAVIGATION
 EUROPEAN ORGANISATION FOR THE SAFETY OF AIR NAVIGATION E U R O C O N T R O L TOKAI USER MANUAL Edition: v2.7 DIRECTORATE NETWORK MANAGEMENT 1 Page TOKAI User Manual (Edition v2.7) EUROCONTROL TOKAI Application
Qualtrics Survey Software
 Qualtrics Survey Software GETTING STARTED WITH QUALTRICS Qualtrics Survey Software 0 Contents Qualtrics Survey Software... 2 Welcome to Qualtrics!... 2 Getting Started... 2 Creating a New Survey... 5 Homepage
EFIS User Guide Family Support Programs User
 Ministry of Education EFIS 2.0 - User Guide Family Support Programs User Version 2.0 June 2015 Table of Contents 1 Document History... 1 2 Logon to EFIS 2.0... 2 2.1 Logon through Go Secure... 2 2.2 Bookmarking
RL6 - WORKING WITH REPORTS
 RL6 - WORKING WITH REPORTS If you have RL6 Risk questions please contact: RL_support@wrha.mb.ca or (204) 926-1070 WRHA Quality Improvement & Patient Safety Version: 3.0, November 2, 2018 WORKING WITH REPORTS
USING PERFORMANCE PRO An Appraiser s Quickstart Guide. Hrperformancesolutions.net 9/2015 v. 3.4
 USING PERFORMANCE PRO An Appraiser s Quickstart Guide Hrperformancesolutions.net 9/2015 v. 3.4 Appraiser Quickstart Guide Employee appraisals can be completed easily and quickly. The steps outlined below
Administrator Quick Guide
 1 Administrator Quick Guide Login Screen The first page employees will see when visiting their training site is the login screen. This is where employees must enter their username and password to access
Expedient User Manual Getting Started
 Volume 1 Expedient User Manual Getting Started Gavin Millman & Associates Pty Ltd 281 Buckley Street Essendon VIC 3040 Phone 03 9331 3944 Web www.expedientsoftware.com.au Table of Contents Logging In...
Decatur City Schools
 Decatur City Schools Table of Contents Introduction...5 Objectives...5 Why GW web?...5 Log in options...5 The menu...7 Blue title bar...7 Navigation...7 Folder list...8 Buttons in the message pane...8
How to use the Sales Based Availability Dashboard
 How to use the Sales Based Availability Dashboard Supplier Guide Sept 2017 v1 1 Contents What is Sales Based Availability and why is it important?... 3 How is Sales Based Availability calculated and how
Getting Started The Outlook Web Access Window
 QUICK Source Microsoft Outlook Web Access in Exchange Server 2003 Getting Started The Outlook Web Access Window ❶ ❷ ❸ ❹ ❺ ❻ ❼ ❽ Using the Reading Pane The Reading Pane allows you to view your e-mail messages
Managing Your Website with Convert Community. My MU Health and My MU Health Nursing
 Managing Your Website with Convert Community My MU Health and My MU Health Nursing Managing Your Website with Convert Community LOGGING IN... 4 LOG IN TO CONVERT COMMUNITY... 4 LOG OFF CORRECTLY... 4 GETTING
Confluence User Training Guide
 Confluence User Training Guide Below is a short overview of wikis and Confluence and a basic user training guide for completing common tasks in Confluence. This document outlines the basic features that
Site Owners: Cascade Basics. May 2017
 Site Owners: Cascade Basics May 2017 Page 2 Logging In & Your Site Logging In Open a browser and enter the following URL (or click this link): http://mordac.itcs.northwestern.edu/ OR http://www.northwestern.edu/cms/
Figure 1.1 GENESIS Log In Page
 TEACHERVUE User Guide Chapter One OVERVIEW OF THE TEACHERVUE SOFTWARE The TEACHERVUE software, frequently abbreviated TXP and also known as Teacher Experience, provides districts with an easy method to
New Section. Delete Section Ignore. on. conversation. Deletee Deletes the folder. Respond Section Reply, message. Quick Steps Section.
 Outlook 2010 Mail Home Tab New Section Creating new mail messages, appointments, meetings, contacts, etc. Delete Section Ignore and Clean Up used when conversations are turned on. o Ignore allows you to
RITIS Training Module 9 Script
 RITIS Training Module 9 Script Welcome to the Regional Integrated Information System or RITIS Module 09 CBT. To begin, select the start button or press Shift+N on your keyboard. This training module will
GROUPWISE INSTRUCTIONS
 Viewing the GroupWise Home Desktop From the Folder List on the left-hand side of the screen, [Click] on the yourname HOME FOLDER The Home view provides panels of shortcut views which can be customized.
PowerPoint for Art History Presentations
 PowerPoint for Art History Presentations For PC computers running Microsoft Office 2007+ Adapted by The University of California, Berkeley from the Institute of Fine Arts document by Elizabeth S. Funk
Cougar Mountain Software Dashboards
 Cougar Mountain Software Dashboards Cougar Dtails User s Guide Copyright Notification At Cougar Mountain Software, Inc., we strive to produce high-quality software at reasonable prices. We can only do
EDITING AN EXISTING REPORT
 Report Writing in NMU Cognos Administrative Reporting 1 This guide assumes that you have had basic report writing training for Cognos. It is simple guide for the new upgrade. Basic usage of report running
Quick Start Guide - Contents. Opening Word Locating Big Lottery Fund Templates The Word 2013 Screen... 3
 Quick Start Guide - Contents Opening Word... 1 Locating Big Lottery Fund Templates... 2 The Word 2013 Screen... 3 Things You Might Be Looking For... 4 What s New On The Ribbon... 5 The Quick Access Toolbar...
SCHULICH MEDICINE & DENTISTRY Website Updates August 30, Administrative Web Editor Guide v6
 SCHULICH MEDICINE & DENTISTRY Website Updates August 30, 2012 Administrative Web Editor Guide v6 Table of Contents Chapter 1 Web Anatomy... 1 1.1 What You Need To Know First... 1 1.2 Anatomy of a Home
New website Training:
 New website Training: Table of Contents 1. Logging in and out of the new site. 2. Edit Content a. How to edit content b. Paragraph types c. Adding links d. Adding an image e. Adding a document f. Saving
The Basics. As of December 12, 2016
 The Basics As of December 12, 2016 Accessing REDCap 1. To access REDCap, enter the URL into your internet browser: https://redcap.wakehealth.edu/ 2. Login using your Medical Center ID and password 3. FAQ
Microsoft Excel 2007
 Learning computers is Show ezy Microsoft Excel 2007 301 Excel screen, toolbars, views, sheets, and uses for Excel 2005-8 Steve Slisar 2005-8 COPYRIGHT: The copyright for this publication is owned by Steve
you choose and by the roles the users are allowed to fulfill within the system. Finances Enter the monthly savings and costs for the project.
 Oracle Instantis EnterpriseTrack Quick Reference Guide for Release 8.5 Create a Proposal From the Top Navigation Bar, click Create Proposals/Charters. Enter all the required fields and click Save to save
Migrating SharePoint From 2007 to 2010
 Migrating SharePoint From 2007 to 2010 Presented By Scott Randall srandall@advancedlegal.com (888) 221 8821 Advanced Legal Systems, Inc. CREATING TECHNOLOGICAL CALM www.advancedlegal.com Table of Contents
MS Word MS Outlook Level 1
 MS Word 2007 MS Outlook 2013 Level 1 Table of Contents MS Outlook 2013... 1 Outlook 2013 Interface... 1 The Ribbon in Outlook 2013... 2 Sneak a Peek... 2 Pin a Peek... 3 Managing the Size of the Outlook
Customizing and Administering Project Server Access
 WEB Customizing and Administering Project Server Access In this chapter Creating and Deleting Users from Project Server 2 Managing User Groups Project Server User Security 4 Using Categories to Control
Specification Manager
 Enterprise Architect User Guide Series Specification Manager Author: Sparx Systems Date: 30/06/2017 Version: 1.0 CREATED WITH Table of Contents The Specification Manager 3 Specification Manager - Overview
PROFESSIONAL TUTORIAL. Trinity Innovations 2010 All Rights Reserved.
 PROFESSIONAL TUTORIAL Trinity Innovations 2010 All Rights Reserved www.3dissue.com PART ONE Converting PDFs into the correct JPEG format To create a new digital edition from a PDF we are going to use the
Tasks. User Guide 4.12
 Tasks User Guide 4.12 ABOUT NORTHWOODS CONSULTING PARTNERS Northwoods Consulting Partners, Inc., founded in 1999, is a privately-held software development and services company headquartered in Dublin,
USING PERFORMANCE PRO An Appraiser s Quickstart Guide. Hrperformancesolutions.net 4/2017 v. 3.9
 USING PERFORMANCE PRO An Appraiser s Quickstart Guide Hrperformancesolutions.net 4/2017 v. 3.9 Appraiser Quickstart Guide You have been asked to provide input on an appraisal as a primary appraiser. If
DOING MORE WITH EXCEL: MICROSOFT OFFICE 2010
 DOING MORE WITH EXCEL: MICROSOFT OFFICE 2010 GETTING STARTED PAGE 02 Prerequisites What You Will Learn MORE TASKS IN MICROSOFT EXCEL PAGE 03 Cutting, Copying, and Pasting Data Filling Data Across Columns
A new clients guide to: Activating a new Studio 3.0 Account Creating a Photo Album Starting a Project Submitting a Project Publishing Tips
 Getting Started With Heritage Makers A Guide to the Heritage Studio 3.0 Drag and Drop Publishing System presented by Heritage Makers A new clients guide to: Activating a new Studio 3.0 Account Creating
[ Getting Started with Analyzer, Interactive Reports, and Dashboards ] ]
![[ Getting Started with Analyzer, Interactive Reports, and Dashboards ] ]](/thumbs/88/117545107.jpg "[ Getting Started with Analyzer, Interactive Reports, and Dashboards ] ]") Version 5.3 [ Getting Started with Analyzer, Interactive Reports, and Dashboards ] ] https://help.pentaho.com/draft_content/version_5.3 1/30 Copyright Page This document supports Pentaho Business Analytics
Version 5.3 [ Getting Started with Analyzer, Interactive Reports, and Dashboards ] ] https://help.pentaho.com/draft_content/version_5.3 1/30 Copyright Page This document supports Pentaho Business Analytics
Numbers Basics Website:
 Website: http://etc.usf.edu/te/ Numbers is Apple's new spreadsheet application. It is installed as part of the iwork suite, which also includes the word processing program Pages and the presentation program
HTML REPORT VIEWER. Intellicus Enterprise Reporting and BI Platform. Intellicus Technologies
 HTML REPORT VIEWER Intellicus Enterprise Reporting and BI Platform Intellicus Technologies info@intellicus.com www.intellicus.com HTML Viewer i Copyright 2012 Intellicus Technologies This document and
EQUELLA. Searching User Guide. Version 6.4
 EQUELLA Searching User Guide Version 6.4 Document History Document No. Reviewed Finalised Published 1 19/05/2015 20/05/2015 20/05/2015 May 2015 edition. Information in this document may change without
GOOGLE APPS. If you have difficulty using this program, please contact IT Personnel by phone at
 : GOOGLE APPS Application: Usage: Program Link: Contact: is an electronic collaboration tool. As needed by any staff member http://www.google.com or http://drive.google.com If you have difficulty using
SPS Commerce Dashboards & Alerts User Guide
 SPS Commerce Dashboards & Alerts User Guide 1 Table of Contents Introduction... 3 Additional Resources... 3 Logging In... 4 Changing your password... 4 The Portal Homepage... 5 Administration... 5 My Reports...
Table of Contents. Page 2 of 72. High Impact 4.0 User Manual
 Table of Contents Introduction 5 Installing High Impact email 6 Installation Location 6 Select Mail Client 6 Create a ReadyShare Account 6 Create a Default Profile 6 Outlook Configuration Message 6 Complete
Outlook 2016 Guide. A Complete Overview for Connect Users
 Outlook 2016 Guide A Complete Overview for Connect Users Chapter 1: Introduction...8 Chapter 2: Getting Around Outlook...8 Quick Access Toolbar... 8 The Ribbon... 8 Backstage View... 9 Dialog Box Launcher...
Reporting - Dashboards
 Workshop: Reporting Dashboards Driving the ViewPoint Business Intelligence Module, Dashboards transforms your Pivots and Analytics Reports for quick access on-demand graphic visualization tools. Powered
BASIC NAVIGATION & VIEWS...
 Content Overview VISUAL TOUR... 5 NEW FEATURES IN OUTLOOK 2010... 6 BASIC NAVIGATION & VIEWS... 7 SETTING PREFERENCES... 7 Creating an Outlook Shortcut... 7 Choosing a Startup View... 7 CUSTOMIZING INBOX
Steps: 1. Log in to the Dmitri application through the following website URL, as appropriate:
 Dmitri Suite Getting Started Logging In and Logging Out Logging In Use the following steps to log in to the Dmitri application. Steps: 1. Log in to the Dmitri application through the following website
Bill Analyser User Guide
 Bill Analyser User Guide emobile.ie/business Contents 1.0 Basic Concepts... 3 1.1 Users and Roles... 3 Standard Users... 3 Global Users... 3 eircom User Roles... 3 Available user roles... 3 1.2 Data Structure...
Getting Around. Welcome Quest. My Fundraising Tools
 As a registered participant of this event, you have a variety of tools at your fingertips to help you reach your goals! Your fundraising center will be the hub for managing your involvement and fundraising
Portfolios Creating and Editing Portfolios... 38
 Portfolio Management User Guide 16 R1 March 2017 Contents Preface: Using Online Help... 25 Primavera Portfolio Management Overview... 27 Portfolio Management Software for Technology Leaders... 27 Solution
Microsoft Office Outlook 2010
 Starting Microsoft Outlook 2010 with XP Click on Start, E-mail Microsoft Outlook or Start, All Programs, Microsoft Office, Microsoft Outlook. Starting Microsoft Outlook 2010 with Windows 7 Click on the
Wordpress Training Manual
 The Dashboard... 2 If this is your first time logging in:... 2 How do I change my password or email address?... 3 Search Engine Optimization (SEO)... 4 SEO for Pages... 4 SEO for Images... 5 Managing Pages...
CompClass Solo User Guide for Instructors
 CompClass Solo User Guide for Instructors CompClass Solo User Guide for Instructors Table of Contents Overview... 1 Online Help... 1 System Requirements... 2 Adopting CompClass... 2 Student Access to CompClass...
To access BuckIQ, you must first be granted access. Send requests for permission to
 BuckIQ User s Guide Job Aid What is BuckIQ? Several years ago, Oracle took a look at the state of the Business Intelligence industry in terms of the different processes and applications that were required
EQUELLA Workflow Moderation Guide
 Helping put innovation into education EQUELLA Workflow Moderation Guide Version 6.5 MELBOURNE - CANBERRA - HOBART 1800 EDALEX - www. edalexsolutions.com ABN 56 611 448 394 Document History Date Change
1 Overview of GoPro.net What is GoPro.net? Accessing GoPro.net The User Interface GoPro Desktop...
 User Guide First edition (June 2015) This edition applies to version 2.8.7 build 20150501 of GoPro.net and to all subsequent releases and modifications until otherwise indicated in new editions. 2004-2015
Installation 3. PerTrac Reporting Studio Overview 4. The Report Design Window Overview 8. Designing the Report (an example) 13
 13") Contents Installation 3 PerTrac Reporting Studio Overview 4 The Report Design Window Overview 8 Designing the Report (an example) 13 PerTrac Reporting Studio Charts 14 Chart Editing/Formatting 17 PerTrac
Contents Installation 3 PerTrac Reporting Studio Overview 4 The Report Design Window Overview 8 Designing the Report (an example) 13 PerTrac Reporting Studio Charts 14 Chart Editing/Formatting 17 PerTrac
OBIEE. Oracle Business Intelligence Enterprise Edition. Rensselaer Business Intelligence Finance Author Training
 OBIEE Oracle Business Intelligence Enterprise Edition Rensselaer Business Intelligence Finance Author Training TABLE OF CONTENTS INTRODUCTION... 1 USER INTERFACE... 1 HOW TO LAUNCH OBIEE... 1 TERMINOLOGY...
Center for Faculty Development and Support. Google Docs Tutorial
 Center for Faculty Development and Support Google Docs Tutorial Table of Contents Overview... 3 Learning Objectives... 3 Access Google Drive... 3 Introduction... 4 Create a Google Document... 4 Upload
User Guide. Customer Self Service (CSS) Web Application Progress Software Corporation. All rights reserved.
 Web Application Progress Software Corporation. All rights reserved.") User Guide Customer Self Service (CSS) Web Application 1993-2017 Progress Software Corporation. Version 2.1 March 2017 Table of Contents Welcome... 3 Accessing the Customer Self Service (CSS) Web Application...
User Guide Customer Self Service (CSS) Web Application 1993-2017 Progress Software Corporation. Version 2.1 March 2017 Table of Contents Welcome... 3 Accessing the Customer Self Service (CSS) Web Application...
Getting started with Inspirometer A basic guide to managing feedback
 Getting started with Inspirometer A basic guide to managing feedback W elcome! Inspirometer is a new tool for gathering spontaneous feedback from our customers and colleagues in order that we can improve
vrealize Hyperic Monitoring and Management Guide vrealize Hyperic 5.8.4
 vrealize Hyperic Monitoring and Management Guide vrealize Hyperic 5.8.4 You can find the most up-to-date technical documentation on the VMware website at: https://docs.vmware.com/ If you have comments
Creating Interactive PDF Forms
 Creating Interactive PDF Forms Using Adobe Acrobat X Pro for the Mac University Information Technology Services Training, Outreach, Learning Technologies and Video Production Copyright 2012 KSU Department