vsignalyzer Product Information
|
|
|
- Constance Lee
- 6 years ago
- Views:
Transcription
1 Product Information
2 Table of Contents 1 Overview Introduction Overview of Advantages Application Areas System Requirements Functional Extension by Additional Options More Information Functions Visualizing and Manually Analyzing Measurement Data Extending the Analysis with Functions and Virtual Signals Automated Analysis of Measurement Data and Data Mining Scripts as a Simple Method for Automation Evaluating and Analyzing Multiple Measurement Files Generating Reports Supported Measurement File Formats Analyzing Logged Bus Communication Visualizing the Vehicle Position on a Map Application Areas Supported Map Materials System Requirements Functions Analysis of Data Recorded with Loggers Developing Driver Assistance Systems Engineering Services Training V2.1 5/2017 Valid for vsignalyzer from Version

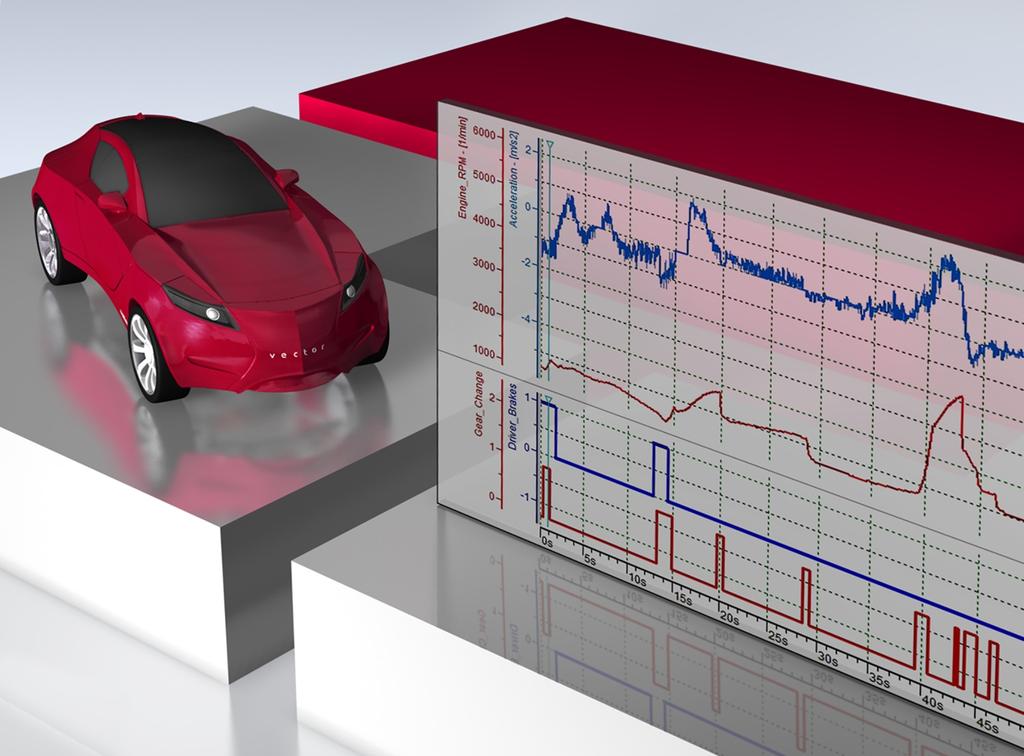
3 1 Overview 1.1 Introduction vsignalyzer is a convenient tool for efficient evaluation and analysis of all types of measurement data. It offers measurement engineers extensive options for data visualization, as well as functions for manual and automated analysis and report generation. Measurement data recorded during the acquisition of physical values, network development, analysis and ECU calibration may be read-in from various file formats. Extensive function libraries and integrated data mining functionality let you analyze your measurement data manually or automatically and conveniently display the data focusing on its most important aspects. Powerful printing and reporting tools are integrated for documenting the results. The range of standard features includes visualization of GPS data with various map materials. Option Driver Assistance extends vsignalyzer by adding a verification solution for driver assistance systems (ADAS). 1.2 Overview of Advantages > Convenient and individually adjustable display of logged measurement data > Efficient handling even with very large measurement files > Automated analysis of any amount of data based on specific criteria using data mining functions > Extensive mathematical function library for creating data analysis > Users can create their own functions in the function editor for customized extension of the analysis; MATLAB/Simulink models can also be linked. > Meaningful reports and documentation of analysis results Figure 1: Convenient display and analysis of measurement data with vsignalyzer 3
4 1.3 Application Areas vsignalyzer lets you focus on the measurement data that is relevant to you. You simply create panel interfaces on which you can control the flow of the analysis process and visualize your measurement results. Even complex analysis functions and data mining calculations can be started with just a few mouse clicks, and they can be run fully automatically. This also lets less experienced vsignalyzer users perform complex analysis. The high degree of automation even makes it very easy to analyze multiple measurement files which are very large overnight. vsignalyzer gives you a number of tools so that you can simply and quickly insert measurement results into your report or print them directly. The configurable print view gives users a preview of the document during analysis. Drag & drop functions simplify export to external tools such as Word or PowerPoint. Many different data formats from the areas of measurement technology, vehicle development and ECU development are supported. You can load multiple measurement files in parallel to compare them with one another, save measurement signals together in a new measurement file or simply extract the data and time ranges of interest to you and save them. vsignalyzer is also optimized to work in a quick and goal-oriented way, even with very large measurement files. vsignalyzer helps you to effectively analyze the individual measurement data generated by data loggers, measurement and calibration systems, test benches and analog measurement modules. The Driver Assistance extension supports you in the verification process for driver assistance systems (ADAS) and automated driving systems. 1.4 System Requirements > Windows 10/8.1/7 (32- and 64-bit versions): PC with at least 2.8 GHz, 2 GByte RAM and a graphics card with at least 128 MByte RAM 1.5 Functional Extension by Additional Options > Option Driver Assistance for object verification in driver assistance systems and optimization of image processing algorithms 1.6 More Information Various documents related to vsignalyzer are available online. In the demo version you get sample configurations for a number of application areas and a detailed online Help function, in which all vsignalyzer functions are described. Moreover, you can benefit from valuable know-how in the form of technical articles and application notes. You will find more information at the Vector Download-Center. 2 Functions vsignalyzer offers you all of the functions you need to view, compare and edit measurement data: > Visualize and analyze measurement data > Quickly analyze and evaluate large quantities of data by automated analysis > Reporting with PDF output and export to Office applications > Import and export of measurement files of all common formats > Analyze logged CAN, CAN FD, LIN, FlexRay and Ethernet bus communication > Time-synchronous display of sensor data as overlay objects on the video image with Option Driver Assistance > Time-synchronous display of measurement values and related vehicle position on a map > Team project management with the CANape measurement and calibration tool as well as measurement software vmeasure exp 4

5 3 Visualizing and Manually Analyzing Measurement Data In vsignalyzer, signals can be displayed with different scaling and physical meanings. For example, you might use mixed display of analog and digital signals in various sub-windows of the Graphic window to immediately compare switch states and the system reactions that result from them. Here, a zoom operation on the time axis produces uniform resolution of all sub-axes. vsignalyzer can display signals over the time axis or in an XY display over another signal. The global measurement cursor is an instrument you can use to compare the signal values of all display windows at the same time point. The measurement cursor is always positioned at the same time point in all display windows. In the Text, Trace and Multimedia windows as well, the relevant values or image sequences are displayed at the momentary position of the global measurement cursor. You can also synchronize the time axes in all windows and on all display pages. Moreover, a difference cursor, grid lines, various options for displaying the Y axis, labeling options, zoom functions and much more is available for quick and effective analysis. Color functions help users in analysis by overlaying additional information over the signal values, such as to highlight limit violations or to show two signals in one display. You can use drag & drop functionality to insert statistics columns in the windows for all measurement signals. Along with the name of the displayed signal, you have the option of showing additional columns in the legend, such as signal information or statistical values. For comparison purposes, you can visualize signals from multiple measurement files simultaneously. The displayed signals can be saved directly from the Graphic window to a new measurement file in any format. You can also individually configure the time range to be saved. Of course, you can also analyze statistical data measured by CANalyzer/CANoe such as bus load, message rates and error rates. The same window can be displayed on multiple display pages and at different positions on those pages. Windows can also be displayed outside of the vsignalyzer program window, so that they will be shown regardless of which display page is active. In the Data window, you can conveniently visualize all properties of the measurement parameters. This window also implements the display of structured signals. It is easy to select the signals to be displayed by dragging and dropping them from the Symbol Explorer. Along with the display of MDF meta-data such as the project, user name, etc. in the Symbol Explorer, you can also visualize signal properties to make it easier to select measurement data. The search function can be used over all measurement data. With the event-based signal comparison, you can compare signal characteristics at different points in time within one measurement very quickly and conveniently, for instance in order to detect outliers or deviations from the target behavior. You simply specify the time points with the signal value comment function or use trigger events or Data Mining hits. Figure 2: Comparison of a signal characteristics at different time points In order to compare signal characteristics from different measurements, you simply drag the measurement files in question into the Graphic window. The desired signals are displayed with coloring on a shared axis for multiple files. You can correct time differences between the individual files easily using the time offset function. 5

6 Figure 3: The spectrogram display in this example of an audio source lets you visualize the power spectrum of a signal The key functions in detail: > Import and export of different measurement file formats > Easy handling of measurement files, for example loading of multiple files, clear representation of the contained signals > Signal display over time or in XY representation > Manual analysis of signal responses by zoom, search function and cursor > Synchronous movement of measurement and difference cursors over all display windows > Envelope curve display in Graphic window shows the signal response with all outliers while also accelerating the loading process > Numerical, graphic and spectrogram displays of recorded characteristic curves and maps including the working point > Additional information can be superimposed over signal curves and characteristic maps by the use of color functions > Measurement data that was logged at different time intervals can be displayed together > Time-synchronous display of signal responses and video sequences > Comparison of signal characteristics within one measurement files or across multiple measurement files > Flexible configuration of the axes shown in the Graphic windows > Display of statistical parameters as a separate column in the display windows > User commenting of signal points and regions. The comments appear in the Graphic window and on the printout, and they are saved in the MDF file > Export of sequences from measurement files including synchronous video clip > Display of the data structure of measured ECU signals 6

7 4 Extending the Analysis with Functions and Virtual Signals In analyzing the measurement data, you can apply any analysis algorithms to your measurement data with functions existing in the library or functions you create yourself. These functions produce a virtual signal that is then available and can be displayed just like a real signal in the display window or be used as an input variable for other functions. To calculate the virtual signals, you can easily integrate functions and your input signals into the display windows by drag & drop from the Symbol Explorer to the windows. Indexed access to signal values of different sampling times can be used to implement filtering functions such as smoothed averaging. Intermediate results and/or status information can be output to the Write window, which simplifies the process of developing calculation functions for the virtual signals tremendously. The Function Editor is included, which gives you an extra working environment designed to make it easier to create your own functions. You can use this editor to create and compile the functions and add them to the library as necessary. CASL (Calculation and Scripting Language) is also included which simplifies access to individual signals and vsignalyzer functionalities; it is an easy to learn script language whose coding is similar to C coding. It also lets developers integrate their own C-Code or Simulink models. Besides the Function Editor, virtual measurement signals can also be generated by linking to MATLAB/Simulink models. A Graphical Editor is also provided which you can use to create simple functions with just a few mouse clicks. Figure 4: It is easy to create virtual functions with the Graphical Editor 5 Automated Analysis of Measurement Data and Data Mining When large volumes of data occur, as in vehicle development, it is often no longer possible to analyze data manually. Using powerful functions, scripts and data mining functionality, vsignalyzer enables efficient analysis of large amounts of measurement data as well. 5.1 Scripts as a Simple Method for Automation Scripts give you a quick method to automate work flows. Regardless of whether you just want to automatically reconfigure the Graphic window for new measurement files or automate entire test sequences, both of these are possible using scripts. In the Function Editor, you can create and compile the scripts quickly and easily, just as you can do with functions. Scripts are either executed manually, or they are coupled to specific events such as loading a new measurement file, starting or closing the project, etc. The Task Manager is a user interface you can use to manage and view the links of your scripts to events. You can define global variables that simplify working with functions and scripts. They may be used within functions and scripts. You can assign values to the variables in calibration windows or on panels in order to modify or adapt them. 7

.")
8 Figure 5: Creating functions and scripts quickly and conveniently. 5.2 Evaluating and Analyzing Multiple Measurement Files If you wish to extend an automated analysis to cover multiple measurement files, the data mining functionality is a method available to you for automated offline analysis of signals in a number of saved measurement files. In one search run, you can process multiple files (with structures that are as similar as possible, i.e. the same measurement signals). The same analysis algorithm is applied to all selected measurement files, and the results are shown in a list. All functions and scripts already used in vsignalyzer are available to you in data mining. You can view the analysis results either in the Data Mining dialog or in vsignalyzer s Symbol Explorer. All hits for the currently loaded measurement file are highlighted in color in the various vsignalyzer display windows. When you double-click a hit in the list, the measurement cursor moves to the associated position in the display window. If you select a hit that is not contained in the currently loaded measurement file, vsignalyzer automatically loads the corresponding measurement file to replace the original measurement file. Along with the hits for your search conditions, other information is available such as the search method used (this is important if your analysis contains multiple criteria), the measurement file and the configuration. Analysis that have already been performed can be repeated at any time, e.g. to analyze the effects on a modified measurement file directly. Figure 6: Direct links lead you right to the hits found in the measurement files. 8

9 Entire data mining sequences can be fully automated. You can set up your own panels on which you can conveniently control the sequential flow. This makes it possible for users who do not possess much specific know-how to analyze measurement files and create reports. A typical work flow includes the following steps: > Select the measurement files to be analyzed > Execute data mining over all of the measurement files > Evaluate the analysis results > Reporting Figure 7: User-definable panels simplify the analysis of measurement data. You can use an editor to easily create functions and scripts. The following functions are available for automated analysis: > Script-driven analysis of measurement files > Convenient search and analysis of large quantities of data with the data mining user interface > Extensive function library for standard analytics > You can easily formulate your own analytics using algebraic expressions in the Graphical Editor > Complex mathematical analysis via the integrated CASL function language, your own C/C++ based functions or with MATLAB/Simulink models > Display of data mining hits in graphic display windows > Automated export of analysis results in CSV and PDF formats > Execution of complex analysis via simple and understandable panels 9

10 6 Generating Reports The analysis and documentation of measurement data go hand-in-hand in vsignalyzer. You can have the display pages you created for analysis shown in the normal view or the print view. In the print view, all inserted analysis windows and display elements are shown with the difference that the display page now has the appearance of the printed page that will be printed later. You can use a header and footer to create a layout template for your company's corporate image, and you can use display elements such as text boxes, graphics and arrows to create reports with an impressive look. You can switch the display mode to either use the analysis pages you have already created for documentation or create your own individual print view pages. In the Print menu, you can quite simply select which pages you wish to use for the report. The results can be printed or saved as a PDF file. You can conveniently save individual analysis windows or entire display pages of a desktop as a JPG, PDF or PNG using drag & drop functionality, or you can copy them directly into a Word or PowerPoint file. Figure 8: Creating meaningful reports in the Print view An overview of key functions: > Use the Print Template Manager to create professional layouts > All paper formats are supported, including mixed formats within a report (portrait and landscape formats) > Switch between print view and normal view on the display pages > The page overview gives you a quick summary > Reports are easy to create by drag & drop > All display options for analysis are also available for reporting > Fully automated reporting of data mining results > Documentation of analysis with flexible layout of display elements > Text elements with predefined functions or user-specific script-driven macro functions > Export of reports in these formats: PDF or EMF, PNG, JPG, GIF, BMP > Drag & drop functionality lets you copy entire display pages or individual analysis windows to other Windows applications such as Microsoft Office with ease 10

11 Figure 9: Drag & drop functions let you copy to external tools such as PowerPoint, Word etc. with ease 7 Supported Measurement File Formats vsignalyzer makes it possible to work with measurement data in various file formats: > MDF-3.x, ASAM MDF-4.x, INCA DAT, XLS, XLSX, MATLAB MAT 7.3, HDF5 For formats that vsignalyzer cannot process directly, corresponding import converters are available. The conversion happens automatically when the file is loaded into vsignalyzer: > BLF, ASC, LOG, ASCII, ATF, CC3, CLF, CSV, GLX, GPX, KME, NMEA 0183, PCAP, TTL, XLG, XLX If further processing of measurement files in a different file format is necessary, vsignalyzer supports conversion of MDF files to a number of target formats: > ASCII, ATF, MATLAB (M/MAT), DIADEM, Excel 8 Analyzing Logged Bus Communication In the Trace window, you can have the logged CAN, CAN FD, LIN and FlexRay bus activities listed as well as messages and Error frames. If you associate a network database, for example, it is possible to show the individual signals of messages in decoded form and extract them directly from the Trace window to a Graphic window. The global measurement cursor synchronizes the Trace messages with all other measurement signals shown in vsignalyzer. When you click a message or signal in the Trace window, the global measurement cursor jumps directly to the relevant time point in all analysis windows. Drag & drop lets you quickly add measurement files to the Trace window from Windows Explorer or the Symbol Explorer in vsignalyzer. Various methods are available for analyzing the data in the Trace window: > Filters: The Trace window offers a number of filters. To reduce the volume of data, you can filter for a specific bus or for individual messages with block and pass filters. A filter may also be used for each column in a display. 11

12 > Predefined column displays: The Trace window can be quickly optimized for standard bus systems such as CAN, LIN, J1939 and FlexRay. It is also easy to add individual columns in the Trace window that contain more information. > Search: Messages/signals can be found based on search conditions. > Color highlighting of buses: The displayed buses are highlighted in different colors so that they can be readily distinguished from one another. > Show statistics: You can use different views to show details of the messages/signals, for example, including their values or to calculate differences between time stamps or signal values. Figure 10: Trace window with time synchronization via the global measurement cursor 12

13 9 Visualizing the Vehicle Position on a Map vsignalyzer lets you visualize logged GPS data on electronic maps. This simplifies the interpretation of logged measurement data significantly, because geographic conditions can be considered in the analysis. In the offline analysis, the measurement values are displayed synchronously in the GPS window together with the related vehicle position. Figure 11: Sample configuration with GPS window that shows the vehicle position 9.1 Application Areas The ability to synchronize measurement data with geographic positions during a test drive and to display the position on a map makes it much easier to track certain events. This supplemental information often leads to more reliable interpretation of the behavior of your ECU; one example is when upshifting is performed on a mountain. 9.2 Supported Map Materials The following map materials may be used: > OpenStreetMap (also permits offline use of previously downloaded map materials, very helpful for analyzing test drives without an Internet connection) > Shobunsha Super MappleG > You can integrate your own maps in the form of graphic files 9.3 System Requirements > Hard drive memory for offline map materials of Open StreetMap and Shobunsha 9.4 Functions Option GPS offers the following functionality: > Creating user configurable and scalable GPS display windows > Displaying vehicle position in the GPS window > Configurable display of route section driven so far 13
 > Degree of map detail changes as a function of zoom setting 10 Analysis of Data Recorded with Loggers When analyzing measurement data generated by")
14 > Visualize geographic and car-specific data in the various display windows simultaneously > Synchronization of the measurement cursor with the car s position on the map > Simultaneous display of multiple vehicles (as with Car2x/V2X communication) > Degree of map detail changes as a function of zoom setting 10 Analysis of Data Recorded with Loggers When analyzing measurement data generated by data loggers, e.g. from the Vector GL family, vsignalyzer is able to demonstrate its advantages. If the data is not already available in MDF format, vsignalyzer provides converters for many file formats, including BLF, ASC, LOG, CC3, CLF, GLX, TTL, XLG and XLX. Besides signal-oriented visualization, data analysis with high-performance automation is especially important for the large data volumes that are usually generated by data loggers. With Data Mining, vsignalyzer offers the ideal tool for this. Furthermore, a need for analysis of the bus messages recorded by loggers arises again and again. vsignalyzer displays them in the Trace window, synchronized with the signal characteristics in the Graphic window. Recorded environment data such as GPS position and video data are also visualized synchronously and simplify measurement data analysis for you. Instead of a continuous video stream, data loggers often record sequences of individual images in order to handle the available storage space as efficiently as possible. These sequences of individual images can also be displayed synchronously with vsignalyzer, of course. Voice comments recorded during the measurement often supply important insights for understanding a particular driving situation, and thus for analyzing the measurement data. These voice comments can be displayed in vsignalyzer in the Graphic window and played by double clicking them. You can hide irrelevant voice comments very easily in the Symbol Explorer so you can concentrate on what is essential. Figure 12: Start data analysis directly from the Vector Logger Configurator with the quick view function 14
 in a perspective view, and it is also visualized in a side view or bird s eye perspective.")
15 11 Developing Driver Assistance Systems Option Driver Assistance lets developers of driver assistance systems (ADAS) and systems for automated driving synchronously visualize logged sensor data in the Video window. Here the sensor data is superimposed on the video image as graphic objects (e.g. rectangles and lines) in a perspective view, and it is also visualized in a side view or bird s eye perspective. Based on the video image, you can verify the acquired data to objectively assess the reliability and operational safety of the system, regardless of whether it is a radar system such as ACC, lane detection or a parking assistant. In addition to overlaying the acquired data on the video image, the data can also be displayed true to position on a map. Online map materials are available from OpenStreetMap. Offline maps from OpenStreetMap and Shobunsha Super MappleG may also be used. Figure 13: Option Driver Assistance object verification for driver assistance systems and for optimizing image processing algorithms 12 Engineering Services Vector can assist you with know-how and complete solutions tailored to your tasks, so that you can concentrate fully on ECU development. Our services range from consultation work, including developing customer-specific analysis scripts, providing integration support or posting a Field Application Engineer at your business site. 13 Training In the framework of our training program, we offer training events for vsignalyzer in our seminar rooms as well as at the business sites of our customers. You will find for more information on training events and dates online at: 15
16 Get More Information Visit our website for: > News > Products > Demo software > Support > Training classes > Addresses
Option Driver Assistance. Product Information
 Product Information Table of Contents 1 Overview... 3 1.1 Introduction... 3 1.2 Features and Advantages... 3 1.3 Application Areas... 4 1.4 Further Information... 5 2 Functions... 5 3 Creating the Configuration
CANape. Product Information
 Product Information Table of Contents 1 Overview... 4 1.1 Introduction... 4 1.2 Overview of Advantages... 4 1.3 Application Areas... 5 1.4 Features... 5 1.5 System Requirements... 5 1.6 Supported Bus Interfaces
CANape. Product Information
 Product Information Table of Contents 1 Overview...4 1.1 Introduction...4 1.2 Overview of Advantages...4 1.3 Application Areas...5 1.4 Features...5 1.5 System Requirements...5 1.6 Supported Bus Interfaces
Measuring Everything. White Paper
 White Paper Table of Contents 1 Really Measuring Everything... 3 1.1 Measurement Concept in CANape... 5 1.2 Recorder PC Hardware... 6 2 Accessing Internal ECU Data... 6 2.1 Example: ECU... 9 2.2 Example:
CANape Option Bypassing
 Product Information Table of Contents 1 Overview... 3 1.1 Introduction... 3 1.2 Overview of Advantages... 3 1.3 Application Areas... 4 1.4 System Requirement... 4 1.5 Further Information... 4 2 Functions...
Tooling Overview ADAS - Status & Ongoing Developments
 Tooling Overview ADAS - Status & Ongoing Developments Vector India Conference 2017 V0.1 2017-07-04 ADAS solution - Efficient development of multisensor applications Contents of Vector ADAS solution algorithm
CANoe.Car2x. Product Information
 Product Information Table of Contents 1 Introduction... 3 1.1 Benefits at a Glance... 4 1.2 Application Areas... 4 1.3 Further Information... 6 2 Functions... 6 3 Hardware... 10 4 Training... 10 V1.5 02/2017
Golden Software, Inc.
 Golden Software, Inc. Only $299! The most sophisticated graphing package available, providing the professional quality you need with the flexibility you want. Create one of the more than 30 different graph
SYNCHRONOUS MULTIMEDIA AND VEHICLE DATA
 ViCANdo is an easy to use ADAS systems test and simulation environment that includes Ethernet, FlexRay, CAN, LIN, MOST as communication busses, as well as Video and sound analysis built for daily use for
MDA V8.1 What s New Functionality Overview
 1 Basic Concepts of MDA V8.1 Version General Notes Ribbon Configuration File Explorer Export Measure Data Signal Explorer Instrument Box Instrument and Time Slider Oscilloscope Table Configuration Manager
vcdmstudio Product Information
 Product Information Table of Contents 1 Overview... 3 1.1 Introduction... 3 1.2 Overview of Advantages... 4 1.3 Application Areas... 5 1.4 System Requirements... 5 2 Functions... 5 3 Supported File Formats...
CANoe 6.0. The Professional Development and Test Tool for CAN, LIN, MOST, FlexRay and J1587 TOOLS FOR NETWORKS AND DISTRIBUTED SYSTEMS
 CANoe 6.0 The Professional Development and Test Tool for CAN, LIN, MOST, FlexRay and J1587 CANoe is an all-round tool for the development, testing and analysis of networks and ECUs. It supports the user
CANape. Version History
 CANape Version History Table of Contents 1 Introduction... 4 2 CANape 16.0... 5 2.1 CANape 16.0 SP1... 5 2.2 CANape 16.0 SP2... 5 2.3 CANape 16.0 SP3... 7 2.4 CANape 16.0 SP4... 9 2.5 CANape 16.0 SP5...
CANalyzer.MOST. Product Information
 Product Information Table of Contents 1 Introduction to CANalyzer.MOST... 3 2 Interactive Analyses and Tests... 4 2.1 Analysis... 4 2.2 Stimulation... 8 3 Automated Analyses and Stimulation... 10 4 Other
Engineering Data Management (EDM) Software
 Software") Engineering Data Management (EDM) Software Engineering Data Management (EDM) is an integrated suite of software tools from Crystal Instruments for data management and post processing. It features a single
Engineering Data Management (EDM) Software Engineering Data Management (EDM) is an integrated suite of software tools from Crystal Instruments for data management and post processing. It features a single
Microsoft Excel 2007 Creating a XY Scatter Chart
 Microsoft Excel 2007 Creating a XY Scatter Chart Introduction This document will walk you through the process of creating a XY Scatter Chart using Microsoft Excel 2007 and using the available Excel features
testo Comfort Software Professional 4 Instruction manual
 testo Comfort Software Professional 4 Instruction manual 2 1 Contents 1 Contents 1 Contents... 3 2 About this document... 5 3 Specifications... 6 3.1. Use... 6 3.2. System requirements... 6 4 First steps...
DynoWare. Electronics & Software. Software for Data Acquisition and Evaluation. Type 2825A...
 Electronics & Software DynoWare Software for Data Acquisition and Evaluation 2825A... Kistler DynoWare is a universal and easy to use software, which is particularly suitable for force measurements with
Design Verification and Calibration Based on Physical Measurements for Electrical Vehicles
 for Electrical Vehicles Dr Jürgen Braunstein, CSM Jason Mistry, Vector GB < Innovative Measurement and Data Technology CSM Background Founded in 1983 next to Stuttgart, Germany R&D and production of state
Testing and Diagnostics
 Scope 3 Overview in real-time Signal analytics and diagnostics directly with the controller In the initial project design and also for commissioning or troubleshooting, transparent information concerning
News about ECU-TEST 7.0
 News about ECU-TEST 7.0 News about ECU-TEST 7.0 Dresden, 3 News about ECU-TEST 7.0 ECU-TEST: The Application ECU-TEST as 64-Bit-Solution Full-featured PDU-based bus access New test management connectors
MicroStrategy Desktop
 MicroStrategy Desktop Quick Start Guide MicroStrategy Desktop is designed to enable business professionals like you to explore data, simply and without needing direct support from IT. 1 Import data from
41126 Cognento (MODENA) Italy Via Bottego 33/A Tel: +39-(0) Internet: Fax: +39-(0)
 Italy Via Bottego 33/A Tel: +39-(0) Internet: Fax: +39-(0)") QUICK ANALYZER User Guide Version 5.3 Index 1.0 Generality... 2 LICENSE AGREEMENT... 3 2.0 Channels Configuration... 4 2.1 IdroScan Data Log Management... 6 3.0 Test Results... 9 4.0 Excel Export... 10
QUICK ANALYZER User Guide Version 5.3 Index 1.0 Generality... 2 LICENSE AGREEMENT... 3 2.0 Channels Configuration... 4 2.1 IdroScan Data Log Management... 6 3.0 Test Results... 9 4.0 Excel Export... 10
CANoe.AFDX. Product Information
 Product Information Table of Contents 1 Introduction... 3 1.1 Overview of Advantages... 3 1.2 Application Areas... 3 1.3 Further Information... 3 2 Hardware Interfaces... 4 3 Symbolic Display via Databases...
MDA V8.2 User's Guide
 MDA V8.2 User's Guide Copyright The data in this document may not be altered or amended without special notification from ETAS GmbH. ETAS GmbH undertakes no further obligation in relation to this document.
testo Comfort Software Professional 4
 99 Washington Street Melrose, MA 02176 Phone 781-665-1400 Toll Free 1-800-517-8431 Visit us at www.testequipmentdepot.com testo Comfort Software Professional 4 Instruction manual 1 Contents 1 Contents
imc STUDIO measurement data analysis visualization automation Integrated software for the entire testing process imc productive testing
 imc STUDIO measurement data analysis visualization automation Integrated software for the entire testing process imc productive testing www.imc-studio.com imc STUDIO at a glance The intuitive software
CANalyzer.AFDX. Product Information
 Product Information Table of Contents 1 Introduction... 3 1.1 Overview of Advantages... 3 1.2 Application Areas... 3 1.3 Further Information... 3 2 Hardware Interfaces... 4 3 Symbolic Display via Databases...
testo Comfort Software Professional 4 Instruction manual
 testo Comfort Software Professional 4 Instruction manual 2 1 Contents 1 Contents 1 Contents...3 2 About this document...5 3 Specifications...6 3.1. Use...6 3.2. System requirements...6 4 First steps...7
DASYLab Techniques. Usage- Chart Recorder, Y/t Chart, X/Y Chart. Using Cursors in the Display Modules
 DASYLab Techniques Using Cursors in the Display Modules Updated to include DASYLab 2016 features The DASYLab graphical display modules render the data into a graphical chart display in the following DASYLab
MDA 8 preview SP3 What s New Functionality Overview
 1 Basic Concepts of MDA 8 preview SP3 Version General Notes Ribbon File Explorer Signal Explorer Configuration Instrument and Time Slider Oscilloscope Instrument Box Configuration Manager Layer Preview
Vector vmdm TechLunch, October 24 th 2018, Novi Mi
 Vector vmdm TechLunch, October 24 th 2018, Novi Mi Measurement Data Visualization, Analysis and Reporting V1.0 2018-02-09 vmdm Solution Overview Motivation for a Measurement Data Management System vmdm
Kulite DAQ. Data Acquisition Software User s Manual. Version 3.2.0
 Kulite DAQ Data Acquisition Software User s Manual Version 3.2.0 Table of Contents Kulite DAQ Overview... 3 Main Window... 4 1. Menu bar... 4 2. Interface selection... 5 3. Found devices... 5 4. Sorting...
High Speed Measurement For ADAS And Fast Analysis
 High Speed Measurement For ADAS And Fast Analysis How to read that much data Measurement and Calibration User Day November 13 th 2018 V1.1 2018-11-09 ADAS Logging ADAS Logging Hardware and Software ADAS
EKKO_Project POWERFUL, INTUITIVE GPR DATA DISPLAY, ANALYSIS & REPORTING SOFTWARE
 TM EKKO_Project POWERFUL, INTUITIVE GPR DATA DISPLAY, ANALYSIS & REPORTING SOFTWARE EKKO_Project From field to finished report Once the Ground Penetrating Radar (GPR) data collection in the field is complete,
Project Guide - Time location with PLANER ET PROFESSIONAL 2011
 Project Guide - Time location with PLANER ET PROFESSIONAL 2011 Description This Guide summarizes operational way, the steps and most important functions to carry out a complete cycle of management of programming
Overview DT Measure Foundry is a drag-anddrop test and measurement application builder designed to give you top performance
 DT Measure Foundry DT Measure Foundry 3.0 Test and Measurement Application Builder Software Key Features Easy-to-use, affordable measurement software. New approach to measurement no programming, no wiring:
Multi-sheet Workbooks for Scientists and Engineers
 Origin 8 includes a suite of features that cater to the needs of scientists and engineers alike. Multi-sheet workbooks, publication-quality graphics, and standardized analysis tools provide a tightly integrated
EKKO_Project POWERFUL, INTUITIVE GPR DATA DISPLAY, ANALYSIS & REPORTING SOFTWARE
 EKKO_Project TM POWERFUL, INTUITIVE GPR DATA DISPLAY, ANALYSIS & REPORTING SOFTWARE EKKO_Project From field to finished report Once the Ground Penetrating Radar (GPR) data collection in the field is complete,
Reference Services Division Presents. Microsoft Word 2
 Reference Services Division Presents Microsoft Word 2 Welcome to Word 2. This handout includes step-by-step instructions for each of the tasks we will be covering in class. Changes to Word 2007 There are
CANalyzer. Product Information
 Product Information Table of Contents 1 Introduction to CANalyzer... 4 1.1 Features and Advantages... 4 1.2 Application Areas... 5 1.3 Bus Systems and Protocols... 5 1.4 CANalyzer Variants... 5 1.5 System
CANalyzer.J1939. Product Information
 Product Information Table of Contents 1 Introduction... 3 1.1 Application Areas... 3 1.2 Features and Advantages... 3 1.3 Further Information... 3 2 Functions... 4 3 Hardware Interfaces... 4 4 Transport
Release Presentation. ASAM Common MDF Version Measurement Data Format. Release Date: 2014 / 06 / 11
 Release Presentation ASAM Common MDF Version 4.1.1 Measurement Data Format Release Date: 2014 / 06 / 11 Agenda Introduction Key Concepts History ASAM Working Group Deliverables What's new in MDF 4.1.1
MDA V7.2 Getting Started
 MDA V7.2 Getting Started Copyright The data in this document may not be altered or amended without special notification from ETAS GmbH. ETAS GmbH undertakes no further obligation in relation to this document.
MDA V8.2.x What s New Functional Enhancements & Usability Improvements (V8.2.0 V8.2.2)
") Functional Enhancements & Usability Improvements (V8.2.0 V8.2.2) 1 Functional Enhancements & Usability Improvements (V8.2.0 V8.2.2) Overview Functional Enhancements Files, Formats and Data Types Usability
Functional Enhancements & Usability Improvements (V8.2.0 V8.2.2) 1 Functional Enhancements & Usability Improvements (V8.2.0 V8.2.2) Overview Functional Enhancements Files, Formats and Data Types Usability
CANoe/CANalyzer.J1587
 Product Information Table of Contents 1 Introduction... 3 1.1 Application Areas... 3 1.2 Features and Advantages... 3 1.3 Further Information... 3 2 Functions... 4 3 Hardware Interfaces... 4 4 Protocol-specific
Juniata County, Pennsylvania
 GIS Parcel Viewer Web Mapping Application Functional Documentation June 21, 2017 Juniata County, Pennsylvania Presented by www.worldviewsolutions.com (804) 767-1870 (phone) (804) 545-0792 (fax) 115 South
DCS-100A. Dynamic Data Acquisition Software SOFTWARE. Monitors measurement data with various graphs and numerical windows. Acquires data efficiently.
 4-3 DCS-100A Dynamic Data Acquisition Software SOFTWARE Software Monitors measurement data with various graphs and numerical windows. Acquires data efficiently. The basic operation does not depend on the
MDF4 Lib. Product Information
 Product Information Table of Contents 1 Overview...3 1.1 Introduction...3 1.2 Application Areas...3 1.3 Overview of Advantages...3 2 Features and Advantages...4 2.1 Supported MDF Versions...4 3 Functional
CANoe.J1939. Product Information
 Product Information Table of Contents 1 Introduction... 3 1.1 Application Areas... 3 1.2 Features and Advantages... 3 1.3 Further Information... 3 2 Functions... 4 3 Hardware Interfaces... 4 4 Transport
Using the reporting function
 11/17 ArtemiS SUITE 1 provides a very versatile reporting functionality, which makes it easy for you to present your analysis results in clearly arranged reports. This describes the first steps with this
SyncFirst Standard. Quick Start Guide User Guide Step-By-Step Guide
 SyncFirst Standard Quick Start Guide Step-By-Step Guide How to Use This Manual This manual contains the complete documentation set for the SyncFirst system. The SyncFirst documentation set consists of
Characterizing Methane Concentrations in a Mine using NI LabVIEW
 Characterizing Methane Concentrations in a Mine using NI LabVIEW By Ben Rayner Senior Architect Data Science Automation, Inc. USA Category: Test and Measurement Products Used: NI LabVIEW 2009 LVOOP NI
MicroStrategy Analytics Desktop
 MicroStrategy Analytics Desktop Quick Start Guide MicroStrategy Analytics Desktop is designed to enable business professionals like you to explore data, simply and without needing direct support from IT.
Getting Started with DADiSP
 Section 1: Welcome to DADiSP Getting Started with DADiSP This guide is designed to introduce you to the DADiSP environment. It gives you the opportunity to build and manipulate your own sample Worksheets
IPEmotion Release News 2017 R3
 IPEmotion Release News 2017 R3 November 2017 20.11.2017 IPEmotion 2017 R3 General changes Table of contents 1 IPEmotion 2017 R3 General changes... 3 1.1 PlugIns included in the Setup... 3 1.2 Supported
Reference Services Division Presents. Microsoft Word 2
 Reference Services Division Presents Microsoft Word 2 This handout covers the latest Microsoft Word 2010. This handout includes instructions for the tasks we will be covering in class. Basic Tasks Review
Discover the Depths of Your Data!
 www.goldensoftware.cz Discover the Depths of Your Data! Golden Software Presents Powerful and Innovative Well Log and Borehole Plotting for Geoscientists Golden Software, Inc. From the developers of Surfer
Ovation Process Historian
 Ovation Process Historian Features Designed to meet the needs of precision, performance, scalability and historical data management for the Ovation control system Collects historical data of Ovation process
TraceFinder Analysis Quick Reference Guide
 TraceFinder Analysis Quick Reference Guide This quick reference guide describes the Analysis mode tasks assigned to the Technician role in Thermo TraceFinder analytical software. For detailed descriptions
For the SIA Features of GigaView. Introduction. Initial Dialog Bar
 For the SIA-3000 Features of GigaView One button solution for multiple DataCom compliant standards jitter testing. Comprehensive and versatile jitter analysis software enables users to quickly understand
Enhance data presentation with summation plots to add additional information to your graph.
 Only $349! Exciting New Features... Display your data as a colorful and informative new stiff diagram! Create the graph you want! Add colors and widths for bar charts directly from the worksheet! Enhance
Data Acquisition with CP-2002/2003 Micro-GC Control
 Varian Analytical Instruments 2700 Mitchell Drive Walnut Creek, CA 94598 Star Chromatography Workstation Version 6 Data Acquisition with CP-2002/2003 Micro-GC Control Operation Manual Varian, Inc. 2002
Table of contents SiusBTS... 3 General...4 Initialization view... 5 Configuration view...6 Exercise view... 8 Main menu File...
 SiusBTS User guide Table of contents SiusBTS... 3 General...4 Initialization view... 5 Configuration view...6 Exercise view... 8 Main menu... 11 File...12 Report designer... 13 View...14 User data editor...15
Extract Features. 2-D and 3-D Analysis. Markerless Tracking. Create Data Reports
 Extract Features 2-D and 3-D Analysis Markerless Tracking Create Data Reports Extract ProAnalyst provides motion analysis tools that can be applied to any video or image sequence, regardless of content
Quick. Efficient. Versatile. Graphing Software for Scientists and Engineers.
 Quick. GrapherTM 3 Efficient. Versatile. Graphing Discover the easy-to-use and powerful capabilities of Grapher 3! Your graphs are too important not to use the most superior graphing program available.
> Acoustical feedback in the form of a beep with increasing urgency with decreasing distance to an obstacle
 PARKING ASSIST TESTING THE MEASURABLE DIFFERENCE. > Creation of complex 2-dimensional objects > Online distance calculations between moving and stationary objects > Creation of Automatic Points of Interest
Introduction.
 Product information Image Systems AB Main office: Ågatan 40, SE-582 22 Linköping Phone +46 13 200 100, fax +46 13 200 150 info@imagesystems.se, Introduction TEMA Automotive is the world leading system
GL500A Application Manual
 GL500A Application Manual Main Functions A Variety of Waveform Displays Y-T, X-Y, and FFT waveforms can be displayed on large, easy-to-read screens. Dual-screen Event and Current Data Replay Current data
ArtemiS SUITE diagram
 Intuitive, interactive graphical display of two- or three-dimensional data sets HEARING IS A FASCINATING SENSATION ArtemiS SUITE Motivation The diagram displays your analysis results in the form of graphical
Intermediate/Advanced. Faculty Development Workshop FSE Faculty retreat April 18, 2012
 Intermediate/Advanced Faculty Development Workshop FSE Faculty retreat April 18, 2012 Remote Desktop Sharing Quick Reference Guide for Moderators The Moderator or a Participant may request control of another
Flash Bootloader. Product Information
 Product Information Table of Contents 1 Flash Memory Programming... 3 2 Flash Bootloader - ECU programming via CAN, LIN, FlexRay, MOST and Ethernet... 3 2.1 Overview of Advantages... 3 2.2 Application
MicroStrategy Desktop Quick Start Guide
 MicroStrategy Desktop Quick Start Guide Version: 10.4 10.4, December 2017 Copyright 2017 by MicroStrategy Incorporated. All rights reserved. Trademark Information The following are either trademarks or
3D Surface Plots with Groups
 Chapter 942 3D Surface Plots with Groups Introduction In PASS, it is easy to study power and sample size calculations for a range of possible parameter values. When at least 3 input parameters vary, you
What s New in MATLAB and Simulink Young Joon Lee Principal Application Engineer
 What s New in MATLAB Simulink Young Joon Lee Principal Application Engineer 2016 The MathWorks, Inc. 1 Engineers scientists 2 Engineers scientists Develop algorithms Analyze data write MATLAB code. 3 Engineers
Automatic Reporting. Real-Time and Wireless Recording and Alarming
 Automatic Reporting The software's Automatic Report Generator offers the ability to combine and analyze data from multiple loggers into a single report. The delta,minimum, and maximum statistics can be
The Figure module. Use Figure to manipulate, edit and plot figure and phase diagrams already calculated by FactSage.
 Table of contents Section 1 Section 2 Section 3 Section 4 Section 5 Section 6 Section 7 Section 8 Section 9 Section 10 Section 11 Section 12 Section 13 Section 14 The module Use to manipulate, edit and
PROFESSIONAL TUTORIAL. Trinity Innovations 2010 All Rights Reserved.
 PROFESSIONAL TUTORIAL Trinity Innovations 2010 All Rights Reserved www.3dissue.com PART ONE Converting PDFs into the correct JPEG format To create a new digital edition from a PDF we are going to use the
What s New in MATLAB and Simulink
 What s New in MATLAB Simulink Fabrizio Sara 2015 The MathWorks, Inc. 1 Engineers scientists 2 Engineers scientists Develop algorithms Analyze data write MATLAB code. 3 Engineers scientists deploy algorithms
NextView 4 Software for Data Acquisition and Analysis
 Software for Data Acquisition and Analysis Visualize. Configure. Scan. Analyze. One software for everything. NextView 4 covers the entire world of PC measurement data acquisition: displaying live data,
Extract, Analyze, and Report Motion from Video
 Extract, Analyze, and Report Motion from Video Extract ProAnalyst provides motion analysis tools that can be applied to any video or image sequence, regardless of content or acquisition method. With ProAnalyst,
New Features. Importing Resources
 CyberLink StreamAuthor 4 is a powerful tool for creating compelling media-rich presentations using video, audio, PowerPoint slides, and other supplementary documents. It allows users to capture live videos
DATA MANAGEMENT SOFTWARE SUITE HANDS ON
 DATA MANAGEMENT SOFTWARE SUITE HANDS ON 2018 Content 1 How to Set Up a Preprocessing Routine... 2 1.1 Data Preprocessor Configuration for TDMS Files... 2 1.1.1 Data Preprocessor Operation... 2 1.2 Using
Impress Guide Chapter 11 Setting Up and Customizing Impress
 Impress Guide Chapter 11 Setting Up and Customizing Impress This PDF is designed to be read onscreen, two pages at a time. If you want to print a copy, your PDF viewer should have an option for printing
Manual. empower charts 6.4
 Manual empower charts 6.4 Contents 1 Introduction... 1 2 Installation, updates and troubleshooting... 1 2.1 System requirements... 1 2.2 Initial installation... 1 2.3 Installation of an update... 1 2.4
Solutions for. Avionics Networking. CANoe.CANaero. CANalyzer.CANaero ENGLISH
 Solutions for Avionics Networking CANoe.CANaero ENGLISH CANalyzer.CANaero CANalyzer.CANaero 7.6 Universal Analysis Tool for CAN-based Avionics Networks Overview of Advantages Easy observation of data traffic
MDA V8.3.0 What s New. Functional Enhancements & Usability Improvements
 MDA V8.3.0 What s New Functional Enhancements & Usability Improvements Functional Enhancements & Usability Improvements (MDA V8.3.0) Functional Enhancements Files, Formats and Data Types Usability Improvements
SYSMA Vehicle Tuning and Configuration Tool
 SYSMA Vehicle Tuning and Configuration Tool 1 SYSMA is the new Magneti Marelli integrated tool designed for configuring and tuning vehicle control systems for the most advanced levels of motorsport. SYSMA
USB Instruments EasyLogger for PS40M10 "Swordfish" Help
 USB Instruments EasyLogger for PS40M10 "Swordfish" Help I EasyLogger for PS40M10 Help Table of Contents Part I Introduction 3 1 Welcome to... EasyLogger for PS40M10 3 2 EasyLogger... Features 4 Part II
Concept Manual vteststudio. Version 2.2 English
 Concept Manual vteststudio Version 2.2 English Imprint Vector Informatik GmbH Ingersheimer Straße 24 D-70499 Stuttgart The information and data given in this user manual can be changed without prior notice.
Reporting and Printing Guide
 Enterprise Studio Reporting and Printing Guide 2017-03-17 Applies to: Enterprise Studio 2.3 and Team Server 2.3 Table of contents 1 About reporting and printing models 4 2 Reporting models to HTML and
Index. v1.02
 Index 1 Introduction... 2 2 Installation... 3 3 Work with ecuedit...4 3.1 Main window of the program...4 3.1.1 File menu functions...4 3.1.2 Edit menu functions...4 3.1.3 Tools menu functions...4 3.1.4
SCREEN RECORDER KD-Series TYPE
 SCREEN RECORDER KD-Series TYPE USER S MANUAL FOR KD ARCHIVE v.2.1 PROGRAM CONTENTS 1 INTRODUCTION... 3 2 PROGRAM INSTALLATION... 3 3 USING THE APPLICATION... 5 3.1 Main application window view without
Drulo Control Operating Instructions. Version and higher
 Drulo Control Operating Instructions Version 1.0.1.2 and higher Contents Operating Instructions Drulo Control... 1 Version 1.0.1.2 and higher... 1 Contents... 2 List of illustrations... 4 Contact details...
AEMLog Users Guide. Version 1.01
 AEMLog Users Guide Version 1.01 INTRODUCTION...2 DOCUMENTATION...2 INSTALLING AEMLOG...4 AEMLOG QUICK REFERENCE...5 THE MAIN GRAPH SCREEN...5 MENU COMMANDS...6 File Menu...6 Graph Menu...7 Analysis Menu...8
Tutorial for Lane County Mapping Applications
 Tutorial for Lane County Mapping Applications Contents Overview... 2 Tools... 2 Navigation Tools... 3 Display Tools... 5 Information Tools... 6 Sharing Tools... 7 Common Tasks... 9 Identify or Show Data
HD32MTLogger Software Manual for the instrument HD32MT.1 Introduction
 HD32MTLogger Software Manual for the instrument HD32MT.1 Introduction WARNING: The software must always be run as administrator! The HD32MTLogger program allows management of the HD32MT.1 datalogger from
What s New in MATLAB and Simulink The MathWorks, Inc. 1
 What s New in MATLAB Simulink 2015 The MathWorks, Inc. 1 Engineers scientists 2 Engineers scientists Develop algorithms Analyze data write MATLAB code. 3 Engineers scientists deploy algorithms applications
What s New in MATLAB and Simulink
 What s New in MATLAB Simulink Selmane Sekkai - Cynthia Cudicini Application Engineering selmane.sekkai@mathworks.fr - cynthia.cudicini@mathworks.fr 1 Analysis Visualization Modeling Simulation Testing
Collaborate in Qlik Sense. Qlik Sense February 2018 Copyright QlikTech International AB. All rights reserved.
 Collaborate in Qlik Sense Qlik Sense February 2018 Copyright 1993-2018 QlikTech International AB. All rights reserved. Copyright 1993-2018 QlikTech International AB. All rights reserved. Qlik, QlikTech,