Advanced Excel Charts : Tables : Pivots
|
|
|
- Bathsheba Gardner
- 5 years ago
- Views:
Transcription

1 Advanced Excel Charts : Tables : Pivots Protecting Your Tables/Cells Protecting your cells/tables is a good idea if multiple people have access to your computer or if you want others to be able to look at your worksheets. Choose the Review Ribbon and you will then see the Protection options. You will notice that in the Review tab on the Ribbon, you have three options to protect your worksheet or workbook. If you select: Protect Sheet: Protect entire sheet Protect Workbook: Protect an entire Excel workbook Allow Users to Edit Ranges: Protects certain cells The protect feature in effect changes your Excel worksheet(s) or cells into a read-only format. When protecting your data, you will need to create a password to unprotect your information. 1

2 Creating a Table Transforming information from simple data into a table in Excel is a nice way to organize, sort, and filter large quantities of data. You can always create a table from scratch, but what if you inherit data from someone else? Open the Table worksheet and click on cell A3. Select Insert -> Table. Excel will automatically select the table data. 2


3 Make sure you put a check mark in the My Table Has Headers box. This is referencing the headers in the table: Executive Office, Company, Region, etc. Click OK 3

4 You will now notice that each column has a filter drop down box. Use these filters to sort and filter information by column. You can filter out information you don t need right away. For this example, let assume you only need profits for the Midwest region: Click the filter next to Region -> click Select All -> Click Midwest ->OK 4


5 You can clear a filter by selecting the column heading, then Clear from the Sort & Filter section of the Data ribbon; or, you can click the column heading drop-down arrow and select the option to clear the filter. 5

6 Table Design You can change the default design of the table. Go to Design Tab and choose a design from the Gallery Design Tab in the Ribbon 1. Table Name Change the name of the table to reference back to when using in a function/formula. You saw how this works back in the Vlookup function. 2. Tools: a. Summarize with Pivot Table transform your table into a pivot table. (more on this later) 6


7 b. Remove Duplicate Remove duplicates by column. Highlight column A, and click Remove Duplicate. Notice you will get a list all columns. Remove all checkmarks except Executive Officer. This will filter duplicates by only the Executive Officer column. Click OK. And it will remove the duplicate by that column. *Note: You DO NOT want to remove duplicate from other columns because you will lose data you may need. For example, we may have two Net Profits numbers that are the same but from different companies. We will want to keep that information. c. Convert to Range- This will covert highlighted sections or the entire table back to a normal range. In other words, it will lose its table features. d. Insert Slicer-A slicer is a pulled out filter by section. It will allow you to run two or more filters in one. For this example, click on Insert Slicer -> Region -> OK. This will call up the Region slicer. Now you can filter by multiple regions. This is more useful in pivot tables. 7

8 3. External Table Data exports your table to other applications. 4. Table Style Options gives you a few table design and data options: a. Header Row will keep or remove your header information b. Total Row will insert a SUM total row at the bottom of each column c. Banded Row and Banded Columns will band the rows or column with a different color to make the table more readable d. First/Last Column will Bold the data in the first or last column e. Filter Button will keep or remove the filter button on each column header Conditional Formatting Excel allows you to visualize your data with different colors and visual conditions with Conditional Formatting button in the Home Tab. First, highlight the column you want to change with conditional formatting. For this example, select the Change from Previous Year column. 1. Click the Conditional Formatting button on the Ribbon. 2. Data Bars -> Select any option here: 8

9 Now let s try another conditional format. 1. Highlight column E 2. Go to Conditional Formatting 3. Go to Icon Sets -> 3 Arrows. Now you will get arrows determining whose profits are above, at, or below average. Try using different conditional formats! You will not hurt anything by using different conditional formats! 9


10 Pivot Tables What are Pivot Tables? Pivot Tables are tables in Excel that you can ask multiple questions and analyze data from a particular table. Once you have created a table in Excel, it is easy to convert your table to a Pivot Table. To convert your table to a Pivot Table, click on cell A3 and select the Insert ribbon, then click the Pivot Table button. Make sure Excel has selected the correct data, choose New Worksheet or Existing Worksheet, depending on where you want the new pivot table to go, then select OK. Remember the name of the table. This is how Excel will recognize the table it needs to covert. 10


11 Once you click Ok, you will be taken to a new worksheet. Now the pivot needs to know which fields you want on the table. You can choose which data you would like your Pivot Table to focus on by checking the data fields from the list. Excel will then try to guess if the field belongs as a filter, column label, row label, or value. Or, if you prefer, you can drag the field name to the area of your choice. Select Company, Region, and Net Profit. This should put these categories into range. Also notice, Excel put in the column, Sum of Net Profits. At the bottom right of the screen you will notice a button that states, Sum of Net Profit. You can click it -> Value Field Settings -> and change the sum to average or another function. 11


12 You can easily add fields to your Pivot Table by checking another field from the list. In this example, the State field has been added by checking it in the list. 12

13 Charts In Excel, charts are a great way to visualize your data. However, it is always good to remember some charts are not meant to display particular types of data. For example, the best charts to display percentages are pie charts. In this exercise, we will be working with stocks. When working with stocks, you more than likely will want to use the most updated information available. Open the stock spreadsheet. Pivot Tables Charts You can quickly turn a pivot table into a pivot chart. Click the Analyze Tab -> Pivot Chart -> Select a Chart Type. For this example, select Cell B3 (Sum of Net Profit) and select the Pie Chart. Now you can filter your data by Region or another field from the table. 13
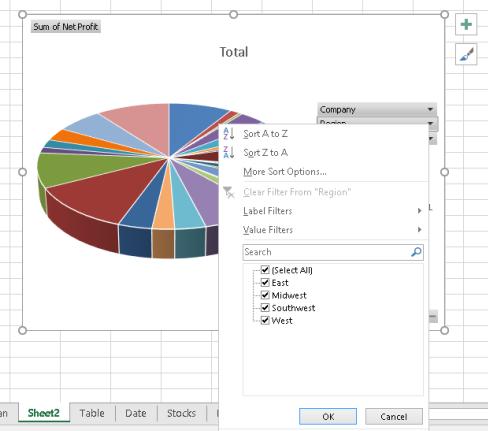
14 14


15 To analyze your data even further, don t forget the Slicers. Go to Analyze tab and choose Insert Slicer. Choose Region, Net Profit, and Change from Previous Year. Click OK. The three slicers will appear. Now you can filter by any of the slicers. Click: Region-> Midwest Change from Previous Year -> -4% Now both the chart and table will change. (To get the full table and chart back, just double click on the table) 15
. Absolute and Relative formulas! Absolute Macro Open the Macro spreadsheet.")
16 Macros A macro in Excel, in most cases, is a recording of keystrokes. However, that is the basics of macros in Excel. I like to think of macros as the automation of tasks. There are two types of Macros. (This may sound familiar to the formula vocabulary). Absolute and Relative formulas! Absolute Macro Open the Macro spreadsheet. Click in Cell A1 Open the Developer Tab (File Tab- >Options->Customize Ribbon- >Developer in the right menu) Click Record Macro Macro Name: Absolute Shortcut Key: Ctrl+l Leave This Workbook Click Ok The Macro will start recording. In cell A29, type Total In cell F29, type =SUM(F2:F28) Run the formula by clicking Enter Back on the Ribbon, click Stop Recording Delete all content in row 29. Click on any blank cell, and click Macros in the Ribbon. Click Run in the Macro dialogue box. Now click in any blank cell, and run the Macro again. (Press Cntl+l) The absolute macro will always return back to the original cell. Relative Macro Click in Cell A1 Back in the Developer Tab, click Use Relative References Click Record Macro Macro Name: Relative -> Shortcut Key: Ctrl+y -> This Workbook Click OK The Macro will start recording. In cell A30, type Total In cell F30, type =SUM(F2:F28) Run the formula by clicking Enter Back on the Ribbon, click Stop Recording Delete all content in row 30. Click on any blank cell, and click Macros in the Ribbon. Click Run in the Macro dialogue box. Now click in any blank cell, and run the Macro again. (Press Cntl+y) The relative macro will run the macro in any cell and reference the original table! 16
AGB 260: Agribusiness Data Literacy. Tables
 AGB 260: Agribusiness Data Literacy Tables Useful Chapters in the Textbook Regarding this Lecture Chapter 5 Tables A table in Excel is a rectangular array of information/attributes where the first row
Intermediate Excel Training Course Content
 Intermediate Excel Training Course Content Lesson Page 1 Absolute Cell Addressing 2 Using Absolute References 2 Naming Cells and Ranges 2 Using the Create Method to Name Cells 3 Data Consolidation 3 Consolidating
Microsoft Excel 2010 Training. Excel 2010 Basics
 Microsoft Excel 2010 Training Excel 2010 Basics Overview Excel is a spreadsheet, a grid made from columns and rows. It is a software program that can make number manipulation easy and somewhat painless.
Excel Intermediate. Click in the name column of our Range of Data. (Do not highlight the column) Click on the Data Tab in the Ribbon
 Click on the Data Tab in the Ribbon") Custom Sorting and Subtotaling Excel Intermediate Excel allows us to sort data whether it is alphabetic or numeric. Simply clicking within a column or row of data will begin the process. Click in the name
Custom Sorting and Subtotaling Excel Intermediate Excel allows us to sort data whether it is alphabetic or numeric. Simply clicking within a column or row of data will begin the process. Click in the name
Basic tasks in Excel 2013
 Basic tasks in Excel 2013 Excel is an incredibly powerful tool for getting meaning out of vast amounts of data. But it also works really well for simple calculations and tracking almost any kind of information.
Pivot Tables in Excel Contents. Updated 5/19/2016
 Pivot Tables in Excel 2010 Updated 5/19/2016 Contents Setup a Pivot Table in Excel 2010... 2 General Field List Features... 4 Summing and Counting Together... 6 Grouping Date Data... 7 Grouping Non-Date
Microsoft Excel Pivot Tables & Pivot Table Charts
 Microsoft Excel 2013 Pivot Tables & Pivot Table Charts A pivot table report allows you to analyze and summarize a million rows of data in Excel 2013 without entering a single formula. Pivot Tables let
Excel Tables and Pivot Tables
 A) Why use a table in the first place a. Easy to filter and sort if you only sort or filter by one item b. Automatically fills formulas down c. Can easily add a totals row d. Easy formatting with preformatted
MS Excel Advanced Level
 MS Excel Advanced Level Trainer : Etech Global Solution Contents Conditional Formatting... 1 Remove Duplicates... 4 Sorting... 5 Filtering... 6 Charts Column... 7 Charts Line... 10 Charts Bar... 10 Charts
EXCEL ADVANCED Linda Muchow
 EXCEL ADVANCED 2016 Alexandria Technical and Community College Customized Training Technology Specialist 1601 Jefferson Street, Alexandria, MN 56308 320-762-4539 Linda Muchow lindac@alextech.edu 1 Table
Microsoft Excel Office 2016/2013/2010/2007 Tips and Tricks
 Microsoft Excel Office 2016/2013/2010/2007 Tips and Tricks In Office 2007, the OFFICE BUTTON is the symbol at the top left of the screen. 1 Enter Fractions That Will Display And Calculate Properly a. Type
How to insert table in Excel?
 What is Table in Excel? Tables allow you to analyze your data in Excel quickly and easily. How to insert table in Excel? To insert a table, execute the following steps. 1. Click any single cell inside
How to Excel - Part 2
 Table of Contents Exercise 1: Protecting cells and sheets... 3 Task 1 Protecting sheet... 3 Task 2 Protecting workbook... 3 Task 3 Unprotect workbook and sheet... 3 Task 4 Protecting cells... 4 Protecting
Microsoft Excel Chapter 1. Creating a Worksheet and a Chart
 Microsoft Excel 2013 Chapter 1 Creating a Worksheet and a Chart Objectives Describe the Excel worksheet Enter text and numbers Use the Sum button to sum a range of cells Enter a simple function Copy the
Microsoft Office Excel 2013
 Microsoft Office Excel 2013 PivotTables and PivotCharts University Information Technology Services Training, Outreach, Learning Technologies and Video Production Copyright 2014 KSU Department of University
2. create the workbook file
 2. create the workbook file Excel documents are called workbook files. A workbook can include multiple sheets of information. Excel supports two kinds of sheets for working with data: Worksheets, which
Excel 2013 PivotTables and PivotCharts
 Excel 2013 PivotTables and PivotCharts PivotTables... 1 PivotTable Wizard... 1 Creating a PivotTable... 2 Groups... 2 Rows Group... 3 Values Group... 3 Columns Group... 4 Filters Group... 5 Field Settings...
Excel Advanced
 Excel 2016 - Advanced LINDA MUCHOW Alexandria Technical & Community College 320-762-4539 lindac@alextech.edu Table of Contents Macros... 2 Adding the Developer Tab in Excel 2016... 2 Excel Macro Recorder...
Working With Tables In Excel 2007
 Working With Tables In Excel 2007 Introduction With the release of Excel 2007, Microsoft has introduced a new concept of working with tables of data. This new functionality is (not surprisingly) called
Microsoft Excel. for Finance Majors. Microsoft Excel for Finance Majors
 Microsoft Excel for Finance Majors 2007 Version: 12/21/2017 Contents Introduction... 3 Working with Tables... 3 Exercise... 10 Pivot Tables... 12 Exercise:... 17 Conditional Formatting... 18 Exercise:...
Excel Format cells Number Percentage (.20 not 20) Special (Zip, Phone) Font
 Special (Zip, Phone) Font") Excel 2013 Shortcuts My favorites: Ctrl+C copy (C=Copy) Ctrl+X cut (x is the shape of scissors) Ctrl+V paste (v is the shape of the tip of a glue bottle) Ctrl+A - or the corner of worksheet Ctrl+Home Goes
Excel 2013 Shortcuts My favorites: Ctrl+C copy (C=Copy) Ctrl+X cut (x is the shape of scissors) Ctrl+V paste (v is the shape of the tip of a glue bottle) Ctrl+A - or the corner of worksheet Ctrl+Home Goes
SBCUSD IT Training Program. MS Excel lll. VLOOKUPS, PivotTables, Macros, and More
 SBCUSD IT Training Program MS Excel lll VLOOKUPS, PivotTables, Macros, and More Revised 10/25/2018 TABLE OF CONTENTS VLOOKUP...2 VLOOLUP...2 SUMIF...3 SUMIF...3 PivotTable...4 Create PivotTable...4 Build
Microsoft Excel 2016 LEVEL 2
 TECH TUTOR ONE-ON-ONE COMPUTER HELP COMPUTER CLASSES Microsoft Excel 2016 LEVEL 2 kcls.org/techtutor Microsoft Excel 2016 Level 2 Manual Rev 11/2017 instruction@kcls.org Microsoft Excel 2016 Level 2 Welcome
download instant at
 CHAPTER 1 - LAB SESSION INTRODUCTION TO EXCEL INTRODUCTION: This lab session is designed to introduce you to the statistical aspects of Microsoft Excel. During this session you will learn how to enter
Creating Automated Dashboard Excel 2013 Contents
 Creating Automated Dashboard Excel 2013 Contents Summarize Data Using Pivot Table... 2 Constructing Report Summary... 2 Create a PivotTable from worksheet data... 2 Add fields to a PivotTable... 2 Grouping
2013 ADVANCED MANUAL
 2013 ADVANCED MANUAL C B C H O U S E 2 4 C A N N I N G S T R E E T E D I N B U R G H E H 3 8 E G 0 1 3 1 2 7 2 2 7 9 0 W W W. I T R A I N S C O T L A N D. C O. U K I N F O @ I T R A I N S C O T L A N D.
The Foundation. Review in an instant
 The Foundation Review in an instant Table of contents Introduction 1 Basic use of Excel 2 - Important Excel terms - Important toolbars - Inserting and deleting columns and rows - Copy and paste Calculations
Candy is Dandy Project (Project #12)
") Candy is Dandy Project (Project #12) You have been hired to conduct some market research about M&M's. First, you had your team purchase 4 large bags and the results are given for the contents of those
Candy is Dandy Project (Project #12) You have been hired to conduct some market research about M&M's. First, you had your team purchase 4 large bags and the results are given for the contents of those
Ćw. IV. DynamicTables
 Ćw. IV. DynamicTables Task 1. We have a table with three columns containing the product name, category to which the product belongs, and its sale last year. The table contains data for 500 products. We
Making Excel Work for Your Tribal Community
 Making Excel Work for Your Tribal Community Excel Basics: Intermediate Skills PHONE: 1-800-871-8702 EMAIL: INFO@CBC4TRIBES.ORG WEB: TRIBALINFORMATIONEXCHANGE.ORG MAKING EXCEL WORK FOR YOUR TRIBAL COMMUNITY
Excel 2007 New Features Table of Contents
 Table of Contents Excel 2007 New Interface... 1 Quick Access Toolbar... 1 Minimizing the Ribbon... 1 The Office Button... 2 Format as Table Filters and Sorting... 2 Table Tools... 4 Filtering Data... 4
MS Office 2016 Excel Pivot Tables - notes
 Introduction Why You Should Use a Pivot Table: Organize your data by aggregating the rows into interesting and useful views. Calculate and sum data quickly. Great for finding typos. Create a Pivot Table
3/31/2016. Spreadsheets. Spreadsheets. Spreadsheets and Data Management. Unit 3. Can be used to automatically
 MICROSOFT EXCEL and Data Management Unit 3 Thursday March 31, 2016 Allow users to perform simple and complex sorting Allow users to perform calculations quickly Organizes and presents figures that can
A new workbook contains 256 worksheets. The worksheet is a grid of COLUMNS and ROWS. The intersection of a column and a row is called a CELL.
 MICROSOFT EXCEL INTRODUCTION Microsoft Excel is allow you to create professional spreadsheets and charts. It is quite useful in entering, editing, analysis and storing of data. It performs numerous functions
Advanced Excel for EMIS Coordinators
 Advanced Excel for EMIS Coordinators Helen Mills helenmills@metasolutions.net 2015 Metropolitan Educational Technology Association Outline Macros Conditional Formatting Text to Columns Pivot Tables V-Lookup
Microsoft Access II 1.) Opening a Saved Database Music Click the Options Enable this Content Click OK. *
 Opening a Saved Database Music Click the Options Enable this Content Click OK. *") Microsoft Access II 1.) Opening a Saved Database Open the Music database saved on your computer s hard drive. *I added more songs and records to the Songs and Artist tables. Click the Options button next
Microsoft Access II 1.) Opening a Saved Database Open the Music database saved on your computer s hard drive. *I added more songs and records to the Songs and Artist tables. Click the Options button next
Microsoft Excel 2013/2016 Pivot Tables
 Microsoft Excel 2013/2016 Pivot Tables Creating PivotTables PivotTables are powerful data analysis tools. They let you summarize data in various ways and instantly change the view you use. A PivotTable
Microsoft Excel Chapter 1. Creating a Worksheet and an Embedded Chart
 Microsoft Excel 2010 Chapter 1 Creating a Worksheet and an Embedded Chart Objectives Describe the Excel worksheet Enter text and numbers Use the Sum button to sum a range of cells Copy the contents of
Learning Microsoft Excel Module 1 Contents. Chapter 1: Introduction to Microsoft Excel
 Module 1 Contents Chapter 1: Introduction to Microsoft Excel Loading Microsoft Excel...1-1 The Microsoft Excel Screen...1-2 Moving the Cursor...1-4 Using the Mouse...1-4 Using the Arrow Keys...1-4 Using
Excel 2013 Part 2. 2) Creating Different Charts
 Creating Different Charts") Excel 2013 Part 2 1) Create a Chart (review) Open Budget.xlsx from Documents folder. Then highlight the range from C5 to L8. Click on the Insert Tab on the Ribbon. From the Charts click on the dialogue
Excel 2013 Part 2 1) Create a Chart (review) Open Budget.xlsx from Documents folder. Then highlight the range from C5 to L8. Click on the Insert Tab on the Ribbon. From the Charts click on the dialogue
Advanced Excel. IMFOA Conference. April 11, :15 pm 4:15 pm. Presented By: Chad Jarvi, CPA President, Civic Systems
 Advanced Excel Presented By: Chad Jarvi, CPA President, Civic Systems IMFOA Conference April 11, 2019 3:15 pm 4:15 pm COPY AND PASTE... 4 USING THE RIBBON... 4 USING RIGHT CLICK... 4 USING CTRL-C AND CTRL-V...
Excel Tables & PivotTables
 Excel Tables & PivotTables A PivotTable is a tool that is used to summarize and reorganize data from an Excel spreadsheet. PivotTables are very useful where there is a lot of data that to analyze. PivotTables
Excel Level 3 - Advanced
 Excel Level 3 - Advanced Introduction This document covers some of the more advanced features of Excel. Spreadsheets can be used in such a multiplicity of ways that it cannot hope to even touch on all
ADD A 3-D PIE CHART TO THE WORKBOOK
 ADD A 3-D PIE CHART TO THE WORKBOOK A pie chart is an easy way to show the relationship of items to the whole. In this exercise, you will be creating a Pie Chart that will show the relationship between
TABLE OF CONTENTS. i Excel 2016 Advanced. 1 INTRODUCTION Method Software and other settings Exercise files 2
 i TABLE OF CONTENTS 1 INTRODUCTION 1 1.1 Method 1 1.2 Software and other settings 2 1.3 Exercise files 2 2 MULTIPLE WORKSHEETS 3 2.1 Working with multiple worksheets 3 Adding a worksheet 4 Deleting a worksheet
Microsoft Excel 2016 LEVEL 3
 TECH TUTOR ONE-ON-ONE COMPUTER HELP COMPUTER CLASSES Microsoft Excel 2016 LEVEL 3 kcls.org/techtutor Microsoft Excel 2016 Level 3 Manual Rev 11/2017 instruction@kcls.org Microsoft Excel 2016 Level 3 Welcome
Chapter 4. Microsoft Excel
 Chapter 4 Microsoft Excel Topic Introduction Spreadsheet Basic Screen Layout Modifying a Worksheet Formatting Cells Formulas and Functions Sorting and Filling Borders and Shading Charts Introduction A
Introduction to Microsoft Excel 2010 Quick Reference Sheet
 Spreadsheet What is a spreadsheet? How is Excel 2010 different from previous versions? A grid of rows and columns that help to organize, summarize and calculate data. Microsoft Excel 2010 is built on the
Pivot Table Project. Objectives. By the end of this lesson, you will be able to:
 Pivot Table Project Objectives By the end of this lesson, you will be able to: Set up a Worksheet Enter Labels and Values Use Sum and IF functions Format and align cells Change column width Use AutoFill
Contents. Group 2 Excel Handouts 2010
 Contents Styles... 2 Conditional Formatting... 2 Create a New Rule... 4 Format as Table... 5 Create your own New Table Style... 8 Cell Styles... 9 New Cell Style... 10 Merge Styles... 10 Sparklines...
Explore commands on the ribbon Each ribbon tab has groups, and each group has a set of related commands.
 Quick Start Guide Microsoft Excel 2013 looks different from previous versions, so we created this guide to help you minimize the learning curve. Add commands to the Quick Access Toolbar Keep favorite commands
Excel Tips for Compensation Practitioners Weeks Data Validation and Protection
 Excel Tips for Compensation Practitioners Weeks 29-38 Data Validation and Protection Week 29 Data Validation and Protection One of the essential roles we need to perform as compensation practitioners is
Excel Project 1 Creating a Worksheet and an Embedded Chart
 7 th grade Business & Computer Science 1 Excel Project 1 Creating a Worksheet and an Embedded Chart What is MS Excel? MS Excel is a powerful spreadsheet program that allows users to organize data, complete
Using Tables, Sparklines and Conditional Formatting. Module 5. Adobe Captivate Wednesday, May 11, 2016
 Slide 1 - Using Tables, Sparklines and Conditional Formatting Using Tables, Sparklines and Conditional Formatting Module 5 Page 1 of 27 Slide 2 - Lesson Objectives Lesson Objectives Explore the find and
BASIC EXCEL SYLLABUS Section 1: Getting Started Section 2: Working with Worksheet Section 3: Administration Section 4: Data Handling & Manipulation
 BASIC EXCEL SYLLABUS Section 1: Getting Started Unit 1.1 - Excel Introduction Unit 1.2 - The Excel Interface Unit 1.3 - Basic Navigation and Entering Data Unit 1.4 - Shortcut Keys Section 2: Working with
Spreadsheet Concepts: Creating Charts in Microsoft Excel
 Spreadsheet Concepts: Creating Charts in Microsoft Excel lab 6 Objectives: Upon successful completion of Lab 6, you will be able to Create a simple chart on a separate chart sheet and embed it in the worksheet
ADVANCED INQUIRIES IN ALBEDO: PART 2 EXCEL DATA PROCESSING INSTRUCTIONS
 ADVANCED INQUIRIES IN ALBEDO: PART 2 EXCEL DATA PROCESSING INSTRUCTIONS Once you have downloaded a MODIS subset, there are a few steps you must take before you begin analyzing the data. Directions for
Reference Services Division Presents. Excel Introductory Course
 Reference Services Division Presents Excel 2007 Introductory Course OBJECTIVES: Navigate Comfortably in the Excel Environment Create a basic spreadsheet Learn how to format the cells and text Apply a simple
PivotTables & Charts for Health
 PivotTables & Charts for Health Data Inputs PivotTables Pivot Charts Global Strategic Information UCSF Global Health Sciences Version Malaria 1.0 1 Table of Contents 1.1. Introduction... 3 1.1.1. Software
Pivot Tables, Lookup Tables and Scenarios
 Introduction Format and manipulate data using pivot tables. Using a grading sheet as and example you will be shown how to set up and use lookup tables and scenarios. Contents Introduction Contents Pivot
Saving a Workbook That Contains Macros
 Procedures LESSON 64: RECDING A MACRO Adding the DEVELOPER Tab to the Ribbon box, click Customize Ribbon. 4. In the Customize the Ribbon list at the right, click to mark Developer. Setting the Macro Security
EXCEL 2007 TIP SHEET. Dialog Box Launcher these allow you to access additional features associated with a specific Group of buttons within a Ribbon.
 EXCEL 2007 TIP SHEET GLOSSARY AutoSum a function in Excel that adds the contents of a specified range of Cells; the AutoSum button appears on the Home ribbon as a. Dialog Box Launcher these allow you to
Lesson 1: Creating a Worksheet and a Chart Microsoft Excel 2016 IN THIS CHAPTER, YOU WILL LEARN HOW TO
 Lesson 1: Creating a Worksheet and a Chart Microsoft Excel 2016 IN THIS CHAPTER, YOU WILL LEARN HOW TO Describe the Excel worksheet Enter text and numbers Use the Sum button to sum a range of cells Enter
Advanced Excel Macros : Data Validation/Analysis : OneDrive
 Advanced Excel Macros : Data Validation/Analysis : OneDrive Macros Macros in Excel are in short, a recording of keystrokes. Beyond simple recording, you can use macros to automate tasks that you will use
Gloucester County Library System EXCEL 2007
 Gloucester County Library System EXCEL 2007 Introduction What is Excel? Microsoft E x c e l is an electronic s preadsheet program. I t is capable o f performing many diff e r e n t t y p e s o f c a l
Excel Shortcuts Increasing YOUR Productivity
 Excel Shortcuts Increasing YOUR Productivity CompuHELP Division of Tommy Harrington Enterprises, Inc. tommy@tommyharrington.com https://www.facebook.com/tommyharringtonextremeexcel Excel Shortcuts Increasing
Microsoft Excel 2010 Step-by-Step Exercises PivotTables and PivotCharts: Exercise 1
 Microsoft Excel 2010 Step-by-Step Exercises PivotTables and PivotCharts: Exercise 1 In this exercise you will learn how to: Create a new PivotTable Add fields to a PivotTable Format and rename PivotTable
Excel. Spreadsheet functions
 Excel Spreadsheet functions Objectives Week 1 By the end of this session you will be able to :- Move around workbooks and worksheets Insert and delete rows and columns Calculate with the Auto Sum function
DOING MORE WITH EXCEL: MICROSOFT OFFICE 2010
 DOING MORE WITH EXCEL: MICROSOFT OFFICE 2010 GETTING STARTED PAGE 02 Prerequisites What You Will Learn MORE TASKS IN MICROSOFT EXCEL PAGE 03 Cutting, Copying, and Pasting Data Filling Data Across Columns
DOING MORE WITH EXCEL: MICROSOFT OFFICE 2013
 DOING MORE WITH EXCEL: MICROSOFT OFFICE 2013 GETTING STARTED PAGE 02 Prerequisites What You Will Learn MORE TASKS IN MICROSOFT EXCEL PAGE 03 Cutting, Copying, and Pasting Data Basic Formulas Filling Data
Getting Started with Excel
 Getting Started with Excel Excel Files The files that Excel stores spreadsheets in are called workbooks. A workbook is made up of individual worksheets. Each sheet is identified by a sheet name which appears
Microsoft Excel Microsoft Excel
 Excel 101 Microsoft Excel is a spreadsheet program that can be used to organize data, perform calculations, and create charts and graphs. Spreadsheets or graphs created with Microsoft Excel can be imported
Intermediate Excel 2003
 Intermediate Excel 2003 Introduction The aim of this document is to introduce some techniques for manipulating data within Excel, including sorting, filtering and how to customise the charts you create.
UNIT ONE: The Worksheet. Workbook Window Excel Worksheet Fill handle Automatic fill Column widths Opening a file Saving a file
 UNIT ONE: The Worksheet T o p i c s : Workbook Window Excel Worksheet Fill handle Automatic fill Column widths Opening a file Saving a file I. Start Excel: 1. Click the Start button in the lower-left corner
WAAT-PivotTables Accounting Seminar
 WAAT-PivotTables-08-26-2016-Accounting Seminar Table of Contents What does a PivotTable do?... 2 How to create PivotTable:... 2 Add conditions to the PivotTable:... 2 Grouping Daily Dates into Years, Quarters,
Excel 2013 Intermediate
 Excel 2013 Intermediate Quick Access Toolbar... 1 Customizing Excel... 2 Keyboard Shortcuts... 2 Navigating the Spreadsheet... 2 Status Bar... 3 Worksheets... 3 Group Column/Row Adjusments... 4 Hiding
PRACTICAL EXERCISE 1.1.6b
 PRACTICAL EXERCISE 1.1.6b PLAN, SELECT & USE APPROPRIATE IT SYSTEMS & SOFTWARE 1. Explain the purpose for using IT. EXPLAIN THE PURPOSE FOR USING IT a) Explain the type of document that is to be produced
Excel Main Screen. Fundamental Concepts. General Keyboard Shortcuts Open a workbook Create New Save Preview and Print Close a Workbook
 Excel 2016 Main Screen Fundamental Concepts General Keyboard Shortcuts Open a workbook Create New Save Preview and Print Close a Ctrl + O Ctrl + N Ctrl + S Ctrl + P Ctrl + W Help Run Spell Check Calculate
Microsoft Excel Level 2
 Microsoft Excel Level 2 Table of Contents Chapter 1 Working with Excel Templates... 5 What is a Template?... 5 I. Opening a Template... 5 II. Using a Template... 5 III. Creating a Template... 6 Chapter
2. This is a cell; this cell is designated as A1.
 Queen s Learning Commons: Microsoft Excel Basics 1. These are the columns. 2. This is a cell; this cell is designated as A1. 3. Let s make a table. Click on the box you want to put text in and simply begin
Excel 2007/2010. Don t be afraid of PivotTables. Prepared by: Tina Purtee Information Technology (818)
") Information Technology MS Office 2007/10 Users Guide Excel 2007/2010 Don t be afraid of PivotTables Prepared by: Tina Purtee Information Technology (818) 677-2090 tpurtee@csun.edu [ DON T BE AFRAID OF
Information Technology MS Office 2007/10 Users Guide Excel 2007/2010 Don t be afraid of PivotTables Prepared by: Tina Purtee Information Technology (818) 677-2090 tpurtee@csun.edu [ DON T BE AFRAID OF
2013 INTERMEDIATE MANUAL
 C B C H O U S E 2 4 C A N N I N G S T R E E T E D I N B U R G H E H 3 8 E G 0 1 3 1 2 7 2 2 7 9 0 W W W. I T R A I N S C O T L A N D. C O. U K I N F O @ I T R A I N S C O T L A N D. C O. U K CONTENTS CHAPTER
Tutorial 5: Working with Excel Tables, PivotTables, and PivotCharts. Microsoft Excel 2013 Enhanced
 Tutorial 5: Working with Excel Tables, PivotTables, and PivotCharts Microsoft Excel 2013 Enhanced Objectives Explore a structured range of data Freeze rows and columns Plan and create an Excel table Rename
Basic Microsoft Excel 2007
 Basic Microsoft Excel 2007 Contents Starting Excel... 2 Excel Window Properties... 2 The Ribbon... 3 Tabs... 3 Contextual Tabs... 3 Dialog Box Launchers... 4 Galleries... 5 Minimizing the Ribbon... 5 The
4. In the Change Chart Type dialog box, click the type of chart to which you want to change. 5. Click the chart style. 6. Click OK.
 PROCEDURES LESSON 21: BUILDING BASIC CHARTS Creating a Chart 1 Select the range of data you want to chart 2 Click the INSERT tab Charts Group 3 Click the desired chart category button 4 In the gallery,
Excel 2007 Fundamentals
 Excel 2007 Fundamentals Introduction The aim of this document is to introduce some basic techniques for using Excel to enter data, perform calculations and produce simple charts based on that information.
Sort, Filter, Pivot Table
 Sort, Filter, Pivot Table Sort A common database task is to rearrange the information based on a header/field or headers/fields. This is called Sorting or Filtering. Sorting rearranges all of the information
Office of Instructional Technology
 Office of Instructional Technology Microsoft Excel 2016 Contact Information: 718-254-8565 ITEC@citytech.cuny.edu Contents Introduction to Excel 2016... 3 Opening Excel 2016... 3 Office 2016 Ribbon... 3
Introduction to Excel 2013 Part 2
 Introduction to Excel 2013 Part 2 Open a file Select File from the Menu bar, select Open from the drop down menu, navigate to the place where the file was stored, double-left click on the file name. Modify
Computer Training That Makes The Difference
 Computer Training That Makes The Difference MICROSOFT EXCEL INTRODUCTION (LEVEL 1) A one-day course to introduce you to Excel and show you the basic functions of the program. Prerequisite Introduction
Working with Excel CHAPTER 1
 CHAPTER 1 Working with Excel You use Microsoft Excel to create spreadsheets, which are documents that enable you to manipulate numbers and formulas to quickly create powerful mathematical, financial, and
Microsoft Office Excel
 Microsoft Office 2007 - Excel Help Click on the Microsoft Office Excel Help button in the top right corner. Type the desired word in the search box and then press the Enter key. Choose the desired topic
M i c r o s o f t E x c e l A d v a n c e d P a r t 3-4. Microsoft Excel Advanced 3-4
 Microsoft Excel 2010 Advanced 3-4 0 Absolute references There may be times when you do not want a cell reference to change when copying or filling cells. You can use an absolute reference to keep a row
Module 4 : Spreadsheets
 Module 4 : Spreadsheets What is a spreadsheet program? A spreadsheet program allows you to store, organise and analyse information. Applications of spreadsheets focus on generating numeric information
Excel 2010-Part. Two
 Jefferson Parish Library Computer Training Team Excel 2010-Part Two August 2011 Symbols Used in Formulas Add Subtract Divide Multiply + - / * When working with formulas in Excel you will use basic keyboard
Advanced Microsoft Excel 2010
 Agenda: 1. Introduction 2. Complex formulas & cell references 3. Functions 4. Charts 5. Pivot Tables 6. Practice and Questions In order to keep computer literacy programs running in the future, we must
Microsoft Excel 2010 Basics
 Microsoft xcel 2010 Basics irections: Answer the following questions. 1. A is a grid of rows and columns in which you enter text,, and the results of calculations. 2. At the top of your screen you will
4Functions & Formulas
 The Original Quick Reference Guides Microsoft Excel 2010 Excel is a spreadsheet program that enables you to perform simple or complex calculations using a broad range of statistical and mathematical tools,
Tips & Tricks: MS Excel
 Tips & Tricks: MS Excel 080501.2319 Table of Contents Navigation and References... 3 Layout... 3 Working with Numbers... 5 Power Features... 7 From ACS to Excel and Back... 8 Teacher Notes: Test examples
Excel tutorial Introduction
 Office button Excel tutorial Introduction Microsoft Excel is an electronic spreadsheet. You can use it to organize your data into rows and columns. You can also use it to perform mathematical calculations