Filter and PivotTables in Excel
|
|
|
- Joanna Harris
- 5 years ago
- Views:
Transcription
1 Filter and PivotTables in Excel FILTERING With filters in Excel you can quickly collapse your spreadsheet to find records meeting specific criteria. A lot of reporters use filter to cut their data down to size. Here are some examples: A reporter gets a spreadsheet with data covering her entire state. By filtering she can quickly pick out only the counties in her coverage area. When working with school test scores a reporter wants to look only at schools with enrollment greater than 500 but less than 1,000. He can do that by filtering using numbers and ranges. A political reporter can use filters with campaign contribution data to find all records that came from donors in a particular city or zip code. A crime reporter got a spreadsheet of incidents from the police department. She heard that there was an increase in crime on one particular street. She can find all of the incidents occurring on that street by filtering the address column to find any records containing that street name. To turn on the filters simply click anywhere in the data and then look under the Data tab for the Filter button. The icon looks like a funnel. Click on it and dropdown arrows should appear next to each column header. Figure 1 If you click on one of those dropdowns, you should find a unique list of all of the values contained in that column (which is a great way to get to know what each column contains). You can click on the box next to Select all to uncheck all items. Then select only what you want. The example below shows a filter to get only the records for the National League in a spreadsheet of baseball players. Once you re happy with your selections, close the box. 1

2 Figure 2 You ll know the filter is working by several things: 1) The dropdown next to the heading of the column you re filtering on will become a funnel. 2) All of the row numbers become blue. You now only see the records meeting your filter criteria. None of the other records have gone away, they are just hiding until you either change your filter or turn it off. 3) At the bottom left-hand corner of your screen you ll see a record count. This tells you how many records have been selected out of the total number of records. This can be very useful during an analysis: 2

3 If you want all of the records to come back you have two options: You can click back on the dropdown next to the heading of the column you are currently filtering and click on Select all. Or, you can just turn off the filters; often this is the easiest way to go because you can think of the filter like a light switch. You flip the switch and the filters appear, you flip it again and they turn off. To turn off the filters just click on Filter (the funnel icon) under the Data tab. It will clear all of your filters, bringing back every record. Now that we ve covered the basics of filtering, explore filters on your own to see all that they offer. Here are some highlights: Put filters on multiple columns at the same time. When working with number columns explore the drop-down number filters under Choose One. Options here include Greater Than, Between, Less Than and Top 10. Figure 3 Text columns also offer some useful filtering options. Find records that begin, end or contain certain characters. The Contains option is especially useful if you have to deal with information that is commonly misspelled or spelled inconsistently. For example, St. 3

4 Louis can be written many different ways, including St. Louis, St Louis and Saint Louis. None of these are wrong, but Excel will see them as different items. They all have Louis in common so you could use the Contains or Ends With options to grab all of the records at once. Figure 4 4

5 GROUPING We re journalists, so we re often concerned with answering questions like: Who is paying the most? Which county had the most? How many? What is the most common? When you start wanting to ask your data questions like this and a simple sort won t do, you re going to need to use pivot tables. One of the main concepts to grasp with pivot tables is grouping. Imagine if I had a traditional deck of cards, shuffled them up, took two cards out and put them in my pocket. You d know I had 50 cards remaining, but if I asked you which cards were missing, what would you do? You wouldn t be able to just look at the deck of cards and tell me that I had the Queen of Hearts and the 8 of Spades in my pocket. You d put the cards into piles, each containing one type of card, such as Kings, Aces, 7 s, etc. After you d gone through the 50 cards you d be able to see which pile had fewer than four cards to discover which ones are missing. Excel is going to do the same thing for us with a pivot table. Before learning this skill many journalists have simply used a piece of paper and a pencil to tally up things and report on them. Take, for example, this listing of individuals and firms barred from doing business with the World Bank (See Figure 5). One reporter wanted to write a story looking at the number of debarments for his country compared to others. He went through the list of more than 500 records of companies and individuals and kept a tally of the number of records for each country. The story isn t impossible without Excel but analyzing this same information in a spreadsheet can drastically cut down on the time and increase accuracy by doing the math for you. Follow the steps below to walk through a basic pivot table using WorldBank.xlsx. The data contain the name, address and country of the debarred individuals or firms as well as the ineligibility dates and grounds for debarment. 5

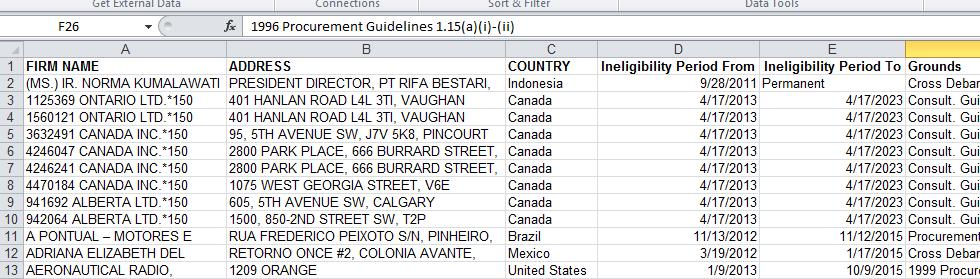
6 Figure 5 Figure 6 6
 and the down arrow (which will")
7 To find out the total debarments for each country you ll need to put the countries into groups using a pivot table. BUILDING A PIVOTTABLE First, highlight all your data: select A1 and hold down Shift + Command, then hit the right arrow (which should highlight all the headers) and the down arrow (which will highlight all the rows). Next, go to the Data tab and look all the way to the left. You should see PivotTable. Click the small down arrow and choose Create Manual PivotTable. Figure 7 The Create PivotTable window should open. It has two pieces to it: 1) You re asked to select the data you d like to analyze with your PivotTable. This is why you should select your data in advance. The Table/Range: information in Figure 8 is showing us exactly what we selected. It looks funny, but really it s just saying that we selected cells A1 all the way through F608 in the sheet called WorldBank found in this workbook. 2) Excel wants us to tell it where we d like to put the PivotTable. By default it selects New Worksheet. This is good because we don t want the PivotTable to just appear right on top of our data. 7


8 Figure 8 If you follow our steps you should always be able to simply click OK in this window, but it s still good to understand exactly what Excel is doing. After you click OK, Excel pops you into a new sheet with all of the tools you ll need to build your summary. There are two pieces, the various boxes on the left and the PivotTable Builder on the right. The boxes on the left are where your summary or chart will appear and change each time you do something in the task pane on the right. See Figure 10 for more information on this task pane. Figure 9 8

9 Figure 10: PivotTable Field List Task Pane We call them column headings, but Excel calls them fields. This is a list of all of the column headings, or fields, in the data. These boxes allow you to do some more complicated things in your PivotTable. We won t use them in the introduction to the concepts, but we ll explore them in some of the in-class and homework exercises. This is where you put your groups. Think of this as the labels for your chart. It s where you d put counties, team names, cities, etc. anything that will be the group. We typically start PivotTables in this area. Just drag a column heading from the field list here and the PivotTable box will automatically contain a list of unique values found in the column you chose. Think of this as the place where math happens. Anytime you want to find the sum, average or total number of records for a category you ll work in this area. Just like we ve done with other datasets, frame your analysis with a question. In this situation we want to know which country has the most firms and/or individuals on the debarred list. To answer that question you ll move Country from the Field name list to the Row Labels box. As 9

10 soon as you drop Country under Row Labels you should see a list of country names appear in the PivotTable box. This list is alphabetical and each country name should be listed only once. Figure 11 Next, we ll want to count the number of debarments for each country. Remember that each row in the spreadsheet represents one firm or individual debarred. To count up the totals by country, drag Country under the Values box. See Figure

.")
11 Figure 12 The last step is to get the country with the most debarments on the top of the list. For this we ll need to sort. Sorting is different in PivotTables than sorting in a regular sheet. Here, all you need to do is click on any number next to a country, and use the dropdown tool on the sort icon to select Descending (Figure 13). You can also sort the records alphabetically by clicking on any one of the country names, selecting the sort icon, then whichever option you prefer. Figure 13 11

12 Sorting by the number of debarments brings Canada to the top of the list, followed by the United States, Indonesia and the United Kingdom. Notice that Excel creates a Grand Total row at the bottom. This total should equal the number of records in your original spreadsheet. Figure 14 12
Excel Tables and Pivot Tables
 A) Why use a table in the first place a. Easy to filter and sort if you only sort or filter by one item b. Automatically fills formulas down c. Can easily add a totals row d. Easy formatting with preformatted
Using pivot tables in Excel (live exercise with data)
") Using pivot tables in Excel (live exercise with data) In chapter four, we used B.C. s political donations data to learn how to build pivot tables, which group elements in your data and summarize the information
Using pivot tables in Excel (live exercise with data) In chapter four, we used B.C. s political donations data to learn how to build pivot tables, which group elements in your data and summarize the information
Using Pivot Tables in Excel (Live Exercise with Data)
") Chapter 4 Using Pivot Tables in Excel (Live Exercise with Data) In chapter four, we used B.C. s political donations data to learn how to build pivot tables, which group elements in your data and summarize
Chapter 4 Using Pivot Tables in Excel (Live Exercise with Data) In chapter four, we used B.C. s political donations data to learn how to build pivot tables, which group elements in your data and summarize
Sorting and Filtering Data
 chapter 20 Sorting and Filtering Data IN THIS CHAPTER Sorting...................................................... page 332 Filtering..................................................... page 337 331
Excel Tables & PivotTables
 Excel Tables & PivotTables A PivotTable is a tool that is used to summarize and reorganize data from an Excel spreadsheet. PivotTables are very useful where there is a lot of data that to analyze. PivotTables
MS Office 2016 Excel Pivot Tables - notes
 Introduction Why You Should Use a Pivot Table: Organize your data by aggregating the rows into interesting and useful views. Calculate and sum data quickly. Great for finding typos. Create a Pivot Table
To complete this workbook, you will need the following file:
 CHAPTER 4 Excel More Skills 13 Create PivotTable Reports A PivotTable report is an interactive, cross-tabulated Excel report used to summarize and analyze data. PivotTable reports are used to ask questions
QUICK EXCEL TUTORIAL. The Very Basics
 QUICK EXCEL TUTORIAL The Very Basics You Are Here. Titles & Column Headers Merging Cells Text Alignment When we work on spread sheets we often need to have a title and/or header clearly visible. Merge
Intermediate Microsoft Excel 2010
 P a g e 1 Intermediate Microsoft Excel 2010 ABOUT THIS CLASS This class is designed to continue where the Microsoft Excel 2010 Basics class left off. Specifically, we will cover additional ways to organize
How to import text files to Microsoft Excel 2016:
 How to import text files to Microsoft Excel 2016: You would use these directions if you get a delimited text file from a government agency (or some other source). This might be tab-delimited, comma-delimited
Basic tasks in Excel 2013
 Basic tasks in Excel 2013 Excel is an incredibly powerful tool for getting meaning out of vast amounts of data. But it also works really well for simple calculations and tracking almost any kind of information.
File Name: Pivot Table Labs.xlsx
 File Name: Pivot Table Labs.xlsx Lab Session 1: Create Simple Pivot Table with a Date Grouping Note: Instructions for the first lab are very detailed because it might be the first time you have created
Intermediate Excel Training Course Content
 Intermediate Excel Training Course Content Lesson Page 1 Absolute Cell Addressing 2 Using Absolute References 2 Naming Cells and Ranges 2 Using the Create Method to Name Cells 3 Data Consolidation 3 Consolidating
Objective: Class Activities
 Objective: A Pivot Table is way to present information in a report format. The idea is that you can click drop down lists and change the data that is being displayed. Students will learn how to group data
Sort, Filter, Pivot Table
 Sort, Filter, Pivot Table Sort A common database task is to rearrange the information based on a header/field or headers/fields. This is called Sorting or Filtering. Sorting rearranges all of the information
Excel Basics Rice Digital Media Commons Guide Written for Microsoft Excel 2010 Windows Edition by Eric Miller
 Excel Basics Rice Digital Media Commons Guide Written for Microsoft Excel 2010 Windows Edition by Eric Miller Table of Contents Introduction!... 1 Part 1: Entering Data!... 2 1.a: Typing!... 2 1.b: Editing
How to insert table in Excel?
 What is Table in Excel? Tables allow you to analyze your data in Excel quickly and easily. How to insert table in Excel? To insert a table, execute the following steps. 1. Click any single cell inside
Solar Campaign Google Guide. PART 1 Google Drive
 Solar Campaign Google Guide This guide assumes your team has already retrieved its template Solar Campaign folder from Vital Communities and shared it with the entire volunteer team on Google Drive. To
1 Introduction to Using Excel Spreadsheets
 Survey of Math: Excel Spreadsheet Guide (for Excel 2007) Page 1 of 6 1 Introduction to Using Excel Spreadsheets This section of the guide is based on the file (a faux grade sheet created for messing with)
Data. Selecting Data. Sorting Data
 1 of 1 Data Selecting Data To select a large range of cells: Click on the first cell in the area you want to select Scroll down to the last cell and hold down the Shift key while you click on it. This
Creating a Pivot Table
 Contents Introduction... 1 Creating a Pivot Table... 1 A One-Dimensional Table... 2 A Two-Dimensional Table... 4 A Three-Dimensional Table... 5 Hiding and Showing Summary Values... 5 Adding New Data and
Instructions for Using the Databases
 Appendix D Instructions for Using the Databases Two sets of databases have been created for you if you choose to use the Documenting Our Work forms. One set is in Access and one set is in Excel. They are
Become strong in Excel (2.0) - 5 Tips To Rock A Spreadsheet!
 - 5 Tips To Rock A Spreadsheet!") Become strong in Excel (2.0) - 5 Tips To Rock A Spreadsheet! Hi folks! Before beginning the article, I just wanted to thank Brian Allan for starting an interesting discussion on what Strong at Excel means
Become strong in Excel (2.0) - 5 Tips To Rock A Spreadsheet! Hi folks! Before beginning the article, I just wanted to thank Brian Allan for starting an interesting discussion on what Strong at Excel means
Tutorial 5: Working with Excel Tables, PivotTables, and PivotCharts. Microsoft Excel 2013 Enhanced
 Tutorial 5: Working with Excel Tables, PivotTables, and PivotCharts Microsoft Excel 2013 Enhanced Objectives Explore a structured range of data Freeze rows and columns Plan and create an Excel table Rename
EXCEL BASICS: MICROSOFT OFFICE 2010
 EXCEL BASICS: MICROSOFT OFFICE 2010 GETTING STARTED PAGE 02 Prerequisites What You Will Learn USING MICROSOFT EXCEL PAGE 03 Opening Microsoft Excel Microsoft Excel Features Keyboard Review Pointer Shapes
Word: Print Address Labels Using Mail Merge
 Word: Print Address Labels Using Mail Merge No Typing! The Quick and Easy Way to Print Sheets of Address Labels Here at PC Knowledge for Seniors we re often asked how to print sticky address labels in
Making Excel Work for Your Tribal Community
 Making Excel Work for Your Tribal Community Excel Basics: Intermediate Skills PHONE: 1-800-871-8702 EMAIL: INFO@CBC4TRIBES.ORG WEB: TRIBALINFORMATIONEXCHANGE.ORG MAKING EXCEL WORK FOR YOUR TRIBAL COMMUNITY
Lastly, in case you don t already know this, and don t have Excel on your computers, you can get it for free through IT s website under software.
 Welcome to the EASE workshop series, part of the STEM Gateway program. Before we begin, I want to make sure we are clear that this is by no means meant to be an all inclusive class in Excel. At each step,
Advanced Excel Skills
 Advanced Excel Skills Note : This tutorial is based upon MSExcel 2000. If you are using MSExcel 2002, there may be some operations which look slightly different (e.g. pivot tables), but the same principles
EXCEL BASICS: MICROSOFT OFFICE 2007
 EXCEL BASICS: MICROSOFT OFFICE 2007 GETTING STARTED PAGE 02 Prerequisites What You Will Learn USING MICROSOFT EXCEL PAGE 03 Opening Microsoft Excel Microsoft Excel Features Keyboard Review Pointer Shapes
ITS Training Class Charts and PivotTables Using Excel 2007
 When you have a large amount of data and you need to get summary information and graph it, the PivotTable and PivotChart tools in Microsoft Excel will be the answer. The data does not need to be in one
Survey of Math: Excel Spreadsheet Guide (for Excel 2016) Page 1 of 9
 Page 1 of 9") Survey of Math: Excel Spreadsheet Guide (for Excel 2016) Page 1 of 9 Contents 1 Introduction to Using Excel Spreadsheets 2 1.1 A Serious Note About Data Security.................................... 2 1.2
Survey of Math: Excel Spreadsheet Guide (for Excel 2016) Page 1 of 9 Contents 1 Introduction to Using Excel Spreadsheets 2 1.1 A Serious Note About Data Security.................................... 2 1.2
To access BuckIQ, you must first be granted access. Send requests for permission to
 BuckIQ User s Guide Job Aid What is BuckIQ? Several years ago, Oracle took a look at the state of the Business Intelligence industry in terms of the different processes and applications that were required
Microsoft Excel Pivot Tables & Pivot Table Charts
 Microsoft Excel 2013 Pivot Tables & Pivot Table Charts A pivot table report allows you to analyze and summarize a million rows of data in Excel 2013 without entering a single formula. Pivot Tables let
Intermediate Excel 2013
 Intermediate Excel 2013 Class Objective: Elmhurst Public Library is committed to offering enriching programs to help our patrons Explore, Learn, and Grow. Today, technology skills are more than a valuable
Introduction to Microsoft Excel 2007
 Introduction to Microsoft Excel 2007 Microsoft Excel is a very powerful tool for you to use for numeric computations and analysis. Excel can also function as a simple database but that is another class.
Microsoft Excel 2010 Step-by-Step Exercises PivotTables and PivotCharts: Exercise 1
 Microsoft Excel 2010 Step-by-Step Exercises PivotTables and PivotCharts: Exercise 1 In this exercise you will learn how to: Create a new PivotTable Add fields to a PivotTable Format and rename PivotTable
New Perspectives on Microsoft Excel Module 5: Working with Excel Tables, PivotTables, and PivotCharts
 New Perspectives on Microsoft Excel 2016 Module 5: Working with Excel Tables, PivotTables, and PivotCharts Objectives, Part 1 Explore a structured range of data Freeze rows and columns Plan and create
Excel Level 1
 Excel 2016 - Level 1 Tell Me Assistant The Tell Me Assistant, which is new to all Office 2016 applications, allows users to search words, or phrases, about what they want to do in Excel. The Tell Me Assistant
Excel Tutorial 5: Working with Excel Tables, PivotTables, and PivotCharts. 6. You can use a table s sizing handle to add columns or rows to a table.
 Excel Tutorial 5: Working with Excel Tables, PivotTables, and PivotCharts TRUE/FALSE 1. The header row must be row 1. ANS: F PTS: 1 REF: EX 234 2. If you freeze the top row in a worksheet and press Ctrl+Home,
Excel Tips for Compensation Practitioners Weeks Pivot Tables
 Excel Tips for Compensation Practitioners Weeks 23-28 Pivot Tables Week 23 Creating a Pivot Table Pivot tables are one of the most amazing and powerful tools in Excel, but many users do not know how to
Microsoft Excel 2013/2016 Pivot Tables
 Microsoft Excel 2013/2016 Pivot Tables Creating PivotTables PivotTables are powerful data analysis tools. They let you summarize data in various ways and instantly change the view you use. A PivotTable
Excel 2007 New Features Table of Contents
 Table of Contents Excel 2007 New Interface... 1 Quick Access Toolbar... 1 Minimizing the Ribbon... 1 The Office Button... 2 Format as Table Filters and Sorting... 2 Table Tools... 4 Filtering Data... 4
EXCEL BASICS. Helen Mills META Solutions
 EXCEL BASICS Helen Mills META Solutions OUTLINE Introduction- Highlight Basic Components of Microsoft Excel Entering & Formatting Data, Numbers, & Tables Calculating Totals & Summaries Using Formulas Conditional
Instructions on Adding Zeros to the Comtrade Data
 Instructions on Adding Zeros to the Comtrade Data Required: An excel spreadshheet with the commodity codes for all products you want included. In this exercise we will want all 4-digit SITC Revision 2
Coding & Data Skills for Communicators Dr. Cindy Royal Texas State University - San Marcos School of Journalism and Mass Communication
 Coding & Data Skills for Communicators Dr. Cindy Royal Texas State University - San Marcos School of Journalism and Mass Communication Spreadsheet Basics Excel is a powerful productivity tool. It s a spreadsheet
Lastly, in case you don t already know this, and don t have Excel on your computers, you can get it for free through IT s website under software.
 Welcome to Basic Excel, presented by STEM Gateway as part of the Essential Academic Skills Enhancement, or EASE, workshop series. Before we begin, I want to make sure we are clear that this is by no means
Inserting or deleting a worksheet
 Inserting or deleting a worksheet To insert a new worksheet at the end of the existing worksheets, just click the Insert Worksheet tab at the bottom of the screen. To insert a new worksheet before an existing
SPREADSHEETS. (Data for this tutorial at
 SPREADSHEETS (Data for this tutorial at www.peteraldhous.com/data) Spreadsheets are great tools for sorting, filtering and running calculations on tables of data. Journalists who know the basics can interview
Excel Advanced
 Excel 2016 - Advanced LINDA MUCHOW Alexandria Technical & Community College 320-762-4539 lindac@alextech.edu Table of Contents Macros... 2 Adding the Developer Tab in Excel 2016... 2 Excel Macro Recorder...
Quick Guide for Excel 2015 Data Management November 2015 Training:
 http://pfw.edu Quick Guide for Excel 2015 Data Management November 2015 Training: http://pfw.edu/training Excel 2016 Data Management AutoFill and Custom Lists AutoFill 1. Select the range that contains
EXCELLING WITH ANALYSIS AND VISUALIZATION
 EXCELLING WITH ANALYSIS AND VISUALIZATION A PRACTICAL GUIDE FOR DEALING WITH DATA Prepared by Ann K. Emery July 2016 Ann K. Emery 1 Welcome Hello there! In July 2016, I led two workshops Excel Basics for
Pivot Tables in Excel Contents. Updated 5/19/2016
 Pivot Tables in Excel 2010 Updated 5/19/2016 Contents Setup a Pivot Table in Excel 2010... 2 General Field List Features... 4 Summing and Counting Together... 6 Grouping Date Data... 7 Grouping Non-Date
1.a) Go to it should be accessible in all browsers
 Go to it should be accessible in all browsers") ECO 445: International Trade Professor Jack Rossbach Instructions on doing the Least Traded Product Exercise with Excel Step 1 Download Data from Comtrade [This step is done for you] 1.a) Go to http://comtrade.un.org/db/dqquickquery.aspx
ECO 445: International Trade Professor Jack Rossbach Instructions on doing the Least Traded Product Exercise with Excel Step 1 Download Data from Comtrade [This step is done for you] 1.a) Go to http://comtrade.un.org/db/dqquickquery.aspx
PIVOT TABLES IN MICROSOFT EXCEL 2016
 PIVOT TABLES IN MICROSOFT EXCEL 2016 A pivot table is a powerful tool that allows you to take a long list of data and transform it into a more compact and readable table. In the process, the tool allows
Creating an Excel Pivot Table Manually
 It is easy to use Recommended PivotTables option for creating pivot tables. But you might prefer to create a pivot table manually. Prior to Excel 2013, manually creating a pivot table was your only option.
Select a report and click this to view it. Select a report and click this to change it.
 Quick Videos: A tutorial on creating reports. Shows reports you have created.s Not used by the county Reports pre-made by the county Reports pre-made by 4-H Online Shows reports and folders you have deleted.
Excel 1. Module 6 Data Lists
 Excel 1 Module 6 Data Lists Revised 4/17/17 People s Resource Center Module Overview Excel 1 Module 6 In this module we will be looking at how to describe a database and view desired information contained
ADD AND NAME WORKSHEETS
 1 INTERMEDIATE EXCEL While its primary function is to be a number cruncher, Excel is a versatile program that is used in a variety of ways. Because it easily organizes, manages, and displays information,
Excel 2013 PivotTables and PivotCharts
 Excel 2013 PivotTables and PivotCharts PivotTables... 1 PivotTable Wizard... 1 Creating a PivotTable... 2 Groups... 2 Rows Group... 3 Values Group... 3 Columns Group... 4 Filters Group... 5 Field Settings...
Good Byer Stores Australia Ltd Inventory - Whitegoods department
 Managing Data Lists Chapter 1 Excel has some excellent features that make working with lists easy. Lists of records can be sorted, searched and filtered to produce useful information. Good Byer Stores
Homework 1 Excel Basics
 Homework 1 Excel Basics Excel is a software program that is used to organize information, perform calculations, and create visual displays of the information. When you start up Excel, you will see the
Service Line Export and Pivot Table Report (Windows Excel 2010)
") Service Line Export and Pivot Table Report (Windows Excel 2010) In this tutorial, we will take the Service Lines of the Active Students only and only the most recent record to take a snapshot look at approximate
Service Line Export and Pivot Table Report (Windows Excel 2010) In this tutorial, we will take the Service Lines of the Active Students only and only the most recent record to take a snapshot look at approximate
Introductory Excel Walpole Public Schools. Professional Development Day March 6, 2012
 Introductory Excel 2010 Walpole Public Schools Professional Development Day March 6, 2012 By: Jessica Midwood Agenda: What is Excel? How is Excel 2010 different from Excel 2007? Basic functions of Excel
Microsoft Excel 2016 LEVEL 3
 TECH TUTOR ONE-ON-ONE COMPUTER HELP COMPUTER CLASSES Microsoft Excel 2016 LEVEL 3 kcls.org/techtutor Microsoft Excel 2016 Level 3 Manual Rev 11/2017 instruction@kcls.org Microsoft Excel 2016 Level 3 Welcome
Discover contextual commands Select tables, charts, or other objects in a workbook to reveal additional tabs.
 Microsoft MS Excel 2016 Quick Reference Guide Quick Start Guide Quick Access Toolbar Keep favourite commands permanently visible. Explore the ribbon See what Excel can do by clicking the ribbon tabs and
User Guide. DataInsight-Web
 User Guide DataInsight-Web Table of Contents DataInsight-Web... i Table of Contents... i Overview... 2 Documentation and Support... 2 Finding Data... 3 Keyword Search... 3 Basic Search... 3 Advanced Search...
Patricia Andrada Quick Guide Excel 2010 Data Management-July 2011 Page 1
 Patricia Andrada Quick Guide Excel 2010 Data Management-July 2011 Page 1 Excel 2010 Data Management AutoFill and Custom Lists AutoFill 1. Select the range that contains the initial value(s) of the series
plus ltd Reports- PIVOT Essentials # Quick Instructions- (ie Click On [CO]) Notes / screenshots Runs your PM data into Excel
![plus ltd Reports- PIVOT Essentials # Quick Instructions- (ie Click On [CO]) Notes / screenshots Runs your PM data into Excel](/thumbs/83/87076989.jpg "plus ltd Reports- PIVOT Essentials # Quick Instructions- (ie Click On [CO]) Notes / screenshots Runs your PM data into Excel") # Quick Instructions- (ie Click On [CO]) Notes / screenshots 1. SIMS Reports Run Report +Focus Student find the Report: PM to PIVOT (date) E (May need to CO Enable Content button on a yellow Ribbon bar
# Quick Instructions- (ie Click On [CO]) Notes / screenshots 1. SIMS Reports Run Report +Focus Student find the Report: PM to PIVOT (date) E (May need to CO Enable Content button on a yellow Ribbon bar
download instant at
 CHAPTER 1 - LAB SESSION INTRODUCTION TO EXCEL INTRODUCTION: This lab session is designed to introduce you to the statistical aspects of Microsoft Excel. During this session you will learn how to enter
Tutorial for downloading and analyzing data from the Atlantic Canada Opportunities Agency
 Tutorial for downloading and analyzing data from the Atlantic Canada Opportunities Agency The agency, which goes by the acronym ACOA, is one of many federal institutions that uploads data to the federal
1 Course Tallies and Lists with Designations
 1 Course Tallies and Lists with Designations 1.1 Quick Reports The following Quick Reports are available to assist with looking at class composition: Course Requests by Course with Designations: Build
Mastering the Actuarial Tool Kit
 Mastering the Actuarial Tool Kit By Sean Lorentz, ASA, MAAA Quick, what s your favorite Excel formula? Is it the tried and true old faithful SUMPRODUCT formula we ve all grown to love, or maybe once Microsoft
Excel Foundation Quick Reference (Windows PC)
") Excel Foundation Quick Reference (Windows PC) See https://staff.brighton.ac.uk/is/training/pages/excel/foundation.aspx for videos and exercises to accompany this quick reference card. Structure of a spreadsheet
Excel Foundation Quick Reference (Windows PC) See https://staff.brighton.ac.uk/is/training/pages/excel/foundation.aspx for videos and exercises to accompany this quick reference card. Structure of a spreadsheet
File Name: Data File Pivot Tables 3 Hrs.xlsx
 File Name: Data File Pivot Tables 3 Hrs.xlsx Lab 1: Create Simple Pivot Table to Explore the Basics 1. Select the tab labeled Raw Data Start and explore the data. 2. Position the cursor in Cell A2. 3.
LEIAG-Excel Workshop
 Random Sample Excel has a simple formula we can utilize to obtain a random sample (cases, citations, city, etc.) At the Sheriff s Department, we are able to run a case management report that generates
DOING MORE WITH EXCEL: MICROSOFT OFFICE 2013
 DOING MORE WITH EXCEL: MICROSOFT OFFICE 2013 GETTING STARTED PAGE 02 Prerequisites What You Will Learn MORE TASKS IN MICROSOFT EXCEL PAGE 03 Cutting, Copying, and Pasting Data Basic Formulas Filling Data
At least one Charley File workbook for New Excel. This has an xlsx extension and is for PC Excel 2007, Mac Excel 2008, and after.
 Getting Started By Charley Kyd Kyd@ExcelUser.com Welcome to Charley s Swipe Files! My personal collection of charts and tables clipped from magazines and newspapers is a valuable resource for me. I hope
Designed by Jason Wagner, Course Web Programmer, Office of e-learning NOTE ABOUT CELL REFERENCES IN THIS DOCUMENT... 1
 Excel Essentials Designed by Jason Wagner, Course Web Programmer, Office of e-learning NOTE ABOUT CELL REFERENCES IN THIS DOCUMENT... 1 FREQUENTLY USED KEYBOARD SHORTCUTS... 1 FORMATTING CELLS WITH PRESET
Introduction to Excel
 Introduction to Excel Written by Jon Agnone Center for Social Science Computation & Research 145 Savery Hall University of Washington Seattle WA 98195 U.S.A. (206)543-8110 November 2004 http://julius.csscr.washington.edu/pdf/excel.pdf
Enterprise Timetabler Beginners Training Worksheet 1
 Enterprise Timetabler Beginners Training Worksheet 1 1. Basic Customisation of the Enterprise Interface It is possible to change the default layouts of the Activity and View panes to show extra information
Working with Data in Microsoft Excel 2010
 Working with Data in Microsoft Excel 2010 This document provides instructions for using the sorting and filtering features in Microsoft Excel, as well as working with multiple worksheets in the same workbook
Tutorial for downloading and analyzing data from the Atlantic Canada Opportunities Agency
 Tutorial for downloading and analyzing data from the Atlantic Canada Opportunities Agency The agency, which goes by the acronym ACOA, is one of many federal institutions that uploads data to the federal
Chapter 7 Notes Chapter 7 Level 1
 Chapter 7 Notes Chapter 7 Level 1 Page 426 Open the Alaska Retailers file from your Chapter 7 data files in Moodle and save it on your computer, either in your files or on your desk top. Just remember
Top 15 Excel Tutorials
 Top 15 Excel Tutorials Follow us: TeachExcel.com Contents How to Input, Edit, and Manage Formulas and Functions in Excel... 2 How to Quickly Find Data Anywhere in Excel... 8 How to use the Vlookup Function
4HOnline has a powerful report system that allows you to take an existing report, customize it to suit your needs, and then save it to use again.
 4HOnline USING AND CREATING REPORTS Created: October 14, 2013 OVERVIEW 4HOnline has a powerful report system that allows you to take an existing report, customize it to suit your needs, and then save it
Microsoft Access 2016 Intro to Select Queries
 Microsoft Access 2016 Intro to Select Queries training@health.ufl.edu Access 2016: Intro to Select Queries 2.0 hours Queries compile data from tables into a desired dataset. You can choose multiple fields
Using Microsoft Excel
 Using Microsoft Excel Excel contains numerous tools that are intended to meet a wide range of requirements. Some of the more specialised tools are useful to people in certain situations while others have
ABOUT PIVOTTABLES TABLE OF CONTENTS
 University of Southern California Academic Information Services Excel 2007 - PivotTables ABOUT PIVOTTABLES PivotTables provide an excellent means of analyzing data stored in database format by rearranging
Working with Macros. Creating a Macro
 Working with Macros 1 Working with Macros THE BOTTOM LINE A macro is a set of actions saved together that can be performed by issuing a single command. Macros are commonly used in Microsoft Office applications,
Les s on Objectives. Student Files Us ed. Student Files Crea ted
 Lesson 10 - Pivot Tables 103 Lesson 10 P ivot T ables Les s on Topics Creating a Pivot Table Exercise: Creating a Balance Summary Formatting a Pivot Table Creating a Calculated Field Les s on Objectives
TUTORIAL Get Started with Tableau Desktop
 TUTORIAL Get Started with Tableau Desktop Learn how to connect to data, create data visualizations, present your findings, and share your insights with others. http://onlinehelp.tableau.com/current/guides/get-started-tutorial/en-us/get-started-tutorialhome.html
Chapter-2 Digital Data Analysis
 Chapter-2 Digital Data Analysis 1. Securing Spreadsheets How to Password Protect Excel Files Encrypting and password protecting Microsoft Word and Excel files is a simple matter. There are a couple of
Advanced Excel Charts : Tables : Pivots
 Advanced Excel Charts : Tables : Pivots Protecting Your Tables/Cells Protecting your cells/tables is a good idea if multiple people have access to your computer or if you want others to be able to look
PivotTables & Charts for Health
 PivotTables & Charts for Health Data Inputs PivotTables Pivot Charts Global Strategic Information UCSF Global Health Sciences Version Malaria 1.0 1 Table of Contents 1.1. Introduction... 3 1.1.1. Software
Introduction to Access 97/2000
 Introduction to Access 97/2000 PowerPoint Presentation Notes Slide 1 Introduction to Databases (Title Slide) Slide 2 Workshop Ground Rules Slide 3 Objectives Here are our objectives for the day. By the
Pivot Tables. This is a handout for you to keep. Please feel free to use it for taking notes.
 Class Description This is an introduction to using Pivot Tables in spreadsheets, focusing on Microsoft Excel. Attendees should have a good basic knowledge of spreadsheets. Class Length One and one half
Designing Your Teacher Page. Medora Community School Corporation
 Designing Your Teacher Page Medora Community School Corporation Introduction This tutorial will show you the basics of creating and running your teacher page on the Medora Community Schools website. This
Microsoft Excel 2010 Training. Excel 2010 Basics
 Microsoft Excel 2010 Training Excel 2010 Basics Overview Excel is a spreadsheet, a grid made from columns and rows. It is a software program that can make number manipulation easy and somewhat painless.
WAAT-PivotTables Accounting Seminar
 WAAT-PivotTables-08-26-2016-Accounting Seminar Table of Contents What does a PivotTable do?... 2 How to create PivotTable:... 2 Add conditions to the PivotTable:... 2 Grouping Daily Dates into Years, Quarters,