Perceptive Intelligent Capture Visibility
|
|
|
- Kimberly Fowler
- 5 years ago
- Views:
Transcription
1 Perceptive Intelligent Capture Visibility User Guide Version: 3.1.x Written by: Product Knowledge, R&D Date: February 2016
2 2015 Lexmark International Technology, S.A. All rights reserved. Lexmark is a trademark of Lexmark International Technology, S.A., or its subsidiaries, registered in the U.S. and/or other countries. All other trademarks are the property of their respective owners. No part of this publication may be reproduced, stored, or transmitted in any form without the prior written permission of Lexmark.
3 Table of Contents Introduction... 7 Visibility user interface... 8 Log in... 8 Visibility Web Portal... 8 Visibility Header toolbar... 8 Navigation Sidebar menu... 8 Main viewer area Dashboards Taskbar Navigation tab Input Parameter Form Dashboard viewer Intelligent Capture reports Capture reports PIC Average Extraction report PIC Average Extraction by Date report PIC Classification Detail report PIC Classification Summary report PIC Current Status report PIC Document Snapshot report PIC Document Throughput Detail report PIC Document Throughput Summary chart PIC Extraction chart PIC Extraction Chart by date PIC Extraction Performance by Document Class report PIC Extraction Statistics report PIC Extraction Statistics by Date report PIC Field Extraction Exception report PIC Field Extraction Exception report PIC Field Extraction Results report PIC Field Value Comparison report PIC Incorrect Fields Summary report PIC Invalid Fields Count report
4 PIC Invalid Reason Detail report PIC Invalid Reason Summary report PIC Missing Decimals report PIC Page Count report PIC Snapshot Class Extraction report PIC Snapshot Statistics report PIC Throughput Summary report PIC Throughput Summary Aging report PIC Throughput Summary Aging by Date report PIC Throughput Summary by Date report PIC Purge Document report PIC Archive Reporting Documents report Verifier Reports PIC Classification Verified by User report PIC Classification Verifier Summary report PIC Docs Processed by Day report PIC Extraction Verified by Day by User report PIC Extraction Verified by User report PIC Extraction Verified Count by Hour report PIC Extraction Verifier Summary report Accounts Payable reports PIC Average Extraction with Line Pairing report PIC Field Extraction by Vendor report PIC Invoice Discovery report PIC Invoice Discovery Historical report PIC Line Pairing Document Snapshot report PIC Line Pairing Statistics report PIC Snapshot Invoice report PIC Vendor Snapshot Statistics report Report scheduling activities Jobs Job List Filter Area List Area Jobs Configuration page
5 Job and task details Run Run As Notification Advanced options Close the Jobs Configuration page Jobs execution status Filters area Jobs summary List area Tasks Task list Filter area List area Task configuration page Task page header Operational parameters Report Parameters MultiSet parameters About task information without Visibility web interface Download the task information Upload the task information Schedules The Schedule List The Filter area The List area The Schedule configuration page Schedule page header Select Frequency details Selecting Time for implementing the schedule Visibility Dashboards Design, View, and Availability Design a dashboard Create Dashboards Dashboard Preferences
6 Select dashboard for viewing Manage dashboards Access rights to dashboards Dashboard properties Input Parameter form Widget Designer Design a Real Time Report widget Design a pre-generated report widget Design a web link widget How to use and manage reports Report repository Run a report Customize reports and configure properties Manage reports Manage folders and reports Report notifications Customize reports Report objects Query Object Editor Parameter Object Editor Parameter Value Groups Deploy a Report Bundle Appendix Data Tables BRWDocument BRWDistillerFields BRWDocStatusDesc BRWDocStatus BRWDocImage BRWlpstatus
7 Introduction Perceptive Intelligent Capture Visibility (PIC Visibility) is a web-based reporting tool that allows users to view adhoc and custom reports from their Intelligent Capture data. This product gives users insight and visibility into their processed data at any point in time. Visibility is a white-labeled product from Intellicus. The product requires a Windows Operating system for installation. It also requires a client provided reporting database that can be Oracle or Microsoft SQL. Note It is not recommended that you install PIC Visibility on the same server as Intelligent Capture. The images that Visibility uses are pulled directly from within a database or from a file-based folder. Visibility includes several components that allow you to customize your reporting. The components are: Report Server. This component is an independent process that handles reporting needs by all users who are generating reports through various Visibility reporting components. Web Studio Report Designer. Use this web-based designer GUI within the web portal. You can design and preview any complex report and deploy it on the report server using wizards, drag and drop functionality, and scripting features. Web Portal. An end user accesses the web portal to generate reports; an Administrator uses the portal to design, deploy, and manage reports as well as to perform any administrative tasks. Adhoc Report Wizard. This component allows users to design adhoc reports on their own with groupings, summaries, and charts. Report Viewer. The viewer presents the report output to the end user. It allows the user to view, save, print, and export reports. Adhoc Power Viewer. This is an extension of the report viewer. The power viewer allows the user to re-organize information on an adhoc report including the ability to regroup, resort data, and redraw charts for adhoc reports in realtime. It also helps users categorize, summarize, and analyze their information. Dashboard. This is a collection of interactive and auto-refreshed reports and charts from various data sources. The information displays within a single screen. Scheduler. This component allows users to run reports at a pre-specified time or on a recurring basis. Scheduler also allows users to distribute the reports to one or more destinations using variety of outlets such as , FTP, or printers. 7
8 Visibility user interface The PIC Visibility user interface requires the user to log in, access the Visibility web portal, and take advantage of the options available to create reports. Log in To log in to PIC Visibility, complete the following steps. 1. Open PIC Visibility in a web browser to access the Login screen. 2. Enter your user credentials provided by your administrator and click OK. 3. From the Options button, select the organization that contains the reports you want to review. Visibility Web Portal The PIC Visibility Web Portal offers a simple and fast user interface from which you can access all reports and configurations on one screen. The look and feel is similar to a website with menus, active elements, and hyperlinks. Tooltips explain the functionality of buttons. The Help button provides context-sensitive help information. The user interface contains the following elements. Visibility Header toolbar Navigation Sidebar menu Main Viewer Area Visibility Header toolbar The Header toolbar provides a quick overview of the program status. This toolbar is always visible at the top of all PIC Visibility panes. On the right side of the toolbar is a gear icon that allows quick access to database connection settings, logout options, and server statistics. Navigation Sidebar menu The Navigation Sidebar menu contains the main PIC Visibility menu, which consist of the following options: Navigation, Reports, Data Model, Favorites, and Home. To view the Navigation Sidebar menu options, complete the following steps. 1. Click the selected menu icon to open the related submenu. 2. To close the submenu, click outside of the submenu area. Navigation menu The Navigation menu displays the main functions of PIC Visibility, which include Dashboards, Reports, Schedule, Design, and more. All submenus open in the main viewer area. Selecting the submenu item from the Navigation menu allows you to switch to the appropriate submenu display within the main viewing area. 8
9 Reports menu The Reports menu displays all category and report related tasks. The initial menu that displays when you select this option is a list of the report categories. For example, you can view Accounts Payable or Verifier information. To open a list of reports contained in a specific category, complete the following steps. 1. Select the Category option. When you click on a report title, an additional sliding menu displays. The Clicking a report title menu opens an additional sliding menu that displays differently based on whether you have selected a specific report. If no report is selected, the list of options is related to the category selected. If a report is selected, the list of options pertains to the selected report. 2. Click the Category list to return to the list of reports and select another option. Data Model menu The Date Model menu displays all available objects and categories. From this menu, you can access saved reports, query objects, parameter objects, and dashboards. Clicking a selection on the initial submenu opens an additional pane that shows the related objects. In addition, a sliding menu displays to the right and the tasks available in the menu vary based on the submenu option you select. Favorites menu The Favorites menu displays access to all objects or reports that are designated as favorites. This selection varies for each user. Your selection can display report categories, individual reports, objects, parameters, and more. You can add objects and reports to the favorites list by using the Add to Favorites task on the sliding menu when working within the other menu and submenu lists described previously. To remove items from the favorites list, use the Delete from Favorites task on the sliding menu. Note The object or report is not removed from the system. It is only removed from the user s favorite list. The system administrator is the only person who can delete objects or reports from the system. Home page The Home page is the central information location for user activity. Different information panels display depending on the user s rights. The Home page is set as a starting page after you log in when no dashboard is subscribed or can be accessed by selecting Home from the sliding menu. The Home page contains the following elements. My recent Reports. Displays a list of the recently run reports of the current user. Execution Status and Recent Errors. Collects important status information and error messages on reports. Portal Preferences. Manages the default user settings. My Links. Locates the most important sites in the Web Portal. All links open in a new window or tab depending on your browser settings. 9
10 Main viewer area The main viewer area displays the variable content for PIC Visibility based on the action or selection of the user. All main configuration panels and lists display within the viewer area. The initial display for the main viewer area is a dashboard if the user subscribed to a dashboard, otherwise the Home page displays. Dashboards The Dashboard viewer displays the following elements. Taskbar Navigation tab Input Parameter Form Dashboard Viewer To return to the dashboard viewer after using the viewer for other tasks, from the Sidebar menu, select Navigation > Dashboards > View. Taskbar The Dashboard taskbar is a grey gear located in the upper-right corner of the dashboard. The following options are available from the Dashboard toolbar. Switch to Edit Mode. Select this option to change the dashboard to edit mode, which allows access to dashboard settings, the ability to add widgets, and the option to save the dashboard. Subscribe. Select this option to subscribe to the dashboard. Open in New Window. Select to open the full screen view of the dashboard in a new window. Help. Select this option to access the online help Navigation tab When multiple dashboards are opened, you can access them through the navigation tab, which displays at the top, left of the dashboard. You can select a tab on the dashboard viewer to view a dashboard. Input Parameter Form To access the Input Parameter Form, complete the following steps. 1. Select the drop-down to the right of the Dashboard name. 2. Select Parameters. For details on the Input Parameter Form, refer to the Input Parameter Form section. 10
11 Dashboard viewer The Dashboard viewer shows the report widgets that the user preselects. Each report widget has its own foldout title bar with action buttons to minimize or maximize the widget. A foldout taskbar is available for adhoc reporting below the title bar. This taskbar provides access to the Adhoc Power Viewer settings. To access the Dishoard viewer, complete the following steps. 1. Move the pointer over the icons to view the tooltips. If no tooltip displays, there is no drilldown function. 2. Left-click the icons to open a submenu or execute the associated function. 3. After you access the available functions, you can select one of the following features to manage your reports: Change Chart type, Link Chart with Report Fields, Change Data, or Reset Changes. 4. Right-click the taskbar to open a submenu of available options. 5. Customize the Adhoc Report in the context menu. For example, you can show and group data or change templates. Change the size of each widget display by dragging the sides of the page to the desired position. Intelligent Capture reports PIC Visibility provides a multitude of customized reports. You can select reports from the following categories: Capture, Verifier, and Accounts Payable. Customized reports are available from the Custom folder. Capture reports This section provides a list of capture reports available with PIC Visibility as well as the filter parameters and output for each report. PIC Average Extraction report This is an at-a-glance chart that displays field extraction percentages and document straight through processing (STP) percentage results for user selected fields from today, yesterday, the last 7 days, and the last 30 days. Organization Project Client ID Extraction Fields The organization associated with the documents The project from which the reports are pulling data The client documents that should be included in the report results The fields that should be included in calculating Field Level Extraction 11
12 Report Output % Correct The percentage of fields that are correctly extracted by Intelligent Capture and do not require Verifier correction % STP The percentage of Straight Through Processing of documents that run straight through Intelligent Capture without human intervention Drill Down Click the Bar Chart Destination PIC Snapshot Statistics PIC Average Extraction by Date report This is an at-a-glance chart that shows the field extraction percentage and document straight through process (STP) percentage results for user selected fields from a specified day, the day before, the previous 7 days, and the previous 30 days. User-defined thresholds for Normal, Warning, and Critical are also shown next to the chart. Selected Date Organization Project Client ID Extraction Fields The start date the user selects for the report The organization the user associates with the documents The project from which the reports are pulling data The client documents that the user includes in the report results The fields that the user includes to calculate Field Level Extraction Report Output 1 % Correct The percentage of the fields that are correctly extracted by Intelligent Capture and do not require Verifier correction 2 % STP The percentage of Straight Through Processing of documents that run straight through Intelligent Capture without human intervention 3 Specified Date The date entered in select date fields in report parameters 4 Status Bars The user defined threshold status 12
13 PIC Classification Detail report This report shows a list of documents that require manual classification through the Verifier within a selected time range. The report utilizes the Project Generic Class and Project Generic Parent Class parameters for a project with Supervised Learning Workflow. Selected Date Range Organization Project Client ID Class Name Generic Class Generic Parent Class The start and end dates the user selects for the report The organization associated with the documents The project from which the reports are pulling data The client documents you must include in the report results The project level classes you want to include in the report The generic class in the project that is moved to a parent class post extraction. If the documents Generic Class = Parameter Value and Generic Parent Class = Parameter Value, the document is considered classified correctly. The parent class in the project to which a generic class document is moved post extraction. If the documents Generic Class = Parameter Value and Generic Parent Class = Parameter Value, the document is considered classified correctly. Report Output 1 Document No. The unique document identifier determined by Intelligent Capture. The default is the image name. 2 RTS Classname The project class to which the RTS classified the document 3 Final Classname The project class to which a Verifier user classified the document 4 Link The link that opens to an image of the document Drill Down Document No. Link Destination The PIC Field Extraction Results The link that opens to an image of the document 13
14 PIC Classification Summary report This report displays the percentage of documents correctly classified and the number of documents misclassified for a given date range. The report utilizes the Project Generic Class and Project Generic Parent Class parameters for project that utilized the Supervised Learning Workflow. Selected Date Range Organization Project Client ID Generic Class Generic Parent Class The start and end dates selected by the user for the report The organization associated with the documents The project from which the reports are pulling data The client documents that should be included in the report results The generic class in the project that is moved to a parent class post extraction. If the documents Generic Class = Parameter Value and Generic Parent Class = Parameter Value, the document is considered classified correctly. The parent class in the project to which a generic class document is moved post-extraction. If the documents Generic Class = Parameter Value and Generic Parent Class = Parameter Value, the document is considered classified correctly. Report Output 1 Final Classname The project class that documents belonged to upon export 2 % Correct The automatic classification level for a given class 3 Mis-Classified The number of documents that were incorrectly classified by RTS Drill Down Final Classname Destination The PIC Classification Detail 14
15 PIC Current Status report This is a list of documents that are processed for a selected event for the current date and time. You can select the status within Intelligent Capture as well as a list of all documents in a specific Intelligent Capture state. Current State Organization Project Client ID The field that shows the state of the documents The organization associated with the documents The project from which the reports are pulling data The client documents that should be included in the report results Report Output 1 Document No. The unique document identifier determined by Intelligent Capture The default is the image name. 2 Import Date The date on which a document is imported into Intelligent Capture 3 Status The current status of the document 4 Export Date The date on which a document is exported from Intelligent Capture 5 Link The link that opens to an image of the document Drill Down Doc No Destination The PIC Field Extraction Results 15
16 PIC Document Snapshot report This is a list of documents processed in a given date range that show the date of import, extraction, and export. You can also click on a link to the document on this page to view it. Selected Date Range Document Class Organization Project Extraction Fields Client ID The date range selected by the user for each report The class of the documents, such as invoices, credit memos, remittances, and sales orders The organization associated with the documents The project from which the reports are pulling data The fields that should be included in calculating Field Level Extraction The client documents that should be included in the report results Report Output 1 Document No. The unique document identifier determined by Intelligent Capture. The default is the image name. 2 Import Date The date on which a document is imported into Intelligent Capture 3 Extract Date The date on which a document information is extracted with Intelligent Capture 4 Export Date The date on which a document is exported from Intelligent Capture 5 Link The link that opens to an image of the document Drill Down Document No Link Destination The PIC Field Extraction Report The link that opens to an image of the document 16
17 PIC Document Throughput Detail report This report shows the average processing time in hours on the header along with the organization, project, beginning date, and ending date that the user selected as filters. The report displays process start and end times per document while averaging the processing time for all documents in the elected date range. Selected Date Range Organization Project Client ID The date range selected by the user for each report The organization associated with the documents The project from which the reports are pulling data The client documents that should be included in the report results Report Output 1 Average Process Time The average time it takes to process a document from start to finish 2 Document No. The unique document identifier determined by Intelligent Capture. The default is the image name. 3 Org ID The ID number of the organization, such as the company code. 4 Working Hrs. The time it took to process a document from start to finish 5 Process Start The time at which the document was first imported in to Intelligent Capture 6 Process End The time that the document was exported from Intelligent Capture 7 Link The link that opens to an image of the document Drill Down Document No Link Destination The PIC Field Extraction Results The link that opens to an image of the document 17
18 PIC Document Throughput Summary chart This report displays a pie chart that graphically illustrates the total documents and average processing time to process each document. The top bucket parameter allows you to define the documents you want to group if the processing time exceeds the specified processing time frame. Top bucket defaults to 36 hours; however, it is configurable. If set above 40 hours, the chart converts to a bar chart for easier viewing. You can then drilldown on the specific fields to view the documents. Selected Date Range Organization Project Client ID The date range selected by the user for each report The organization associated with the documents The project from which the reports are pulling data The client documents that should be included in the report results Drill Down Pie Chart Destination The PIC Document Throughput Detail Report PIC Extraction chart This is an at-a-glance view of field extraction percentage for user-selected fields by period within defined thresholds of Normal, Warning, and Critical. This information displays as a gauge chart. Selected Date Range Organization Project Extraction Fields Client ID The date range selected by the user for each report The organization associated with the documents The project from which the reports are pulling data The fields that should be included in calculating Field Level Extraction The client documents that should be included in the report results 18
19 PIC Extraction Chart by date This is an at-a-glance view of field extraction percentage for user-selected fields with the ability to choose start date and displays if the percentage is within the user-defined ranges of Normal, Warning, and Critical. Search Date Selected Date Range Organization Project Extraction Fields Client ID The beginning date used by the Selected Date Range when running the report. The date range selected by the user for each report The organization associated with the documents The project from which the reports are pulling data The fields that should be included in calculating Field Level Extraction The client documents that should be included in the report results PIC Extraction Performance by Document Class report This report is the adhoc version of the Extraction Performance by Document Class Report. For each document class, this report shows a statistical summary by percentages that were verified, correct, or not on document, and the percentage of documents with STP for all selected fields. Adhoc reports allow a user to modify the report so that it meets the user s desired style and format, such as re-arrange fields, format fields, show fields that are hidden, and hide fields. Selected Date Range Organization Project Client ID Extraction Fields The date range selected by the user for each report The organization associated with the documents The project from which the reports are pulling data The client documents that should be included in the report results The fields that should be included in calculating Field Level Extraction Report Output 1 %Verified The percentage of a specific fields that have been verified 2 %Correct The percentage of the fields that have been correctly extracted by Intelligent Capture 19
20 Report Output 3 %Not on Document The percentage of a specific fields that are not on a document 4 % STP The percentage of documents that run straight through Drill Down Document Class Destination The PIC Snapshot Class Extraction PIC Extraction Statistics report This report provides a summary of processing statistics including number of documents and fields processed, percentage of fields verified, correct, and not on document, and the percentage of documents with Straight Through Processing (STP) for today, yesterday, the past 7 days, and the past 30 days. Percent Verified reflects the percentage of fields that stopped in Verifier and required validation based on confidence threshold and required a correction to a field. Organization Project Client ID Extraction Fields The organization associated with the documents The project from which the reports are pulling data The client documents that should be included in the report results The fields that should be included in calculating Field Level Extraction Report Output 1 %Verified The percentage of a specific field that has been verified 2 %Correct The percentage of the fields that have been correctly extracted by Intelligent Capture 3 %Not on Document The percentage of a specific fields that is not on a document 4 % STP The percentage of documents that run straight through 20
21 PIC Extraction Statistics by Date report This report provides a summary of processing statistics including number of documents and fields processed, percentage of fields verified, correct, and not on document, and percentage of documents with Straight Through Processing (STP) for a specified date. Percent Verified reflects percentage of fields that stopped in Verifier and required validation based on confidence threshold and required a correction to a field. Search Date Organization Project Client ID Extraction Fields The date used when running the report. The organization associated with the documents The project from which the reports are pulling data The client documents that should be included in the report results The fields that should be included in calculating Field Level Extraction Report Output 1 %Verified The percentage of a specific fields that has been verified 2 %Correct The percentage of the fields that have been correctly extracted by Intelligent Capture 3 %Not on Document The percentage of a specific fields that do not appear not on a document 4 % STP The percentage of documents that run straight through PIC Field Extraction Exception report This report is an adhoc version of the Field Extraction Exception Report. Adhoc reports allow a user to modify the report so that it meets the users desired style and format such as rearrange fields, format fields, show fields that are hidden, and hide fields. Selected Date Range Organization Project Client ID The date range selected by the user for each report The organization associated with the documents The project from which the reports are pulling data The client documents that should be included in the report results 21
22 Class Name Extraction Fields The project level classes to be used within the report The fields that should be included in calculating Field Level Extraction Report Output 1 Document No. The unique document identifier determine by Intelligent Capture. The default is the image name. 2 Extracted Value The value of the field that was extracted 3 Final Value The value of the field that has been changed by a verifier 4 Confidence The confidence that the extracted field is correct 5 Distance The distance that the extracted field is from the next logical choice 6 Link The link that opens to an image of the document Drill Down Document No Link Destination The PIC Field Extraction Results The link that opens to an image of the document PIC Field Extraction Exception report This report provides a lists of all documents in a selected date range where extracted value and final value were different. Selected Date Range Extraction Fields Organization Project Client ID The date range selected by the user for each report The fields that should be included in calculating Field Level Extraction The organization associated with the documents The project from which the reports are pulling data The client documents that should be included in the report results 22
23 Report Output 1 Extracted Value The value of the field that was extracted 2 Final Value The value of the field following modification by a verifier 3 Confidence The confidence that the extracted field is correct Drill Down Document No Link Destination The PIC Field Extraction Results The link that opens to an image of the document PIC Field Extraction Results report The Field Extraction Results Report allows the search for a particular document as it is listed in the database. The report displays the field extraction results for the extraction field names that were selected by the user. Document No. Extraction Fields The unique document identifier determined by Intelligent Capture. The default is the image name. The fields that should be included in calculating Field Level Extraction Report Output 1 Field Extraction Status The output that shows if the field extracted was valid or invalid 2 Detail The output that shows if the field extracted was automatic, semi-automatic, or manual 3 OCR Rejected The output that shows if the field was rejected by the OCR engine 4 Extracted Value The value of the field that was extracted 5 Final Value The value of the field that was modified by a verifier 23
24 Report Output 6 No. Of Candidates The number of potential candidates for a given field 7 Confidence The confidence that the extracted field is correct 8 Distance The distance that the extracted field is from the next logical choice PIC Field Value Comparison report This report displays a pie chart, the report details for the extracted value, and the final value for fields where either the extracted value contains the final value or the final value contains the extracted value. Use this information to analyze documents where certain characters were misread through OCR or incorrectly removed, or were included in the final value through project settings. Selected Date Range Organization Project Extract Field The date range selected by the user for each report The organization associated with the documents The project from which the reports are pulling data The fields that need to should be included in the report. Note It is not recommended to use the InvoiceType field within this report as it can skew the results due to the fact the PO vs. NO-PO is always returned from the query. Client ID The client documents that should be included in the report results Report Output 1 Document No The unique document identifier determined by Intelligent Capture. The default is the image name. 2 Field Name The project level field name by which documents are grouped within the report 3 Extracted Value The value of the field that was extracted 4 Final Value The value of the field that has been modified by a verifier 5 Link The link that opens to an image of the document 24
25 Drill Down Document No Link Destination The PIC Field Extraction Results The link that opens to an image of the document PIC Incorrect Fields Summary report This report displays a pie chart along with report details for the number of documents that are passed to Verifier for correction or validation. The documents are grouped by the number of fields that a Verifier user needs to correct. The report groups range from 0 fields to 5 fields corrected. The 0 value signals that the document was sent to Verifier for validation logic but the user did not need to change any of the extracted data. Use this report to evaluate business rules and target fields that could improve STP rates. Selected Date Range Organization Project Extraction Fields Client ID The date range selected by the user for each report The organization associated with the documents The project from which the reports are pulling data The fields that should be included in calculating Field Level Extraction The client documents that should be included in the report results Report Output 1 Number of Fields Corrected The number of fields that had to be changed by a Verifier user 2 Document Count The number of documents grouped by the Number of Fields Corrected Drill Down Number of Fields Corrected Destination The PIC Invalid Fields Count 25
26 PIC Invalid Fields Count report This report displays a pie chart along with report details. The number of documents that went to Verifier for correction or validation display based on the number of fields a Verifier user needs to correct. The report allows users to choose from 0 fields to 5 fields corrected where 0 means that the documented was sent to Verifier due to validation logic. However, the user did not need to change any of the extracted data. Use this report to evaluate business rules and target fields for improving STP rates. Selected Date Range Organization Project Number of Corrected Fields Extraction Fields Client ID The date range selected by the user for each report The organization associated with the documents The project from which the reports are pulling data The 0 to 5 selection of the number of fields that required manual verification The fields that should be included in calculating Field Level Extraction The client documents that should be included in the report results Report Output 1 Field Name The project field name that had required verification 2 Document Count The number of documents grouped by the Field Name 3 Document Number The unique document identifier determined by Intelligent Capture. The default is the image name. 4 Extracted Value The value of the field that was extracted 5 Final Value The value of the field following verification Drill Down Document Number Destination The PIC Field Extraction Results 26
27 PIC Invalid Reason Detail report This report lists those documents that were exported with a given invalid reason. Invalid Reason Selected Date Range Organization Project Client ID The Invalid Reason selected by the user when running the report The date range selected by the user when running the report The organization associated with the documents The Intelligent Capture project from which the reports are pulling data The client documents that should be included in the report results Report Output 1 Invalid Reason The Invalid Reason description selected for the document 2 Document No The unique document identifier determined by Intelligent Capture. The default is the image name. 3 Link The link to an image of the document Drill Down Document No Link Destination The PIC Field Extraction Results The link that opens to an image of the document PIC Invalid Reason Summary report This report lists the number of documents that were exported with an invalid reason where the RTS Invalid Reason value did not match the final Invalid Reason value. Selected Date Range Organization Project Client ID The date range selected by the user when running the report The organization associated with the documents The Intelligent Capture Project from which the reports are pulling data The client documents that should be included in the report results 27
28 Report Output 1 Invalid Reason The Invalid Reason description selected for the documents 2 # Docs The number of documents which a Verifier user selected the invalid reason for export Drill Down Invalid Reason Destination The PIC Invalid Reason Detail PIC Missing Decimals report This report displays a pie chart along with report details. This report shows the user selected Amount fields where the only difference between the extracted value and the final value is a decimal place character or a comma character. Selected Date Range Organization Project Amount Fields Client ID The date range selected by the user for each report The organization associated with the documents The project from which the reports are pulling data The Amount Fields that should be included in the comparison. The client documents that should be included in the report results Report Output 1 Document No. The unique document identifier determined by Intelligent Capture. The default is the image name. 2 Field Name The project field name which had required verification 3 Extracted Value The value of the field that was extracted 4 Verified Value The value of the field following verification 5 Link The line that opens to an image of the document 28
29 Drill Down Document No. Link Destination The PIC Field Extraction Results The link that opens to an image of the document PIC Page Count report This report displays the number of documents processed, totals pages processed, and total OCRed pages for a given time frame grouped by month. Selected Date Range Organization Project Client ID The date range selected by the user for each report The organization associated with the documents The project from which the reports are pulling data The client documents that should be included in the report results Report Output 1 Processed Date The date on which the documents were processed 2 Documents Processed The sum of the documents processed on a given date 3 Total Pages The sum of the pages processed on a given date 4 Total OCR Pages The sum of the pages OCRed on a given date PIC Snapshot Class Extraction report This report displays the Field Level Extraction rates and the percentages Verified for each field in an area chart along with a filterable table of the fields and their Extraction and Verification percentages. Selected Date Range Organization Project The date range selected by the user for each report The organization associated with the documents The project from which the reports are pulling data 29
30 Client ID Class Name Extraction Fields The client documents that should be included in the report results The project level classes to be used within the report The fields that should be included in calculating Field Level Extraction Report Output 1 Field Name The project field name 2 Num of Docs The number of documents that included the field 3 % Verified The percentage of a specific field that has been verified 4 % Correct The percentage of time the field was correctly extracted by Intelligent Capture 5 % Not On Document The percentage of a specific field that is not on a document Drill Down Field Name Destination The PIC Field Extraction Exception Report PIC Snapshot Statistics report For each document class, this report shows a statistical summary by percentages that were % Verified, Correct, Not on Document, and % of documents with STP (Straight Through Processing) for all of selected fields. Selected Date Range Organization Project Client ID Extraction Fields The date range selected by the user for each report The organization associated with the documents The project from which the reports are pulling data The client documents that should be included in the report results The fields that should be included in calculating Field Level Extraction 30
31 Report Output 1 % Verified The percentage of a specific field that has been verified 2 % Correct The percentage of fields that have been correctly extracted by Intelligent Capture 3 % Not On Document The percentage of a specific field that is not on a document 4 % STP The percentage of documents that run straight through Drill Down Document Class Num Docs Destination The PIC Snapshot Class Extraction The PIC Document Snapshot Report PIC Throughput Summary report A summary of the number of documents that processed by event type as of the current date and time. It includes the number of documents imported, verified, waiting in Verifier, in process, exported, and voided. For example, the Verifier count for Today only shows documents verified that were imported today. Organization Project Client ID The organization associated with the documents The project from which the reports are pulling data The client documents that should be included in the report results Report Output 1 Imported The number of documents that have been imported 2 Verified The number of documents that have been imported & verified today 3 Waiting In Verifier The number of documents that are waiting for a verifier 4 In Process The number of documents that are in process 5 Exported The number of documents that have been exported 6 Voided The number of documents that have been voided 31
32 Drill Down Event Destination The PIC Current Status Report PIC Throughput Summary Aging report This report provides a summary of the number of documents processed by event type and based on the actual date the event occurred. Organization Project Client ID The organization associated with the documents The project from which the reports are pulling data The client documents that should be included in the report results Report Output 1 Imported The number of documents that have been imported 2 Verified The number of documents that have been imported & verified today 3 Waiting In Verifier The number of documents that are waiting for a verifier 4 In Process The number of documents that are in process 5 Exported The number of documents that have been exported 6 Voided The number of documents that have been voided Drill Down Event Destination The PIC Current Status Report 32
33 PIC Throughput Summary Aging by Date report This report provides a summary of the number of documents processed by event type for a user defined event date. Organization Project Client ID Search Date The organization associated with the documents The project from which the reports are pulling data The client documents that should be included in the report results The beginning date used when running the report. Report Output 1 Imported The number of documents that have been imported 2 Verified The number of documents that have been imported & verified today 3 Waiting In Verifier The number of documents that are waiting for a verifier 4 In Process The number of documents that are in process 5 Exported The number of documents that have been exported 6 Voided The number of documents that have been voided PIC Throughput Summary by Date report This report provides a summary of the number of documents processed by event type for a user defined import date. For example, the verified count for the selected date only reflects verified document that were imported that date. For activity based on the date the event actually occurred, refer to the PIC Throughput Summary Aging report section. Organization Project The organization associated with the documents The project from which the reports are pulling data 33
34 Search Date Client ID The beginning date used when running the report. The client documents that should be included in the report results Report Output 1 Imported The number of documents that have been imported 2 Verified The number of documents that have been imported & verified today 3 Waiting In Verifier The number of documents that are waiting for a verifier 4 In Process The number of documents that are in process 5 Exported The number of documents that have been exported 6 Voided The number of documents that have been voided PIC Purge Document report Enter a specific amount of days. All documents Visibility data that predate the set amount of dates will be immediately deleted out of the system. Note Only the Administrator should have access to this report. The report is installed as a hidden report with the Capture report category and must be un-hidden by an Admin prior to running the report. PIC Archive Reporting Documents report Enter a specific amount of days and number of records. Specified number of documents Visibility data that predate the set amount of dates will be archived out of the system. Parameter Purge Data Before Days Number of records Target DB Name(SQL Server only) Target Server Address(SQL Server only) Select a number of days so that report will delete the records from reporting table which are created before the entered number of days from current date. Select a number of records so that report will delete these many records from table The target database name The target server fully qualified name or ip address 34
35 Parameter DatabaseLinkName(Oracle only) The database link created for target database Note Only the Administrator should have access to this report. The report is installed as a hidden report with the Capture report category and must be un-hidden by an Admin prior to running the report. Verifier Reports PIC Classification Verified by User report This is an adhoc report that lists the documents verified for classification exceptions by specific users for a project or client and specified date range. Selected Date Range Organization Project User Client ID The date range selected by the user for each report The organization associated with the documents The Intelligent Capture Project from which the reports are pulling data The Verifier user names who performed classification verification The client documents that should be included in the report results Report Output 1 Document No. The unique document identifier determined by Intelligent Capture. The default is the image name. 2 Original Classname The document class identified by RTS 3 Verified Classname The document class exported 4 Import Date The date on which a document is imported into Intelligent Capture 5 Extract Date The date on which a document information is extracted with Intelligent Capture 6 Export Date The date on which a document is exported from Intelligent Capture 7 Time The time it took to process a document from start to finish 8 Link The link that opens to an image of the document 35
36 Drill Down Document No Link Destination The PIC Field Extraction Results The link that opens to an image of the document PIC Classification Verifier Summary report This is an adhoc report that displays the number of documents verified for classification exceptions by specific users for a project or client and specified date range in a graphical format. Selected Date Range Organization Project Client ID The date range selected by the user for each report The organization associated with the documents The Intelligent Capture Project from which the reports are pulling data The client documents that should be included in the report results Report Output 1 Verified By The Verifiers who verified the identified documents 2 No of Documents The number of documents that the Verifier user verified. Drill Down No of Documents Destination The PIC Classification Verified By User 36
37 PIC Docs Processed by Day report This report displays a line chart that shows the total number of documents, number of verified documents, and number of STP documents by day. Search Date Organization Project Client ID The beginning date used when running the report. The organization associated with the documents The Intelligent Capture Project from which the reports are pulling data The client documents that should be included in the report results PIC Extraction Verified by Day by User report This is an adhoc report that displays a graphical view of the number of documents verified by specific users for extraction exceptions over a 30-day period. Search Date Organization Project Client ID The beginning date used when running the report. The organization associated with the documents The Intelligent Capture Project from which the reports are pulling data The client documents that should be included in the report results Report Output 1 Export Date The date the document was exported by Intelligent Capture 2 User The Verifier user name who verified the document for extraction 3 Document Number The count of documents verified by user for the export date. 37
38 PIC Extraction Verified by User report This report is provides a list of documents that were verified for extraction by specific users, including STP (Straight Through Processing), for a given project and date range. Adhoc reports allow users to modify the report so that it meets their desired style and format, such as re-arrange fields, format fields, show fields that are hidden, and hide fields. Selected Date Range Organization Project User Client ID The date range selected by the user for each report The organization associated with the documents The Intelligent Capture Project from which the reports are pulling data The Verifier user names who performed extraction verification The client documents that should be included in the report results Report Output 1 Document No. The unique document identifier determined by Intelligent Capture. The default is the image name. 2 Vendor ID The vendor ID number of the company 3 Import Date The date on which a document is imported into Intelligent Capture 4 Extract Date The date on which a document information is extracted with Intelligent Capture 5 Export Date The date on which a document is exported from Intelligent Capture 6 Time The time it took to process a document from start to finish 7 Link The link that opens to an image of the document Drill Down Document No Link Destination The PIC Field Extraction Results The link that opens to an image of the document 38
39 PIC Extraction Verified Count by Hour report This adhoc report displays a chart with the number of documents verified for extraction exceptions for a single day broken down by 24 hours. Search Date Organization Project Client ID The beginning date used when running the report. The organization associated with the documents The Intelligent Capture Project from which the reports are pulling data The client documents that should be included in the report results Report Output 1 Hour24 The hour in which the documents were verified 2 User ID The user name who verified the extracted document 3 Doucment Count The number of documents verified by the user within the hour PIC Extraction Verifier Summary report This adhoc report displays the number of documents verified by specific users, including Straight Through Processing (STP) in graphical format. It shows how the verifiers are performing in terms of documents verified. It allows you to see how many documents the verifiers are processing, where they might be struggling with the documents, and if they are meeting their goals. You can then drill down into the Verified by User report to view the documents that each user has processed. Selected Date Range Organization Project Client ID The date range selected by the user for each report The organization associated with the documents The Intelligent Capture Project from which the reports are pulling data The client documents that should be included in the report results Report Output 1 Verified By The Verifiers who verified the identified documents 2 No of Documents The number of documents that the Verifier user verified. 39
40 Drill Down No of Documents Destination The PIC Extraction Verified By User Accounts Payable reports PIC Average Extraction with Line Pairing report This report shows the Field Level Extraction percentage, STP percentage, and Line-Pairing percentage for Today, Yesterday, Last 7 Days and Last 30 days based on the document export date. The report is similar to the PIC Average Extraction report with an additional column for Line-Pairing statistics. Organization Project Client ID Extraction Fields The organization associated with the documents The Project where the reports are getting their data from The client documents that should be included in the report results The fields that should be included in calculating Field Level Extraction Report Output 1 % Correct The Percentage of the fields that have been correctly extracted by Intelligent Capture and did not require Verifier correction 2 % STP Straight Through Processing - documents that run straight through Intelligent Capture without human intervention 3 % Lines Paired The percentage of the PO lines that successfully completed the line pairing routine. Drill Down Click the % Correct or % STP column(s) in Bar Chart Click the % Lines Paired column(s) in Bar Chart Destination The PIC Snapshot Statistics The PIC Line Pairing Statistics 40
41 PIC Field Extraction by Vendor report This report displays the field level extraction and verification statistics for a given Vendor ID. If no Vendor ID is provided in the parameter, the query results include all vendors with the field statics grouped by Vendor Name. Selected Date Range Organization Project Class Name Vendor ID Extract Field Client ID The date range selected by the user for each report The organization associated with the documents The Intelligent Capture Project from which the reports are pulling data The class name selected by the user when running the report The Vendor ID provided when running the report (if provided) The list of fields which will be included in the report results. The client documents that should be included in the report results Report Output 1 Field The project field name returned from the report query 2 Num Docs The number of documents that included the field 3 % Verified The percentage of a specific field that has been verified 4 % Correct The percentage of the fields that have been correctly extracted by Intelligent Capture 5 % Not Inv The percentage of a specific field that is not on the invoice document 6 Vendor Name The Vendor Name associated with the Vendor ID Drill Down Field Destination The PIC Field Extraction Exception 41
42 PIC Invoice Discovery report This report allows the user to search or query invoices in a given date range based on field parameters, such as, invoice number or date, vendor name or number invoice amount, current state, class type, PO number or type. Adhoc reports allow a user to modify the report so that it meets the users desired style and format; such as rearrange fields, format fields, show fields that are hidden, and hide fields. Selected Date Range Organization Project Client ID The date range selected by the user for each report The organization associated with the documents The Intelligent Capture Project from which the reports are pulling data The client documents that should be included in the report results Report Output 1 Document No The unique document identifier determined by Intelligent Capture. The default is the image name. 2 Vendor ID The Vendor ID associated with the document 3 Company Code The Company Code associated with the document 4 Exported Date The date on which the document was exported by Intelligent Capture 5 Currency The currency associated with the document 6 Invoice Number The invoice number associated with the document 7 Amount Total The total amount extracted from the document 8 Current State The Intelligent Capture state in which the document currently exists 9 Link The link that opens to an image of the document Drill Down Document No Link Destination The PIC Field Extraction Results The link that opens to an image of the document 42
43 PIC Invoice Discovery Historical report This report provides a list of invoices by vendor with a specified date range showing status from import date to export date, or for a select state. An adhoc report allows user to modify the report so that it meets the user s desired style and format. The user can re-arrange fields, format fields, show fields that are hidden, hide fields, and more. Selected Date Range Organization Project Client ID Previous State The date range selected by the user for each report The organization associated with the documents The Intelligent Capture Project from which the reports are pulling data The client documents that should be included in the report results The last Intelligent Capture state in which the document completed Report Output 1 Document No. The unique document identifier determined by Intelligent Capture. The default is the image name. 2 Vendor ID The Vendor ID number of the company 3 Historical Status The state the document has entered 4 Company Code The Company Code for the company 5 Export Date The date on which a document is exported from Intelligent Capture 6 Currency The currency displays if it is an extracted field 7 Invoice Number The vendor s invoice number 8 Amount Total The invoice amount 9 Link The link that opens to an image of the document Drill Down Document No Link Destination The PIC Field Extraction Results The link that opens to an image of the document 43
44 PIC Line Pairing Document Snapshot report This report displays the Document Number, Vendor Name, Import Date, Extract Date, and Export Date along with a link to the document based on the selected Line-Pairing status(es). The report is also available as a drill down from the PIC Line Pairing Statistics Report by clicking on the Num Docs column for a given status. Selected Date Range Organization Project Client ID Line Pairing Status The date range selected by the user for each report The organization associated with the documents The Intelligent Capture Project from which the reports are pulling data The client documents that should be included in the report results The results of the line pairing performed during document export Report Output 1 Line Pairing Status The results of the line pairing performed during document export 2 Document No. The unique document identifier determined by Intelligent Capture. The default is the image name. 3 Vendor Name The vendor name associated with the invoice 4 Import Date The date on which a document was imported by Intelligent Capture 5 Extract Date The date on which a document was extracted by Intelligent Capture 6 Export Date The date on which a document was exported from Intelligent Capture 7 Link The link that opens to an image of the document Drill Down Link Destination The link that opens to an image of the document 44
45 PIC Line Pairing Statistics report This report shows the Number of Documents, Lines and Lines Paired and the Percentage of Docs in each Status grouped by the Line-Pairing Status. This report is also available as a drill down from the PIC Average Extraction with Line Pairing Report by clicking on the % Lines Paired column. Selected Date Range Organization Project Client ID The date range selected by the user for each report The organization associated with the documents The Intelligent Capture Project from which the reports are pulling data The client documents that should be included in the report results Report Output 1 Document Line Pairing Result The results of the line pairing performed during document export 2 Num Docs Number of documents with the line pairing result 3 Num Lines Number of lines on the documents 4 Lines Paired Number of lines paired on the documents 5 % Docs in Status Percentage of overall document count in the line pairing result Drill Down Num Docs Destination PIC Line Pairing Document Snapshot PIC Snapshot Invoice report This report displays the Field Level Extraction rates and the percentages Verified for each field in an area chart along with a filterable table of the fields and their Extraction and Verification percentages. Selected Date Range Organization The date range selected by the user for each report The organization associated with the documents 45
46 Project Client ID Class The Intelligent Capture Project from which the reports are pulling data The client documents that should be included in the report results Document class which should be included in report results Report Output 1 Field The project field name 2 % Verified Percentage of a specific field that has been verified 3 % Correct Percentage of a fields that has been correctly extracted by Intelligent Capture 4 % Not on Doc Percentage of a specific field that is not on a document PIC Vendor Snapshot Statistics report This report is a summary that shows the extraction performance by vendor in a specific date range. The % Verified and % Correct columns displayed Green, Yellow, and Red. Selected Date Range Organization Project Extract Field Client ID The date range selected by the user for each report The organization associated with the documents The Intelligent Capture Project from which the reports are pulling data The list of fields that will be included in the report results. The client documents that should be included in the report results Report Output 1 Vendor Name Vendor Name associated with the documents 2 Num Docs Number of documents associated with the Vendor 3 Num Fields Number of fields extracted from the documents 4 % Verified Percentage of a specific field that has been verified 46
47 Report Output 5 % Correct Percentage of the fields that have been correctly extracted by Intelligent Capture 6 % Not On Document Percentage of a specific field that is not on a document 7 % STP Percentage of documents that run straight through Drill Down Vendor Name Num Docs Destination The PIC Field Extraction By Vendor PIC Document Snapshot Report scheduling activities Scheduling of reports is very helpful for better utilization of server and printer resources. Reports that take longer to run can be scheduled to save your time. A Report that needs processing of large volumes of data and needs server and printer resources for a long time can be generated over the weekend when the load on servers would be relatively low. Jobs are the base for running Reports in a timely manner. A Job runs a Report that was selected in a task either once or on a regular basis set in a schedule. To start using the scheduling feature, complete the following steps. 1. Create a new job or make sure an existing job is running. Modify the job if needed. 2. Assign a new or existing task to the job. For scheduling a further report, select the wanted report in the New Task form. 3. Select an existing schedule or create a new schedule for the regular iteration of the job. 4. Save the job. Jobs Schedules take care of date and time details of a scheduled report generation. Tasks take care of report output and delivery. Jobs implement a task (optionally) based on a schedule. To configure a new or existing job refer to the Jobs configuration section. To create a preconfigured job for a specified report use the Schedule function in the reports menu of the repository. 47
48 Job List This page lists all the jobs that are associated with a schedule for execution. To open the Job list, complete the following steps. 1. Go to the Navigation tab in the side menu. 2. Click Schedule > Jobs. Filter Area When the page opens, the Filters tab closes. Click the tab-header to open it. The tab-header also displays current filter settings. By default, it displays the first 500 jobs. The list of jobs can be filtered by the following choices. Job Name Contains. Any part of the Job Name Report Name. Name of the report Select Owner. The user who created the job Show (selecting the number): Select Top 100 to view first 100 jobs from the filtered list, and select Top 500 or Top 1000 to view first 500 and 1000 jobs respectively. Select All to view all the jobs from the filtered list. Note Jobs are listed in the ascending order of the time of next execution. Filter the list Select or specify filter criteria and click the Refresh button. Only entries that meet the filter criteria will appear in the filtered list of tasks. Note If you are an Administrator, you can select Private Owned By = ALL then click the Refresh button to view private Jobs created by all users of your organization. List Area All jobs or jobs that meet the filter criteria are listed in the List area. Use this page to complete the following tasks. Add a new job Add a new job based on a pre-set job Select a job and modify or delete it If the entity you are looking for is not available in the list, use the drop-down options to view another set of entities. On multipage job lists click Next to go to the next page or Prev to go to the previous page. The Show drop-down box that contains the Next and Prev links displays if: it is configured to appear, the number of entries is more than the page size, which is set by the application administrator. 48
49 The following buttons display in the header row. Button Add Job Task List Description Set up a new job. Go to the Task List Schedule List Go to the Schedule List Mark a job and move the pointer over the job name to view the fisheye context menu of the job. Menu Option Add Like Modify Description Set up a new job based on a pre-set job. The name has Copy Of prefixed to the name of the job being copied. Make changes to the selected job. Jobs Execution Status Delete Call up the execution status of the job To delete a selected job. The Job List includes the names of jobs and the following details. Sr.No. Number of the job Job Name. Name given to a job Status. Displays Running if the time span of the job is not over, Completed if the time span of the task has completed, Error if the job started but could not be completed successfully, or Suspended if the job is marked as suspended. Last Run time. Time when the report was run last time. Last Run Result. Outcome of last run of the job. Frequency. Frequency of repetition of the calendar. Next Run Time. Time when the job will next run. Add a job You can create a new job using one of the following methods. To create a job based on a pre-set, existing job, complete the following steps. 1. On the Jobs page, locate an existing job that you want to duplicate. 2. To select the job, click the button that appears between the first and second column of the respective job entry. 3. Click the Add Like button. 4. In the Job configuration page, make the necessary changes and save the job under a new name. 49
50 To create a new job, complete the following steps. 1. Click Add. 2. In the Jobs configuration page, configure the job settings and click Save. Modify a job To modify a job, complete the following steps. 1. On Job List page, locate an existing job that you want to modify. 2. To select the job, click the button to the left of the job name. 3. Click Modify. You can also click the Job Name to modify a job. The Jobs configuration page opens for modification of the containing information. 4. In the Jobs configuration page, make the necessary changes and click Save. Delete a job To delete a job, complete the following steps. 1. On the Job List page, select the job that you want to delete. To select a job, click the option button on the left of the job name. 2. Click Delete. 3. In the Delete dialog box, click OK to delete the job. Jobs Configuration page The Jobs Configuration page contains the following elements. 1. Job and Task Details 2. Run 3. Run As 4. Notification 5. Advanced Options Follow all steps in the following subsections to configure a job. Job and task details 1. In the Name field, specify a unique name for this entry. This name is used to refer to this job. 2. In the Choose Task field, select a task to associate with this job. Click Modify Task if you want to modify the selected task. If the task to use is not listed, click New Task to create a whole new task to associate with this job. Note To create a new task, Visibility will take you to the Task configuration page, and return when the task creation is finished. For details on creating a new task, refer to the Add a task section. If you choose to modify a task, Visibility takes you to the Task configuration page and back after saving the modified task. When you choose a task, the report name associated with the selected task automatically appears in Report Name. 50
51 3. Specify details under Run, Notification, and Advanced Options. The details are provided after these steps.visibility now starts serving the report based on the job. 4. Optional. If you do not want to implement the job, select the Suspend check box. This job remains suspended until the Suspend check box is cleared. Note Information for Run As, Format and Delivery appears from the Tasks page. 5. Optional. If you select the Skip delivery on no data option, the report is delivered to selected delivery options only if the report has any data. Otherwise, the schedule is skipped. 6. Optional. If you select the Delete on completion option, the job is deleted after execution for Run Now and Once. For Recurring, it is deleted if further execution is not scheduled after last execution. Run Select this option to run this job immediately, only once on given date and time, or repeatedly based on a schedule (calendar). Now. To execute the job now. Once. To execute the job once, at the specified date and time. Select a Date. Specify time in the 24 hour format. Recurring. To execute the task as per one of the pre-set calendars. Select the calendar from Schedule (Calendar) List. Click New Schedule to create a new calendar. Run As To run the job in the name of a specific user, select Organization ID and User ID. Important The Run As set value in Job overrides the Run As set value in Task. Notification You can send a notification informing about success or failure of a job. On Success. To send a notification on success of the job. Select the On Success, Send to check box... and specify the ID. On Failure. To send a notification on failure of the job. Select the On Error, Send check box and specify the ID. Advanced options These actions are useful when a job cannot be completed. On Error Define the retry time in relation to the runtime. Minutes. The number of minutes after which it should be retried. Hours. The number of hours after which it should be retried. Days. The number of days after which it should be retried. Retry times. The number of times it should be retried. 51
52 If more than one value is specified, all values are added. For example, retry after 2 days, 4 hours and 10 minutes. On Skip If the report generation could not start as per the schedule (calendar), such as if the report server was down at the time of executing the schedule, the report is considered skipped. In this case, to recover (to try once again) the schedule (calendar), check the Recover check box and specify the time when Visibility should retry the task. Values can be given in the following formats. Minutes. The number of minutes after which it should be recovered. Hours. The number of hours after which it should be recovered. Days. The number of days after which it should be retried. Close the Jobs Configuration page When the job configuration is completed, click Save on top of the page to save the job. To discard changes, click Cancel. If you choose the Cancel option, existing jobs remain unmodified, and new jobs are not saved. The Jobs configuration page closes, and the viewer area displays the Jobs list with the new job or the modified job selected. Jobs execution status Visibility maintains a list of scheduled jobs. The following information on scheduled jobs appears in the list: Serial Number, Job Name, Report Name, Frequency, Execution Time and Last Run Status. This history of jobs is listed on the Jobs execution status page. To open this page, complete the following steps. 1. Click Navigation > Schedule > Jobs Execution Status. 2. Perform the following actions on this page. Filter the list with the Filter criteria on the top foldout menu. View a Jobs Summary in the Jobs Summary pane. Refer to the Jobs List in the List area. 52
53 Filters area When the page opens, the Filters tab remains collapsed. Click the tab-header to open it. The tab-header also displays current filter settings. By default, it displays the first 500 jobs (no filter for report name, Owner Intellica/Admin). You can filter the list of jobs using the following information. Job Filter Select Report(s) Date from / to Description Name of the report Dates between which the jobs were executed Select Owner Organization and user name of the person who owns the job. Status Job Type Job Name Select Success, Failure, or All to include only successful jobs, failed jobs or all jobs respectively. Select one of the following job types. Select All to include all types of jobs. Select Now, Once, or Recurring to include respective types. Select Background to include jobs that run in the background. Select Post Approval to include the jobs that executed reports intended to undergo the approval process. Name of the job Show (selecting the number) Frequency Select Top 100 to view the first 100 jobs from the filtered list, and select Top 500 or Top 1000 to view the first 500 and 1000 jobs respectively. Select All to view all the jobs from the filtered list. Select from Daily, Weekly, Monthly, or All. Note Jobs are listed in ascending order based on the time of execution. Filter the list Select or specify your filter criteria and click Refresh. A list of jobs having entries that meet the filter criteria displays. Jobs summary This displays a graphic summary of the Jobs Execution Status. List area Jobs that meet the filter criteria are listed in Result area. The Show drop-down box containing the Next / Prev link appears if it is configured to appear and the number of entries are more than the page size. This feature is set by application administrator. If the entity you are looking for is not available in the list, use the drop-down box options to view another set of entities. To retrieve the next list, click Next. To retrieve the previous list, click Prev. 53
54 Tasks A report may be printed, mailed, published or uploaded using FTP. It can be generated in different output formats. A task consists of one or more activities that are executed on a report. As a task, you can instruct PIC Visibility that a report is sent to addresses, published up to a date, or placed on an FTP site at a certain URL. Task list To view the list of tasks, complete the following steps. 1. Go to the Job list. 2. Click the Task list icon in the Job list header row. Filter area When the page opens, the Filters tab remains closed. Click the tab-header to open it. The tab-header also displays current filter settings. By default, it displays the first 500 tasks (no filter for report name, Owner Perceptive Software/Admin).You can filter the list using the following options. Task Name Contains. Any part of Task Names Report Name. Name of the report. Select Owner. The name of the user who created the task. Show. Select Top 100 to view the first 100 jobs from the filtered list, and select Top 500 or Top 1000 to view the first 500 and 1000 jobs respectively. Select All to view all the jobs from the filtered list. Filter the list Select or specify filter criteria in the Filters area and click the Refresh button. Those tasks that meet the filter criteria appear on the list. The list includes the Task number, the Task Selection button, the Task name and the Owner. Note If you are an administrator, select All in the Private Owned By selection menu and click the Refresh button to view private tasks created by all the users of your organization. List area All tasks or tasks meeting the filter criteria are listed in the List area. Use this page to complete the following actions. Create a new task Create a new task based on an existing task Select a task (by clicking the radio button) and modify or delete it View jobs associated with a task The Show drop-down box that contains the Next and Prev links displays if it is configured so and if the number of entries are more than the page size (this is set by application administrator). If the entity you are looking for is not available in the list, use the drop-down box options to view another set of entities. To access the next list, click the Next link. To access the previous list, click the Prev link. 54
55 The following buttons appear in the header row. Button Add Task Job List Description Create a new task. Go to the Job list. Schedule List Go to the Schedule list. Mark a task and move the cursor over the job name to view the fisheye context menu of the task. Menu Option Add like Modify Description Create a new task based on a pre-set task. Modify a selected task. To modify the task, you can also click the Task Name. Associated job list Delete View jobs associated with their respective tasks. Delete a selected task. Add a task To create a new task, complete one of the following procedures. Based on a pre-set (existing) task: 1. In the context menu of the task, click Add like to display the Task configuration page. 2. Make changes where required and save the task under a new name. Creating a new task from scratch: 1. In the header row of the task list, click Add Task.to display the Task configuration page. 2. Configure the task and save it. Modify a task To modify a task, complete the following steps. 1. Select a task in the task list. 2. Click Modify in the context menu. 3. Make changes to the task and save the task. 55
56 View jobs associated with a task Click the link Associated Job List icon in the fisheye menu of the task. Delete a task To delete a task, complete the following steps. 1. Select a task 2. Click Delete in the context menu. 3. Click OK in the warning message to permanently delete the task or click Cancel to retain the task. Task configuration page The Task configuration page contains the following elements. Task page header Operational Parameters Report Parameters MultiSet Parameters Follow all steps in the following sections of the Task configuration to configure a task. Task page header To define a header for the task page, complete the following steps. 1. In the Name field, specify a unique name for this entry. This name is used to refer to this task. 2. In the Report Name field, select a report to be taken up for the task. 3. Specify required information for Operational Parameters and Report Parameters before saving the task. 4. If the report is going to have multiple set of parameters (operational parameters as well as report parameters), specify MultiSet parameters before saving the task. 5. Click the Save button after specifying all the required information. The task detail is saved and its entry appears on the Tasks page. 6. Click Cancel to discard changes to an existing task or all information on a new task. 7. Click Preview to preview the task report as a PDF. Operational parameters These options deal with the delivery of the report. There are four options: , Print, Upload and Publish. To view the parameters of an option, click the name and then select an option. 56
57 To a report, complete the following steps. 1. Click the Send Report As button. 2. To edit the parameters in the Message box, complete the following substeps. 3. In Send Report As, select Link to send a link of the report. Select Attachment to send an entire report as an attachment of the In File Name, specify the name for the report that is being attached. 2. To include date and time of report generation, select the Suffix Timestamp Format check box and select a date format. 3. Specify IDs for To, Cc and Bcc. 4. In the Subject field, specify the subject of the In the Message field, enter your message. 4. Click Send. Print Use this option for reports that are printed on paper. To get print related operational parameters, click the Print link and complete the following steps. 1. In the Copies field, specify the number of copies to printed. 2. In the Page Range field, select All to print all pages in the report, or specify the pages to print. 3. Select a printer from the drop-down list. This list has all the printers installed on the Report Server machine. Notes If a print setting is associated with the report, the details display here when you select the report and click the Go button. Raw Text output format is not available for Print. For selected reports with a compulsory print setting, you cannot edit the print parameters. Upload, save, and publish You can upload a report to an FTP server or store it in a Shared Folder. To upload the report to an FTP Server, complete the following steps. 1. In the Upload Type field, select FTP. 2. To enable FTP, select Secure. 3. Optional. To upload in passive mode, select the Use PASV mode check box. 4. In the Server Name field, specify the server name. 5. In the Port field, specify the port to use for the upload. 6. In the User Name field, specify the user name to use to log in to the server. 7. In the Password field specify the password to use at the time of login. 57
58 8. In the Folder name field, specify the location of folder where the report should be stored. Specify / if you want to place the report at the root directory. 9. In the File Name field, specify the name by which the report will be stored on the server. Save on a shared folder on the Network To save a report on a network location, complete the following steps. 1. In the Upload Type field, select Shared Folder. 2. In the Folder Name field, specify the network path in UNC format (\\computername\folder) where you want to place the report. 3. In the File Name field, specify the name by which the report will be stored on the server. Publish To publish a report with a preset validity period, complete the following steps. 1. In File Name, specify the name for the published report. 2. To include the date and time of report generation, select the Suffix Timestamp Format check box and select the date format. 3. For Valid Upto, select the right option and provide details accordingly. For details, refer to the following table. Reports expire and are not published after the specified period. Report Publishing Option For a specific time period after generation Description For example, for 2 months, 3 weeks, 6 hours, and so on. Select this option button and specify the number followed by selecting unit (Hours, Days, Weeks, Months and Years). Up to end of duration from generation Up to end of a specific time period Select this option to keep the report published up to end of duration and select the duration (hours, days, weeks, months and years), for example at the end of this week or at the end of this year. Select this option to keep the report published up to a specific date. For example, on 30 July, Getting parameter value in fields (on E- mail, Publish, and Upload) You can set parameter value as part of free form entry boxes. To include a parameter in a field, enclose the parameter name in <% and %> and specify in respective entry box. For example, Sales<%CountryCode%>Jan2006. In this example, CountryCode is a parameter name that is replaced by its actual value when the report is executed. 58
59 Report Format Select a report format from the drop-down list. Delivery Options area just below the Report Format drop-down box list properties related to the selected Report Format. Consult the online help for details on the Delivery Options. Set the properties for the selected Report Format. Report format is available only after selecting Operations. Refer to the previous table under Publish. Run as To run the task in a specific user s name, select the organization and the user from drop-down boxes under Run As. Note The Run As option is available to Administrators only. It is not available to end users with the Scheduler privileges. Report Parameters You can customize the task report parameter based on the report that is used in the task. Configuring the parameters sets the defaults used by the report when the task is executed. MultiSet parameters This is used to provide more than one set of operational parameters and report parameters. This is one of the most powerful features of Perceptive Intelligent Capture Visibility. Using Multiset parameters, you can dynamically select the parameter values to use with a report at run time. The following values are potential Multiset Parameters. Static: Fix values will be specified for the parameters. These values can be specified on this page. SQL: SQL query will be used to fetch parameter values from database. XML: An XML file will provide values to be used as parameters. Get parameters values through Static 1. Click the MultiSet button under the Report Parameters section. 2. Select option Static. A check box displays on the left side of both the Operational parameter and the Report parameter. 3. Select the parameters, by checking respective check boxes on Report Parameters area, for which you want to provide multiple set of values. Entry boxes, under MultiSet Parameters, for selected parameters become available. 4. Click the Add button to create an new row. 5. Specify values in respective entry boxes. 6. After providing all the values, click the Save button. 7. Optional. Click Add to create additional rows. Click to remove the respective row. 8. Optional. Click Reset to reset the values similar to the ones set under operational parameters. 9. Optional. Click Preview to have a look at the report based on the parameters set here. 59
60 Getting Parameter values through an SQL Use this when parameter values needs to come directly from database using an SQL. This way you can dynamically select parameter values at run time. 1. Select the option SQL. Select the connection name to be used to get the parameters. 2. Specify the SQL. 3. Click Verify SQL to check if the SQL you specified is valid. Getting Parameters through XML 1. Select the option XML. 2. Specify URL where the XML is placed. About task information without Visibility web interface Task information that you specify and submit is stored on the server as an XML file. You can download this file and open it using an editor to modify the task information without using Visibility Web Interface. After modification, you can upload it to the server. Download the task information 1. On Task List page, select the task that you want to download. 2. Click the Modify button. The Task page opens. 3. Click the Download XML button. Click Save on the dialog box; specify the location where you want to save the file. The file is downloaded. For modification, the file can be opened using any text editor. Upload the task information The file having task information can be uploaded after modification. (You need not upload if it is not changed). 1. Click Browse and select the file that you want to upload. 2. Once the file is selected, click Upload XML button. The file is uploaded to the server. Schedules Schedules can be created by the following roles. Administrators Users having batch Report Scheduler system privileges All users can create private schedules A schedule includes details of when a report generation task should occur. 60
61 The Schedule List To view a list of schedules, go to the Job list and click the Schedule list icon in the header row. The Filter area When the page opens, the Filters tab remains closed. Click the tab header to open it. The tab header displays current filter settings. By default, it displays the first 500 tasks (no filter for report name, Owner Perceptive Software/Admin). You can filter the list using the following options. Schedule Name Contains. Any part of Task Names Select Owner. The user who created the schedule(s). Show. Select Top 100 to view the first 100 jobs from the filtered list, and select Top 500 or Top 1000 to view the first 500 and 1000 jobs, respectively. Select All to view all of the jobs from the filtered list. Filtering the list. Select or specify filter criteria in the Filters area and click the Refresh button. Those schedules meeting the filter criteria will appear on the list. Administrator. If you are an administrator, select All in the Private Owned By selection menu and click the Refresh button to view private tasks created by all the users of your organization. The List area For each schedule the list includes the Schedule Number, Schedule Name, Owner and Frequency. Click the Associated Job List link in a schedule`s context menu to view jobs associated with that schedule. Use this page to complete the following actions. View schedule list. Create a new schedule. Create a new calendar based on an existing schedule. Select a schedule and modify or delete it. View jobs associated with a schedule. Add a schedule You can create a schedule using the following procedures. Based on pre-set (existing) schedule A new schedule To add a pre-set or existing schedule, complete the following steps. 1. On the Schedules tab, select a schedule based on your requirements for a new schedule. To select a schedule, click the option button that appearas on the first column of respective schedule entry. 2. Click the Add Like button in the context menu of the selected schedule. The Schedule configuration page opens in the viewer area. 3. Make the necessary and click Save. 61
62 To add a new schedule, complete the following steps. 1. On the Schedules list header row, click the Add button. The Schedule configuration page with entry details opens. 2. Configure the schedule as needed and click Save. Modify a schedule To modify a schedule, complete the following steps. 1. Select the schedule from the list. 2. Click Modify in the fisheye menu. 3. Make changes to the configuration page and click Save. Delete a schedule To delete a schedule, complete the following steps. 1. Select a schedule from the list. 2. Click Delete in the context menu. 3. Click OK in the pop-up message box to delete the schedule, or click Cancel to retain the schedule in the list. Note You cannot delete a schedule that is associated with a job. View jobs associated with a schedule To view jobs associated with a schedule, completee the following steps. 1. Click the Associated Job List icon in the context menu of the schedule. 2. The job list that displays contains jobs associated with the selected schedule. The Schedule configuration page To configure a schedule follow all steps in the following subsections. Schedule page header 1. In the Name field, specify a unique name for this entry. This name will be used to refer to this schedule. This can t be left blank. 2. In the Start Date field select the date from which schedule should be implemented. By default, today s date will appear there. 3. In the End Date field, select the date from which the schedule would not be available. If this is kept blank, this schedule will never expire and will continue to be available for implementation. 4. Click the Save button to save the schedule details. 5. To abandon the process, truncate the changes and return to Schedules tab, click the Cancel button. 62
63 Select Frequency details In Select Frequency field, select the frequency. Details are given after these steps. This sets the day on which this schedule will be implemented. The frequency is set in the following ways. Daily (by days) Weekly (by weeks) Monthly (by months and dates / days within month) To set frequency as Daily (by days): 1. While setting up schedule, under Select Frequency, select Daily. The page changes accordingly. 2. Under Every, specify the number of days after which the schedule should repeat itself. For example, if you want the schedule to be repeated once in three days, (1st, 4th, 7th and so on), select 3 as number of days. To repeat the schedule every alternate day, select 2 as number of days. Once a week, select 7 as number of days. To set frequency as Weekly: 1. While setting up schedule, under Select Frequency, select Weekly. The page changes accordingly. 2. Under Every, select after how many weeks the schedule should be repeated. 3. Select the check boxes of the days when you want the schedule to repeat. For example, if you want the schedule to be repeated every 3 weeks, and to be implemented on Tuesday and Friday, select 3 in the Every drop-down and select the appropriate check boxes. To set frequency as Monthly (by dates): In this case, a schedule is set to repeat on selected months and on specific dates. 1. While setting up schedule, under Select Frequency, select Monthly. The page changes accordingly. 2. Select the months in which the schedule will be implemented. 3. Select the option On Selected Date(s). 4. Select the dates on which you want the schedule to repeat. For example, if you want schedule to be repeated in April, July, Oct and December on dates 1, 3, 4, 6, 25, select months Apr, Jul, Oct, and Dec. Select dates 1, 3, 4, 6, and 25. To set frequency as Monthly (by days): Here a schedule is set to repeat on selected months and on a specific day. 1. While setting up schedule, under Select Frequency, select Monthly. The page changes accordingly. 2. Select the option On. 3. Select the required option among 1st, 2nd, 3rd, 4 th, and 5th, followed by selection of day. 4. Select one or more months. 5. For example, if you want the schedule to be repeated every 3rd Friday of January, February, and October, select the months Jan, Feb, and Oct. Select 3rd and Friday as day. 63
64 Selecting Time for implementing the schedule This is the time when on given day, the schedule should be implemented. It can be made to: Occur only once at a specific time on given day Occur more than once (at given interval) on given day Occur once at Select this if you want the schedule to occur only once at a specified time, for example only at 20:00:00. Click the option button to the left of Occurs Once at and specify the time in hh:mm:ss format in the entry box. Occurs Every Select this if you want the schedule to repeat at an interval of set number of hours. Click the option button on the left of Occurs Every and select a number indicating the number of hours after which the schedule should repeat. Set time for Starting at and Ending at is the time between which this schedule will occur, for example, Starting at 04:00:00, every 2 hours until 18:00:00. Visibility Dashboards Design, View, and Availability You can design dashboards if you are an end-user or administrator. Role End user Administrator Capabilities Design and use dashboards privately. End-users cannot make the dashboards available to other users. Design and use dashboards privately as well as make them available to users of his/her organization (public dashboards) and to all Visibility users. For details on the use of the dashboard, refer tothe Dashboards section in the Visibility User Interface section. Design a dashboard Visibility offers a WYSIWYG dashboard designer that allows dashboards to be newly designed and customized so that it will be the most beneficial for end users across the organization. Design dashboards based on functions within the organization, give the dashboard a meaningful name, decide the layout of the dashboard, and place items to view on the dashboard. The custom designed dashboards make it possible to give your dashboard a unique look and feel. Create Dashboards To create a dashboard, complete the following steps. 64
65 1. Go to Navigation > Dashboards > View. 2. If your user already has a dashboard selected in Preferences, select the grey gear at the top right of the Dashboard page and select Switch to Edit Mode. Otherwise, move to the AddWidget step below. 3. Click the plus + symbol to the right of your current dashboard name. 4. A blank dashboard opens in a default style. To add preconfigured widgets to the dashboard, click Add Widget in the taskbar. 5. Select an existing dashboard from the categories and drag it to the desired widget location within the dashboard. To create new widgets, refer to the Widget Designer section. 6. Click Settings in the taskbar 7. To configure the properties of the dashboard, select Dashboard Parameters and click Prompt for the Input Parameter form. For details, refer to the Dashboard properties section. 8. Select the Input Parameters and click Run. For details, refer to the Input Parameter form section. The Widgets show the current report data. 9. Save the Dashboard. Note Leaving the dashboard view without saving the dashboard discards the dashboard. Dashboard Preferences Specify the dashboards that are displayed upon login and the way that the dashboards are displayed. Open the Dashboard Preferences page from the Side menu Navigation tab: Click Navigation > Dashboards > Preferences. In the dashboard preferences, you can specify the following options. Dashboards that are available for viewing The order that the dashboards are displayed in Note To view dashboards owned by other users, check the Show All Owners check box. Dashboard view You can setup and view multiple dashboards; however, only one dashboard can be viewed at a time. Click the tab header of respective dashboard to bring it in front. Select dashboard for viewing To shift a dashboard in the Selected Dashboard(s) list, complete the following steps. 1. In Available Dashboard(s) list, browse to a dashboard. 2. Select the dashboard by clicking on it. 3. Click the button. The selected dashboard is moved to the Selected Dashboard(s) list. 65
66 To remove a dashboard from the Selected Dashboard(s) list, complete the following steps. 1. Select the dashboard from the list. 2. Click to remove the selected dashboard. 3. To remove all dashboards, click Clear all. To change the sequence of dashboard tabs (left to right), Use the up and down buttons placed on the right of the Selected Dashboard(s) list to move the marked dashboard into another position. Manage dashboards Manage all dashboards in the Repository. Find the following actions on dashboards in the context menu of each dashboard: View Dashboard, Access Rights, Copy/Cut Dashboard, Add to Favorites and Delete. Access rights to dashboards This feature is available only to administrators. To provide access rights for selected dashboard, complete the following steps. 1. Select a dashboard in the Repository. 2. Click the Access Rights icon in the right-click menu. 3. Choose a user or user group in the assignee box and set the Access Rights for that user/group. 4. Click the Save button to save changes. Click the Cancel button to discard all changes. Dashboard properties Set Dashboard Properties in the Settings pane and in the Save Dashboard dialog. Dialog box option Name Description Public/Private Description Name of the dashboard How you describe the dashboard. Private makes the dashboard only available to you and Public makes it available to everyone. The Public option is only available to the Administrator. Edit pane Dialog box option Properties Description Prompt on First Run: This is only applicable when a reports placed on the dashboard have common parameter objects and they are set as dashboard parameters. Refresh Interval: How often all reports within the dashboard will refresh. 66
67 Dialog box option Layout Information Description Choose a horizontal or vertical layout and number of widgets to display. Shows information which is assigned in the dashboard Saving Options. Dashboard Parameters During dashboard design, when a report having user parameters is placed on the dashboard, its parameters are listed on the Dashboard Parameters box. When the dashboard has multiple reports with user parameters, some of the parameters may be appearing on multiple reports. Select parameters from the Dashboard Parameters box. Select the All check box to include all the parameters on that common parameter entry form. Click Prompt. The Input Parameter Form opens. Input Parameter form Configure Report Parameters for dashboards on the Input Parameter Form. Reports require run time values for parameters from the user. For example, a monthly sales report may need name of month or a salary slip needs an employee code to generate the respective report. Customize the report parameter based on the reports in the dashboard widgets. To open the Input Parameter Form for a new dashboard the first time, complete the following steps. 1. Click the Prompt button in the Dashboard Properties pane. 2. To reenter the Input Parameter Form, pull down the Parameters menu to the right of the dashboards name. 3. To configure input parameters, specify the parameters and click Run to enable the (new) parameters or click Reset to discard changes. Widget Designer The Widget Designer integrates all configuration options for widgets. Add new widgets or modify existing widgets in the Widget Designer: 1. Open the Widget Designer in the Navigation tab under Dashboards. 2. To add a new dashboard widget, click the Add New button. 3. To open and modify an existing widget, click the Open button in the Widget Designer or browse for a widget in the Repository and click the Edit Dashboard Widget icon in the context menu. 4. Assign a name for the new widget in the text box next to Widget Name. 5. Configure the Widget Properties for each type of widget (for details, consult the next three sections). To create a widget that is already preset for a specific report, use the Create Dashboard Widget icon in the context menu of the report in the Repository. Design a Real Time Report widget To design a real time report widget, complete the following steps. 1. Next to Contents, select the Report option. 2. Choose the Real Time tab. 67
68 3. Select a report in the report browser. 4. Configure the Widget Properties listed in the following table. 5. Save the widget or click Cancel to exit the design process without saving the widget. Widget Properties Property Name Report Format: Toolbar Ask at Runtime Link Widgets Auto Refresh (Yes or No) Refresh Interval Description Select the output format of the report: HTML, PDF, JVista, ihtml, or SMART. Select the most appropriate option:yes (always show toolbar), No (never show toolbar) or MultiPage (show toolbar only for multi-page reports). This is applicable to output formats HTML and Interactive. This option appears when the report placed on dashboard has run time parameters. Select Yes to provide parameter values at run time also. Set No to provide parameter values only during dashboard designing. This links any of the charts available on report in this widget to another widget. This allows the user to drill down within the report. For details, refer to Link widgets. Select Yes, if you want Perceptive Intelligent Capture Visibility to refresh the reports as per the Refresh Interval. Select No to view the report generated when dashboard was loaded for the first time. Set how often the report are generated, in minutes. Width/Height Set the width and height of the widget. Link widgets You can link a report widget (not saved reports) to other widgets. The linked widget may have a report or a web link item. 1. Select a widget to link from. 2. Click the Link Widgets button. 3. Choose an item and widget to link to. The widget being linked to needs to have a chart report. 4. Click to get one more row to specify link information with another widget or series. Click to delete a respective row. 5. Click OK to apply the link or click Cancel to discard the link 6. Save the widget. 68
69 Design a pre-generated report widget You can place following items in a Pre-generated widget. Item Description Reports Jobs (Scheduled tasks) To execute a report when you view the dashboard. Here you select a report layout that will be executed when you view the dashboard. To view reports executed through a job (scheduled task). Here you select a report layout followed by selecting job name through which that report was executed. The pre-generated items that appear in the list depend on your logon type. For example, the list is different for an administrator versus an end user. To configure a pre-generated widget, complete the following steps. 1. Next to Contents, select the Report option. 2. Choose the Pre-generated tab. 3. Select one of the following items: 4. Select a report in the Report browser. This option selects a Saved Report List. Select the report to view a corresponding Saved Report List. 5. Select a job for the widget. Restrict the choice of jobs to jobs executing a certain report by choosing a report in the Report browser. To undo the restriction click the Clear icon in the Report browser. 6. Select a category: This option appears when Report List, Saved Report List or Quick Job List is placed on widget. Select the category to carry out respective task such as retrieve a list of reports in a selected category, retrieve a list of saved reports, or retrieve a quick job lists for selected reports. 7. Configure the widget properties listed in the following table. 8. Save the widget or click Cancel to exit the design process without saving the widget. Property Name Report Format Toolbar Instance Navigation Auto Refresh Refresh Interval Description Choose the output format of the report in: HTML*, PDF, JVista, or ihtml. Select the most appropriate one among Yes (always show toolbar), No (never show toolbar) and MultiPage (show toolbar only for multi-page reports). This is applicable to output formats HTML and Interactive. Select Yes or No. Yes displays a drop-down box to select and view one of the saved reports. No does not. Set this as Yes if you want Perceptive Intelligent Capture Visibility to refresh the URL as per Refresh Interval. If it is set as No, Perceptive Intelligent Capture Visibility will execute it only once (when dashboard is brought in front). Set the time in minutes. The widget will be refreshed at the end of the specified interval. Width/Height Set the width and height of the widget. 69
70 Design a web link widget To desing a web link wedget, complete the following steps. The following table provides details about the properties you can include in your design. 1. Next to Contents, enable the Web Link button. 2. Type a URL in the URL textbox. 3. Configure the Widget Properties listed in the following table. 4. Save the widget or click Cancel to exit the design process without saving the widget. Pre-generated Widget Properties Property Name Description Show Scrollbar Select Yes to display a scroll bar if the external link page does not fit in widget width. Auto Refresh Refresh Interval Select Yes or No. Yes will refresh the URL at the assigned time interval. No will make the URL. Set the time in minutes. The URL will be refreshed at the end of the specified interval. Width/Height Set the width and height of the widget. 70
71 How to use and manage reports You can manage reports in the following locations in PIC Visibility. Find all Reports. You can save Reports and Report related objects in the Repository tab. Find the Manage Folders and Reports. You can access these options from the Repository optoins of the Navigation menu tab. Find Report Notification. You can set notifications in the Notify section of the Navigation tab. Report repository Carry out all report related actions from the Data Model tab of the slide menu. Click the corresponding link in the context menu of the report to run the selected action. Choose from a wide variety of tasks including running reports, customizing reports, configuring report properties and managing reports. Run a report You can run a report using the options in the report context menu. To start a quick run with default options, use Quick Run with default options. The Report Parameters page displays. Confirm the settings and click Run Now. To run a report in the background click Run in Background. Follow the same actions as in the Quick Run procedure. To run a report with full control over all settings, click Run Report. Select the Template, Report Format, and the Filter Criteria for Adhoc Reports, or select the Report Delivery Options for all other reports. Adhoc Reports also offer a Preview function. Decide whether to run the report now or in the background. Then you can configure the Report Parameters and click Run Now or Run in Background. To save a report after it runs, click the Publish Report icon in the header bar of the report. Find recently run reports in the My Reports page. To open the My Reports page, complete the following steps. 1. Open the Navigation tab. 2. In the Inbox section, click Reports. The published reports appear on the Published Reports page that is also opened in the Reports section of the Navigation > Inbox tab. Customize reports and configure properties Select Customize Report to open the Adhoc Report Designer for adhoc reports and the Web Studio for all other reports. Properties and Advanced Properties open in a pop-up window. Make changes and click Save to save the changes or Cancel to discard all changes. 71
72 Manage reports You can manage your report by completing one of the following options. Right-click a report in the Repository and select one or all of the following options. Add reports to the Favorites list. View the description or download a report. Copy or Cut reports and Paste the report into another category. Administrators have the right to delete reports. A warning message prompts you to confirm the deletion. Note Deleted reports cannot be restored. Manage folders and reports You can manage reports and categories through the Navigation > Repository > Manage Folders and Reports options. Users who do not have Administrator privilegesl only have access to categories they created. The top section of managing folders and reports allows the user to work with the folders or categories and create, change the name, or delete a folder or category. To manage report properties, complete the following steps. 1. Browse to the folder in the drop-down list next to the Look in option. 2. Select a report from the available list. 3. View the properties of the selected report below the reports field. 4. Optional. You can configure the Report properties such as Report Name, Design Mode, Public vs. Private availability and the Read Only setting. Additionally, you can configure default parameters that include a default database connection to use for the report, a default output format, and a default printer setting. Report Availability Properties include the following options. Public. The report is available to all users with access. Private. The report is available only to the user who uploads the report. Hidden. The report does not display on the report list. 5. Click the Advanced button to open the Advanced properties window of the report. 72
73 Report notifications Configure report notifications in the Notify section of the Navigation tab. The notifications enable you to automatically receive information when pre-set conditions are satisfied. For example, if field level extraction is below a certain threshold, you can trigger a report notification. There are two options in the Notify section - Subscribe and View Alerts. The View Alerts section lists all the alerts you selected. The Subscribe menu option allows you to view the notifications and add subscriptions. All available notifications display on the left side, subscriptions display on the right side.on the subscriptions side you can edit and unsubscribe the subscriptions and view alerts. To add a subscription, click the Subscribe icon next to the notification name. For , the page is divided into the following three sections. Alert Message. message details Alert When. The time and frequency that the parameter will run. This includes the hour, day of week, week of the month, or month Message Delivery Options.: Who is on the notification list Customize reports Report objects Report Objects are stored in the Repository. Only users with Administrator privileges can create and edit these objects. Query Object Editor The Data Model > Category Name > Query Objects menu options allow you to view, edit, create, and delete queries for adhoc reports. The Create Query Object icon for a new Query Object and the Edit Query Details icon for an existing Query object both open the Query Object Editor. 73
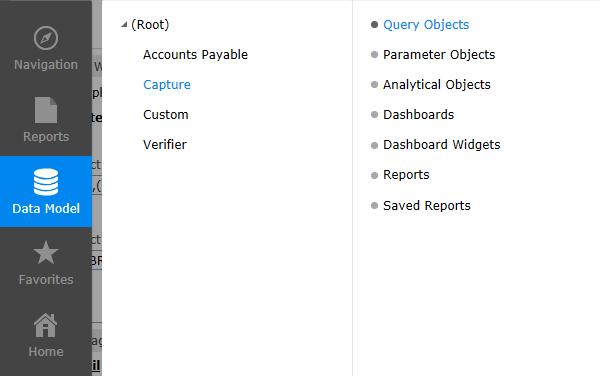
74 74
75 The following elements dispay in the Query Object Editor. 1. Connection and SQL properties 2. Fields properties Connection and SQL properties After the query is selected, you can view or edit the SQL properties of the query, including the SQL script that runs to execute the query, the connection used by the query, and the fields returned by the query. Note If there are any scripting errors when executing the query, look in the client logs. Fields The fields dynamically change based on the query you run. The icons to the left of the field name are a quick way to view the field type. Different properties and lookup values display to the right of the Fields list based on the field type. For instance, if the field is linked to another field, the hyperlink displays in blue (HyperLink) and you can then select the icon to the right of it so that you can make changes in the report that it drills-down to, where the drilldown report displays, and the report parameters. If this same field is a date field, then the icon directly to the left of the field name is a calendar icon. Icon Action Hyperlinked to Another Report User Defined SQL Date Data Type Number Data Type 75
76 Icon Action Text Data Type User Defined SQL that is Fetched on Every Use Hyperlink reports 1. To add a hyperlink to a report, open a Query Object in the Query Object Editor. 2. Click Format in the Transformation pane. Click the Hyperlink button. 3. A configuration box displays providing the following options. URL. Refer to the Hyperlink a field to open a specific URL section. Drill down to another Report. Refer to the Hyperlink the field to open a specific report section. Hyperlink a field to open a specific URL 1. Click the URL option. 2. In the box provided below the URL button, specify the URL. 3. Click OK. 76


77 Hyperlink the field to open a specific report 1. Select on the Drill down to another Report option. 2. In Select entry box, select the report that should be opened when the hyperlink is clicked. 3. Select the most appropriate option for Target. This is the way the report in the hyperlink will open. 4. Specify values for the Report Parameters if required. 5. Specify System Parameter if required. 6. Click OK. Report Parameter is the parameter in the report being set as hyperlink. Value field is the field within the report that will have a hyperlink. For details on the System Parameters and their values, refer to online help for the Hyperlink options window. 77

78 Prefetch drilldown On a report, when a user clicks a hyperlink, Perceptive Intelligent Capture Visibility starts generating the hyperlinked report (also known as drilldown report) and displays it. For longer child reports, this may take some time. Use PREFETCH_DRILLDOWN to save time taken for generation of child reports. When this feature is turned on, Perceptive Intelligent Capture Visibility generates a drilldown report (child report) along with the parent report (even if the user has not clicked the hyperlink on the parent report). This way since the hyperlinked report (also known as drilldown report or child report) will be already been generated before the user clicks the link, user will get a much faster response. How it works When a report that has hyperlinked report with Prefetch drilldown = TRUE at the end of the URL, Visibility generates the hyperlinked report and stores the information on the report server in RPG format. When a user clicks the hyperlink on the parent report, Perceptive Intelligent Capture Visibility picks up the pregenerated report and presents the report in whichever format the user has requested. This allows for a faster response time. Note If a parent report is saved (published), all the child reports also are saved for the same time. For example, if a parent report is published up to January , all the child reports also are published up to January If a parent report is only viewed (for example, HTML), all the child reports are generated and saved. However, in this case, they are available only up to the same day at midnight. For example, if a parent report is viewed on May , all the child reports are generated and available up to May , 11:59:59 pm. Visibility starts the process to delete those reports at midnight. Parameter Object Editor On the Parameter Object menu in the repository, you can add a parameter, edit parameter details, or delete a parameter. 78
79 To add a new Parameter Object, complete the following steps. 1. Navigate to Data Model > Category Name > Parameter Objects 2. Righ click Parameter Objects and select Create Parameter Object 3. Configure the new parameter in the Parameter Object Editor. To change an existing parameter, complete the following steps. 1. Select the parameter from the Parameter Objects list. 2. Click the Edit Parameter Details slide menu option. 3. Configure the properties and input type information in the Parameter Object Editor. 79
80 Properties Set the parameter name, the prompt name, the format of the parameter (general, number, currency, date, time, percentage, scientific, text, Network), size (Perceptive recommends that it is set at 2000), format, default value, and description. You can also set the following properties. Mandatory: If it is mandatory, then a default value must be provided. Visible: Sets whether a parameter is displayed in the report s parameter list. Uncheck if they will be passed on by another method, i.e. they are drilled down from another report. Forced: Values are forced to the specific user or group. Pass Values Using Tables: Only used when the parameters are very large. Input type You can set the following input types for your parameter. Textbox Combo: If it is a single select parameter, a drop down box is displayed. If it is a Multi Select parameter, a fixed list box is displayed. Option: Used when you can only choose one at a time Combo Sources: Pre-defined (they are determined outside of the database, Monday=day 1, Tuesday = day 2) or SQL (can type in SQL script and then click verify SQL ) Multi Select, Search, Tree View, and Linked are dependent on the other parameters that are chosen, select the tab name from the table then configure the combo source. Parameter Value Groups To open the Parameter Value Groups page, 1. Go to the Navigation tab in the side menu. 2. Open the Repository section. 3. Click Report Objects. The Query Objects page opens in the viewer area. 4. Select the Parameter Value Groups tab. Parameter value groups, mainly applicable with multi-select and forced parameters, are used when you have a specific requirement where you only use a specific set of parameters. You can then choose the specific parameters that are going to be included so that they are easily available when a user is going to run a report. If required, the users are still able to add other parameters that are not available from the list. 80
81 These groups are not overwritten when a new CAB file is deployed. Even though the Value Groups may be using a parameter overwritten by the new CAB file, the Value Groups are stored separately from the parameters themselves. For example, you make groups for the US, Europe, and Management. The prmorganization parameter values could then be added to their respective groups (US company codes in the US Group, EU company codes in the Europe Group, and all company codes in the Management Group). These groups could then be selected when forcing a parameter values rather than forcing the individual company codes. 81

82 Deploy a Report Bundle Administrator users can deploy repository bundles (CAB/IRB file). To open the Deploy Repository Bundle page, complete the following steps. 1. Got to the Navigation tab of the side menu. 2. Open the Repository section and click Deploy Repository Bundle. 3. To deploy the file, upload the file from its location, and then click the Deploy button. If you want to create a log file, make sure that the Create Log File is selected. There are five deployment statuses. Deployment Status Object is updated Object is not updated Description The object is presently available and will be replaced by the one being uploaded. The object is presently available but will NOT be replaced by the one being uploaded. New object A brand new object is created. Deny deploying The object was not deployed. Delete Object The object will be removed from the repository if it already exists. 82
Perceptive Intelligent Capture Visibility
 Perceptive Intelligent Capture Visibility Installation and Setup Guide Version: 3.x Written by: Product Knowledge, R&D Date: September 2016 2015 Lexmark International Technology, S.A. All rights reserved.
Creating Dashboard Widgets. Version: 16.0
 Creating Dashboard Widgets Version: 16.0 Copyright 2017 Intellicus Technologies This document and its content is copyrighted material of Intellicus Technologies. The content may not be copied or derived
Brainware Intelligent Capture Visibility
 Brainware Intelligent Capture Visibility Installation and Setup Guide Version: 3.2.x Written by: Product Knowledge, R&D Date: September 2018 Copyright 2009-2018 Hyland Software, Inc. and its affiliates.
Business Insight Authoring
 Business Insight Authoring Getting Started Guide ImageNow Version: 6.7.x Written by: Product Documentation, R&D Date: August 2016 2014 Perceptive Software. All rights reserved CaptureNow, ImageNow, Interact,
Creating Dashboard. Version: 7.3
 Creating Dashboard Version: 7.3 Copyright 2015 Intellicus Technologies This document and its content is copyrighted material of Intellicus Technologies. The content may not be copied or derived from, through
07/20/2016 Blackbaud Altru 4.91 Reports US 2016 Blackbaud, Inc. This publication, or any part thereof, may not be reproduced or transmitted in any
 Reports Guide 07/20/2016 Blackbaud Altru 4.91 Reports US 2016 Blackbaud, Inc. This publication, or any part thereof, may not be reproduced or transmitted in any form or by any means, electronic, or mechanical,
Intellicus Getting Started
 Intellicus Getting Started Intellicus Web-based Reporting Suite Version 4.5 Enterprise Professional Smart Developer Smart Viewer Intellicus Technologies info@intellicus.com www.intellicus.com Copyright
IQ Bot Trial Quick Start Guide
 AUTOMATION ANYWHERE IQ Bot Trial Quick Start Guide Document Version 1.0 Date of Publication 23/10/2018 Update(s) to Document Edition First Edition Table of Contents Table of Contents... 2 1 Introduction...
Interstage Business Process Manager Analytics V12.1 Studio Guide
 Interstage Business Process Manager Analytics V12.1 Studio Guide Solaris April 2013 Studio Guide Trademarks Trademarks of other companies are used in this documentation only to identify particular products
Business Intelligence Launch Pad User Guide SAP BusinessObjects Business Intelligence Platform 4.1 Support Package 1
 Business Intelligence Launch Pad User Guide SAP BusinessObjects Business Intelligence Platform 4.1 Support Package 1 Copyright 2013 SAP AG or an SAP affiliate company. All rights reserved. No part of this
ZENworks Reporting System Reference. January 2017
 ZENworks Reporting System Reference January 2017 Legal Notices For information about legal notices, trademarks, disclaimers, warranties, export and other use restrictions, U.S. Government rights, patent
Batch Scheduler. Version: 16.0
 Batch Scheduler Version: 16.0 Copyright 2018 Intellicus Technologies This document and its content is copyrighted material of Intellicus Technologies. The content may not be copied or derived from, through
Creating Dashboard Widgets. Version: 7.3
 Creating Dashboard Widgets Version: 7.3 Copyright 2015 Intellicus Technologies This document and its content is copyrighted material of Intellicus Technologies. The content may not be copied or derived
Widgets for SAP BusinessObjects Business Intelligence Platform User Guide SAP BusinessObjects Business Intelligence platform 4.1 Support Package 2
 Widgets for SAP BusinessObjects Business Intelligence Platform User Guide SAP BusinessObjects Business Intelligence platform 4.1 Support Package 2 Copyright 2013 SAP AG or an SAP affiliate company. All
Desktop Studio: Charts. Version: 7.3
 Desktop Studio: Charts Version: 7.3 Copyright 2015 Intellicus Technologies This document and its content is copyrighted material of Intellicus Technologies. The content may not be copied or derived from,
CCRS Quick Start Guide for Program Administrators. September Bank Handlowy w Warszawie S.A.
 CCRS Quick Start Guide for Program Administrators September 2017 www.citihandlowy.pl Bank Handlowy w Warszawie S.A. CitiManager Quick Start Guide for Program Administrators Table of Contents Table of Contents
SANTANDER TREASURY LINK USER GUIDE
 SANTANDER TREASURY LINK USER GUIDE Welcome to Santander Treasury Link Santander Treasury Link is a secure Web application that allows you to manage accounts, payments, transfers, reports, and users. This
SAS Web Report Studio 3.1
 SAS Web Report Studio 3.1 User s Guide SAS Documentation The correct bibliographic citation for this manual is as follows: SAS Institute Inc. 2006. SAS Web Report Studio 3.1: User s Guide. Cary, NC: SAS
Perceptive Intelligent Capture Visibility
 Perceptive Intelligent Capture Visibility Upgrade Guide Version: 3.0.x Written by: Product Knowledge, R&D Date: September 2016 2015 Lexmark International Technology, S.A. All rights reserved. Lexmark is
Perceptive Data Transfer
 Perceptive Data Transfer User Guide Version: 6.5.x Written by: Product Knowledge, R&D Date: September 2016 2015 Lexmark International Technology, S.A. All rights reserved. Lexmark is a trademark of Lexmark
Desktop Studio: Charts
 Desktop Studio: Charts Intellicus Enterprise Reporting and BI Platform Intellicus Technologies info@intellicus.com www.intellicus.com Working with Charts i Copyright 2011 Intellicus Technologies This document
Web Client User Guide
 ImageTag, Inc. 2016 Contents Introduction... 2 Logging Into Your KwikTag Client... 3 KwikTag Tabs and Your Landing Page... 4 Drawers Tab Features and Functions... 7 My Lists... 7 The KwikTag Library...
Perceptive Document Composition
 Perceptive Document Composition Client Product Guide PDC Version: 5.4 Written by: Product Documentation, R&D Date: February 2014 2014 Perceptive Software. All rights reserved Perceptive Software is a trademark
Designing Adhoc Reports
 Designing Adhoc Reports Intellicus Enterprise Reporting and BI Platform Intellicus Technologies info@intellicus.com www.intellicus.com Copyright 2010 Intellicus Technologies This document and its content
ACTIVE Net Insights user guide. (v5.4)
") ACTIVE Net Insights user guide (v5.4) Version Date 5.4 January 23, 2018 5.3 November 28, 2017 5.2 October 24, 2017 5.1 September 26, 2017 ACTIVE Network, LLC 2017 Active Network, LLC, and/or its affiliates
ACTIVE Net Insights user guide (v5.4) Version Date 5.4 January 23, 2018 5.3 November 28, 2017 5.2 October 24, 2017 5.1 September 26, 2017 ACTIVE Network, LLC 2017 Active Network, LLC, and/or its affiliates
Pure Storage FlashArray Management Pack for VMware vrealize Operations Manager User Guide. (Version with Purity 4.9.
 Pure Storage FlashArray Management Pack for VMware vrealize Operations Manager User Guide (Version 1.0.139 with Purity 4.9.x or higher) Sunday, November 27, 2016 16:13 Pure Storage FlashArray Management
BeetleEye Application User Documentation
 BeetleEye Application User Documentation BeetleEye User Documentation 1 Table of Contents Welcome to the BeetleEye Application... 6 Overview... 6 Navigation... 6 Access BeetleEye... 6 Update account information...
Designing Adhoc Reports
 Designing Adhoc Reports Intellicus Web-based Reporting Suite Version 4.5 Enterprise Professional Smart Developer Smart Viewer Intellicus Technologies info@intellicus.com www.intellicus.com Copyright 2009
Interstage Business Process Manager Analytics V12.0 Studio Guide
 Interstage Business Process Manager Analytics V12.0 Studio Guide Windows/Linux January 2012 Studio Guide Trademarks Trademarks of other companies are used in this documentation only to identify particular
New Finance Officer & Staff Training
 New Finance Officer & Staff Training Overview MUNIS includes many programs and tools to allow for the management of the District financials. As newer finance officers and staff, you are charged with understanding,
Manage and Generate Reports
 Report Manager, page 1 Generate Reports, page 3 Trust Self-Signed Certificate for Live Data Reports, page 4 Report Viewer, page 4 Save an Existing Stock Report, page 7 Import Reports, page 7 Export Reports,
User Manual instantolap
 User Manual instantolap Version 2.7.0 15.12.2010 Page 2 / 213 instantolap User Manual 2.7.0 instantolap User Manual 2.7.0 Page 3 / 213 Copyright Copyright (C) 2002-2010 Thomas Behrends Softwareentwicklung
Monitoring Replication
 Replicator Monitoring Replication VERSION 7.4.0 January 04, 2018 Scenario Guide Article 1130112-02 www.metalogix.com info@metalogix.com 202.609.9100 Copyright International GmbH, 2002-2018 All rights reserved.
[ Getting Started with Analyzer, Interactive Reports, and Dashboards ] ]
![[ Getting Started with Analyzer, Interactive Reports, and Dashboards ] ]](/thumbs/88/117545107.jpg "[ Getting Started with Analyzer, Interactive Reports, and Dashboards ] ]") Version 5.3 [ Getting Started with Analyzer, Interactive Reports, and Dashboards ] ] https://help.pentaho.com/draft_content/version_5.3 1/30 Copyright Page This document supports Pentaho Business Analytics
Version 5.3 [ Getting Started with Analyzer, Interactive Reports, and Dashboards ] ] https://help.pentaho.com/draft_content/version_5.3 1/30 Copyright Page This document supports Pentaho Business Analytics
ImageNow eforms. Getting Started Guide. ImageNow Version: 6.7. x
 ImageNow eforms Getting Started Guide ImageNow Version: 6.7. x Written by: Product Documentation, R&D Date: September 2016 2014 Perceptive Software. All rights reserved CaptureNow, ImageNow, Interact,
Portfolios Creating and Editing Portfolios... 38
 Portfolio Management User Guide 16 R1 March 2017 Contents Preface: Using Online Help... 25 Primavera Portfolio Management Overview... 27 Portfolio Management Software for Technology Leaders... 27 Solution
RL6 - WORKING WITH REPORTS
 RL6 - WORKING WITH REPORTS If you have RL6 Risk questions please contact: RL_support@wrha.mb.ca or (204) 926-1070 WRHA Quality Improvement & Patient Safety Version: 3.0, November 2, 2018 WORKING WITH REPORTS
User Guide for TASKE Contact Web Interface
 User Guide for TASKE Contact Web Interface For Avaya Communication Manager with Application Enablement Services Version: 8.9 Date: 2011-06 This document is provided to you for informational purposes only.
Associated Connect. Quick Reference Guide: Lockbox
 Associated Connect Quick Reference Guide: Lockbox Page 2 of 12 Table of Contents Associated Connect Lockbox Module...3 Getting started...3 Lockbox Menu...3 Dashboard...4 Customer Delivery...4 Profile...4
ZENworks Reporting Beta System Reference. December 2015
 ZENworks Reporting Beta System Reference December 2015 Legal Notices Novell, Inc. makes no representations or warranties with respect to the contents or use of this documentation, and specifically disclaims
Style Report Enterprise Edition
 INTRODUCTION Style Report Enterprise Edition Welcome to Style Report Enterprise Edition! Style Report is a report design and interactive analysis package that allows you to explore, analyze, monitor, report,
2015 Entrinsik, Inc.
 2015 Entrinsik, Inc. Table of Contents Chapter 1: Creating a Dashboard... 3 Creating a New Dashboard... 4 Choosing a Data Provider... 5 Scheduling Background Refresh... 10 Chapter 2: Adding Graphs and
Contents. Properties: Field Area Fields Add a Table to a Form... 23
 Workflow Design Guide Version 18 February 2018 Contents About This Guide... 7 Workflows and Forms Overview... 7 Security Permissions for Workflows and Forms... 8 Search for a Workflow Design, Workflow
Enhancements Guide. Applied Business Services, Inc. 900 Wind River Lane Suite 102 Gaithersburg, MD General Phone: (800)
") Enhancements Guide Applied Business Services, Inc. 900 Wind River Lane Suite 102 Gaithersburg, MD 20878 General Phone: (800) 451-7447 Support Telephone: (800) 451-7447 Ext. 2 Support Email: support@clientaccess.com
Enhancements Guide Applied Business Services, Inc. 900 Wind River Lane Suite 102 Gaithersburg, MD 20878 General Phone: (800) 451-7447 Support Telephone: (800) 451-7447 Ext. 2 Support Email: support@clientaccess.com
BMC Remedy Action Request System Using a BIRT Editor to Create or Modify Web Reports
 White Paper BMC Remedy Action Request System 7.6.04 Using a BIRT Editor to Create or Modify Web Reports September 2012 www.bmc.com Contacting BMC Software You can access the BMC Software website at http://www.bmc.com.
BBVA Compass Spend Net Payables
 User Guide BBVA Compass Spend Net Payables User Guide Vault Services Table of Contents Introduction 2 Technical Requirements 2 Getting started 3 Sign In 3 General Navigation 4 Upload/Create Payment 5
Contents. Add a Form Element to a Group Box Add a Field to a Form... 22
 Workflow Design Guide Version 17 November 2017 Contents About This Guide... 7 Workflows and Forms Overview... 7 Security Permissions for Workflows and Forms... 8 Search for a Workflow Design, Workflow
User Guide. Web Intelligence Rich Client. Business Objects 4.1
 User Guide Web Intelligence Rich Client Business Objects 4.1 2 P a g e Web Intelligence 4.1 User Guide Web Intelligence 4.1 User Guide Contents Getting Started in Web Intelligence 4.1... 5 Log into EDDIE...
Policy Commander Console Guide - Published February, 2012
 Policy Commander Console Guide - Published February, 2012 This publication could include technical inaccuracies or typographical errors. Changes are periodically made to the information herein; these changes
Sage Paperless Construction
 Sage Paperless Construction Release Notes Version 6.3 2018. The Sage Group plc or its licensors. All rights reserved. Sage, Sage logos, and Sage product and service names mentioned herein are the trademarks
2013 RELEASE / S RELEASE COMPARISON GUIDE CONFIGURATION NAVIGATION APPLICATION AREA IN BULLHORN 2013 IN BULLHORN S
 2013 RELEASE / S RELEASE COMPARISON GUIDE CONFIGURATION Browser Support Computer Support NAVIGATION Internet Explorer PC Menus Row of entity menus across the top of the page Chrome, Firefox, Safari (Mac),
Configuring External Links in Visual Discovery AE
 Copyright 2014 WebFOCUS Release 8.0 Version 08 July 2014 Technical Memo Information Builders Two Penn Plaza New York, NY 10121-2898 (212) 736-4433 TM4742 Configuring External Links in Visual Discovery
Table of Contents Chapter 1: Getting Started System requirements and specifications Setting up an IBM Cognos portal Chapter 2: Roambi Publisher
 Table of Contents Chapter 1: Getting Started 7 Roambi workflow 7 System requirements and specifications 8 Supported versions of IBM Cognos 8 Single sign-on support 8 Setting up an IBM Cognos portal 8 Chapter
10 Minute Demonstration Script
 10 Minute Demonstration Script Table of Contents The Demo... 3 The Interface... 3 Demo Flow... 3 Capture and Indexing... 4 Searches... 6 Integration and Workflow... 8 2 P a g e The Demo Most demonstrations
SAS Infrastructure for Risk Management 3.4: User s Guide
 SAS Infrastructure for Risk Management 3.4: User s Guide SAS Documentation March 2, 2018 The correct bibliographic citation for this manual is as follows: SAS Institute Inc. 2017. SAS Infrastructure for
Intellicus Enterprise Reporting and BI Platform
 Getting Started with Intellicus Intellicus Enterprise Reporting and BI Platform Intellicus Technologies info@intellicus.com www.intellicus.com Getting Started with Intellicus i Copyright 2012 Intellicus
Publishing Platform for Retail
 Publishing Platform for Retail What s New Version: 9.2.x Written by: Product Documentation, R&D Date: September 2014 2014 Perceptive Software. All rights reserved. Perceptive Software is a trademark of
User Guide. Product: GreenFolders. Version: 3.8
 User Guide Product: GreenFolders Version: 3.8 Release Date: October 2014 GreenFolders 3.8 User Guide Introduction Table of Contents 1 Introduction... 6 2 General Information... 7 2.1 Login Procedure...
Steps: 1. Log in to the Dmitri application through the following website URL, as appropriate:
 Dmitri Suite Getting Started Logging In and Logging Out Logging In Use the following steps to log in to the Dmitri application. Steps: 1. Log in to the Dmitri application through the following website
Contents. Common Site Operations. Home actions. Using SharePoint
 This is a companion document to About Share-Point. That document describes the features of a SharePoint website in as much detail as possible with an emphasis on the relationships between features. This
Project and Portfolio Management Center
 Project and Portfolio Management Center Software Version: 9.42 Getting Started Go to HELP CENTER ONLINE http://admhelp.microfocus.com/ppm/ Document Release Date: September 2017 Software Release Date: September
If you have questions or need assistance in any way, please contact MicroEdge Technical Support.
 AngelPoints Advanced Reporting Users Guide 2017 Advanced Reporting leverages existing technologies current employed in GIFTS Online to provide AngelPoints users with a new and more robust environment to
SAP BusinessObjects Live Office User Guide SAP BusinessObjects Business Intelligence platform 4.1 Support Package 2
 SAP BusinessObjects Live Office User Guide SAP BusinessObjects Business Intelligence platform 4.1 Support Package 2 Copyright 2013 SAP AG or an SAP affiliate company. All rights reserved. No part of this
Business Online Banking User Guide
 Business Online Banking User Guide Table of Contents Contents Overview... 2 Logging In... 2 Additional Login Information... 5 Home/Dashboard... 6 Top Line Tool Bar... 6 Bulletins... 7 Dashboard... 8 Accounts...
HTML REPORT VIEWER. Intellicus Enterprise Reporting and BI Platform. Intellicus Technologies
 HTML REPORT VIEWER Intellicus Enterprise Reporting and BI Platform Intellicus Technologies info@intellicus.com www.intellicus.com HTML Viewer i Copyright 2012 Intellicus Technologies This document and
you choose and by the roles the users are allowed to fulfill within the system. Finances Enter the monthly savings and costs for the project.
 Oracle Instantis EnterpriseTrack Quick Reference Guide for Release 8.5 Create a Proposal From the Top Navigation Bar, click Create Proposals/Charters. Enter all the required fields and click Save to save
Dashboards. Overview. Overview, page 1 Dashboard Actions, page 2 Add Widgets to Dashboard, page 4 Run a Report from the Dashboard, page 6
 Overview, page 1 Dashboard Actions, page 2 Add Widgets to Dashboard, page 4 Run a Report from the Dashboard, page 6 Overview In Cisco Unified Intelligence Center, Dashboard is an interface that allows
BillQuick 2011 Update Log
 BillQuick 2011 Update Log List of Items addressed in release 12.0.68 August 27, 2012 1. In Expense Log screen, View By Project mode, the Project drop-down would allow us to enter project Ids that were
HP Service Manager. Software Version: 9.41 For the supported Windows and UNIX operating systems. SM Reports help topics for printing
 HP Service Manager Software Version: 9.41 For the supported Windows and UNIX operating systems SM Reports help topics for printing Document Release Date: September 2015 Software Release Date: September
User s Manual. Version 5
 User s Manual Version 5 Copyright 2017 Safeway. All rights reserved. No part of this publication may be reproduced, transmitted, transcribed, stored in a retrieval system, or translated into any language,
Performance Evaluation Essentials
 Performance Evaluation Essentials Program Outline Table of contents Quick Reference Guide Navigating the myua Dashboard... 3 Quick Reference Guide Create Performance Evaluation... 4 Quick Reference Guide
Teamcenter Mobility Product decisions, anywhere, anytime. Features. Siemens AG All Rights Reserved.
 Teamcenter Mobility Product decisions, anywhere, anytime Features Settings App settings are located in the ipad Settings application. Page 2 Settings Toggles in the Settings pane allow you to hide tabs
Sappi Ariba Network. Summit Guided Session: Account Configuration
 Sappi Ariba Network Summit Guided Session: Account Configuration 1 Manage invitation letter + 2 Landing Page Sappi 2 1 1 Open the Invitation Letter that you received at your email address from ordersender-prod@ansmtp.ariba.com
Table of Contents. Table of Contents
 Powered by 1 Table of Contents Table of Contents Dashboard for Windows... 4 Dashboard Designer... 5 Creating Dashboards... 5 Printing and Exporting... 5 Dashboard Items... 5 UI Elements... 5 Providing
GOBENCH IQ Release v
 GOBENCH IQ Release v1.2.3.3 2018-06-11 New Add-Ons / Features / Enhancements in GOBENCH IQ v1.2.3.3 GOBENCH IQ v1.2.3.3 contains several new features and enhancements ** New version of the comparison Excel
1 Dashboards Administrator's Guide
 1 Dashboards Administrator's Guide Page 1 2 Dashboards Administrator's Guide Table of Contents FAQs... 4 Q: Why does my browser tell me Microsoft Silverlight is required when I am trying to view a Visualization?
ControlPoint. Evaluation Guide. November 09,
 ControlPoint Evaluation Guide November 09, 2017 www.metalogix.com info@metalogix.com 202.609.9100 Copyright International GmbH., 2008-2017 All rights reserved. No part or section of the contents of this
s i m p l y w o r k s
 CARA is an ergonomically designed, fast, web user interface and business rules engine, currently released for the following platforms: Documentum (alternative to Webtop or D2) Oracle WebCenter Alfresco
Batch and Import Guide
 Batch and Import Guide 06/13/2017 Blackbaud Altru 4.96 Batch and Import US 2017 Blackbaud, Inc. This publication, or any part thereof, may not be reproduced or transmitted in any form or by any means,
Ministry of Education
 Ministry of Education EFIS 2.0 - User Version 2.0 June 2015 Table of Contents 1 Document History... 4 2 Logon to EFIS 2.0... 5 2.1 Logon through Go Secure... 5 2.2 Bookmarking the Link... 6 3 Planning
Rabo Supplier Finance User Manual - Suppliers -
 Rabo Supplier Finance User Manual - Suppliers - Page 2 of 33 Table of Contents 1 About This Document... 3 1.1 Objectives of This Document... 3 1.2 Inside This Document... 3 2 Rabo Supplier Finance platform...
Viewer. Quick Reference Guide
 Viewer Quick Reference Guide igrafx 2009 Viewer Quick Reference Guide Table of Contents igrafx Viewer Quick Reference Guide........................................................3 igrafx Viewer Interface..................................................
Dashboard / Output Guide
 FUJITSU Software Interstage Business Process Manager Analytics V12.2.1 Dashboard / Output Guide Linux B1X1-0106-04ENZ0(00) December 2014 About this Manual This section explains summary, chapter overview,
EFIS User Guide Family Support Programs User
 Ministry of Education EFIS 2.0 - User Guide Family Support Programs User Version 2.0 June 2015 Table of Contents 1 Document History... 1 2 Logon to EFIS 2.0... 2 2.1 Logon through Go Secure... 2 2.2 Bookmarking
Admin Training. PaperSave Miami Green Way, 11th Floor, Miami, Florida USA
 Admin Training PaperSave 5.2 3150 Miami Green Way, 11th Floor, Miami, Florida 33146. USA 877 727 3799 305 373 0056 www.papersave.com PaperSave is a product of WhiteOwl - www.whiteowlsolutions.com TABLE
Moving You Forward A first look at the New FileBound 6.5.2
 Moving You Forward A first look at the New FileBound 6.5.2 An overview of the new features that increase functionality and ease of use including: FileBound 6.5.2 Service Pack FileBound Capture 6.6 New
Expense: Process Reports
 Expense: Process Reports User Guide for Standard Edition Applies to these SAP Concur solutions: Expense Professional/Premium edition Standard edition Travel Professional/Premium edition Standard edition
Kaseya 2. User Guide. for VSA 6.3
 Kaseya 2 InfoCenter User Guide for VSA 6.3 September 25, 2013 Agreement The purchase and use of all Software and Services is subject to the Agreement as defined in Kaseya s Click-Accept EULA as updated
Learn how to login to Sitefinity and what possible errors you can get if you do not have proper permissions.
 USER GUIDE This guide is intended for users of all levels of expertise. The guide describes in detail Sitefinity user interface - from logging to completing a project. Use it to learn how to create pages
The following topics describe how to work with reports in the Firepower System:
 The following topics describe how to work with reports in the Firepower System: Introduction to Reports Introduction to Reports, on page 1 Risk Reports, on page 1 Standard Reports, on page 2 About Working
Red Hat CloudForms 4.0 Monitoring, Alerts, and Reporting
 Red Hat CloudForms 4.0 Monitoring, Alerts, and Reporting Creating and managing reports, feeds, and widgets in CloudForms Management Engine Red Hat CloudForms Documentation Team Red Hat CloudForms 4.0
Virto SharePoint Forms Designer for Office 365. Installation and User Guide
 Virto SharePoint Forms Designer for Office 365 Installation and User Guide 2 Table of Contents KEY FEATURES... 3 SYSTEM REQUIREMENTS... 3 INSTALLING VIRTO SHAREPOINT FORMS FOR OFFICE 365...3 LICENSE ACTIVATION...4
Perceptive Process Mining
 Perceptive Process Mining Getting Started Guide Version: 2.7.x Written by: Product Knowledge, R&D Date: September 2016 2016 Lexmark. All rights reserved. Lexmark is a trademark of Lexmark International
USER GUIDE. June 2012 VERSION 1.0. Supplier Portal. Kimberly-Clark. E-sourcing
 USER GUIDE June 2012 VERSION 1.0 Supplier Portal Kimberly-Clark E-sourcing Copyright 2005, Kimberly-Clark Worldwide, Inc. All rights reserved. This document and its associated training materials are proprietary
ALES Wordpress Editor documentation ALES Research websites
 ALES Wordpress Editor documentation ALES Research websites Contents Login... 2 Website Dashboard... 3 Editing menu order or structure... 4 Add a new page... 6 Move a page... 6 Select a page to edit...
ER/Studio Enterprise Portal User Guide
 ER/Studio Enterprise Portal 1.1.1 User Guide Copyright 1994-2009 Embarcadero Technologies, Inc. Embarcadero Technologies, Inc. 100 California Street, 12th Floor San Francisco, CA 94111 U.S.A. All rights
Tyler Dashboard. User Guide Version 5.8. For more information, visit
 Tyler Dashboard User Guide Version 5.8 For more information, visit www.tylertech.com. TABLE OF CONTENTS Tyler Dashboard... 4 Tyler Dashboard Features... 4 Tyler Dashboard Ribbon... 4 User Views... 5 Tools...
Product Documentation. ER/Studio Portal. User Guide. Version Published February 21, 2012
 Product Documentation ER/Studio Portal User Guide Version 1.6.3 Published February 21, 2012 2012 Embarcadero Technologies, Inc. Embarcadero, the Embarcadero Technologies logos, and all other Embarcadero
Perceptive Matching Engine
 Perceptive Matching Engine Advanced Design and Setup Guide Version: 1.0.x Written by: Product Development, R&D Date: January 2018 2018 Hyland Software, Inc. and its affiliates. Table of Contents Overview...
Get Started. Estimating Explorer
 Get Started Estimating Explorer NOTICE This document and the Sage Timberline Office software may be used only in accordance with the accompanying Sage Timberline Office End User License Agreement. You