-Table of Contents- 1. Overview Installation and removal Operation Main menu Trend graph... 13
|
|
|
- Egbert Nichols
- 6 years ago
- Views:
Transcription
1 Thank you for buying Data Analysis Software. In order to use this software correctly and safely and to prevent trouble, please read this manual carefully. Notice 1. No part of this manual can be reproduced in any form without permission. 2. The contents of this manual may be altered without prior notice. 3. This manual has been documented by making assurance doubly sure. However, if any question arises or if any error, an omission, or other deficiencies are found, please contact your nearest Omega s sales agent. 4. Omega is not responsible for any operation results of this software. Windows 98, Windows Me, Windows NT, Windows 2000, Windows XP Home and Windows XP Pro are either trademarks or registered trademarks of Microsoft Corporation in the U.S. and other countries. Other brand and product names are trademarks or registered trademarks of their respective holders.
2 -Table of Contents- 1. Overview Main functions and features Operation environment Installation and removal Installation method Un-installation (Remove) method Operation Data analysis software block diagram Startup method of data analysis software Exiting data analysis software Easy to use! Operation Guide Main menu Trend graph File selection Data registration Data list Data between cursors Search Bar graph Insert message Edit message Alarm display Continuous replay Print screen View cursor Trend line Set scale axis Set time axis Set time display interval Title Legend Supplementary settings Magnify/Reduce/Rotate FTP FAQ
3 1. Overview Data analysis software is a software package to analyze the data acquired by the instrument of our company. 1-1 Main functions and features The data acquired by the instrument is displayed as trend. A number of data files can be compiled to one and displayed as a trend. Maximum 128 channels can be registered. Subtraction operations etc can also be registered. Acquired data can be printed, saved in CSV format or text format. Maximum value, minimum value, average value, standard deviation and median value can be displayed numerically and as graph. Two cursors can be displayed in the graph. Maximum value, minimum value, average value, standard deviation and median value between the cursors can be displayed as numeric value and graph. Graph can be magnified, reduced and partially magnified. Message can be inserted in the graph. Scale axis of graph can be logarithmically displayed. Trend graph can be printed. It can be saved as JPG or BMP. 1-2 Operation environment < Hardware > CPU Memory Disk drive 1GHz or above 256MB (512 MB or more is recommended) CD-ROM drive: 1 drive or more (necessary during installation) Hard disk drive: 1 drive or more for items with free space that is 100MB or more < Software > OS Windows 98/Me Windows 2000/XP Home/XP Pro Windows NT4.0 is out of scope of operation. Internet Explorer 4.0 or above is necessary. 2


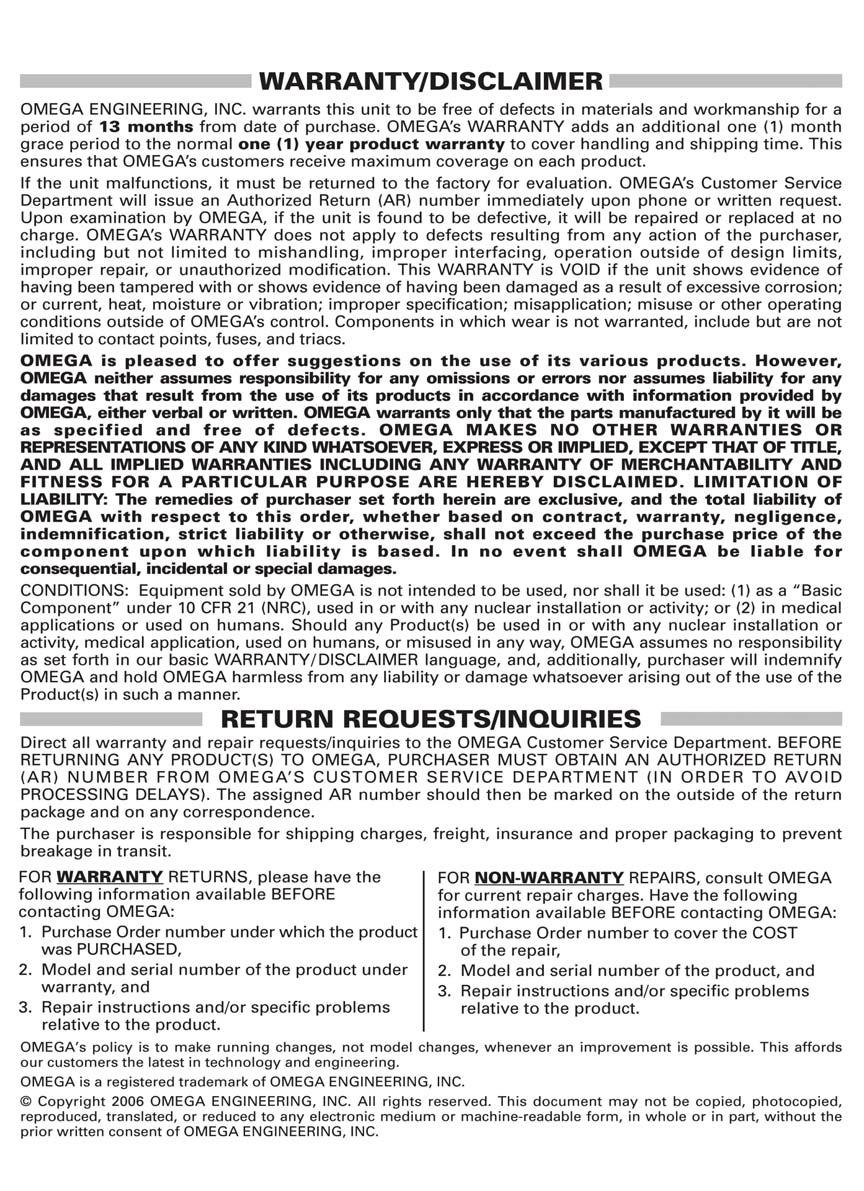
![Installation starts on clicking the [Next]](/docs-images/71/65557360/images/4-3.jpg "button.")
4 2. Installation and removal 2-1 Installation method Click Installation button. Installation screen gets display. Click Do as shown in the following screens. For changing the folder for installation click the [Browse] button. Installation starts on clicking the [Next] button. If restarting is necessary, do as per the message in the message box. 3


5 2-2 Un-installation (Remove) method Click Control Panel from All Programs from Start of Windows task bar. Select Add or Remove Programs Select Data Analysis At this point, folder related to data analysis software remains. In case of deleting all, delete the Analysis folder from explorer etc. 4
6 3. Operation 3-1 Data analysis software block diagram Main menu Screen that is initially displayed at the time of start up. Trend graph Trend graph is displayed. (Maximum 10 screens can be displayed.) Initialization Initializes the graph. File selection Selects file that is to be displayed as graph. Data registration Registers the channel to be displayed. (Subtraction operations can also be registered: Maximum 128 points) Data list Displays the data list. It can be printed and converted into CSV file. Data between cursors Displays the data between cursors A and B and the time difference. Displays whole data, maximum and minimum data between the cursors. Search Data can be searched. Bar graph Displays the data of cursor A and B as bar graph. Message Inserts message in the graph. Alarm display Registers the color, shape, size etc. of point at which alarm activates. Continuous replay Trend is continuously (automatically) scrolled. Print screen Graph can be printed, output on clipboard or saved in a file. Cursor Set cursors A and B on the graph. Trend line Sets the kind of line color, shape etc. of trend of each channel. Scale axis Display settings of scale axis are performed. Time axis Period to be displayed on 1 screen is set. Title Title is displayed on the graph and axis. Legend Legend is displayed on the graph. Supplementary settings Back color, kind of auxiliary line, color, interval etc. can be set. Magnify/reduce Graph can be moved/magnified/reduced, partially magnified and rotated. Vertical A number of screens are arranged vertically. Horizontal A number of screens are arranged horizontally FTP Connects to the instrument and transfers and receives the files. Version information Displays version information. Help Displays help file. 5


7 3-2 Startup method of data analysis software It is started by clicking Data analysis Omega - All programs - Start from Windows task bar. 3-3 Exiting data analysis software Click X on the right corner of the task bar. 6

 is double clicked, analysis software starts automatically and trend graph is displayed")
8 3-4 1.Select file File to be analyzed is selected. Following are the methods of selecting the files. (Select any one of the following methods) (1)Double click When data file (extension is krb or krf) is double clicked, analysis software starts automatically and trend graph is displayed (2)Drag and drop Start analysis software and when trend screen opens, drag and drop the file. 7

9 (3)File selection Start analysis software and when trend screen opens, click File selection icon. Select the file when File selection screen opens. 2.Trend display If file can be selected normally, it can be displayed as trend. (Range of the all data is displayed) 8
10 3.Changing the time axis Time axis can be expanded and the data in that time range can be displayed on 1 screen by magnifying it. Data that is out of range can be viewed by scrolling the screen. There are 2 methods of changing the time axis. (1)Specify the range of time axis by using mouse Drag (move the mouse) keeping the left button of the mouse pressed (starting point is fixed) from the point that is to be magnified and release the button on the point (end point is fixed); up to which it is to be magnified. (The range in black color that is rotating is magnified) (2)Specify the range of time axis by using keyboard Click the time axis button on the tool bar and open the following screen. On clicking OK after entering the duration, if there is no mistake in the input, specified range is displayed. 9
11 4.Changing the scale axis Scale axis can be expanded and the data in that time range can be displayed on 1 screen by magnifying it. There are 2 methods of changing the scale axis. (1)Specify the range of scale axis by using mouse Drag (move the mouse) keeping the left button of the mouse pressed (starting point is fixed) from the point (end point is fixed) that is to be magnified and release the button on the point, up to which it is to be magnified. (The range in black color that is rotating is magnified) (2)Specify the range of scale axis by using keyboard Click the scale axis button and open the following screen. On clicking OK button after entering Max value and Minimum value, if there is no mistake in the input, specified range is displayed. 10
 If the saved file is selected by method 1.")
12 5.Save The contents that are edited using data analysis software can be saved. Click the save button on the tool bar and enter the name of the file. (Extension krb) If the saved file is selected by method 1. Select file, the status at the time of saving can be reproduced. 11
13 4. Main menu It is the screen displayed immediately after starting. Trend screen is displayed. Up to 10 groups can be displayed. Multiple windows are arranged vertically and displayed. Multiple windows are arranged horizontally and displayed. File transfer and reception (FTP) with the instrument is done. Version information is displayed. Help is displayed. 12
.")
14 5. Trend graph It is the screen in which the acquired data is displayed as trend graph. There are 3 types of trend displays viz. horizontal trend, vertical trend and circular chart. Display is changed using the menu bar on the upper side of the screen. (Refer to page 35). In case of horizontal/vertical trend, all data is displayed on 1 screen and time axis can be magnified (Refer to Easy to use! Operation guide). Screen can be scrolled by using the scroll bar. In case of circular chart, data of 360 points (degrees) can be viewed in one lap. Screen is updated using previous and next buttons. On doing various settings using the tool bar, various screens are displayed and data analysis can be done. <Horizontal trend> Menu bar Tool bar <Circular chart> 13
15 Tool bar: Upper Clears all the information (Initialization). File selection screen is displayed. Select the data that is to be analyzed. Saves the current status.(extension: KRB) Registers the channel to be used. Subtraction operation and tag, units can also be registered. Data list is displayed. Data list of channel can be displayed, printed and file can be saved. Data of cursors A and B, and time are displayed. Time difference and data difference between cursors A and B; maximum, minimum and average value between cursors AB and all data is displayed, printed and saved. Search screen is displayed and data can be searched. Displays the data of cursors A and B as bar graph. Display position, thickness and direction can be set. Message can be inserted in trend graph and bar graph. Details of the inserted message are displayed and they can be edited, moved and deleted. Shape, color and size of the point at which alarm activates can be set. Ignore when alarm is not displayed. Continuous replay is displayed and trend is continuously scrolled. Trend screen can be printed, output on clipboard or can be saved as a file. 14
16 Tool bar: Below If time axis is magnified and performed, it returns to the previous step. Not displayed in case of circular chart. Returns time axis to default and displays all data in 1 screen. Not displayed in case of circular chart. Circular chart displays 360 points data in one lap. Returns to the pervious lap. Displayed only in case of circular chart. Moves to the next lap. Displayed only in case of circular chart. If this button and then the trend screen are clicked, cursor A is set at the nearest position where it is clicked. On clicking it once again, the setting gets released, and even when trend screen is clicked, cursor is not set. (Cursor that is already set is not released.) If this button and then the trend screen are clicked, cursor B is set at the nearest position where it is clicked. On clicking it once again, the setting gets released, and even when trend screen is clicked, cursor is not set. (Cursor that is already set is not released.) Cursor A,B can be viewed or hidden and color, line type etc. can be set. Line type, color, shape etc. of trend of each channel can be set. Sets display of scale axis. Maximum/minimum value, scale display interval, logarithm display can be set. Performs settings of time axis. Period to be displayed on the screen can be entered. Not displayed in case of circular chart. Sets display of time axis. Time display interval, additional scale interval etc. can be set. Title can be entered in the graph. Legend display can be set. Supplementary settings of graph are done. Back color, line type of auxiliary line, color, interval etc. can be set. Graph can be magnified, reduced and rotated. 15

17 5-1 File selection Select a file. File list is displayed on the upper side of File selection screen. On selecting the file and clicking the select button, the selected file gets added in the file column on the lower side of the screen. If the acquisition period is same, multiple files can be selected. (Only 1 file with extension KRB can be selected.) Select Selected file gets added in the file column on the lower side of the screen. Undo Selected file is deleted from the selected file column. Read Data of selected file is read. 5-2 Data registration Registers the channel to be used. (Maximum 128 points). Subtraction operation can be registered. Tag, unit and exponential display can be registered. Registration is done automatically but in case of performing an operation registration is done manually. Operation method Reference CH is registered in, A: Reference channel. Channel to be subtracted is registered in B. In case of subtracting a fixed value, input numeric value in, B: value to be subtracted. Scale axis can be switched single mode or multiplex mode. Single mode Data value of each channel is displayed in the same scale axis. Multiplex mode Data vale of each channel is displayed by scaling of the maximum/minimum scale value. *Cannot use logarithmic scale. *Cannot display standard deviation 16
18 5-3 Data list Data list is displayed in table format. The point at which alarm is activated is displayed in red. If the mouse is moved to that cell, details of the warning are displayed. Data list can be output as file. Displays all data as a list. Displays data between cursor A and B as list. Ignore when cursor A and B are not set. Displays the period that is currently shown. Not displayed in case of circular chart. Print settings are done. Prints. Outputs the file. Formats like CSV and text format (Tab delimiter) can be selected. Export to Excel. Auto-launch Excel, and display a graph. *Excel is necessary for display. 17

19 5-4 Data between cursors Data of cursors A and B, and time are displayed. Time difference and data difference between cursors A and B; maximum, minimum, average, standard deviation, median value between cursors AB and all data is displayed as list, printed and saved. Cursors A and B can be moved. (As it is moved one by one, fine adjustment is possible.) Points in data of cursors A and B at which alarm is activated is displayed in red. If the data difference of cursor A and B (A-B) is minus, it is displayed in red. Calculation between cursors A and B is displayed on clicking On clicking auto calculation of menu bar to ON, the calculations are made for every change of cursor AB. The larger the data the longer it takes for calculation. Operation result between all data and between cursors AB can be displayed in trend screen. Move cursor A one step to the left. Move cursor A one step to the right. Move cursor B one step to the left. Move cursor B one step to the right. In case of displaying computation calculation result of data as trend, register the color, line type etc. of trend. Calculation of the computation between the cursors is made. Ignore when cursors A and B are not set. Do the print settings. Print preview is displayed. Prints. Outputs the file. 18
20 5-5 Search Search screen is displayed and data can be searched. Search result is displayed as list in table format and on clicking it, that point is displayed by cursor. When it is not displayed in trend screen, auto scrolling is done and that point is displayed by cursor. Search mode Max value Min value Average Standard deviation Median Manual input Day / Time Cursor Contents Searches the maximum value of the objective channel. Searches the minimum value of the objective channel. Searches value that is equal to, greater than or less than the average value of the objective channel. Searches the value that is within the range and outside the range (average value ±σ) of standard deviation of objective channel. Searches value that is equal to, greater than or less than the median value of the objective channel. Enters manually the value to be searched. It can be searched by specifying the value that is equal to, greater than, less than or by specifying the range. Enter the time to be searched. It can be searched by specifying the time equal to, greater than or less than the entered time or by specifying the range. In case of specifying the range, enter the range of time to be searched. Searches the maximum value, minimum value, average value, standard deviation or median value between the cursors. Searches cursors A and B. Searches a point that has a message. Message All Match with letters Including letters Excluding letters All searches all messages. Match with letters searches only the message that has a string that matches completely with the entered letter. Including letters searches the message that contains the entered letter. Excluding letters searches the message that does not contain the entered letter. Alarm Searches the point at which alarm of the objective channel is displayed. Can be searched from all or level
21 5-6 Bar graph Displays the data of cursors A and B as bar graph. Graph type, display position, direction etc. can be set. Graph Chart type Direction Overlap Width Selects between show/hide. In case of display, select the position of arrangement from one of above, below, left and right. It can be selected from bar graph,multilayer graph and Data. (Refer to figure below) Bar graph displays cursors A and B in adjacent manner.(left) In case of multilayer graph, cursors A and B are displayed as multilayered graph in 1 bar graph.(right) In case of Data,Data of cursors A and B, and time are displayed. Time difference and data difference between cursors A and B are displayed. Direction of graph can be selected from Horizontal direction/vertical direction. Overlapping of graph can be set. Ignore in case of multilayer graph. Width of the bar can be set. Bar graph Multilayer graph 20
22 5-7 Insert message Message can be inserted in the data on the graph. Message is inserted at the nearest data point when it is dragged and dropped. Font color, font and background color of the message can be specified. Method of inserting message (1) Input a message. Select font color and font back color. (Button on the right) (2)Click the insert button and move the message that is input, to the trend screen by keeping the right button of the mouse pressed (Drag). (3)If mouse is moved in the trend screen, the frame is highlighted and displayed. Hence release the left button of the mouse. (Drop). 5-8 Edit message Details of the inserted messages can be edited, moved and deleted. Edit Message can be edited. Enter the message directly. Delete Right click on the message to be deleted and select delete option. Move Trend graph On clicking the right and left buttons, it can be moved to the right and left. On clicking the up and down buttons, one can move between the channels. Bar graph On clicking the right and left buttons, one can move between the channels. On clicking the up and down buttons, one can move between cursors A,B. 21

23 5-9 Alarm display Display on the trend graph, the points of every level at which warning appears. Shape, color, size etc. of each point at which alarm activates can be set. Ignore it although it is set, when alarm is not activated. Style Select the style to be displayed for the point for which alarm activates. (Select from the list.) Color Select the color to be displayed for the point for which alarm activates. (Click and select.) Size Enter the size of the style. (Enter a numeric value.) 5-10 Continuous replay Trend is continuously (automatically) scrolled. Scroll changes depending on the change in speed of scrolling and on, changing the updated data count. Menu When endless is selected as Mode, if data is scrolled till the end, it returns to the beginning and starts scrolling. When endless is not selected, the scrolling stops when data is scrolled till the end. Button Start Starts scrolling Stop Pauses. Click Start for restart. Available Reflects the current status in the trend graph. Set (1) Scrolling speed can be adjusted. The more it is moved to the right, the more the speed. (2) Scrolling ratio can be adjusted. The more it is moved to the right, the higher the ratio and the ratio of updating the screen in 1 scroll becomes higher. (3) Updated data count can be adjusted. It is the data count to be updated by scrolling once. (4) Screen data count can be adjusted. It is the data count to be displayed in 1 screen. In case of circular chart only (1) is displayed. In case of circular chart the data count displayed in 1 screen is 360 points. 22

24 5-11 Print screen Trend screen can be printed, output on clipboard or saved in a file. Prints. Outputs on clipboard. Selects one of trend graph and bar graph when both are displayed. Outputs to file in BMP and JPG format. Selects one of trend graph and bar graph when both are displayed View cursor Show/hide, color, kind of line etc. of cursor A,B can be set. Show Color Kind of line Width Click and select show/hide. Select the color to be displayed. Select Kind of line to be displayed, from the list. It can be selected from Solid line/dotted line/chain line. Enter a numeric value for line width of the cursor to be displayed. The larger the size the wider the cursor. 23

25 5-13 Trend line Set the kind of line, color, shape etc. of trend of each channel. Chart type Line Dot Line + dot Displays by connecting by a line in between the data as shown in pen type recorder. Displays data by dots as shown in dotting recorder. Displays a combination of pen type and dotting type. Displays the data by dots and by connecting by a line in between the data. Line color Width Kind of line Dot color Size Shape Select the color of the line. Ignore if dot is selected as graph type. Enter the line width. The larger the size the thicker it is displayed. Ignore if dot is selected as graph type. Select from the list the kind of line to be displayed. It can be selected from Solid line/dotted line/chain line. Ignore if dot is selected as graph type. Select the color of dots. Ignore if line is selected as graph type. Enter the size of dot to be displayed. The larger the size the larger is the dot. Ignore if line is selected as graph type. Select from the list the shape of the dot to be displayed. Ignore if line is selected as graph type. 24

26 5-14 Set scale axis Maximum value, minimum value, scale display interval, logarithm display etc. of scale can be displayed. Scale Max value Min value Scaling Label display interval Label inclination Additional scale interval Logarithmic scale. Rotate the axis. 100% overlapping Cross point with time axis Set maximum value/minimum value of scale. Optimization Optimizes maximum/minimum value of scale automatically such that all the data is displayed. Normally this is used. Manual The value entered in maximum/minimum value of scale is reflected in scale. Use in case of magnifying and reducing. Sets maximum value of scale. Ignore, as it is automatically adjusted in case of Optimization. Sets the minimum value of scale. Ignore, as it is automatically adjusted in case of Optimization. Selects the interval to display the scale. Displays the value in specified interval. Optimization Optimizes the value to be displayed and displays it on scale axis. Manual Displays in scale axis, the value on label display interval. Specifies the interval of displaying the value in scale axis. Ignore as it is automatically adjusted in case of Optimization. Specifies the numeric inclination of label that is displayed.(0-359 ) Specifies the interval of additional scale. Auxiliary line can be drawn in scale axis at specified interval. (Value is not displayed.) Ignore as it is automatically adjusted in case of Optimization. On keeping the check ON, logarithmic scale is displayed. Displayed only on the single mode. Rotate the top and the bottom of the scale axis. All the graphs are of same height and are adjusted such that the total of cursors AB is 100%. ( Displayed only when multilayer graph is selected in graph type.) Selects the cross point with time axis. Not displayed in circular chart. 0 Cross point of time axis and scale axis at 0. Minimum value Cross point of time axis and scale axis at minimum value. Maximum value Cross point of time axis and scale axis at maximum value. Left:100% overlapping Right: Multilayer (Not 100% overlapping) 25
27 5-15 Set time axis Period to be displayed in 1 screen can be entered. There are 2 methods viz. Specify hours method that displays the data from Beginning Date/Time to a Specific period in 1 screen; and Specify range method that displays the data of specified period in 1 screen. Thus time axis can be changed as per the requirement. If the entered duration is much smaller than the acquisition cycle; and if the period is very long, an error message is displayed and duration cannot be displayed. ( Not displayed in case of circular chart.) Specify hours Displays in 1 screen the data from Beginning Date/Time to the Specific period. Specify range Displays in 1 screen the data of specified period Set time display interval Sets time display interval, additional scale interval etc. Time interval Additional scale interval Option display Automatic Displays time interval which is optimum. Normally this is easy to understand. If the time axis is magnified/reduced, it is changed to the interval that is most easy to understand. Data Displays time in the data interval that is specified. Even when time axis is magnified/reduced, display interval does not change. None Additional scale is not displayed. Data Displays additional scale in the data interval that is specified. If time display interval is Automatic, it cannot be selected. Set time display. Display font, character color and inclination can be set. If small intervals of display are overlapping, incline the characters. 26
28 5-17 Title Displays title in graph and axis. What the graph and axis explains becomes clear when title is inserted. Header/Footer Title can be entered in header and footer of the graph. Style Width Back color None Display the title without enclosing it in a frame. Plane Displays the title by enclosing it in a frame. Cubic Displays the title by enclosing it in a cubic frame. Sets the frame width. Ignore in case of None. Sets the back color of title. Character color Sets the character color of the title. Time axis Title can be entered in time axis. It cannot be set in case of circular chart. Items displayed in gray cannot be changed. Title Characters are entered. Font can also be set. Inclination Inclination of display characters is selected from the list. Scale axis Title can be entered in scale axis. ( It cannot be set in case of circular chart. ( Items displayed in gray cannot be changed. Title Characters are entered. Font can also be set. Inclination Inclination of display characters is selected from the list. 27

29 5-18 Legend Legend display can be set. Show Style Position Selection of show/hide of Legend display. Sets the style for the Legend display. Position to be displayed of the Legend can be selected in list. Direction Direction of Legend can be displayed in list. Frame Frame enclosing the Legend can be displayed in list. Back color Back color of Legend can be selected. Character Character color of Legend can be selected. Title Title for Legend can be displayed Supplementary settings Executes the supplementary settings for graph. Back color, types of supplementary line, color and interval can be set. <Color> Display color of graph is set. Graph background Back color of graph can be selected. Graph frames Time axis Scale axis Color of graph frame can be selected. Color of time axis can be selected. Color of scale axis can be selected. <Wall paper> Wall paper at the background of graph can be displayed. Wall paper Position When Use is selected, select the image (BMP or WMF format) to be used for the wall paper. When Stretch is displayed, the image gets enlarged and is displayed on the screen. When Center is selected, image is displayed at the center of the screen. When Tile stile is selected, image is displayed in tile pattern. <Auxiliary line> Auxiliary line can be displayed in graph. <Time axis> Match with display Displays the auxiliary line for the period specified in time display period. Kind of line Color Width Display period Front Kind of line for auxiliary line can be selected. Color of the auxiliary line can be selected. Width of the auxiliary line can be selected. Larger the width larger will be its thickness. Display period of auxiliary line can be entered. It is disabled in case of Match with display. Select whether to display the auxiliary line at the front of the graph. 28

30 <Scale axis> Optimization Displays the auxiliary line for the period specified in scale axis display period. Kind of line Color Width Display period Front Kind of line for the auxiliary line can be selected in list. Color of auxiliary line can be selected. Width of auxiliary line can be entered. Larger the width larger will be its thickness. Display period of the auxiliary line can be entered. It is disabled in case of Optimization. Whether to display the auxiliary line at the front of graph Magnify/Reduce/Rotate Graph can be moved/magnified/reduced/zoomed/rotated with the help of interactive operations using mouse. Move Graph can be moved. Magnify/Reduce Graph can be magnified/reduced. Partially magnify Graph can be magnified by specifying the range. (Frame is displayed.) Rotation Set the depth and on rotating the graph is displayed as 3D as though it is seen from some angle. Cannot be selected in circular chart. 29

31 6. FTP Transfer and reception between file and instrument is done. Connect the instrument after entering the IP address. Exits. Connects to the instrument. Instrument is disconnected. File is uploaded. File is downloaded. FTP (File Transfer Protocol) It is the protocol used for file transfer in the TCP/IP network such as Internet etc. 30
32 7. FAQ Please refer to the frequently asked questions and answers listed below. Q Question 1 To change the time axis. 2 To maximize the graph by changing the scale. 3 To display several scale axes on one graph. 4 To save the current status and then again reproduce that status. 5 To change the Trend display. 6 To convert the data to CSV. (To be used in software s such as excel etc.) 7 To search maximum value/minimum value. 8 To display a cursor in the graph and to display the data of that point. 9 To display only 1 channel as it is difficult to understand, if a number of channels are displayed in 1 screen. 10 To enter the title on the graph. 11 To enter the message in the data on the graph. 12 To create the daily/monthly reports. 31
33 To change the time axis. In case of horizontal/vertical trend graph There are 2 methods; (1) Magnification of time axis by using mouse and (2) Specify the range of time axis by using keyboard. In case of circular chart, display is fixed to 360 points in one lap. (1)Magnification of time axis by using mouse Drag (move the mouse) keeping the left button of the mouse pressed (starting point is fixed) from the point that is to be magnified and release the button on the point (end point is fixed), up to which it is to be magnified. (The range in black color that is rotating is magnified) (2)Specify the range of time axis by using keyboard Following screen is opened on clicking the time axis button on the tool bar. After entering the time axis, when OK button is clicked, specified range is displayed, if there is no error in the input contents. 32
34 To maximize the graph by changing the scale. In case of horizontal/vertical trend of trend graph There are 2 methods; (1) Change of scale by using the mouse and (2) Change of scale by using the keyboard. In case of circular chart, scale can be changed only by using the keyboard (2). It is also possible to magnify the graph without changing the scale. (1)Change of scale by using mouse Drag (move the mouse) keeping the left button of the mouse pressed (starting point is fixed) from the point that is to be magnified and release the button on the point (end point is fixed), up to which it is to be magnified. (The range in black color that is rotating is magnified) (2)Specify the range of scale by using keyboard Click the scale axis button on the tool bar and open the following screen. After entering the maximum and minimum value of scale, when OK button is clicked, specified range is displayed, if there is no error in the input contents. 33

![[Multiplex mode] 2 scale axes are displayed. Displayed only one in circular chart.](/docs-images/71/65557360/images/35-1.jpg "Click of the tool bar when switching the display channel on scale axis.")
35 To display several scale axes on one graph. Scale axes are displayed up to 2 on left and right, and up and down. Show method Click of the tool bar. Switch to the [Multiplex]. Change the scale maximum and minimum value is possible. [Multiplex mode] 2 scale axes are displayed. Displayed only one in circular chart. Click of the tool bar when switching the display channel on scale axis. Click and register the displaying channel (Possible to register in the left and right one by one). 34

36 To save the current status and then again reproduce that status. Click Save on the tool menu. Save method Enter the file name and save the file in the following screen. Extension will be added automatically. Read method There are 3 methods to read the saved file. Select any of the one method. (Refer to Easy to Use! Operation Guide) (1)If the file is double clicked in the status where the analysis software is not started, then the analysis software is started automatically and trend is displayed. (2)Drag and drop Start analysis software and when trend screen opens, drag & drop the file. (3)File selection Start the analysis software and when the trend screen opens, click. 35
. Open data list for converting the data to CSV. Convert to CSV Data can be saved in the file on clicking the Floppy icon.")
37 To change the Trend. Horizontal, Vertical, and Circular Chart are the 3 types included in Trend Any of these types can be changed from the status bar. To convert the data to CSV (or to print the data.). Open data list for converting the data to CSV. Convert to CSV Data can be saved in the file on clicking the Floppy icon. Data can also be converted to Text format (Tab delimiter) other than CSV format. Print Prints on clicking the Printer icon. 36

38 To change the Maximum value/minimum value. Click search on the tool bar. Select the Maximum value and Minimum value from the screen displayed below. In Objective CH, select the channel to be searched. On selecting All, all the channels are searched. Search is started on clicking the Search button. Search mode also includes Average value. Standard deviation, Median value, Manual input, Time, Cursor, Message and Alarm. For details, refer to 5-5. Search result is displayed in list and when that list is clicked, cursor is displayed on that point and the position can be understood. List is not displayed in case of irrelevant search results. 37


39 To display a cursor in the graph and to display the data of that point. 2 cursors can be displayed. Here, these cursors are called as Cursor A and Cursor B. Click the Cursor and button. If clicked on Trend screen, Cursor A and Cursor B are placed on the nearest point from the clicked position. Detailed information of the cursor is displayed on clicking on the tool bar. Data deviation or maximum, minimum, average value between the cursors is displayed. Moreover, Cursor A and B can be displayed in bar graph. Click on the tool bar. Displays the graph and on selecting the position to be displayed, bar graph is displayed. <Bar graph> In the same channel, left is the Cursor A value and right is the Cursor B value. 38
 Includes Method to select 1 channel and Method to delete the registered channel. Selection method Displays only the channel selected from the list as shown in the following screen.")
40 To display only 1 channel. (Only 1 channel is displayed, as it is difficult to understand when multiple channels are displayed on 1 screen.) Includes Method to select 1 channel and Method to delete the registered channel. Selection method Displays only the channel selected from the list as shown in the following screen. (Scale is also automatically changed) When there are multiple channels on 1 screen and it is difficult to view, it can be displayed by switching over. Returns to All channel display if uppermost list ---- is selected. Method to delete the registered channel In case of multiple registrations, if only 1 channel is registered, only that channel is displayed. Only one channel is displayed on 1 screen. Multiple channels cannot be displayed by switching. Click Register channel on the tool bar. Registration gets deleted, if Reference CH --- is Nil as in figure below. 39
41 To insert the title in the graph. Click title on the tool bar. Enter the title in the following screen. Header and footer are displayed at the top and bottom of the screen. Title can be entered even for time axis and scale axis. (It is excluded in case of circular chart) What the graph and axis explains becomes clear when title is inserted. 40

42 To insert the message in the graph. Click message icon for inserting the message. Enter the message to be displayed in the following screen. It is also possible to change the character color, font and the back color. On clicking the Insert button, the entered message moves to the trend screen by clicking the left button of the mouse. (Drag) On placing the mouse on trend screen, as the frame is highlighted, release the left button of the mouse (Drop). Message is inserted at the point nearest to the data. 41
43 To create the daily/monthly reports. Daily / Monthly reports can be created by using the report application included in CD. Installation operations on the PC are required for using this application. Moreover, Excel (97 or higher) should be installed. CSV format file can be used for the data. (1)Open data list for converting the data to CSV. Convert to CSV Data can be saved in the file on clicking the Floppy icon. A file name is automatic. Please do not change it. (2)Report Application start. 42

44 Report Application (Sample) This Application is the Sample Application. Queries related to usage method and defects cannot be answered. Please understand it before using. Main screen On activating main screen is displayed. Various operations are carried out considering this screen as base point. Select the group to be operated. Group name based on the data of the specified acquired data folder by settings is registered in list. Enter the group by using keyboard when there is no group to be selected. The created report file with the specified conditions, is displayed in the list box given below. Update the contents from the following list box to the latest status. Operations such as Open/Print/Delete can be executed for the file selected in the list box on the left. In the specified folder, the date and time of the daily report file that matches with the conditions specified in the above combo box is displayed in list. 43
45 Menu structure File Export project Import project Compress the configuration contents and save it as 1 file. Reads the saved project file. Close Closes the application. Setup Report setup Report Management Executes various settings related to this software. Specifies the flag of Create or Print report for each group. Edit Template Edit Daily Report Template Edits the daily report sheet. Edit Monthly Report Template Edits the monthly report sheet. Edit Batch Report Template Edits the batch report sheet. Open Template Folder Opens the sheet folder. Create Create Daily Report Creates / Outputs the daily report. Create Monthly Report Creates / Outputs the monthly report. Create Batch Report Creates / Outputs the batch report. 44

46 Exporting Project Specify the save destination and the file. File is created by saving the compressed file. Importing project Confirmation dialog box for overwriting the configuration is displayed. Click "OK". Select the file to be read. Read the file. 45
47 Report settings Setting tab for type, acquired data, output, print, date origin and password is displayed. Respective tab contents are described below. Type Select the report type to be used from the following 3 patterns. (1) Daily report and Monthly report (2) Batch report (3) Daily report, Monthly report and Batch report Daily report Create by collecting the acquired data of 1 day. Monthly report Create by collecting the daily report of 1 month. Batch report Create the batch report corresponding to the acquired data file. Recorded data Specify the folder in which the acquired data is saved. Use the folder selection screen by clicking "Browse" for setting. Only the CSV format file can be used for the acquired data. 46


48 Output Specify the output destination (save destination) of the report file. Use the folder selection by clicking the "Browse" for setting. Required setting items are displayed by selecting the "Type" tab. Following figure is the case of Daily report / Monthly report. Start Date/Time Set the time of the 1st day in case to create the daily report and the date of the starting of the month in case to create monthly report. Decide whether to use which time range by using these settings while creating daily or monthly report. Password Register the password when the report sheet is locked with password. Use the same password for all the sheets. When the sheet is locked, password is not set or in case of error settings, it cannot be created. 47
 mark.")

49 Report Management Specify whether to create report for each group. Changes from * (Blank) P on clicking each frame. "-" indicates that the sheet is not created. Report is not created for the group for which the sheet is not created. Report is created for the group having * mark and not created for the group having (Blank) mark. For the group with P mark, report is created and then printed. Create daily report Daily report of the groups marked with * mark in the daily report column of report management is created on the basis of the contents in daily report sheet. (1) Specify the period for creating the daily report. Select the start date and the end date. (2) Daily report is created after reading the acquired data. (3) On creating the daily report, it is added in the "Created Reports" list. 48
Specify the period for creating the monthly report. Select the start month and the end month. (2)Create a monthly report after reading the daily report.")

50 Create monthly report The monthly report of the groups marked with * mark in the monthly report column of the report management are created on the basis of contents on monthly report sheet. (1)Specify the period for creating the monthly report. Select the start month and the end month. (2)Create a monthly report after reading the daily report. (3)On creating the monthly report, it is added in the "Created Reports" list. Edit Report Sheet Each report is created on the respective sheets. Frame of the table, formula, fixed character indicating the cell contents and settings related to printing should be created for the sheet beforehand. Edit Daily Report In daily report sheet, the contents created on "daily report" sheet are output as daily report. (1)Create frame, fixed character string etc. for the daily report. 49

51 (2)Open the input screen by double-clicking on the cell where the data is to be pasted. Select the data channel. If "Recording time" is selected, the time is computed in place of data. Use this for displaying time in the report. Use this area when the input setup is to be input consecutively in the time or channel direction. Select the function applied to inserted data. Select whether the computations such as averaging or maximum are applied to the entire day or to the data of specified time range. When this is checked and the computation result is an error, the result is displayed as a blank instead of an error indication. (3)After setting each item, Formula is written in the cell on clicking "OK". (4)After the creation is complete, "Save as" the file and then close it. 50
Open the input screen by double-clicking on the cell where the data is to be pasted. Specify the position of daily report data to be used.")

52 Edit monthly report sheet In monthly report sheet, the contents created on "monthly report" sheet are output as monthly report. (1)Create frame, fixed character string etc. for the monthly report. (2)Open the input screen by double-clicking on the cell where the data is to be pasted. Specify the position of daily report data to be used. When the cursor is placed here, the daily report contents are displayed; click on the desired cell. Use this area when the input setup is to be input consecutively in the time or channel direction. Select whether a computation such as averaging or maximum is applied to the entire month or to the data of the specified days. When [Specified days] is selected, it is not permitted to select the function type but the data in the specified position of the specified day is loaded simply. Select the computation to be applied to the data. When this is checked and the computation result is an error, the result is displayed as a blank instead of an error indication. (3)After setting each item, Formula is written in the cell on clicking "OK". (4)After the creation is complete, "Save as" the file and then close it. 51
53
54
55
GL500A Application Manual
 GL500A Application Manual Main Functions A Variety of Waveform Displays Y-T, X-Y, and FFT waveforms can be displayed on large, easy-to-read screens. Dual-screen Event and Current Data Replay Current data
Microsoft Excel 2007
 Microsoft Excel 2007 1 Excel is Microsoft s Spreadsheet program. Spreadsheets are often used as a method of displaying and manipulating groups of data in an effective manner. It was originally created
KIDS. Data Acquisition Software Package INE-333D
 INE-333D Data Acquisition Software Package KIDS Thank you for your purchase of the data acquisition software KIDS. For using this software correctly and safely, please read this instruction manual thoroughly
DATA VIEWER FOR PAPERLESS RECORDER
 Instruction Manual DATA VIEWER FOR PAPERLESS RECORDER TYPE: PHR/PHW INP-TN513550i-E WARNING If an error or improper operation occurs in our product, or customer-made programs should be found defective,
Microsoft Excel 2010 Basics
 Microsoft Excel 2010 Basics Starting Word 2010 with XP: Click the Start Button, All Programs, Microsoft Office, Microsoft Excel 2010 Starting Word 2010 with 07: Click the Microsoft Office Button with the
User s Manual. CW500Viewer IM CW500-61EN. 2nd Edition
 User s Manual CW500Viewer 2nd Edition Thank you for purchasing the CW500 Power Quality Analyzer. This manual explains the operating procedures of CW500Viewer, a software application included with the CW500.
SHARP Pen Software. Version 2.2 OPERATION MANUAL
 SHARP Pen Software Version 2.2 OPRATION MANUAL Contents Introduction...3 Starting and xiting the Software...4 Pen Software modes and how to start the modes...4 xiting the software...5 Layout of Basic Screen...6
MANUAL NO. OPS647-UM-151 USER S MANUAL
 MANUAL NO. OPS647-UM-151 USER S MANUAL Software Usage Agreement Graphtec Corporation ( Graphtec ) hereby grants the purchaser and authorized User (the User ) the right to use the software (the Software
Océ Engineering Exec. Advanced Import and Index
 Océ Engineering Exec Advanced Import and Index Océ-Technologies B.V. Copyright 2004, Océ-Technologies B.V. Venlo, The Netherlands All rights reserved. No part of this work may be reproduced, copied, adapted,
Excel 2013 Intermediate
 Excel 2013 Intermediate Quick Access Toolbar... 1 Customizing Excel... 2 Keyboard Shortcuts... 2 Navigating the Spreadsheet... 2 Status Bar... 3 Worksheets... 3 Group Column/Row Adjusments... 4 Hiding
User's Manual. TA320/TA520 Optical Disk Inter-Symbol Interference Analysis Software. IM E 1st Edition. IM E 1st Edition
 User's Manual TA320/TA520 Optical Disk Inter-Symbol Interference Analysis Software 1st Edition 1st Edition Foreword Notes Trademarks Revisions Thank you for purchasing the Optical Disk Inter-Symbol Interference
SHARP Pen Software. Version 2.3 OPERATION MANUAL
 SHARP Pen Software Version 2.3 OPRATION MANUAL Contents Introduction...3 Starting and xiting the Software...4 Pen Software modes and how to start the modes...4 xiting the software...5 Layout of Basic Screen...6
Gloucester County Library System EXCEL 2007
 Gloucester County Library System EXCEL 2007 Introduction What is Excel? Microsoft E x c e l is an electronic s preadsheet program. I t is capable o f performing many diff e r e n t t y p e s o f c a l
INST.NO. INE-919. DI5000 Setting Software
 INST.NO. INE919 DI5000 Setting Software Table of contents 1. Introduction... 1 2. System Requirement... 3 21 Operation Condition of the Software... 3 3 How to Setup... 4 31. Installation... 4 311. New
Microsoft Office Excel
 Microsoft Office 2007 - Excel Help Click on the Microsoft Office Excel Help button in the top right corner. Type the desired word in the search box and then press the Enter key. Choose the desired topic
Excel 2016 Basics for Windows
 Excel 2016 Basics for Windows Excel 2016 Basics for Windows Training Objective To learn the tools and features to get started using Excel 2016 more efficiently and effectively. What you can expect to learn
Process Eye Professional. Recall
 Process Eye Professional Recall Process Eye Professional Recall User Manual SP104010.101 August 2005 As part of our continuous product improvement policy, we are always pleased to receive your comments
Excel 2003 Tutorial II
 This tutorial was adapted from a tutorial by see its complete version at http://www.fgcu.edu/support/office2000/excel/index.html Excel 2003 Tutorial II Charts Chart Wizard Chart toolbar Resizing a chart
MagicInfo VideoWall Author
 MagicInfo VideoWall Author MagicInfo VideoWall Author User Guide MagicInfo VideoWall Author is a program designed to construct a VideoWall layout and create VideoWall content by adding various elements
DATA VIEWER FOR PAPERLESS RECORDER
 Instruction Manual DATA VIEWER FOR PAPERLESS RECORDER TYPE: PHL / PHU / PHF INP-TN514013d-E WARNING If an error or improper operation occurs in our product, or customer-made programs should be found defective,
Technical Documentation Version 7.3 Output
 Technical Documentation Version 7.3 Output These documents are copyrighted by the Regents of the University of Colorado. No part of this document may be reproduced, stored in a retrieval system, or transmitted
User manual CORRIGO E Tool
 User manual CORRIGO E Tool Revision B Oct 2004 This user manual covers the CORRIGO E Tool for both heating and.ventilation This user manual is published by AB REGIN without guarantee. AB REGIN can at any
DATA VIEWER FOR PAPERLESS RECORDER
 Instruction Manual DATA VIEWER FOR PAPERLESS RECORDER TYPE: PHL / PHU / PHF INP-TN514013e-E WARNING If an error or improper operation occurs in our product, or customer-made programs should be found defective,
User Guide 701P Wide Format Solution Wide Format Scan Service
 User Guide 701P44865 6204 Wide Format Solution Wide Format Scan Service Xerox Corporation Global Knowledge & Language Services 800 Phillips Road Bldg. 845-17S Webster, NY 14580 Copyright 2006 Xerox Corporation.
Spreadsheet definition: Starting a New Excel Worksheet: Navigating Through an Excel Worksheet
 Copyright 1 99 Spreadsheet definition: A spreadsheet stores and manipulates data that lends itself to being stored in a table type format (e.g. Accounts, Science Experiments, Mathematical Trends, Statistics,
MIMAKI ENGINEERING CO., LTD.
 CAMLINK Instruction manual MIMAKI ENGINEERING CO., LTD. TKB Gotenyama Building, 5-9-41, Kitashinagawa, Shinagawa-ku, Tokyo 141-0001, Japan Phone: +81-3-5420-8671 Fax: +81-3-5420-8687 URL: http://www.mimaki.co.jp/
Operating Instructions
 Providing presentation solutions V iewer Software Program Operating Instructions NIPPON AVIONICS CO., LTD. 1 This manual describes the functions and operations for conducting presentations using ip Viewer.
Technology Assignment: Scatter Plots
 The goal of this assignment is to create a scatter plot of a set of data. You could do this with any two columns of data, but for demonstration purposes we ll work with the data in the table below. You
D-Cut Master MANUAL NO. OPS639-UM-153 USER'S MANUAL
 D-Cut Master MANUAL NO. OPS639-UM-153 USER'S MANUAL Software License Agreement Graphtec Corporation ( Graphtec ) grants the user permission to use the software (the software ) provided in accordance with
WE TAKE BUILDING AUTOMATION PERSONALLY MANUAL REGIO TOOL
 WE TAKE BUILDING AUTOMATION PERSONALLY MANUAL REGIO TOOL Copyright AB Regin, Sweden, 2016 DISCLAIMER The information in this manual has been carefully checked and is believed to be correct. Regin however,
IMAGE STUDIO LITE. Tutorial Guide Featuring Image Studio Analysis Software Version 3.1
 IMAGE STUDIO LITE Tutorial Guide Featuring Image Studio Analysis Software Version 3.1 Notice The information contained in this document is subject to change without notice. LI-COR MAKES NO WARRANTY OF
JASCO CANVAS PROGRAM OPERATION MANUAL
 JASCO CANVAS PROGRAM OPERATION MANUAL P/N: 0302-1840A April 1999 Contents 1. What is JASCO Canvas?...1 1.1 Features...1 1.2 About this Manual...1 2. Installation...1 3. Operating Procedure - Tutorial...2
Excel 2016 Basics for Mac
 Excel 2016 Basics for Mac Excel 2016 Basics for Mac Training Objective To learn the tools and features to get started using Excel 2016 more efficiently and effectively. What you can expect to learn from
PowerView for the EnergyPro
 Data Analysis Software User's Guide PowerView User's Guide Copyright 2005 CANDURA INSTRUMENTS. All Rights Reserved. The information in this document is subject to change without notice. CANDURA INSTRUMENTS
Contents. Launching Word
 Using Microsoft Office 2007 Introduction to Word Handout INFORMATION TECHNOLOGY SERVICES California State University, Los Angeles Version 1.0 Winter 2009 Contents Launching Word 2007... 3 Working with
Océ Engineering Exec. Electronic Job Ticket
 Océ Engineering Exec Electronic Job Ticket Océ-Technologies B.V. Copyright 2004, Océ-Technologies B.V. Venlo, The Netherlands All rights reserved. No part of this work may be reproduced, copied, adapted,
Ms excel. The Microsoft Office Button. The Quick Access Toolbar
 Ms excel MS Excel is electronic spreadsheet software. In This software we can do any type of Calculation & inserting any table, data and making chart and graphs etc. the File of excel is called workbook.
How to Open Excel. Introduction to Excel TIP: Right click Excel on list and select PIN to Start Menu. When you open Excel, a new worksheet opens
 Introduction to Excel 2010 What is Excel? It is a Microsoft Office computer software program to organize and analyze numbers, data and labels in spreadsheet form. Excel makes it easy to translate data
WinView. Getting Started Guide
 WinView Getting Started Guide Version 4.3.12 June 2006 Copyright 2006 Mincom Limited All rights reserved. No part of this document may be reproduced, transferred, sold or otherwise disposed of without
Budget Exercise for Intermediate Excel
 Budget Exercise for Intermediate Excel Follow the directions below to create a 12 month budget exercise. Read through each individual direction before performing it, like you are following recipe instructions.
General Specifications
 General Specifications DAQManager Data Management Software for Paperless Recorders [Release: R2] Overview DAQManager is a software program that enables you to manage measured data from Daqstation and MVAdvanced
Software User's Guide
 Software User's Guide The contents of this guide and the specifications of this product are subject to change without notice. Brother reserves the right to make changes without notice in the specifications
Printgroove JT Compile 2. Manual Version 2.0
 Printgroove JT Compile 2 Manual Version 2.0 Printgroove JT Compile 2 2010 dots Gesellschaft für Softwareentwicklung mbh Version of this manual: 2.0, 01.08.2010 15:09 Publication number: 330-158-ENG-020710
MICROSOFT OFFICE. Courseware: Exam: Sample Only EXCEL 2016 CORE. Certification Guide
 MICROSOFT OFFICE Courseware: 3263 2 Exam: 77 727 EXCEL 2016 CORE Certification Guide Microsoft Office Specialist 2016 Series Microsoft Excel 2016 Core Certification Guide Lesson 1: Introducing Excel Lesson
AQ7932 OTDR Emulation Software Operation Manual
 User s Manual Model 735070 AQ7932 OTDR Emulation Software Operation Manual IM 735070-04E 3rd Edition Introduction Thank you for your purchasing of this AQ7932 OTDR Emulation Software. This user's manual
FactoryLink 7. Version 7.0. Client Builder Reference Manual
 FactoryLink 7 Version 7.0 Client Builder Reference Manual Copyright 2000 United States Data Corporation. All rights reserved. NOTICE: The information contained in this document (and other media provided
Day : Date : Objects : Open MS Excel program * Open Excel application. Select : start. Choose: programs. Choose : Microsoft Office.
 Day : Date : Objects : Open MS Excel program * Open Excel application. Select : start Choose: programs Choose : Microsoft Office Select: Excel *The interface of Excel program - Menu bar. - Standard bar.
Introduction. Summary. Otasuke GP-EX! Introduction Summary. Intro-21. Development Environment Intro-4. Procedures of Creating New Screen
 Introduction Summary Summary Intro-1 Development Environment Intro-4 Procedures of Creating New Screen Intro-5 Main Window Intro-6 Tips for man-hours reduction ~Full use of Work Space~ Intro-10 Simulation
MIMAKI ENGINEERING CO., LTD.
 For Windows XP/Windows 2000 Cutting Application Software SimpleCut Operation Manual MIMAKI ENGINEERING CO., LTD. D201463 Contents Introduction 1 About this Manual 2 Chapter 1 Installation Procedure 3
Creating a Basic Chart in Excel 2007
 Creating a Basic Chart in Excel 2007 A chart is a pictorial representation of the data you enter in a worksheet. Often, a chart can be a more descriptive way of representing your data. As a result, those
AEMLog Users Guide. Version 1.01
 AEMLog Users Guide Version 1.01 INTRODUCTION...2 DOCUMENTATION...2 INSTALLING AEMLOG...4 AEMLOG QUICK REFERENCE...5 THE MAIN GRAPH SCREEN...5 MENU COMMANDS...6 File Menu...6 Graph Menu...7 Analysis Menu...8
DATA VIEWER FOR PAPERLESS RECORDER
 Instruction Manual DATA VIEWER FOR PAPERLESS RECORDER TYPE: PHL WARNING If an error or improper operation occurs in our product, or customer-made programs should be found defective, protection and safety
What we will learn in Introduction to Excel. How to Open Excel. Introduction to Excel 2010 Lodi Memorial Library NJ Developed by Barb Hauck-Mah
 Introduction to Excel 2010 Lodi Memorial Library NJ Developed by Barb Hauck-Mah What is Excel? It is a Microsoft Office computer software program to organize and analyze numbers, data and labels in spreadsheet
Exhibitor Software User s Manual. Exhibitor Software V
 Exhibitor Software User s Manual Exhibitor Software V1.0.1 090908 1 Contents 1. Exhibitor Software 2. Installation 3. Using Exhibitor Program 3.1 Starting the Program 3.2 Logging in to the Program 3.3
wiemarc 5.2 Manual Labeling Software wiemarc 5.2
 wiemarc 5.2 Manual Labeling Software wiemarc 5.2 Page 1 of 67 Release: February 16, 2016 Manual labeling software 5.2 Table of contents 1. System requirements 2. Software installation 3. Output devices
Microsoft How to Series
 Microsoft How to Series Getting Started with EXCEL 2007 A B C D E F Tabs Introduction to the Excel 2007 Interface The Excel 2007 Interface is comprised of several elements, with four main parts: Office
Excel Select a template category in the Office.com Templates section. 5. Click the Download button.
 Microsoft QUICK Excel 2010 Source Getting Started The Excel Window u v w z Creating a New Blank Workbook 2. Select New in the left pane. 3. Select the Blank workbook template in the Available Templates
Information Technology and Media Services. Office Excel. Charts
 Information Technology and Media Services Office 2010 Excel Charts August 2014 Information Technology and Media Services CONTENTS INTRODUCTION... 1 CHART TYPES... 3 CHOOSING A CHART... 4 CREATING A COLUMN
Introduction to Microsoft Excel
 Athens-Clarke County Library Page 1 What is a spreadsheet program? Microsoft Excel is an example of a spreadsheet program that will maintain records for you relating to finances, products, activities,
ROBO Master OPS656. USER'S MANUAL MANUAL NO. OPS656m-UM Introduction 1.1 Features System Requirements... 3
 USER'S MANUAL MANUAL NO. m-um-152 Software Usage Agreement... 2 Registered Trademarks... 2 Notes on this Manual... 2 Disclaimer... 2 1 Introduction 1.1 Features... 3 1.2 System Requirements... 3 2 Installing
Office Excel. Charts
 Office 2007 Excel Charts October 2007 CONTENTS INTRODUCTION... 1 Bold text... 2 CHART TYPES... 3 CHOOSING A CHART... 4 CREATING A COLUMN CHART... 5 FORMATTING A COLUMN CHART... 8 Changing the chart style...
Working with Charts Stratum.Viewer 6
 Working with Charts Stratum.Viewer 6 Getting Started Tasks Additional Information Access to Charts Introduction to Charts Overview of Chart Types Quick Start - Adding a Chart to a View Create a Chart with
The American University in Cairo. Academic Computing Services. Word prepared by. Soumaia Ahmed Al Ayyat
 The American University in Cairo Academic Computing Services Word 2000 prepared by Soumaia Ahmed Al Ayyat Spring 2001 Table of Contents: Opening the Word Program Creating, Opening, and Saving Documents
Excel 2013 Workshop. Prepared by
 Excel 2013 Workshop Prepared by Joan Weeks Computer Labs Manager & Madeline Davis Computer Labs Assistant Department of Library and Information Science June 2014 Excel 2013: Fundamentals Course Description
GO! with Microsoft Excel 2016 Comprehensive
 GO! with Microsoft Excel 2016 Comprehensive First Edition Chapter 2 Using Functions, Creating Tables, and Managing Large Workbooks Use SUM and Statistical Functions The SUM function is a predefined formula
CHAPTER 4: MICROSOFT OFFICE: EXCEL 2010
 CHAPTER 4: MICROSOFT OFFICE: EXCEL 2010 Quick Summary A workbook an Excel document that stores data contains one or more pages called a worksheet. A worksheet or spreadsheet is stored in a workbook, and
DOWNLOAD KIT CYCLOCOMPUTER INTRODUCTION. Download unit & Download Software [e-train Data Ver.3] for Windows 98/ME/2000/XP
![DOWNLOAD KIT CYCLOCOMPUTER INTRODUCTION. Download unit & Download Software [e-train Data Ver.3] for Windows 98/ME/2000/XP](/thumbs/78/78392561.jpg "DOWNLOAD KIT CYCLOCOMPUTER INTRODUCTION. Download unit & Download Software [e-train Data Ver.3] for Windows 98/ME/2000/XP") CYCLOCOMPUTER Download unit & Download Software [e-train Data Ver.3] for Windows 98/ME/2000/XP 0365510 (ENG) 3 INTRODUCTION The CC-TR100 Download Kit contains the software e-train Data TM Ver. 3 and the
CYCLOCOMPUTER Download unit & Download Software [e-train Data Ver.3] for Windows 98/ME/2000/XP 0365510 (ENG) 3 INTRODUCTION The CC-TR100 Download Kit contains the software e-train Data TM Ver. 3 and the
Gloucester County Library System. Excel 2010
 Gloucester County Library System Excel 2010 Introduction What is Excel? Microsoft Excel is an electronic spreadsheet program. It is capable of performing many different types of calculations and can organize
Software User's Guide
 Software User's Guide The contents of this guide and the specifications of this product are subject to change without notice. Brother reserves the right to make changes without notice in the specifications
The American University in Cairo. Academic Computing Services. Excel prepared by. Maha Amer
 The American University in Cairo Excel 2000 prepared by Maha Amer Spring 2001 Table of Contents: Opening the Excel Program Creating, Opening and Saving Excel Worksheets Sheet Structure Formatting Text
TOF-Watch SX Monitor
 TOF-Watch SX Monitor User manual Version 1.2 Organon (Ireland) Ltd. Drynam Road Swords Co. Dublin Ireland Contents General information... 3 Getting started... 3 File Window... 7 File Menu... 10 File Open
Multi-NVR Manager. Quick Start Configuration Usage
 Multi-NVR Manager Quick Start Configuration Usage 2014. All rights are reserved. No portion of this document may be reproduced without permission. All trademarks and brand names mentioned in this publication
Project Guide - Time location with PLANER ET PROFESSIONAL 2011
 Project Guide - Time location with PLANER ET PROFESSIONAL 2011 Description This Guide summarizes operational way, the steps and most important functions to carry out a complete cycle of management of programming
Chapter 7 Inserting Spreadsheets, Charts, and Other Objects
 Impress Guide Chapter 7 Inserting Spreadsheets, Charts, and Other Objects OpenOffice.org Copyright This document is Copyright 2007 by its contributors as listed in the section titled Authors. You can distribute
EXCEL 2013 FDLRS SUNRISE
 EXCEL 2013 FDLRS SUNRISE Goal: Participants will create a spreadsheet and graph to document student progress. Objectives: Participants will create a spreadsheet which includes basic formulas. Participants
PanelView Plus and Text Historian Guide
 PanelView Plus and Text Historian Guide Version 12.4 SyTech, Inc. The Complete Reporting Solution Information in this document is subject to change without notice. SyTech, Inc. assumes no responsibility
NETWORK PRINT MONITOR User Guide
 NETWORK PRINT MONITOR User Guide Legal Notes Unauthorized reproduction of all or part of this guide is prohibited. The information in this guide is subject to change for improvement without notice. We
Microsoft Excel 2007
 Learning computers is Show ezy Microsoft Excel 2007 301 Excel screen, toolbars, views, sheets, and uses for Excel 2005-8 Steve Slisar 2005-8 COPYRIGHT: The copyright for this publication is owned by Steve
5 Creating a Form Using Excel
 5 Creating a Form Using Excel 5.1 Writing Measurement Data in a Form...5-3 5.2 Writing Date/Time in a Form...5-50 5.3 Writing Arrows in a Form...5-54 5.4 Writing Trigger Source Node Names in a Form...5-58
Office of Instructional Technology
 Office of Instructional Technology Microsoft Excel 2016 Contact Information: 718-254-8565 ITEC@citytech.cuny.edu Contents Introduction to Excel 2016... 3 Opening Excel 2016... 3 Office 2016 Ribbon... 3
USB Instruments EasyLogger for PS40M10 "Swordfish" Help
 USB Instruments EasyLogger for PS40M10 "Swordfish" Help I EasyLogger for PS40M10 Help Table of Contents Part I Introduction 3 1 Welcome to... EasyLogger for PS40M10 3 2 EasyLogger... Features 4 Part II
USER S MANUAL Software Usage Agreement Registered Trademarks Notes on this Manual Disclaimer
 USER S MANUAL Software Usage Agreement Registered Trademarks Notes on this Manual Disclaimer 1 1.1 1.2 2 3 Introduction 2.1 2.2 Features System Requirements Installing Xyron Wishblade Software 3.1 3.2
Virtual MODELA USER'S MANUAL
 Virtual MODELA USER'S MANUAL Virtual MODELA is a program that simulates the movement of the tool on the screen. Contents Contents Part 1 Introduction 1-1 System Requirements... 4 1-2 Overview of Virtual
Applicable Printer models 9150/9150R 7150/7150R
 Applicable Printer models 9150/9150R 7150/7150R About This Guide Preface "RISO Mailing Log Viewer" is the dedicated application software for using the Wrapping Envelope Finisher (Mail maker) connected
Application of Skills: Microsoft Excel 2013 Tutorial
 Application of Skills: Microsoft Excel 2013 Tutorial Throughout this module, you will progress through a series of steps to create a spreadsheet for sales of a club or organization. You will continue to
SI-100 Digital Microscope. User Manual
 SI-100 Digital Microscope User Manual Read this manual before use Keep for future reference Content 1 Introduction... 3 1.1 About The SI-100... 3 1.2 Advantage of SI-100... 3 1.3 Product Specification...
testo Comfort Software Professional 4 Instruction manual
 testo Comfort Software Professional 4 Instruction manual 2 1 Contents 1 Contents 1 Contents...3 2 About this document...5 3 Specifications...6 3.1. Use...6 3.2. System requirements...6 4 First steps...7
Smart Monitor ZG2 User s Manual
 Smart Monitor ZG2 User s Manual Smart Sensors ZG2 Series 2D Profile Measuring Sensors CONTENTS SMART MONITOR ZG2 USER S MANUAL...1 SECTION 1 PREPARATIONS...2 Installing the Smart Monitor ZG2 on a Computer...
Introduction to Microsoft Excel 2016
 Screen Elements: Introduction to Microsoft Excel 2016 The Ribbon The Ribbon is designed to help you quickly find the commands that you need to complete a task. Commands are organized in logical groups,
Troubleshooting in Microsoft Excel 2002
 Page 1 of 8 Troubleshooting in Microsoft Excel 2002 Result: To understand how to work with the Excel software to enter data, navigate the page, and print materials. Tabs Look at the tabs at the bottom
Open. Select the database and click. Print. Set printing options using the dropdown menus, then click the
 The Original Quick Reference Guides Microsoft Access 2010 Access is a tool for creating and managing databases collections of related records structured in an easily accessible format such as a table,
GCC vinyl cutter, cutting plotter for sign making
 Plotter Setup In "Plotter Setup," you can choose "Plotter List," "Environment," "Pen," and so on. [Plotter list] In this area, you can choose the machine type and set some basic information for your plotter
AEMLog users guide V User Guide - Advanced Engine Management 2205 West 126 th st Hawthorne CA,
 AEMLog users guide V 1.00 User Guide - Advanced Engine Management 2205 West 126 th st Hawthorne CA, 90250 310-484-2322 INTRODUCTION...2 DOCUMENTATION...2 INSTALLING AEMLOG...4 TRANSFERRING DATA TO AND
Report Generator for DPOPWR
 Online Help Report Generator for DPOPWR Adapted from the Report Generator for DPOPWR Online Help www.tektronix.com Copyright Tektroni x. All rights reserved. Licensed software products are owned by Tektronix
Software User's Guide
 Software User's Guide Brother QL-series The contents of this guide and the specifications of this product are subject to change without notice. Brother reserves the right to make changes without notice
Quick Reference Summary
 Microsoft Excel 2010 Quick Reference Summary Microsoft Excel 2010 Quick Reference Summary 3-D Chart, Rotate EX 462 3-D Rotation button (Chart Tools Layout tab Background, change rotation (Format Chart
Legal Notes. Regarding Trademarks KYOCERA MITA Corporation
 Legal Notes Unauthorized reproduction of all or part of this guide is prohibited. The information in this guide is subject to change without notice. We cannot be held liable for any problems arising from
VANGUARD LOAD TAP CHANGER ANALYZER (LTCA) VERSION 2.xx SOFTWARE MANUAL. LTCA-10, LTCA-40, WRM-10P, WRM-40, TRM-20, TRM-40, TRM-203, and TRM-403
 VERSION 2.xx SOFTWARE MANUAL. LTCA-10, LTCA-40, WRM-10P, WRM-40, TRM-20, TRM-40, TRM-203, and TRM-403") VANGUARD LOAD TAP CHANGER ANALYZER (LTCA) VERSION 2.xx SOFTWARE MANUAL For Use with Vanguard s LTCA-10, LTCA-40, WRM-10P, WRM-40, TRM-20, TRM-40, TRM-203, and TRM-403 Load Tap Changer Analyzers and Winding
VANGUARD LOAD TAP CHANGER ANALYZER (LTCA) VERSION 2.xx SOFTWARE MANUAL For Use with Vanguard s LTCA-10, LTCA-40, WRM-10P, WRM-40, TRM-20, TRM-40, TRM-203, and TRM-403 Load Tap Changer Analyzers and Winding
Excel Core Certification
 Microsoft Office Specialist 2010 Microsoft Excel Core Certification 2010 Lesson 6: Working with Charts Lesson Objectives This lesson introduces you to working with charts. You will look at how to create
Agilent MassHunter Workstation Software Report Designer Add-in
 Agilent MassHunter Workstation Software Report Designer Add-in Quick Start Guide What is the Agilent MassHunter Workstation Software Report Designer Add-in? 2 Report Designer UI elements 3 Getting Started