TAKE CONTROL OF LOGS WITH ELASTICSEARCH
|
|
|
- Arron Dennis
- 6 years ago
- Views:
Transcription


1 TAKE CONTROL OF LOGS WITH ELASTICSEARCH
2 AGENDA Benefits of Collec;ng Log Data Why Use Elas;csearch (and the Elas;c Stack) Using the Elas;c Stack to Collect Logs Learning about your System
3 Why Collect Log Data?
4 WHAT LOGS TELL US Local error messages Isolated data Point-in-;me data
5 LOG SOURCES PIA_Access Servlet Logs (IDDA) APPSRV Anything you want
6 BENEFITS Search for log data in one loca;on Correlate events between servers See trends in log events Collect data for future decisions Capture overall system health Make presy graphs!
7 Why Elasticsearch?
8 ELASTICSEARCH ADVANTAGES Control your own data You already (or will soon) use Elas;csearch Collect only the data you want Does not require PeopleSoW Performance Monitor Collect more than PeopleSoW data Easily build your own metrics Free and open source
9 ELASTICSEARCH VERSIONS PeopleTools uses Elas;csearch Kibana 4.5, Logstash 2.4 Elas;c Stack 5.3 is latest Can I use my PeopleSoW Elas;c install for logs? orcl_acl plugin breaks Kibana License Restrictions
10 Using the Elastic Stack

11 ELASTIC STACK ARCHITECTURE Collect Enrich Index Search
12 INSTALL ELASTIC STACK Elas%csearch Kibana 1. Download Elasticsearch 1. Download Kibana 2. Unzip Elasticsearch 2. Unzip Kibana 3. Run bin\elasticsearch.bat 3. Run bin\kibana.bat
13 INSTALL ELASTIC STACK Logstash 1. Download Logstash 2. Unzip Logstash 3. Configure Filters 4. Run bin\logstash.bat
14 INSTALL ELASTIC STACK Filebeat Topbeat/Metricbeat 1. Download Filebeat 1. Download Topbeat 2. Unzip Filebeat 2. Unzip Topbeat 3. Configure Files and Output 3. Configure Output 4. Run bin\filebeat.bat 4. Run bin\topbeat.bat
15 INSTALL FILEBEAT Install Filebeat with Puppet puppet module install pcfens-filebeat Configure Logstash output with Puppet class { 'filebeat': outputs => { 'logstash' => { 'hosts' => [ 'elastic.psadmin.io:5044', ], }, }, }
16 CONFIGURE FILEBEAT filebeat: prospectors: - paths: - /psoft/logs/hrapp003p/pia/pia_access.log fields: domain: hr92prd server_type: webapp region: PRD host: hrapp003p input_type: log document_type: access_log scan_frequency: 10s tail_files: true
17 CONFIGURE FILEBEAT $pia_domain_list.each $domain_name, $pia_domain_info { filebeat::prospector {"${domain_name}-web": paths => [ } } "${pia_domain_info['ps_cfg_home_dir']}/webserv/${domain_name}/servers/pia/logs/pia_access.log", ], doc_type => 'access_log', input_type => 'log', ignore_older => '24h', fields_under_root => 'true', tail_files => 'true', fields => { domain => "${domain_name}", server_type => hiera('server_type'), region => hiera('region'), }
18 LOGSTASH CONFIGURATION Give structure to incoming data Collect, Enrich, Transport input{} filter{} output{}
19 CONFIGURE LOGSTASH input { beats { type => beats port => 5044 } } filter { } output { elasticsearch { hosts => [ elastic.psadmin.io:9200 ] workers => 4 index => "logstash-%{+yyyy.mm.dd}" } }
20 LOGSTASH FILTERS filter { grok { match => { "message" => %{WL_IO_EXTENDED}"} } grok { match => { "request" => %{PS_URI_REQUEST}"} } date { } match => [ "timestamp", "MMM dd yyyy HH:mm:ss","MMM d yyyy HH:mm:ss", "ISO8601" ] } useragent { source => useragent, target => agent }
21 GROK EXPRESSIONS /psc/hr92prd/employee/hrms/c/role_manager.tl_mss_ee_srch_prd.gbl PS_URI_REQUEST %{WORD:servlet}(/%{WORD:site_name})?(/% {WORD:portal}/%{WORD:node}/)?(%{WORD:content_type}/(% {PS_WEBLIB:iscript} %{WORD:menu}\.%{PS_COMPONENT:component})?)? (\?%{GREEDYDATA:query_string})? PS_COMPONENT %{WORD:componentName}\.%{WORD:market} hsp://grokdebug.herokuapp.com
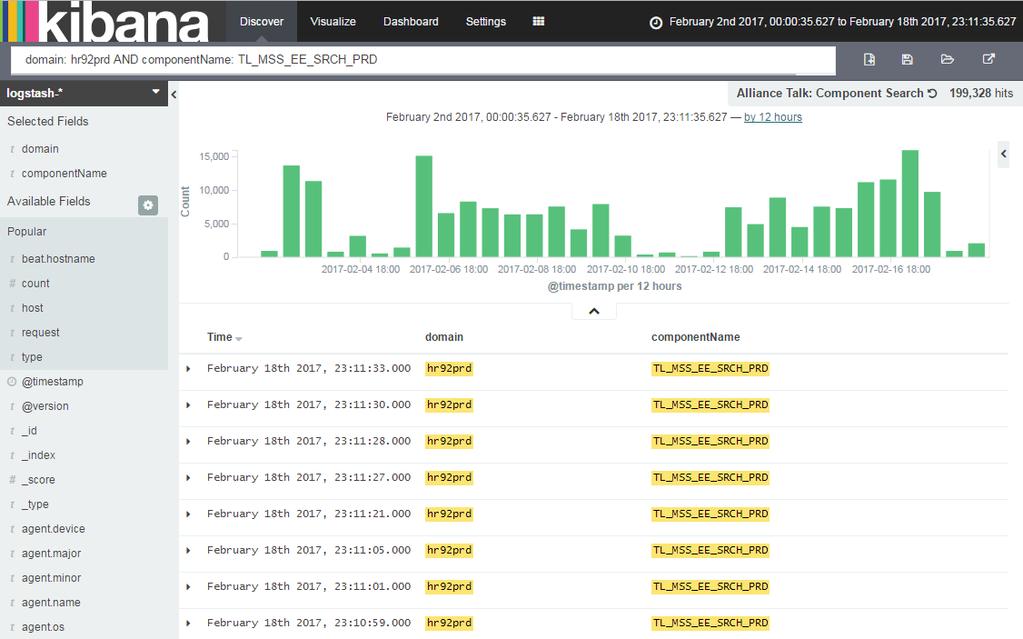
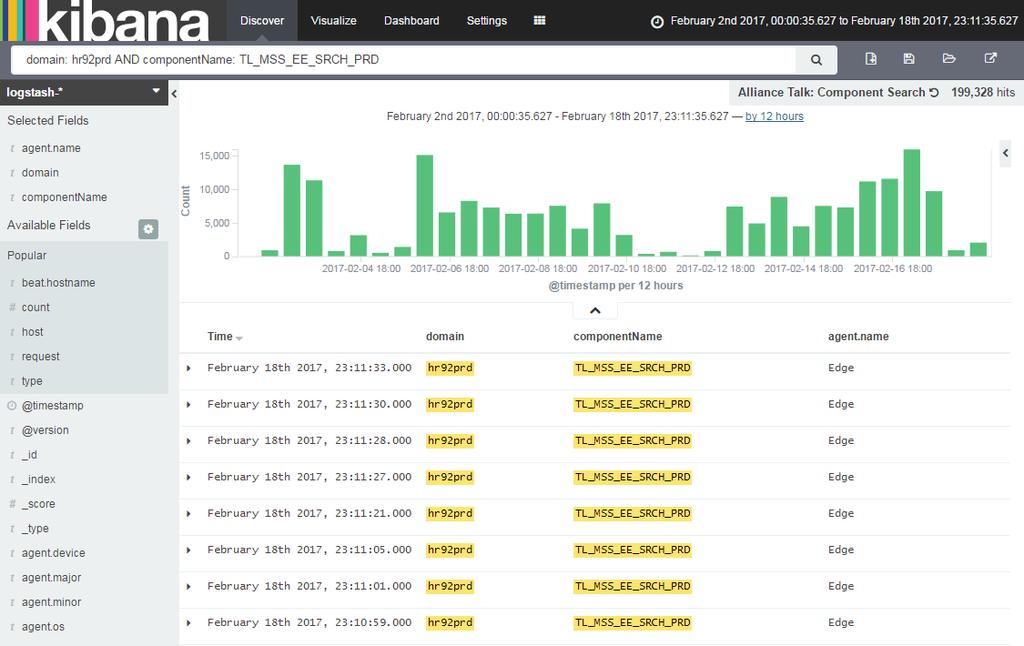
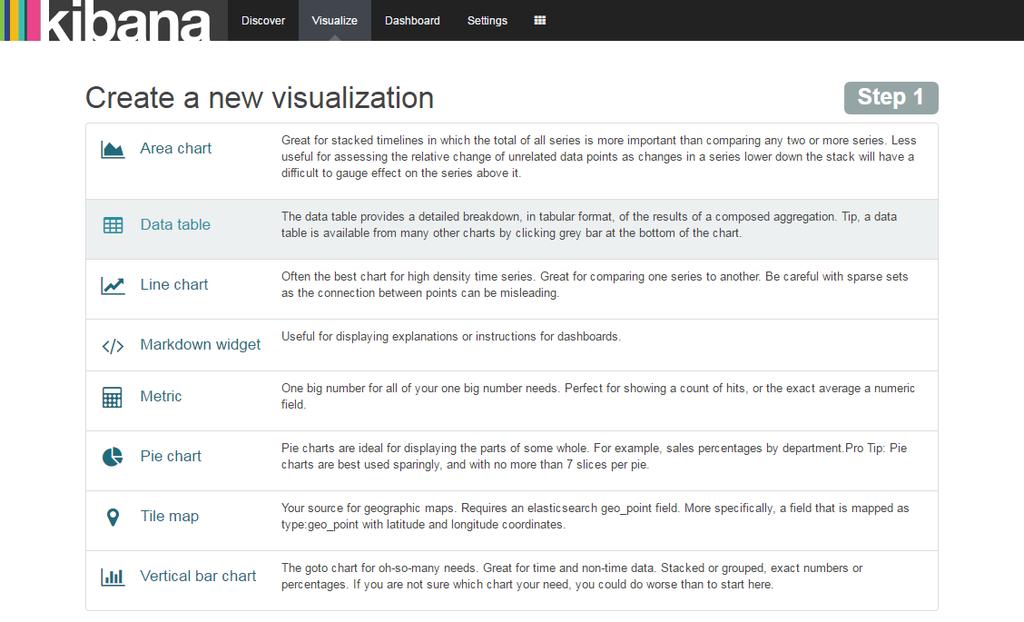
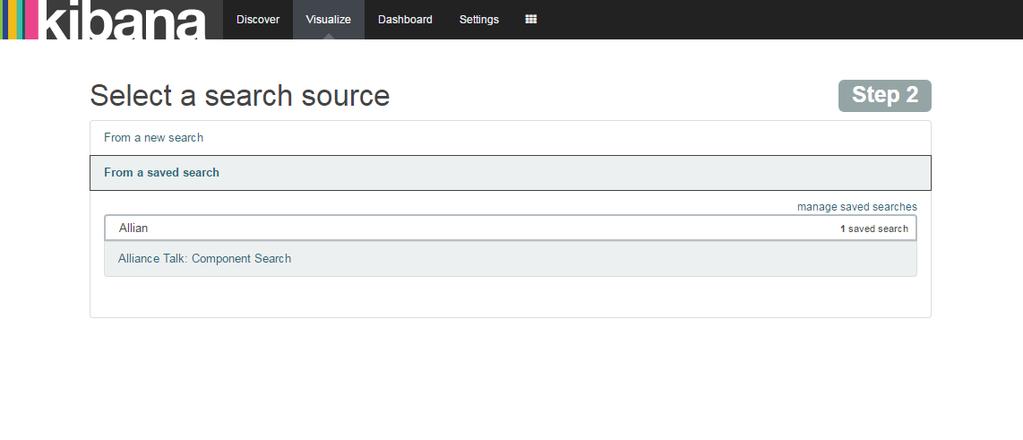
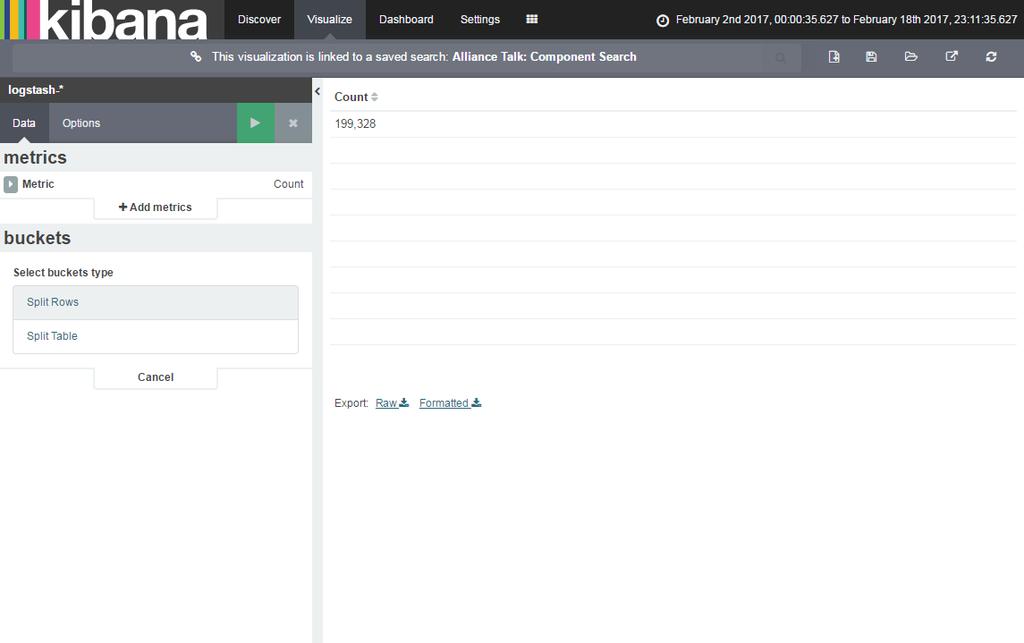
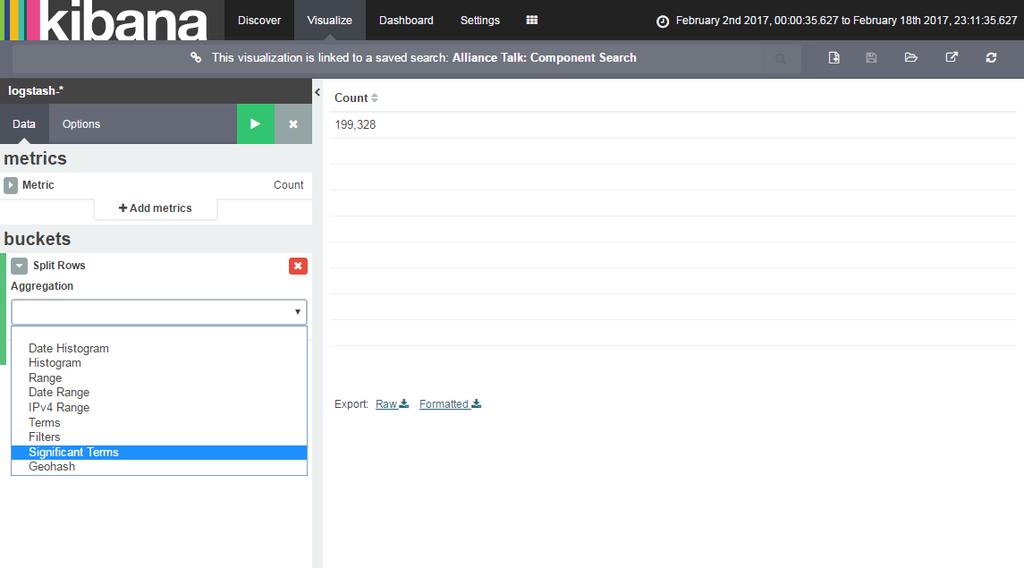
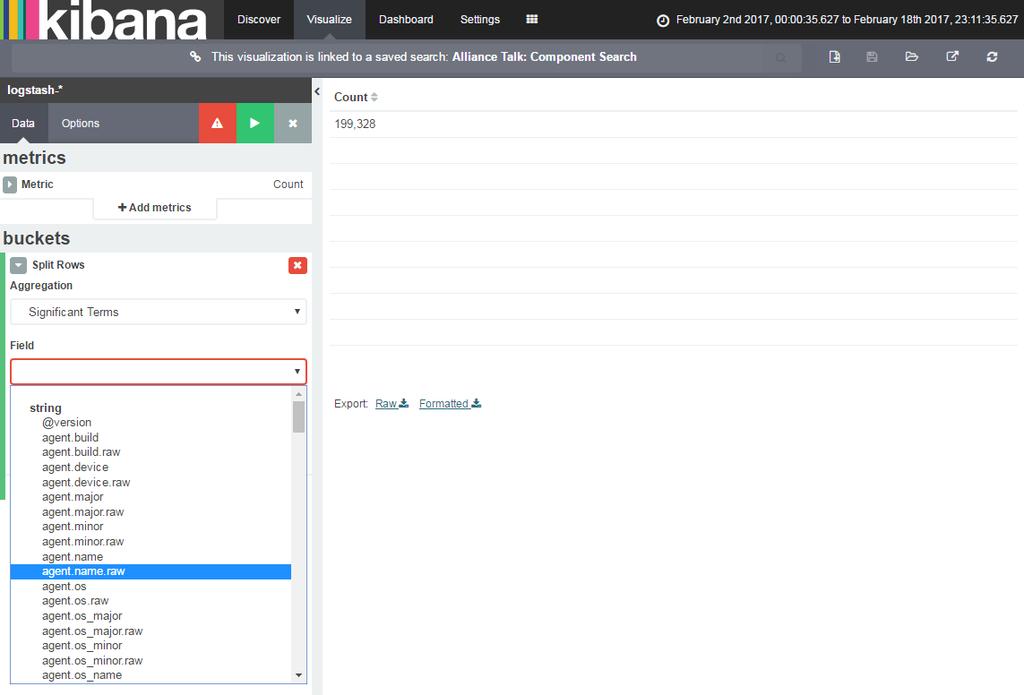
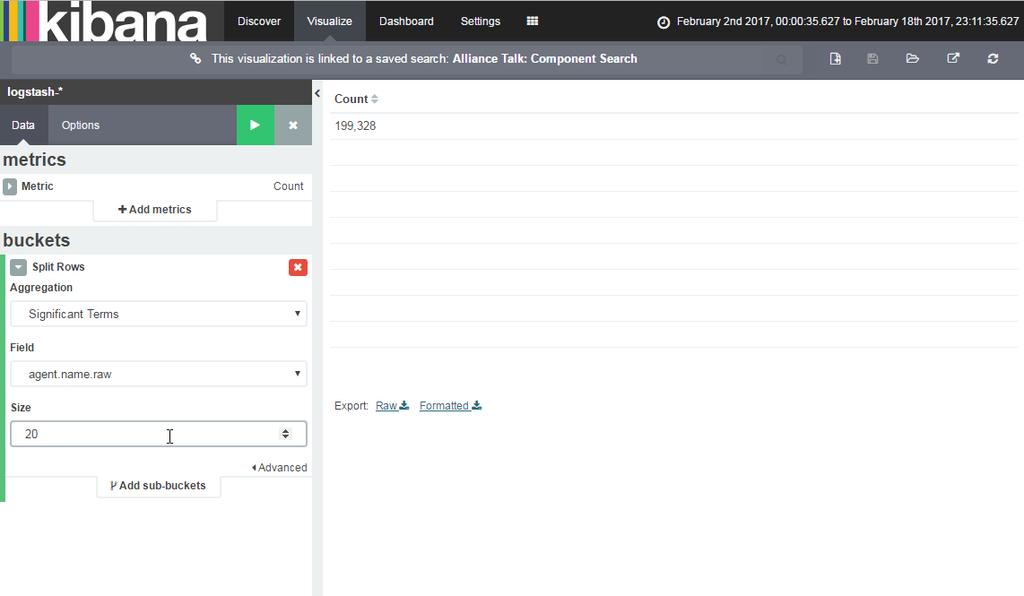
22 Explore Log Data!
23

24
25
26
27
28
29
30
31
32
33
34
35
36
37
38
39
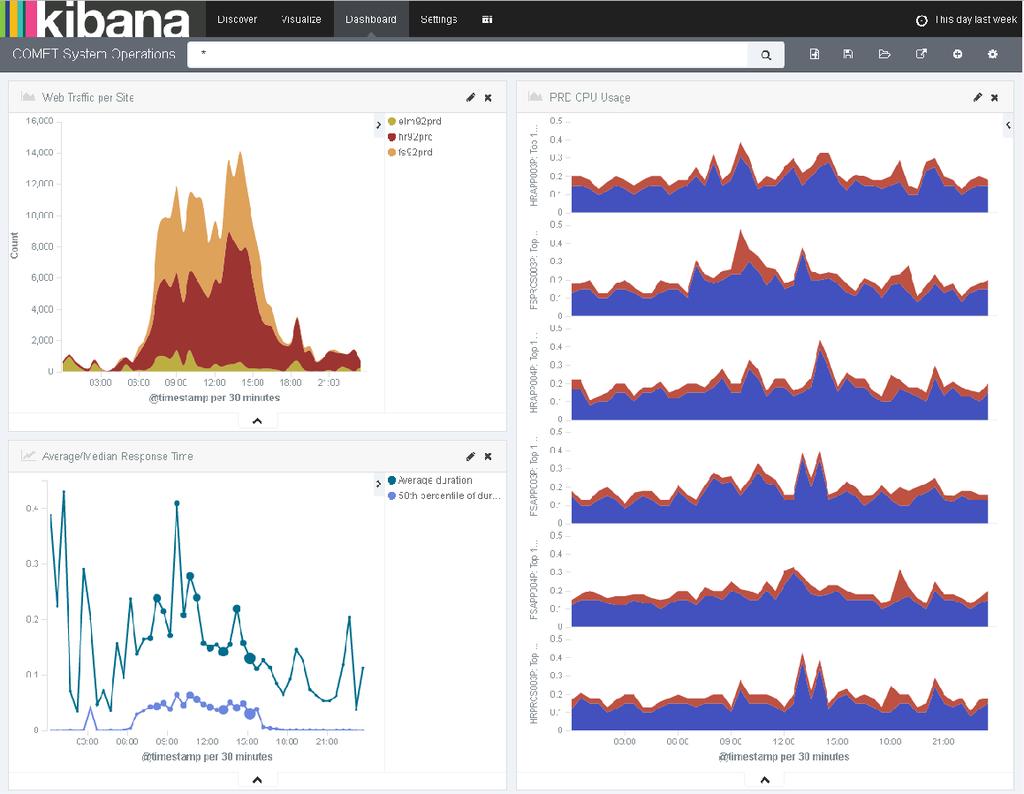
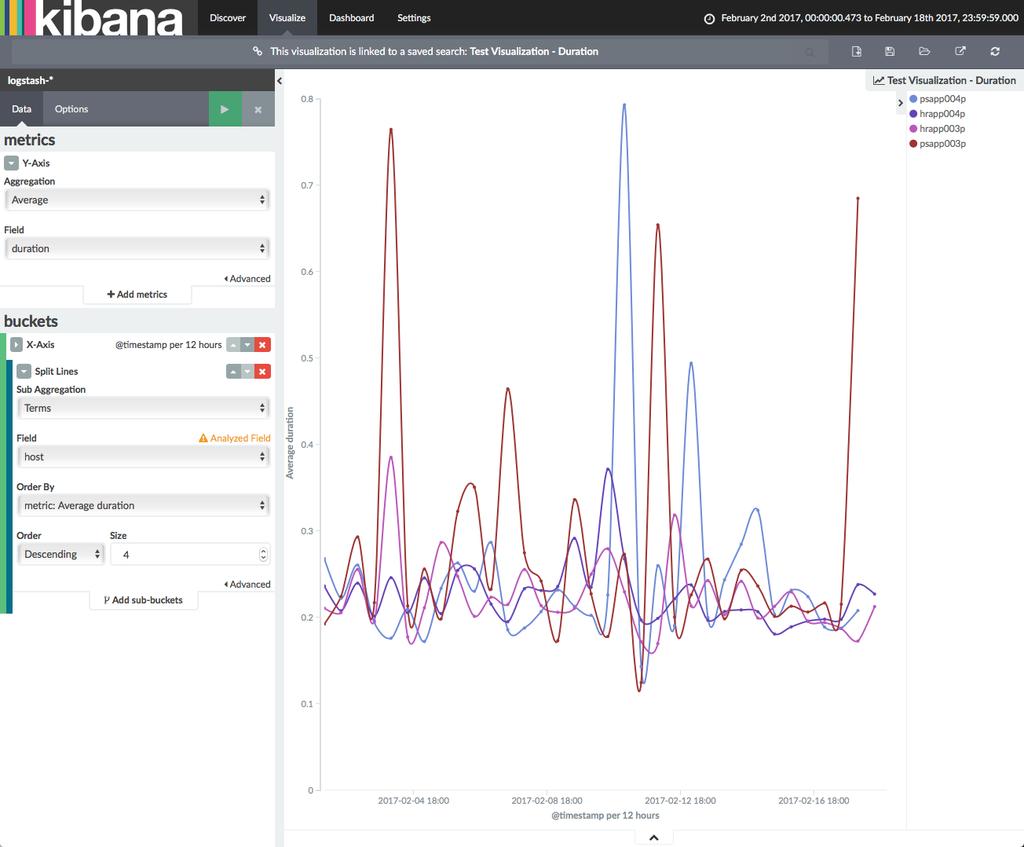
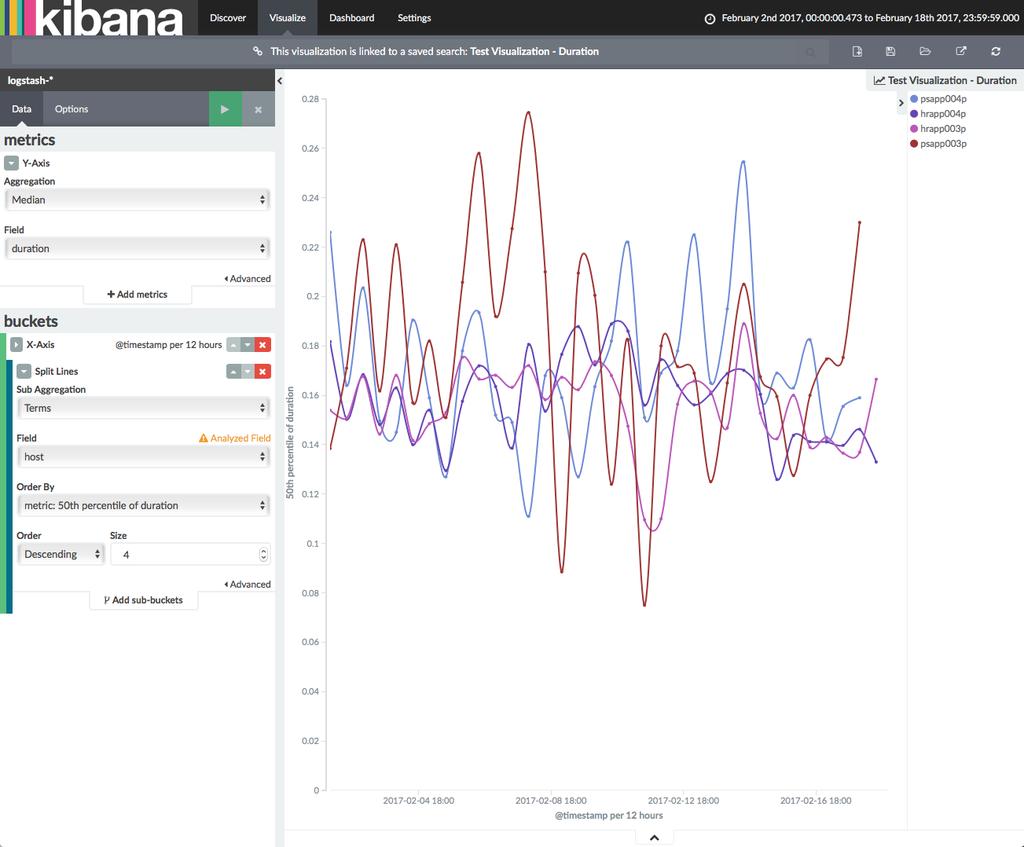
40 OPERATIONS DASHBOARD
41 OPERATIONS DASHBOARD
42 OPERATIONS DASHBOARD
43 OPERATIONS DASHBOARD

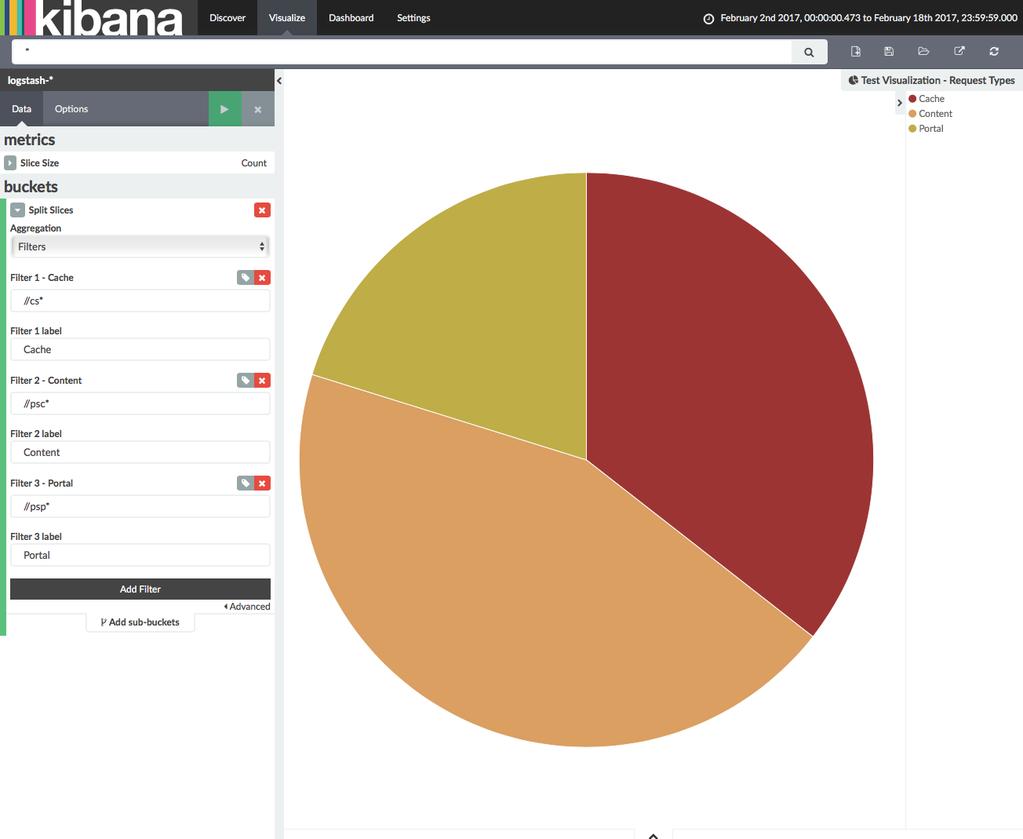
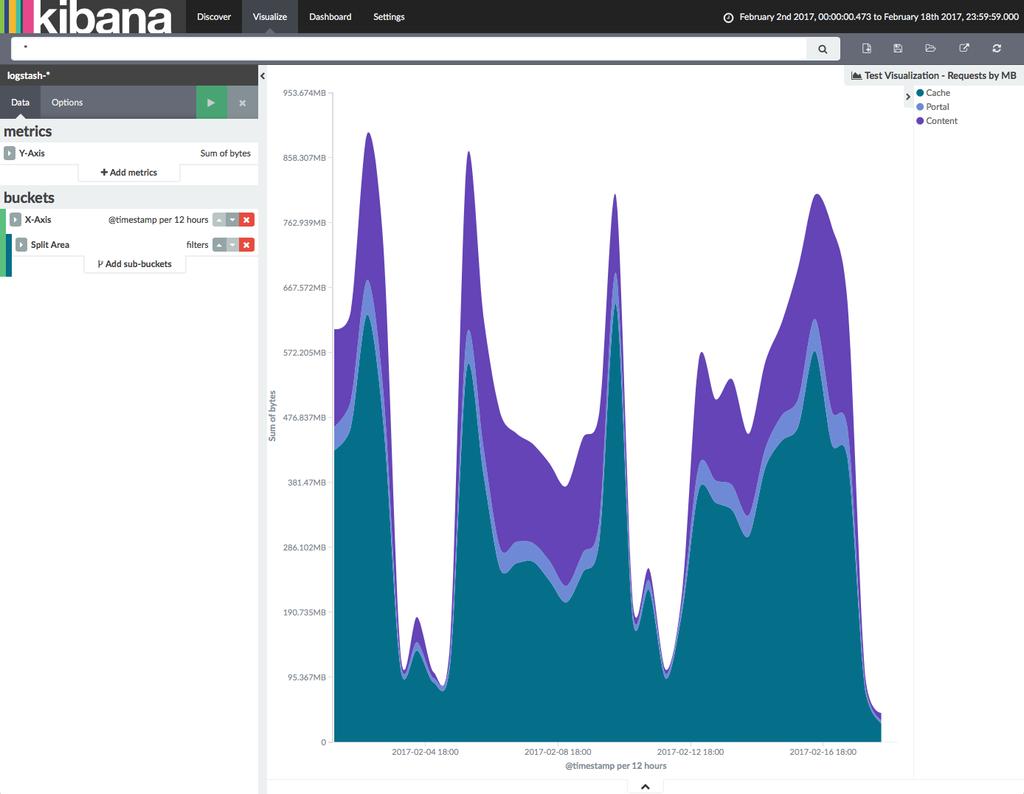
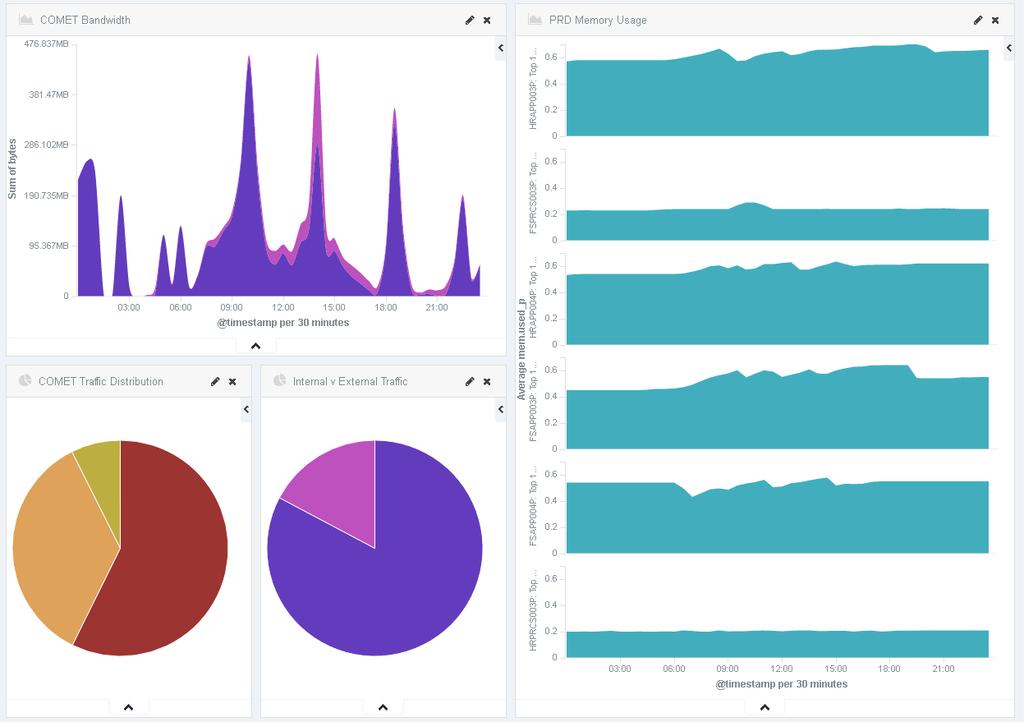
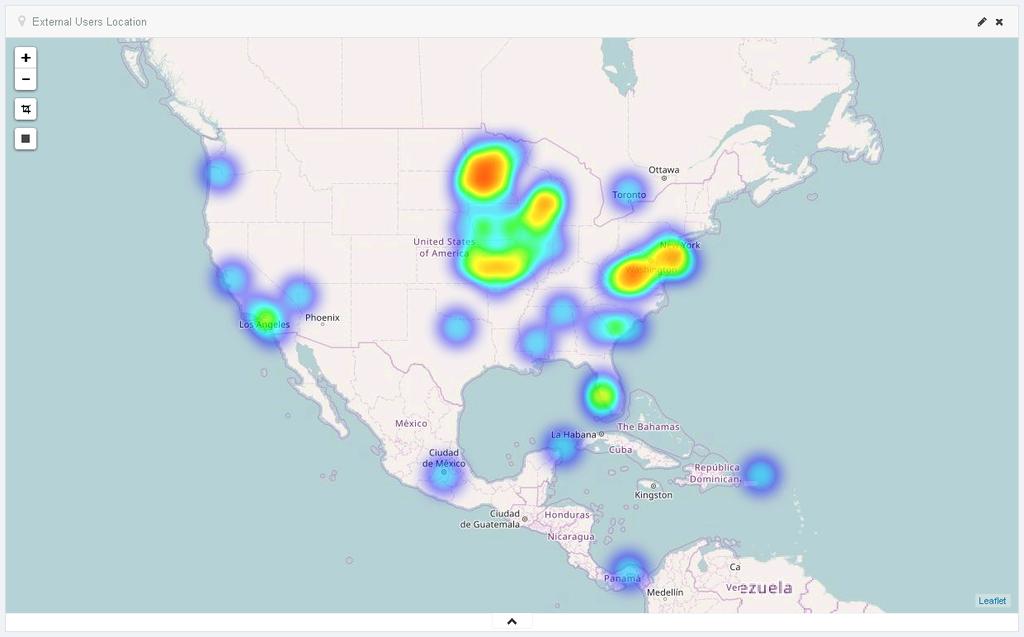
44 TRAFFIC DASHBOARD

45 TRAFFIC DASHBOARD

46 SERVER DASHBOARD

47 SERVER DASHBOARD

48 SERVER DASHBOARD

49 SPONTANEOUS STRESS TEST
50 SHARE DATA
51 LOG CORRELATION
52 LOG CORRELATION
53 DATA RETENTION Elas;c Curator Define reten;on ;mes per index curator --host servername --port 9200 delete indices --older-than 21 --time-unit days --timestring %%Y.%%m.%%d
54 psadmin.io/reconnect psadmin.io Community

55 Please Complete Your Session Evaluation Evaluate this session in your COLLABORATE app. Pull up this session and tap "Session Evaluation" to complete the survey. Session ID:
Log Analysis When CLI get's complex. ITNOG3 Octavio Melendres Network admin - Fastnet Spa
 Log Analysis When CLI get's complex ITNOG3 Octavio Melendres Network admin - Fastnet Spa Introduction Network engineer at Fastnet Spa from 2003 Fastnet Spa is an ISP from Marche Region located in Ancona
Infrastructure at your Service. Elking your PostgreSQL Database Infrastructure
 Infrastructure at your Service. About me Infrastructure at your Service. Arnaud Berbier Senior Consultant +41 79 128 91 45 arnaud.berbier@dbi-services.com Page 2 Agenda 1.Playground Infrastructure 2.Elastic
BUILDING HA ELK STACK FOR DRUPAL
 BUILDING STACK FOR DRUPAL Marji Cermak DevOps track, Experience level: Intermediate Marji Cermak Systems Engineer at @cermakm Scope of this presentation technical talk targeting sysadmins and systems savvy
Unifying logs and metrics data with Elastic Beats. Monica Sarbu Team lead, Elastic Beats
 Unifying logs and metrics data with Elastic Beats Monica Sarbu Team lead, Elastic Beats # Who am I Team lead at Elastic Beats Software engineer Joined Elastic 1 year ago @monicasarbu http://github.com/monicasarbu
The ELK Stack. Elastic Logging. TPS Services Ltd. Copyright 2017 Course Title
 The ELK Stack Elastic Logging Content 1.Log analysis 2.The ELK stack 3.Elasticsearch Lab 1 4.Kibana phase 1 Lab 2 5.Beats Lab 3 6.Kibana Lab 4 7.Logstash & Filebeat Lab 5 8.Enhanced Logstash Lab 6 9.Kibana
Monitor your infrastructure with the Elastic Beats. Monica Sarbu
 Monitor your infrastructure with the Elastic Beats Monica Sarbu Monica Sarbu Team lead, Beats team Email: monica@elastic.co Twitter: 2 Monitor your servers Apache logs 3 Monitor your servers Apache logs
Ingest Node: (re)indexing and enriching documents within
indexing and enriching documents within") Ingest Node: (re)indexing and enriching documents within Elasticsearch @lucacavanna # Agenda 1 Why ingest node? 2 How does it work? 3 Where can it be used? 2 # Why ingest node? # I just want to tail a
Ingest Node: (re)indexing and enriching documents within Elasticsearch @lucacavanna # Agenda 1 Why ingest node? 2 How does it work? 3 Where can it be used? 2 # Why ingest node? # I just want to tail a
Securing the Elastic Stack
 Securing the Elastic Stack Jay Modi, Security Software Engineer Tim Vernum, Security Software Engineer Elastic March 1st, 2018 @jaymode2001 @TimVernum Authentication Who are you? 3 Built-in Users elastic
Application monitoring with BELK. Nishant Sahay, Sr. Architect Bhavani Ananth, Architect
 Application monitoring with BELK Nishant Sahay, Sr. Architect Bhavani Ananth, Architect Why logs Business PoV Input Data Analytics User Interactions /Behavior End user Experience/ Improvements 2017 Wipro
AALOK INSTITUTE. DevOps Training
 DevOps Training Duration: 40Hrs (8 Hours per Day * 5 Days) DevOps Syllabus 1. What is DevOps? a. History of DevOps? b. How does DevOps work anyways? c. Principle of DevOps: d. DevOps combines the best
Wrangling Logs with Logstash and ElasticSearch
 Wrangling Logs with Logstash and ElasticSearch Nate Jones & David Castro Media Temple OSCON 2012 Why are we here? Size Quantity Efficiency Access Locality Method Filtering Grokability Noise Structure Metrics
The webinar will start soon... Elasticsearch Performance Optimisation
 The webinar will start soon... Performance Optimisation 1 whoami Alan Hardy Sr. Solutions Architect NEMEA 2 Webinar Housekeeping & Logistics Slides and recording will be available following the webinar
Ingest. Aaron Mildenstein, Consulting Architect Tokyo Dec 14, 2017
 Ingest Aaron Mildenstein, Consulting Architect Tokyo Dec 14, 2017 Data Ingestion The process of collecting and importing data for immediate use 2 ? Simple things should be simple. Shay Banon Elastic{ON}
Distributed CI: Scaling Jenkins on Mesos and Marathon. Roger Ignazio Puppet Labs, Inc. MesosCon 2015 Seattle, WA
 Distributed CI: Scaling Jenkins on Mesos and Marathon Roger Ignazio Puppet Labs, Inc. MesosCon 2015 Seattle, WA About Me Roger Ignazio QE Automation Engineer Puppet Labs, Inc. @rogerignazio Mesos In Action
Firefox Crash Reporting.
 Firefox Crash Reporting laura@ mozilla.com @lxt Webtools @ Mozilla Crash reporting Localization Performance measurement Code search and static analysis Other stuff: product delivery and updates, plugins
BUILDING EFFECTIVE DATABASE BACKUP AND RECOVERY MONITORING USING ELASTIC STACK
 BUILDING EFFECTIVE DATABASE BACKUP AND RECOVERY MONITORING USING ELASTIC STACK September 2017 AUTHOR: Yasmine Nasri SUPERVISOR: Sebastien Masson CERN IT-DB Group CERN openlab Summer Student Report 2017
Are you visualizing your logfiles? Bastian Widmer
 Are you visualizing your logfiles? Bastian Widmer / @dasrecht Visualizing Logfiles with ELK Stack Bastian Widmer / @dasrecht Hola Com estàs? Bastian Widmer @dasrecht / bastianwidmer.ch DrupalCI: Modernizing
Ingest. David Pilato, Developer Evangelist Paris, 31 Janvier 2017
 Ingest David Pilato, Developer Evangelist Paris, 31 Janvier 2017 Data Ingestion The process of collecting and importing data for immediate use in a datastore 2 ? Simple things should be simple. Shay Banon
Monitor your containers with the Elastic Stack. Monica Sarbu
 Monitor your containers with the Elastic Stack Monica Sarbu Monica Sarbu Team lead, Beats team monica@elastic.co 3 Monitor your containers with the Elastic Stack Elastic Stack 5 Beats are lightweight shippers
Filebeat is able to do multiline while collecting logs from the container. you can use autodiscover to configure it in many ways
 elasticguest8086 Since k8 by default is using the json log file driver which will not support call trace (multi-line log).. Any solution for it with ELK? like using logstash as a logging driver? Filebeat
Ninja Level Infrastructure Monitoring. Defensive Approach to Security Monitoring and Automation
 Ninja Level Infrastructure Monitoring Defensive Approach to Security Monitoring and Automation 1 DEFCON 24 06 th August 2016, Saturday 10:00-14:00 Madhu Akula & Riyaz Walikar Appsecco.com 2 About Automation
Created'by'Cody'Herriges
 GETTING DATA OUT OF YOUR CLOUD(S) WITH OPEN SOURCE OBTAINING SUPERIOR INSIGHT Created'by'Cody'Herriges INTRODUCTION Puppet'Labs Opera4ons'Engineer Systems'Team'lead OUR PROBLEMS No'consumable'historic'data
Ingesting Logs with style. What has been cooking lately in Logstash world.
 Ingesting Logs with style What has been cooking lately in Logstash world. # $whoami Pere Urbon-Bayes (Software Engineer since ever) Have always worked with databases, data and analytics. GraphDevRoom@FOSDEM
Monitoring for IT Services and WLCG. Alberto AIMAR CERN-IT for the MONIT Team
 Monitoring for IT Services and WLCG Alberto AIMAR CERN-IT for the MONIT Team 2 Outline Scope and Mandate Architecture and Data Flow Technologies and Usage WLCG Monitoring IT DC and Services Monitoring
MQ Monitoring on Cloud
 MQ Monitoring on Cloud Suganya Rane Digital Automation, Integration & Cloud Solutions Agenda Metrics & Monitoring Monitoring Options AWS ElasticSearch Kibana MQ CloudWatch on AWS Prometheus Grafana MQ
Bitnami ELK for Huawei Enterprise Cloud
 Bitnami ELK for Huawei Enterprise Cloud Description The ELK stack is a log management platform consisting of Elasticsearch (deep search and data analytics), Logstash (centralized logging, log enrichment
Don t Fly Blind. Christoph Eichhorn & Christian Düfel SAP Karlsruhe Germany
 Don t Fly Blind Christoph Eichhorn & Christian Düfel SAP Karlsruhe Germany Router Microservice Architecture Your App UAA Some Service Payment Service Some Other Service Discovery Service Recommendation
Amazon Elasticsearch Service
 Amazon Elasticsearch Service Fully managed, reliable, and scalable Elasticsearch service. Have Your Frontend & Monitor It Too Scalable Log Analytics Inside a VPC Lab Instructions Contents Lab Overview...
P:\filebeat.yml 18 October :55
 ######################## Filebeat Configuration ############################ # This file is a full configuration example documenting all non-deprecated # options in comments. For a shorter configuration
Thales PunchPlatform Agenda
 Thales PunchPlatform Agenda What It Does Building Blocks PunchPlatform team Deployment & Operations Typical Setups Customers and Use Cases RoadMap 1 What It Does Compose Arbitrary Industrial Data Processing
Post-Exploitation Hunting with ATT&CK & Elastic
 Post-Exploitation Hunting with ATT&CK & Elastic John Hubbard @SecHubb SOC Lead at GlaxoSmithKline SANS Author & Instructor SEC455: SIEM Design & Implementation SEC511: Continuous Monitoring & Security
About the Tutorial. Audience. Prerequisites. Copyright and Disclaimer. Logstash
 About the Tutorial is an open-source, centralized, events and logging manager. It is a part of the ELK (ElasticSearch,, Kibana) stack. In this tutorial, we will understand the basics of, its features,
White Paper: ELK stack configuration for OpenEdge BPM
 White Paper: ELK stack configuration for OpenEdge BPM Copyright 2017 Progress Software Corporation and/or its subsidiaries or affiliates. All rights reserved. These materials and all Progress software
Microservices log gathering, processing and storing
 Microservices log gathering, processing and storing Siim-Toomas Marran Univeristy of Tartu J.Liivi 2 Tartu, Estonia siimtoom@ut.ee ABSTRACT The aim of this work is to investigate and implement one of the
INSIGHTS INTO ECS DATA UTILIZATION USING OPEN SOURCE TOOLS
 INSIGHTS INTO ECS DATA UTILIZATION USING OPEN SOURCE TOOLS Analyzing ECS Access Logs with Elasticsearch, Logstash, and Kibana (ELK) ABSTRACT This white paper explains how administrators can better understand
Table 1 The Elastic Stack use cases Use case Industry or vertical market Operational log analytics: Gain real-time operational insight, reduce Mean Ti
 Solution Overview Cisco UCS Integrated Infrastructure for Big Data with the Elastic Stack Cisco and Elastic deliver a powerful, scalable, and programmable IT operations and security analytics platform
DEVOPS COURSE CONTENT
 LINUX Basics: Unix and linux difference Linux File system structure Basic linux/unix commands Changing file permissions and ownership Types of links soft and hard link Filter commands Simple filter and
E l a s t i c s e a r c h F e a t u r e s. Contents
 Elasticsearch Features A n Overview Contents Introduction... 2 Location Based Search... 2 Search Social Media(Twitter) data from Elasticsearch... 4 Query Boosting in Elasticsearch... 4 Machine Learning
Datasheet FUJITSU Software ServerView Cloud Monitoring Manager V1.1
 Datasheet FUJITSU Software ServerView Cloud Monitoring Manager V1.1 Datasheet FUJITSU Software ServerView Cloud Monitoring Manager V1.1 A Monitoring Cloud Service for Enterprise OpenStack Systems Cloud
Elasticsearch & ATLAS Data Management. European Organization for Nuclear Research (CERN)
") Elasticsearch & ATAS Data Management European Organization for Nuclear Research (CERN) ralph.vigne@cern.ch mario.lassnig@cern.ch ATAS Analytics Platform proposed eb. 2015; work in progress; correlate data
Elasticsearch & ATAS Data Management European Organization for Nuclear Research (CERN) ralph.vigne@cern.ch mario.lassnig@cern.ch ATAS Analytics Platform proposed eb. 2015; work in progress; correlate data
Backing Up And Restoring Nagios Log Server. This document describes how to backup and restore a Nagios Log Server cluster.
 Backing Up And Restoring Purpose This document describes how to backup and restore a cluster. Target Audience This document is intended for use by Administrators who wish to understand the different backup
ELK for Enterprise IR Visibility
 ELK for Enterprise IR Visibility Mark Goudie, Security Consulting Director Barry Anderson, Security Architect Agenda Introduction Security Challenges IR and Issues ELK Inputs Enrichment Cloud Integration
FUJITSU Software ServerView Cloud Monitoring Manager V1.0. Overview
 FUJITSU Software ServerView Cloud Monitoring Manager V1.0 Overview J2UL-2073-01ENZ0(00) November 2015 Trademarks Copyright FUJITSU LIMITED 2015 LINUX is a registered trademark of Linus Torvalds. The OpenStack
WLCG SOC Working Group
 WLCG SOC Working Group David Crooks david.crooks@cern.ch Liviu Vâlsan liviu.valsan@cern.ch Introduction Following on from ISGC 2017 WLCG Security Operations Centres Working Group Security Operations Centres
Using AWS to Build a Large Scale Dockerized Microservices Architecture. Dr. Oliver Wahlen moovel Group GmbH Frankfurt, 30.
 Using AWS to Build a Large Scale Dockerized Microservices Architecture Dr. Oliver Wahlen moovel Group GmbH Frankfurt, 30. Juni 2016 The moovel Group GmbH Our vision is an ecosystem that simplifies mobility
Cubro FlowVista Series
 Cubro FlowVista Series PRODUCT REVIEW Network Probe At a glance Definition A Probe is a passive device which receives network traffic from TAPs and Packet Brokers and extracts meta data. Advantages of
FROM MONOLITH TO DOCKER DISTRIBUTED APPLICATIONS
 FROM MONOLITH TO DOCKER DISTRIBUTED APPLICATIONS Carlos Sanchez @csanchez Watch online at carlossg.github.io/presentations ABOUT ME Senior So ware Engineer @ CloudBees Author of Jenkins Kubernetes plugin
EveBox Documentation. Jason Ish
 Jason Ish May 29, 2018 Contents: 1 Installation 1 2 Server 3 2.1 Running................................................. 3 2.2 Oneshot Mode.............................................. 4 2.3 Authentication..............................................
Datasheet FUJITSU Software Cloud Monitoring Manager V2.0
 Datasheet FUJITSU Software Cloud Monitoring Manager V2.0 Cloud Monitoring Manager supports DevOps teams to keep maximum control of their OpenStack Cloud OpenStack is complex and highly distributed. Gaining
Take Your SIEM to the Next Level with 3rd Party Tools and Scripts
 Take Your SIEM to the Next Level with 3rd Party Tools and Scripts SIEM & Tactical Analytics SUMMIT November 2017 Who Am I? Austin Taylor Chief Security Research Engineer @ IronNet Cybersecurity Cyber Warfare
The Elasticsearch-Kibana plugin for Fuel Documentation
 The Elasticsearch-Kibana plugin for Fuel Documentation Release 0.9-0.9.0-1 Mirantis Inc. April 26, 2016 CONTENTS 1 User documentation 1 1.1 Overview................................................. 1 1.2
The Art of Container Monitoring. Derek Chen
 The Art of Container Monitoring Derek Chen 2016.9.22 About me DevOps Engineer at Trend Micro Agile transformation Micro service and cloud service Docker integration Monitoring system development Automate
#MicroFocusCyberSummit
 #MicroFocusCyberSummit Data Simplicity: ArcSight Data Platform enhances enterprise data via the Common Event Format Peter Titov Micro Focus #MicroFocusCyberSummit Agenda Usage Ingestion Management Solutions
LOG AGGREGATION. To better manage your Red Hat footprint. Miguel Pérez Colino Strategic Design Team - ISBU
 LOG AGGREGATION To better manage your Red Hat footprint Miguel Pérez Colino Strategic Design Team - ISBU 2017-05-03 @mmmmmmpc Agenda Managing your Red Hat footprint with Log Aggregation The Situation The
OSM Hackfest Session 6 Performance & Fault Management Benjamín Díaz (Whitestack)
") OSM Hackfest Session 6 Performance & Fault Management Benjamín Díaz (Whitestack) Introduction Performance and Fault Management capabilities have made important progress in Release FIVE. At the time of
OSM Hackfest Session 6 Performance & Fault Management Benjamín Díaz (Whitestack) Introduction Performance and Fault Management capabilities have made important progress in Release FIVE. At the time of
Tips & Tricks: Vault QualityDocs Dashboards and Reports. October 22, 2014
 Tips & Tricks: Vault QualityDocs Dashboards and Reports October 22, 2014 Today s Session Interactive session to build reports and dashboards in Vault QualityDocs Overview of the capabilities of Vault reporting
End to End Analysis on System z IBM Transaction Analysis Workbench for z/os. James Martin IBM Tools Product SME August 10, 2015
 End to End Analysis on System z IBM Transaction Analysis Workbench for z/os James Martin IBM Tools Product SME August 10, 2015 Please note IBM s statements regarding its plans, directions, and intent are
UiPath Orchestrator Azure Installation
 UiPath Orchestrator Azure Installation Revision History Date Version Author Description 9 th June 2016 2016.1 M.B. Applied Template 8 th June 2016 2016.2 C.S. Created Document UiPath Orchestrator Azure
Search Engines and Time Series Databases
 Università degli Studi di Roma Tor Vergata Dipartimento di Ingegneria Civile e Ingegneria Informatica Search Engines and Time Series Databases Corso di Sistemi e Architetture per Big Data A.A. 2017/18
EveBox Documentation. Release. Jason Ish
 EveBox Documentation Release Jason Ish Jan 25, 2018 Contents: 1 Installation 1 2 Server 3 2.1 Running................................................. 3 2.2 Oneshot Mode..............................................
Logloop Installation and Administration Guide
 Logloop Installation and Administration Guide Update 2017/07 Agenda Install and config Logloop Setup data pipelines Workshop: Create dashboards Install and config logloop Retrieve logloop package depends
ntopng A Web-based Network Traffic Monitoring Application
 ntopng A Web-based Network Traffic Monitoring Application New York City, NY June 14th, 2017 Simone Mainardi linkedin.com/in/simonemainardi Agenda About ntop Network traffic monitoring
All Events. One Platform.
 All Events. One Platform. Industry s first IT ops platform that truly correlates the metric, flow and log events and turns them into actionable insights. Correlate Integrate Analyze www.motadata.com Motadata
Introduction Document scope Background Role based access control... 4
 Contents Introduction... 4 1.1 Document scope... 4 1.2 Background... 4 2 Role based access control... 4 3 Login Screen... 4 3.1 Login to the website... 4 3.2 Main screen... 5 4 Administration... 6 4.1
End-to-End Security Analytics with the Elastic Stack. Samir Bennacer
 End-to-End Security Analytics with the Elastic Stack Samir Bennacer!1 !2 Attacks are inevitable Cybersecurity Maturity Curve Phase 1 Security Event Management Phase 2 Automation Phase 3 Proactive Analytics
Streamline AWS Security Incidents
 IMF 2018 Streamline AWS Security Incidents Asif Matadar @d1r4c #whoami Director of Endpoint Detection & Response (EDR), EMEA at Tanium Seasoned Incident Response professional with over 7 years experience
Eyes Everywhere: Monitoring Today's Borderless Landscape
 SESSION ID: CMI1-R09 Eyes Everywhere: Monitoring Today's Borderless Landscape Bill Shinn Principal Security Architect Amazon Web Services @packet791 What we ll cover today Event & Finding Reference Architecture
InfiniBand and Mellanox UFM Fundamentals
 InfiniBand and Mellanox UFM Fundamentals Part Number: MTR-IB-UFM-OST-A Duration: 3 Days What's in it for me? Where do I start learning about InfiniBand? How can I gain the tools to manage this fabric?
How to integrate the Elasticsearch Logstash Kibana (ELK) log analytics stack into IBM Bluemix
 log analytics stack into IBM Bluemix") How to integrate the Elasticsearch Logstash Kibana (ELK) log analytics stack into IBM Bluemix Nick Cawood IBM Cloud Client Adoption and Technical Enablement Client and Technical Engagement August 2016
How to integrate the Elasticsearch Logstash Kibana (ELK) log analytics stack into IBM Bluemix Nick Cawood IBM Cloud Client Adoption and Technical Enablement Client and Technical Engagement August 2016
Information Security Policy
 Information Security Policy Information Security is a top priority for Ardoq, and we also rely on the security policies and follow the best practices set forth by AWS. Procedures will continuously be updated
Developing and Testing Java Microservices on Docker. Todd Fasullo Dir. Engineering
 Developing and Testing Java Microservices on Docker Todd Fasullo Dir. Engineering Agenda Who is Smartsheet + why we started using Docker Docker fundamentals Demo - creating a service Demo - building service
User Manual. CG Elastic. Version 1.17-SNAPSHOT
 User Manual CG Elastic Version 1.17-SNAPSHOT 2017-11-30 Table of Contents 1. Introduction.............................................................................. 1 2. Modules..................................................................................
Corralling logs with ELK
 Corralling logs with ELK Open Source Log Analytics Mark Walkom @warkolm mark.walkom@elasticsearch.com Copyright Elasticsearch 2015. 2014. Copying, publishing and/or distributing without written permission
Linux Clusters Institute: Monitoring. Zhongtao Zhang, System Administrator, Holland Computing Center, University of Nebraska-Lincoln
 Linux Clusters Institute: Monitoring Zhongtao Zhang, System Administrator, Holland Computing Center, University of Nebraska-Lincoln Why monitor? 2 Service Level Agreement (SLA) Which services must be provided
Turbocharge your MySQL analytics with ElasticSearch. Guillaume Lefranc Data & Infrastructure Architect, Productsup GmbH Percona Live Europe 2017
 Turbocharge your MySQL analytics with ElasticSearch Guillaume Lefranc Data & Infrastructure Architect, Productsup GmbH Percona Live Europe 2017 About the Speaker Guillaume Lefranc Data Architect at Productsup
Powering Monitoring Analytics with ELK stack
 Powering Monitoring Analytics with ELK stack Abdelkader Lahmadi, Frédéric Beck To cite this version: Abdelkader Lahmadi, Frédéric Beck. Powering Monitoring Analytics with ELK stack. 9th International Conference
Overview. SUSE OpenStack Cloud Monitoring
 Overview SUSE OpenStack Cloud Monitoring Overview SUSE OpenStack Cloud Monitoring Publication Date: 08/04/2017 SUSE LLC 10 Canal Park Drive Suite 200 Cambridge MA 02141 USA https://www.suse.com/documentation
NotifySCM Analytics Configuration Guide
 NotifySCM Analytics Configuration Guide 1 7 TABLE OF CONTENTS 1 Overview... 3 2 Enabling Analytics Engine... 3 2.1 Enable Data Collection... 3 2.2 Activate an Analytics Engine Listener... 3 3 Install Visualization
Lab Exercises: Deploying, Managing, and Leveraging Honeypots in the Enterprise using Open Source Tools
 Lab Exercises: Deploying, Managing, and Leveraging Honeypots in the Enterprise using Open Source Tools Fill in the details of your MHN Server info. If you don t have this, ask your instructor. These details
with ElasticSearch, Logstash and Kibana
 Analyse logs with ElasticSearch, Logstash and Kibana Clément OUDOT @clementoudot Founded in 1999 >100 persons Montréal, Quebec City, Ottawa, Paris ISO 9001:2004 / ISO 14001:2008 contact@savoirfairelinux.com
Best Practice Deployment of F5 App Services in Private Clouds. Henry Tam, Senior Product Marketing Manager John Gruber, Sr. PM Solutions Architect
 Best Practice Deployment of F5 App Services in Private Clouds Henry Tam, Senior Product Marketing Manager John Gruber, Sr. PM Solutions Architect Agenda 1 2 3 4 5 The trend of data center, private cloud
Empfehlungen vom BigData Admin
 Empfehlungen vom BigData Admin an den Oracle DBA Florian Feicht, Alexander Hofstetter @FlorianFeicht @lxdba doag2017 Our company. Trivadis is a market leader in IT consulting, system integration, solution
How to see what is happening inside your OpenStack using Elastic Stack and Prometheus
 How to see what is happening inside your OpenStack using Eastic Stack and Prometheus Introduction & Agenda About me - Csaba Patyi (csaba@componentsofteu) - Consutant and Instuctor at Component Soft Ltd
ELK. Elasticsearch Logstash - Kibana
 ELK Elasticsearch Logstash - Kibana Welcome to Infomart Infomart is a media monitoring app which monitors both Social and Traditional Media. Social media includes Twitter, Facebook, Youtube, Wordpress,
Insights into your WLC with Wireless Streaming Telemetry
 Insights into your WLC with Wireless Streaming Telemetry Jeremy Cohoe Technical Marketing Engineer Cisco Spark How Questions? Use Cisco Spark to communicate with the speaker after the session 1. Find this
Search and Time Series Databases
 Università degli Studi di Roma Tor Vergata Dipartimento di Ingegneria Civile e Ingegneria Informatica Search and Time Series Databases Corso di Sistemi e Architetture per Big Data A.A. 2016/17 Valeria
Introduction to ELK stack
 Introduction to ELK stack 巨量資料處理 搜尋 及分析工具介紹 計資中心網路組邵喻美 madeline@ntu.edu.tw 1 Topics Why big data tool for network traffic and log analysis What is ELK stack, and why choose it ELK stack intro ELK use cases
KIWA Digital App Reporting
 KIWA Digital App Reporting Reporting Options Flurry Analytics itunes Connect Survey Monkey Flurry Analytics Reports on ISO, Android and Windows Flurry Analytics provides you with a set of analytics tools
Build your own IDM Audit Dashboard
 Build your own IDM Audit Dashboard Open Horizons Magazine for OH Summit Budapest 2014 Special Edition Q2, 2014 by Andreas Fuhrmann, SKyPRO AG, Switzerland The NetIQ Identity Manager is a very powerful
TrueSight 10 Architecture & Scalability Q&A Best Practice Webinar 8/18/2015
 Q: Where can I find the TrueSight Operations Management Best Practice material? A: TrueSight OM Best Practice material is published on the BMC Communities web site at the following link. https://communities.bmc.com/docs/doc-37443
Building a Scalable Recommender System with Apache Spark, Apache Kafka and Elasticsearch
 Nick Pentreath Nov / 14 / 16 Building a Scalable Recommender System with Apache Spark, Apache Kafka and Elasticsearch About @MLnick Principal Engineer, IBM Apache Spark PMC Focused on machine learning
ABC Monitoring Solution
 ABC Monitoring Solution FRAFOS GmbH FRAFOS GmbH Bismarckstr. 10-12 10625 Berlin Germany info@frafos.com www.frafos.com This document is copyright of FRAFOS GmbH. Duplication or propagation or extracts
1. Go to apps to download the app.
 How to use VMworld 2014 US Mobile App 1. Go to www.vmworld.com/community/conference/mobile apps to download the app. 2. Once downloaded, tap the VMworld 14 icon to open the app. 3. You will see the Splash
SaaS Providers. ThousandEyes for. Summary
 USE CASE ThousandEyes for SaaS Providers Summary With Software-as-a-Service (SaaS) applications rapidly replacing onpremise solutions, the onus of ensuring a great user experience for these applications
Identity-Based Cyber Defense. March 2017
 Identity-Based Cyber Defense March 2017 Attackers Continue to Have Success Current security products are necessary but not sufficient Assumption is you are or will be breached Focus on monitoring, detecting
How-to Guide: Tenable Applications for Splunk. Last Revised: August 21, 2018
 How-to Guide: Tenable Applications for Splunk Last Revised: August 21, 2018 Table of Contents Overview 3 Components 4 Tenable Add-on (TA-tenable) 5 Source and Source Types 6 CIM Mapping 7 Tenable App for
AWS FREQUENTLY ASKED QUESTIONS (FAQ)
") UCPATH @ AWS FREQUENTLY ASKED QUESTIONS (FAQ) ARCHITECTURE WHAT WILL CHANGE DURING THIS MOVE TO AWS? All environments use a standardized format using Cloud Formation Scripts. They are also all encapsulated
UCPATH @ AWS FREQUENTLY ASKED QUESTIONS (FAQ) ARCHITECTURE WHAT WILL CHANGE DURING THIS MOVE TO AWS? All environments use a standardized format using Cloud Formation Scripts. They are also all encapsulated
AUTOMATE CLOUD RECOVERY it s the only way to be sure Ashley Neely Sr. Solution Strategist 2017 Proprietary and Confidential
 LHC1951BE Let OVH Help You Automate your Cloud Recovery for when you are Nuked from Orbit: It s the only way to be sure. VMworld 2017 Content: Not for publication Ashley Neely Sr. Solution Strategist #VMworld
Cloud Monitoring as a Service. Built On Machine Learning
 Cloud Monitoring as a Service Built On Machine Learning Table of Contents 1 2 3 4 5 6 7 8 9 10 Why Machine Learning Who Cares Four Dimensions to Cloud Monitoring Data Aggregation Anomaly Detection Algorithms
Gaurav Rai Mazra. Senior Software Developer
 Gaurav Rai Mazra Senior Software Developer A technology enthusiast and conscientious programmer with over 6 years of experience in multi - disciplinary domains such as HR, Education, Financial (Asset Management)