Tivoli Common Reporting V2.x. Reporting with Tivoli Data Warehouse
|
|
|
- Irma Cross
- 6 years ago
- Views:
Transcription
1 Tivoli Common Reporting V2.x Reporting with Tivoli Data Warehouse Preethi C Mohan IBM India Ltd. India Software Labs, Bangalore preethi.mohan@in.ibm.com Copyright IBM Corporation 2012 This document is the sole property of IBM India Ltd. No part of this document may be reproduced in any form or by any means - electronic, mechanical, photocopying, recording or otherwise without the prior written permission of IBM India Ltd. 1
2 Document Control Revision Date Author Summary of Changes 1.1 Jul 27, 2012 Preethi C Mohan First version 1.2 Aug 1, 2012 Preethi C Mohan Added step 5 in Exercise Aug 31,2012 Preethi C Mohan Inserted exercise 4 on filters 1.4 Oct 29, 2012 Preethi C Mohan Inserted exercise 6 on custom data in reports 1.5 May 28, 2013 Preethi C Mohan - Added candletime and Timezone information in Introduction - Updated exercise 4 to show multiple server selection 1.6 Jun 3, 2013 Preethi C Mohan - Updating exercise on drill down - Added exercise 10 on Import package Reviewers Name Dan Krissell Agnieszka Marzec Title Tivoli Common Reporting Architect Information Developer 2
3 Table of Content Introduction... 4 Help Information... 5 Exercise 1 Creating the data source and data model... 6 Exercise 2 Use direct SQL Exercise 3 Use Tivoli Common Reporting Template Exercise 4 Use filter to view data of single or multiple server Exercise 5 Use summarized tables of Tivoli Data Warehouse Exercise 6 Use custom tables in report Exercise 7 Add a chart to the report Exercise 8 Add a drill down capability Exercise 9 Export report package Exercise 10 Import report package
4 Introduction This document provides a set of exercises which help to learn the basic features of Cognos. These exercises use Tivoli Data Warehouse as the data source. This document is intended for a user who wants to create Cognos reports by fetching data from the Tivoli Data Warehouse (TDW) populated by IBM Tivoli Monitoring agents. The exercises use tables from ITM Windows OS Agent. However, you can use similar tables that are present in your Tivoli Data Warehouse. This document does not cover the installation of Tivoli Common Reporting. It assumes that both Tivoli Common Reporting and Cognos Framework Manager are already installed. It also assumes that the database server/client is already installed on the system and Tivoli Data Warehouse database is reachable. Note: TCR 2.x does not support JDBC data source connection. Hence, database server/client should be setup on the TCR machine. Advice for novice users is to execute these exercises in a sequential order of 1 to 7. Some steps are explained in detail in the first few exercises. And the following exercises assume you know those steps as you have already tried them in the initial exercises. Tivoli Data Warehouse Timestamp field Tivoli Data Warehouse uses Candletime format to represent the date/time of the data recorded. WRITETIME is the column in the Warehouse which contains the date/time in Candletime format. Cognos understands only Timestamp format. So, this document covers the section of converting Candletime to Timestamp for a report. Candletime format: Candletime: Candletime Format: CYYMMddhhmmssSSS where C Century, YY Year, MM Month, dd Day, hh Hour, mm Minute, ss Second, SSS - Milliseconds CYY - (to be added to candle time assumes 1900 as the base) Century with year = = 113 Year = = 2013 Timestamp: :15:


5 Help Information This document is not meant to replace any existing Tivoli Common Reporting help document. When using Cognos Framework Manager, for details on any property, use the Help menu available in the tool. For help when using Tivoli Common Reporting web console, use the Help links. There are Help menus in Query and Report studios as well. Online Tivoli Common Reporting information center: 21/ic-home.html 5
6 Exercise 1 Creating the data source and data model The purpose of the exercise: Create a data source in Cognos Administration. Create a data model and publish it. This exercise also shows how to use the WRITETIME field which is in Candletime format. (Note: It does not handle Timezone) Procedure 1. List the report requirements. For e.g.: Show the CPU utilization of all the computers in a report. 2. Design the report. For e.g.: A table showing the list of servers and their CPU utilization over time. Provide a time range selection. 3. Identify the database table where you would get the required data. For e.g.: Database: WAREHOUS ITM Agent: Windows OS Agent Table: NT_Processor_DV, NT_Processor_HV Columns: WRITETIME, Server_Name, AVG_%_Processor_Time 4. Add data source in the Administration Log in to Tivoli Integrated Portal. ( Expand Reporting and click Common Reporting. Click Launch in the top right corner and select Administration. 6


7 4.3. In the Administration window, click the Configuration tab and select Data Source Connections Click the Add Data Source icon Enter WAREHOUS as the name for the data source and click Next Choose DB2 as the database type and click Next Enter WAREHOUS as the DB2 database name Scroll down and select the Password checkbox under Signons. Enter the database user name and password. 7


8 4.9. Click Test the connection Click the Test button. The output will look like this: Click Close. Click Close again to close the test the connection window Click Next on the Specify the DB2 connection string window Click Finish on the Specify the commands window A new entry WAREHOUS is visible in your data source list: 5. Create a data model using Framework Manager to fetch the data Open Framework Manager (For e.g.: C:\IBM\tivoli\tipv2Components\TCRComponent\cognos\bin\FM.exe). On Windows, you can use the shortcut to launch it. 8


9 5.2. Click Create a new project. Enter Test as the project name and click OK Accept all security pop-up windows. Provide Tivoli Integrated Portal user name and password wherever you are prompted for it Select the language and click OK Select Data Sources as the Metadata Source. Click Next Select WAREHOUS from the data source list and click Next ITMUSER is the schema name for WAREHOUS. Expand it and go to the Views directory Select NT_Processor_DV and NT_Processor_HV. Click Next Select to Import with default values Click Finish. 9

10 5.11. Create namespaces in the data model Create a namespace called Database View under WAREHOUS and move NT_Processor_HV and NT_Processor_DV under the Database View Create Consolidation View and Presentation View namespaces Create a query subject by right clicking on Consolidation View and selecting Create->Query Subject. Call it CPU Usage NT. Click OK. 10


11 Drag WRITETIME, Server_Name, and AVG_%_Processor_Time from NT_Processor_DV and drop them into the Query Items section. 11
![5.11.5. Cognos does not understand WRITETIME field [Refer introduction section for more details on WRITETIME]. So, lets convert Candletime to Timestamp.](/docs-images/74/71379839/images/12-0.jpg "Click Add to create a new query item for Timestamp. Add the following expression cast((cast((cast(substring([consolidation View].[CPU Usage - NT].")
12 Cognos does not understand WRITETIME field [Refer introduction section for more details on WRITETIME]. So, lets convert Candletime to Timestamp. Click Add to create a new query item for Timestamp. Add the following expression cast((cast((cast(substring([consolidation View].[CPU Usage - NT].[WRITETIME], 1, 3), integer) ) as char(4)) + '-' + substring([consolidation View].[CPU Usage - NT].[WRITETIME], 4,2) + '-' + substring([consolidation View].[CPU Usage - NT].[WRITETIME], 6,2) + ' ' + substring([consolidation View].[CPU Usage - NT].[WRITETIME], 8,2) + ':' + substring([consolidation View].[CPU Usage - NT].[WRITETIME], 10,2)+ ':' + substring([consolidation View].[CPU Usage - NT].[WRITETIME], 12,2) + '.000') as timestamp) Click OK Click the Test tab and test the query. The data should appear in the tab. 12


13 Click OK Change the usage of the Timestamp to Attribute Right click Consolidation View->CPU Usage NT and create a shortcut. Drag the shortcut and drop it into the Presentation View. Rename the shortcut to CPU Usage NT. 13

14 5.12. Create a package and publish it. Right click Packages. Click on Create->Package Enter Test Package as the package name. Click Next Select the Database and Consolidation Views in the hidden mode and the Presentation View in the full selection mode. Click Next Click Finish. 14

 using the Internet Explorer browser 5.13.2.")
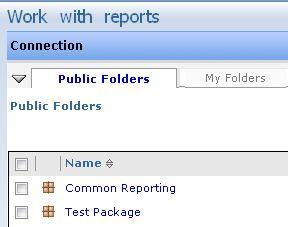
15 Click Yes to open the Publish Package wizard Click Next on the Select Location Type wizard page Click Next on the Add Security wizard page Click Publish on the Options wizard page to publish the package, and then Finish. Ignore any warnings that might be displayed After saving the model, it appears unsaved. It is expected behavior. The model has been published and you can save it before closing Verify if your package is published in Tivoli Integrated Portal Login to Tivoli Integrated Portal ( using the Internet Explorer browser Expand Reporting and click Common Reporting. Check if the Test Package is visible under Public Folders. Note: Click Refresh if you cannot see the package. 6. From the Launch menu, open Report Studio. Choose the Test Package from the list, and select Create a new report or template. Choose Blank from the pop-up window and click OK. 15


16 7. A report with a default page is created. Hover your mouse cursor over the Page Explorer and it will expand to show the pages. 8. Click Page 1 and load a list of data. From the toolbox, drag a set of blocks and then a List and drop it into Page When a list is dragged into the Page, notice that the Query tab in the Insertable Objects window contains a new query. This query is linked to the list. 10.Now add data items into the list by dragging and dropping the data items into page1. 16


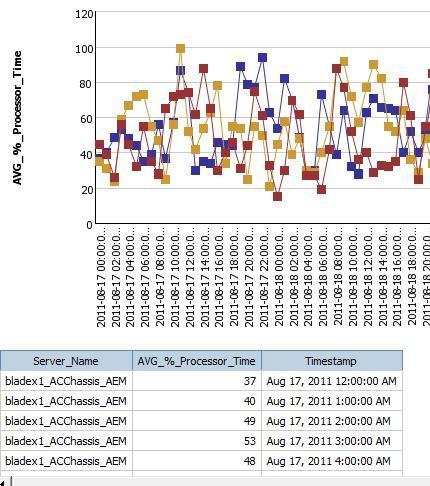
17 11.Right click on the list and click Go to Query. 12.In the Query, select AVG_%_Processor_Time and in the properties section, set the Aggregate Function fields to Average. 13.Run the report by clicking Run->Run Report - HTML 14.The report output appears in a new browser window. 15.You can update the column title names in the report to suit your needs. 17

18 Exercise 2 Use direct SQL The purpose of the exercise: Fetch data from a direct SQL instead of the query from the data model. 1. Create new blank report. 2. Hover your mouse cursor on Query Explorer. When it expands, click Queries. 3. From the Insertable objects pane, drag SQL and drop it into Query Explorer. 4. In the properties section of the SQL, select WAREHOUS as the data source and set the SQL to: Select * from ITMUSER. NT_Processor_DV Note: Copying the strings from this document to Report Studio changes the format of the double quotes. In case Cognos throws an error, just remove the double quotes manually in Cognos page and re-add it. 18
, integer) + 1900) as char(4)) + '-' + substring([sql1].")
![[writetime], 4,2) + '-' + substring([sql1].[writetime], 6,2) + ' ' + substring([sql1].[writetime], 8,2) + ':' + substring([sql1].[writetime], 10,2)+ ':' + substring([sql1].](/docs-images/74/71379839/images/19-1.jpg "[writetime], 12,2) + '.000') as timestamp) 7. Update the aggregate function properties of AVG_%_Processor_Time to Average. (Refer the step showed in Exercise 1) 8.")
19 5. Now, go to the properties of Query 1 and set Processing to Limited Local. 6. Go into Query 1 and add Timestamp data item. Add a new data item called Timestamp and set the expression to the following: cast((cast((cast(substring([sql1].[writetime], 1, 3), integer) ) as char(4)) + '-' + substring([sql1].[writetime], 4,2) + '-' + substring([sql1].[writetime], 6,2) + ' ' + substring([sql1].[writetime], 8,2) + ':' + substring([sql1].[writetime], 10,2)+ ':' + substring([sql1].[writetime], 12,2) + '.000') as timestamp) 7. Update the aggregate function properties of AVG_%_Processor_Time to Average. (Refer the step showed in Exercise 1) 8. Go to the Page Explorer -> Page 1, add blocks and a list. List comes with a new Query called Query 2. 19


20 9. Now change the query of the list to Query Now add data items from the Data Items tab to the page into the list. 11.Run the report. 20


21 Exercise 3 Use Tivoli Common Reporting Template The purpose of the exercise: Use Tivoli Common Reporting template to create a report. Shows how to use the date prompt in the report. 1. Open Report Studio. Choose Create a new report or template and select TCR Template. Click OK. 2. By default, a prompt page and Page 1 is created. The prompt page contains the date prompt set in it and a hint on how to use it. 21
 5.")

22 3. Go to Page1 and add a list on the page. Add data items to the list (like in Exercise 1) 4. Go to Query 1 (from the Query Explorer or right click the list and click Go to Query) 5. From the Insertable Objects->Toolbar tab, drag and drop a Filter into the Details Filter box on the right hand side. When the Detail Filter Expression window comes up, add the following text string in the Expression Definition: #prompt('tcrdatefilter','token','1=1', '[Timestamp]')# 6. Save the report. Name it Test Report. The report will appear under the Test Package in the main Common Reporting window. 22
, and in the date ranges, choose a date range which is a subset of the data you have")
23 7. Run the report 8. In the prompt page, select Date Range (below), and in the date ranges, choose a date range which is a subset of the data you have in the database. 9. Click Finish. The report will show the table with data within the specified date range. 23

24 Exercise 4 Use filter to view data of single or multiple server The purpose of the exercise: Learn how to view data for a selected server by adding a filter to the prompt page. 1. Go to the prompt page of the report, drag and drop a Value Prompt from the Insertable Objects->Toolbox tab into the row below the date controls. 2. You will get a pop-up Prompt Wizard Value Prompt. 24


25 Provide the name as Param_Server and click Next. 3. Now comes the step of creating the filter. Click on the ellipses ( ) button next to the Package item. This will open the Package Item window: 25


26 Choose Server_Name and click OK. 4. Click Next on the Prompt Wizard Value Prompt window. 5. Now, you choose where the filter should be applied. This lists all the queries present in the report. Query1 is listed which was created in Exercise 3 above. Choose Query1 and click Next. 6. This step allows you to populate the control by creating a new query to fetch the list of servers from the database. Set the name as Query_ServerList. And click Finish. 26

27 7. On the prompt page, you will see a combo box added. 8. Now, put a label for this combo box by dragging and dropping a Text Item from the Toolbox tab into the prompt page in front of the combo box. Set the name as Server Name. Prompt page definition will look as shown below 9. Note that the Server Name style is not matching with the other labels. So, copy the style of the other label by following the steps below: 27
28 a. Select the text End Date (not the entire column, just the text) as shown below b. In the toolbar on top of the page, you will find an icon which says Pick up Style, click on it. This will copy the style of the text End Date c. Now, select the text Server Name and click on the Apply Style icon in the toolbar 10. Now the prompt page appears as follows 11. We want to copy the style of the column as well. So, select the entire column of End Date and follow the same steps as shown in Step 9 to copy the style and apply it to the column of Server Name 12. The prompt page will appear as follows 28
29 13.Lets look at the other changes that the wizard Prompt Wizard Value Prompt did. a. Go to the Query Explorer, you will find a new query added there Query_ServerList b. Now, open the Query1 in it, under Detail Filters section, you will find a new filter added there for server name. c. Double click on the filter and you will see the following expression in the filter [Presentation View].[CPU Usage - NT].[Server_Name] =?Param_Server? Note: When a parameter is used in a filter, it will be surrounded by? 14. Now, run the report by clicking on the menu Run->Run Report HTML 29
 for server c. Go to the properties view i. Click Multi-Select and select Yes ii. For Select UI property, choose Check box group 30")
30 Select a server and click on Run. 15. Output will look something like this. Save the report. 16. Lets try to do multiple selection of servers now. a. Go to the prompt page. b. Select the drop down (or Value Prompt) for server c. Go to the properties view i. Click Multi-Select and select Yes ii. For Select UI property, choose Check box group 30
![d. Notice the change on the prompt design page e. Now, open the query (i.e. query1) used for the list on main page. And update the server filter to use in instead of = as follows: [Presentation View].](/docs-images/74/71379839/images/31-0.jpg "[CPU Usage NT].[Server_Name] in?param_server? 17. Run the report 18. This will allow you to select multiple servers on the prompt page and the report will show the data for the selected servers only.")
31 d. Notice the change on the prompt design page e. Now, open the query (i.e. query1) used for the list on main page. And update the server filter to use in instead of = as follows: [Presentation View].[CPU Usage NT].[Server_Name] in?param_server? 17. Run the report 18. This will allow you to select multiple servers on the prompt page and the report will show the data for the selected servers only. 31

32 Exercise 5 Use summarized tables of Tivoli Data Warehouse The purpose of the exercise: Learn how to query the summarized tables or views in Tivoli Data Warehouse dynamically in a report. 1. Open the Test data model in the Framework Manager. 2. Go to Parameter Maps and create a new Parameter Map named NT_Processor_View 3. Add the parameters for NT_Processor for all summarizations with Daily as the default value. Note that Daily is set to 1 because it is recommended to use Daily as default table or view. 32
![4. To access this parameter inside the model, you must use the following text string in the query subjects: #$[NT_Processor_View]{prompt('Summarization','token')}# where Summarization is the name of](/docs-images/74/71379839/images/33-0.jpg "the parameter for the summarization selection combo box to be used in the report prompt page.")
![Go to the query CPU Usage NT in the Consolidation View and replace [NT_Processor_DV] with the text string above in all the query items except Timestamp.](/docs-images/74/71379839/images/33-1.jpg "Timestamp does not need any change as it does not use [NT_Processor_DV].[WRITETIME]. It references the WRITETIME data item from the same query subject.")
33 4. To access this parameter inside the model, you must use the following text string in the query subjects: #$[NT_Processor_View]{prompt('Summarization','token')}# where Summarization is the name of the parameter for the summarization selection combo box to be used in the report prompt page. Go to the query CPU Usage NT in the Consolidation View and replace [NT_Processor_DV] with the text string above in all the query items except Timestamp. Timestamp does not need any change as it does not use [NT_Processor_DV].[WRITETIME]. It references the WRITETIME data item from the same query subject. For example: For WRITETIME, replace the following: [Database View].[NT_Processor_DV].[WRITETIME] With: [Database View].#$[NT_Processor_View]{prompt('Summarization','token')}#.[WRITETIME] 5. Click OK. In the prompt window asking for Summarization, enter 1. It will validate and update the query subject. 6. Save the model. 7. Ensure that Database View and Consolidation View are packaged in the model in the hidden mode. Right click on Packages->Test Package->Edit Definition. 33

34 8. Publish the model (right click on Packages->Test Package and click Publish Packages). Ignore the error messages. 9. Open the saved report Test Report (or a copy of it) in Report Studio. 10.The report will prompt for summarization and when you provide 1, it returns a set of errors. 11.Now, add the summarization control on the prompt page. a. Go to prompt page and add a text field named Summarization. Select the style of the text from other labels and apply it to the Summarization label. b. Add the Value prompt to the prompt page. i. Provide Summarization as new parameter name and click Next. ii. Click Next without changing the default values. Click Finish. c. Add static choices in the properties of the Value prompt. 34


35 d. Add Conditional display values for all the supported summarizations. For this example, I will add only Daily and Hourly. e. Update the Default Selections in the same properties section to Daily. f. Save the report g. Run the report. In the prompt page, select All in the first drop down and select Hourly in the Summarization field. 35

36 h. View the output. Notice the hourly data appearing in the table. 12.Save the report. 36
37 Exercise 6 Use custom tables in report The purpose of the exercise: Group the servers in the Warehouse and filter the reports based on the groups. Assumption: The production environment would have groups defined and populated as part of the customization in the solution. 1. For this exercise, I will create a table in the Warehouse database (with the same schema name as ITM which is ITMUSER in my setup) a. Table: GROUP_SERVER CREATE TABLE ITMUSER.GROUP_SERVER (GROUP_NAME VARCHAR (250) NOT NULL, SERVER_NAME VARCHAR (250) NOT NULL) 2. This table will contain the mapping of group name to server names. 3. In my setup, I have added 2 groups and linked the servers to them INSERT INTO ITMUSER.GROUP_SERVER VALUES ('Critical Servers Group', 'winserver1'), ('Critical Servers Group', 'bladex1_acchassis_aem'), ('Non-Critical Servers Group', 'bladex1_acchassis_custom') 4. Open the saved report Test Report in Report Studio. 5. Go to Query Explorer, and add 3 queries a. Add SQL query to fetch the group server map. Query: select * from ITMUSER.GROUP_SERVER When you double click on Query_GroupList, ensure to set the Processing in properties view to Limited Local. Under the Data Items view you will see GROUP_NAME and SERVER_NAME listed. Ensure to set the aggregate functions for both data items as None in the properties view of the Data Item. b. Add a Query named Query_ServerDetails to fetch the server data. From Insertable Objects view, drag and drop Server_Name, Timestamp, AVG_%_ProcessorTime from CPU Usage NT into Query_ServerDetails query. 37

38 c. Now, add another query joining the above 2 queries.. Go to Query Explorer, drag and drop Join and name the query as Query_Group_Server. Now drag and drop Query_GroupList in the first box of the join, and Query_ServerDetails in the second box of the join. Now, double click on the link and set the join condition by clicking on New Link button. Ensure to select SERVER_NAME and Server_Name from the queries. 38


39 Click OK. Now, double click on Query_Group_Server and ensure to set the Processing in properties view to Limited Local. Now, drag and drop the data items from the 2 queries. Ensure to set aggregate functions of data items GROUP_NAME, Server_Name and Timestamp to None. 6. Now, go to the prompt page, add the label Group Name. (If you have used the report created in previous exercises, then you can remove the server list combobox and the Server Name label to avoid confusion.) 7. Drag and drop a Value prompt to the prompt page. Provide the parameter name as Param_GroupList and click Finish. 8. A new combo box will appear on the prompt page. In the properties view, set the Query to Query_GroupList. And set the Use Value and Display Value to GROUP_NAME. 39


![Filter Expression: [Query_GroupList].[GROUP_NAME] =?Param_GroupList? 11.](/docs-images/74/71379839/images/40-2.jpg "Now, go to Page 1, and from the Data Items tab of the Insertable")
40 9. The prompt page layout will look like this 10. Now go back to Queries Explorer, and double click on Query_Group_Server. Add a filter to this joined query, so that the servers from the selected group are only shown in the report. Filter Expression: [Query_GroupList].[GROUP_NAME] =?Param_GroupList? 11.Now, go to Page 1, and from the Data Items tab of the Insertable Objects view, drag and drop Query_Group_Server onto Page1. 40

41 12. Run the report 13. On the prompt page, you will see combo box with 2 group names in the Group Name combobox. 14. Select Critical Servers Group and Click Finish 41


42 15.To group the column by GROUP_NAME and Server_Name, go back to Page 1 on report studio, and select the respective column individually and select icon from the toolbar. Or click on menu item Structure- >Group/Ungroup. It will appear like this on Page 1 16.Now, run the report with same input 17.List in the report would look like this 42
43 18. Save the report. 43

44 Exercise 7 Add a chart to the report The purpose of the exercise: Learn how to add a chart to the report. Note: You can use a copy of the report created from Exercise 4 here. 1. Drag a line chart and drop it above the table. 2. Drag the data items and drop them into the chart. Drop the Timestamp in x-axis, AVG_%_Processor_Time in y-axis and Server_Name in Series box 44


45 3. Right click on the chart and select Go to Query. 4. In the query, select AVG_%_Processor_Time, and set its aggregate functions to average in the properties. 5. Save the report 6. Run the report with Daily. 45

46 7. Now, try the report with Hourly. 46
47 47

48 Exercise 8 Add a drill down capability The purpose of the exercise: Learn how to add a drill down capability for Timestamp in the chart. 1. Open the data model in Framework Manager 2. Open the Consolidation View-> CPU Usage NT, add query items that represent Year, Month, Day, Hour. For Year, the query item expression is: cast(substring([consolidation View].[CPU Usage - NT].[WRITETIME], 1, 3), integer) For Month, the query item expression is: cast(substring([consolidation View].[CPU Usage - NT].[WRITETIME], 4,2),integer) For Day, the query item expression is: cast(substring([consolidation View].[CPU Usage - NT].[WRITETIME], 6, 2), integer) 3. Click OK. 4. In the Project Viewer, select ([Consolidation View].[CPU Usage - NT].[Year] and set the Usage field in the properties view to Attribute. Do the same for Month, Day and Hour 5. Create a folder called Dimensions under the Consolidation View. Click Next. Click Finish. 6. Under the Dimensions folder, create a Regular dimension called Time Dimension. Drag and drop Year, Month and Day from ([Consolidation View].[CPU Usage - NT] into the hierarchies section. a. Rename the first row to Period. 48


49 b. Under Hierarchies, select Year. In the levels section below, click on the Role button.. Under Default Roles tab, select _businesskey. 49
![Under the levels, add another level called Year Caption. And set the expression as follows: cast([consolidation View].](/docs-images/74/71379839/images/50-0.jpg "[CPU Usage - NT].[Year], char(4)) For the Role, select _membercaption. Add similar entries for Month and Day. Click OK.")
50 Under the levels, add another level called Year Caption. And set the expression as follows: cast([consolidation View].[CPU Usage - NT].[Year], char(4)) For the Role, select _membercaption. Add similar entries for Month and Day. Click OK. 50


51 7. Create a shortcut of Time Dimension and move it to the Presentation View 8. Publish the model. Ignore any Info messages. 9. Open Test Report in Report Studio. 10.Cut the Timestamp in the x-axis of the line chart and drop Period from Time Dimension. 11. For Hierarchy, choose Root members 51


52 12.Go to the Data menu and select Drill Behavior. 13.Select the Allow drill-up and drill-down option. 14.Click OK. 15.Run the report. 16.The output of the report will show the chart with average value for all years. When you drill down, it shows the years in x-axis, then month, and then days. If you choose hourly summarization, another layer of drill down will show you the hours. 52
53 53


54 Exercise 9 Export report package The purpose of the exercise: Learn how to export a report package. 1. Open Tivoli Integrated Portal console. Go to Common Reporting- >Reporting->Launch->Administration. In the Configuration tab, click Content Administration and then the New Export icon. 2. Enter Test Package as the export name and follow the New Export wizard. 3. In the Select the public folders content New Export wizard pane, scroll the section to the right and click Add. 4. Select Test Package and move it to the other set. Click OK. Now, select the checkbox for Test package and move on to the next panes. 54

55 5. Ensure an archive name is provided in the box. 6. When you complete the New Export wizard, click Finish, and then Run. 7. The archive file is in the following location: <TCR_HOME>\tipv2Components\TCRComponent\cognos\deployment For e.g., on Windows: C:\IBM\tivoli\tipv2Components\TCRComponent\cognos\deployment 55


56 Exercise 10 Import report package The purpose of the exercise: Learn how to import a report package into another instance of TCR. 1. Copy the report package (that was exported in the previous exercise) from the deployment folder of current TCR to the deployment folder of the new TCR. 2. Open Tivoli Integrated Portal console. Go to Common Reporting->Reporting- >Launch->Administration. In the Configuration tab, click Content Administration and then the New Import icon. 3. Choose Test Package 4. Click Next. 5. Provide name as Test Package. Click Next. 6. Select checkbox of Test Package. Click Next. 7. Click Next. Click Next. Click Finish. Click Run. Click OK. 8. Go back to Connection page from the Launch menu bar. The Test Package will be listed under the Public Folders. And all reports under it. 56
57 57
Tivoli Common Reporting V2.x. Reporting with Client s Time zone
 Tivoli Common Reporting V2.x Reporting with Client s Time zone Preethi C Mohan IBM India Ltd. India Software Labs, Bangalore +91 80 40255077 preethi.mohan@in.ibm.com Copyright IBM Corporation 2013 This
Tivoli Common Reporting V2.x. Training on Security Permissions
 Tivoli Common Reporting V2.x Training on Security Permissions Preethi C Mohan Bhanu P Velampati IBM India Ltd. India Software Labs, Bangalore preethi.mohan@in.ibm.com bhanu.prathap@in.ibm.com Copyright
Tivoli Common Reporting V Cognos report in a Tivoli Integrated Portal dashboard
 Tivoli Common Reporting V2.1.1 Cognos report in a Tivoli Integrated Portal dashboard Preethi C Mohan IBM India Ltd. India Software Labs, Bangalore +91 80 40255077 preethi.mohan@in.ibm.com Copyright IBM
COGNOS (R) ENTERPRISE BI SERIES COGNOS REPORTNET (TM)
 ENTERPRISE BI SERIES COGNOS REPORTNET (TM)") COGNOS (R) ENTERPRISE BI SERIES COGNOS REPORTNET (TM) GETTING STARTED Cognos ReportNet Getting Started 07-05-2004 Cognos ReportNet 1.1MR1 Type the text for the HTML TOC entry Type the text for the HTML
COGNOS (R) ENTERPRISE BI SERIES COGNOS REPORTNET (TM) GETTING STARTED Cognos ReportNet Getting Started 07-05-2004 Cognos ReportNet 1.1MR1 Type the text for the HTML TOC entry Type the text for the HTML
The following instructions cover how to edit an existing report in IBM Cognos Analytics.
 IBM Cognos Analytics Edit a Report The following instructions cover how to edit an existing report in IBM Cognos Analytics. Navigate to Cognos Cognos Analytics supports all browsers with the exception
Navigate to Cognos Cognos Analytics supports all browsers with the exception of Microsoft Edge.
 IBM Cognos Analytics Create a List The following instructions cover how to create a list report in IBM Cognos Analytics. A list is a report type in Cognos that displays a series of data columns listing
IBM Tivoli Composite Application Manager for Transactions V7.4 Cognos Reports README. Document Version 2.2 January 2014
 IBM Tivoli Composite Application Manager for Transactions V7.4 Cognos Reports README Document Version 2.2 January 2014 What s new This readme documentation describes how to run the ITCAM for Transactions
Query Studio Training Guide Cognos 8 February 2010 DRAFT. Arkansas Public School Computer Network 101 East Capitol, Suite 101 Little Rock, AR 72201
 Query Studio Training Guide Cognos 8 February 2010 DRAFT Arkansas Public School Computer Network 101 East Capitol, Suite 101 Little Rock, AR 72201 2 Table of Contents Accessing Cognos Query Studio... 5
Student Manual. Cognos Analytics
 Student Manual Cognos Analytics Join Queries in Cognos Analytics Reporting Cross-Join Error A join is a relationship between a field in one query and a field of the same data type in another query. If
Business Insight Authoring
 Business Insight Authoring Getting Started Guide ImageNow Version: 6.7.x Written by: Product Documentation, R&D Date: August 2016 2014 Perceptive Software. All rights reserved CaptureNow, ImageNow, Interact,
Navigate to Cognos Cognos Analytics supports all browsers with the exception of Microsoft Edge.
 IBM Cognos Analytics Create a Crosstab The following instructions cover how to create a crosstab report in IBM Cognos Analytics. A crosstab is a report type in Cognos that displays an analytical look at
OBIEE. Oracle Business Intelligence Enterprise Edition. Rensselaer Business Intelligence Finance Author Training
 OBIEE Oracle Business Intelligence Enterprise Edition Rensselaer Business Intelligence Finance Author Training TABLE OF CONTENTS INTRODUCTION... 1 USER INTERFACE... 1 HOW TO LAUNCH OBIEE... 1 TERMINOLOGY...
eschoolplus+ Cognos Query Studio Training Guide Version 2.4
 + Training Guide Version 2.4 May 2015 Arkansas Public School Computer Network This page was intentionally left blank Page 2 of 68 Table of Contents... 5 Accessing... 5 Working in Query Studio... 8 Query
Table of Contents Chapter 1: Getting Started System requirements and specifications Setting up an IBM Cognos portal Chapter 2: Roambi Publisher
 Table of Contents Chapter 1: Getting Started 7 Roambi workflow 7 System requirements and specifications 8 Supported versions of IBM Cognos 8 Single sign-on support 8 Setting up an IBM Cognos portal 8 Chapter
IBM Cognos Analytics: Author Reports Advanced (v11.0)
") Course Guide IBM Cognos Analytics: Author Reports Advanced (v11.0) Course code B6059 ERC 2.0 IBM Training Preface April, 2016 NOTICES This information was developed for products and services offered in
Course Guide IBM Cognos Analytics: Author Reports Advanced (v11.0) Course code B6059 ERC 2.0 IBM Training Preface April, 2016 NOTICES This information was developed for products and services offered in
OneStop Reporting 4.5 OSR Administration User Guide
 OneStop Reporting 4.5 OSR Administration User Guide Doc. Version 1.2 Updated: 10-Dec-14 Copyright OneStop Reporting AS Contents Introduction... 1 Who should read this manual... 1 What s included in this
OSR Administration 3.7 User Guide. Updated:
 OSR Administration 3.7 User Guide Updated: 2013-01-31 Copyright OneStop Reporting AS www.onestopreporting.com Table of Contents Introduction... 1 Who should read this manual... 1 What s included in this
OSR Composer 3.7 User Guide. Updated:
 OSR Composer 3.7 User Guide Updated: 2013-01-31 Copyright OneStop Reporting AS www.onestopreporting.com Table of Contents Introduction... 1 Who should read this manual... 1 What s included in this manual...
Using the IMS Universal Drivers and QMF to Access Your IMS Data Hands-on Lab
 Attendee Choice: IMS Hands-on Lab Thursday, August 13, 2015: 12:30 PM - 01:30 PM, Dolphin, Asia 5 #17765 Insert Custom Session QR if Desired Business Analytics on zenterprise The QMF 11 Product Family
Security Permissions in TCR 2.x
 Security Permissions in TCR 2.x Dan Krissell November 10, 2011 Contents Overview... 2 Authentication... 2 Authorization... 2 Where do I find my users and groups to assign access?... 3 How to implement
ZENworks Reporting System Reference. January 2017
 ZENworks Reporting System Reference January 2017 Legal Notices For information about legal notices, trademarks, disclaimers, warranties, export and other use restrictions, U.S. Government rights, patent
SAS Web Report Studio 3.1
 SAS Web Report Studio 3.1 User s Guide SAS Documentation The correct bibliographic citation for this manual is as follows: SAS Institute Inc. 2006. SAS Web Report Studio 3.1: User s Guide. Cary, NC: SAS
Getting Started Guide
 Getting Started Guide Sage MAS Intelligence 90/200 Table of Contents Getting Started Guide... 1 Login Properties... 1 Standard Reports Available... 2 Financial Report... 2 Financial Trend Analysis... 3
Policy Commander Console Guide - Published February, 2012
 Policy Commander Console Guide - Published February, 2012 This publication could include technical inaccuracies or typographical errors. Changes are periodically made to the information herein; these changes
Getting Started Guide. Sage MAS Intelligence 500
 Getting Started Guide Sage MAS Intelligence 500 Table of Contents Getting Started Guide... 1 Login Properties... 1 Standard Reports Available... 2 Financial Report... 2 Financial Trend Analysis... 3 Dashboard
Sage 500 ERP Business Intelligence
 Sage 500 ERP Business Intelligence Getting Started Guide Sage 500 Intelligence (7.4) Getting Started Guide The software described in this document is protected by copyright, And may not be copied on any
SAS Data Integration Studio 3.3. User s Guide
 SAS Data Integration Studio 3.3 User s Guide The correct bibliographic citation for this manual is as follows: SAS Institute Inc. 2006. SAS Data Integration Studio 3.3: User s Guide. Cary, NC: SAS Institute
4 BSM FOUNDATION BOOTCAMP
 Lab 4 BSM FOUNDATION BOOTCAMP BMC Analytics Using and Installing BMC Analytics Table of Contents Part I: Part II: Simple Report Creation Converting table to chart; switching the dimension. Part III: How
Doc. Version 1.0 Updated:
 OneStop Reporting Report Composer 3.5 User Guide Doc. Version 1.0 Updated: 2012-01-02 Table of Contents Introduction... 2 Who should read this manual... 2 What s included in this manual... 2 Symbols and
Reporting and Analysis Guide
 Reporting and Analysis Guide InForm TM ITM 4.6 SP3 Part number: DC-INF46-002-030 Copyright 1998-2011, Oracle and/or its affiliates. All rights reserved. The Programs (which include both the software and
ICL02: Security Analytics: Discover More in your Endpoint Protection Dashboard Hands-On Lab
 ICL02: Security Analytics: Discover More in your Endpoint Protection Dashboard Hands-On Lab Description In this lab you will learn how to install and create custom reports and dashboards using IT Analytics
Getting Started With the Cisco PAM Desktop Software
 CHAPTER 3 Getting Started With the Cisco PAM Desktop Software This chapter describes how to install the Cisco PAM desktop client software, log on to Cisco PAM, and begin configuring access control features
Instructor : Dr. Sunnie Chung. Independent Study Spring Pentaho. 1 P a g e
 ABSTRACT Pentaho Business Analytics from different data source, Analytics from csv/sql,create Star Schema Fact & Dimension Tables, kettle transformation for big data integration, MongoDB kettle Transformation,
Quick Start Guide. Version R94. English
 Custom Reports Quick Start Guide Version R94 English December 12, 2016 Copyright Agreement The purchase and use of all Software and Services is subject to the Agreement as defined in Kaseya s Click-Accept
Introduction to IBM Rational HATS For IBM System i (5250)
") Introduction to IBM Rational HATS For IBM System i (5250) Introduction to IBM Rational HATS 1 Lab instructions This lab teaches you how to use IBM Rational HATS to create a Web application capable of transforming
Introduction to IBM Rational HATS For IBM System i (5250) Introduction to IBM Rational HATS 1 Lab instructions This lab teaches you how to use IBM Rational HATS to create a Web application capable of transforming
SQL Server 2005: Reporting Services
 SQL Server 2005: Reporting Services Table of Contents SQL Server 2005: Reporting Services...3 Lab Setup...4 Exercise 1 Creating a Report Using the Wizard...5 Exercise 2 Creating a List Report...7 Exercise
CalPlan. Creating a Unit Plan Navigating CalPlan Workbook 1/25/18
 CalPlan Creating a Unit Plan Workbook 1/25/18 Table of Contents Exercise 1: Log into the Workspace & Run a CalPlan Report... 3 Exercise 2: Launching CalPlan and Setting Your Entity... 10 Exercise 3: Actualized
OnCommand Insight 6.3 Data Warehouse Custom Report Hands-on Lab Guide
 OnCommand Insight 6.3 Data Warehouse Custom Report Hands-on Lab Guide How to easily create adhoc and multi-tenancy reports in OnCommand Insight DWH using Business Insight Advanced Dave Collins, Technical
CCRS Quick Start Guide for Program Administrators. September Bank Handlowy w Warszawie S.A.
 CCRS Quick Start Guide for Program Administrators September 2017 www.citihandlowy.pl Bank Handlowy w Warszawie S.A. CitiManager Quick Start Guide for Program Administrators Table of Contents Table of Contents
Define the Slide Animation Direction on the deck control.
 IBM Cognos Report Studio: Author Active Reports allows students to build on their Report Studio experience by using active report controls to build highly interactive reports that can be consumed by users.
Akkadian Console 4.0
 Akkadian Console 4.0 User Guide Copyright and Trademarks: I. Copyright: This website and its content is copyright 2015 Akkadian Labs, LLC. All rights reserved. Except with the prior written permission
The software shall provide the necessary tools to allow a user to create a Dashboard based on the queries created.
 IWS BI Dashboard Template User Guide Introduction This document describes the features of the Dashboard Template application, and contains a manual the user can follow to use the application, connecting
Designing Adhoc Reports
 Designing Adhoc Reports Intellicus Web-based Reporting Suite Version 4.5 Enterprise Professional Smart Developer Smart Viewer Intellicus Technologies info@intellicus.com www.intellicus.com Copyright 2009
HP ALM Overview. Exercise Outline. Administration and Customization Lab Guide
 HP ALM 11.00 Administration and Customization Lab Guide Overview This Lab Guide contains the exercises for Administration and Customization of HP ALM 11 Essentials training. The labs are designed to enhance
Customizing and Administering Project Server Access
 WEB Customizing and Administering Project Server Access In this chapter Creating and Deleting Users from Project Server 2 Managing User Groups Project Server User Security 4 Using Categories to Control
Content Publisher User Guide
 Content Publisher User Guide Overview 1 Overview of the Content Management System 1 Table of Contents What's New in the Content Management System? 2 Anatomy of a Portal Page 3 Toggling Edit Controls 5
DASHBOARD PERFORMANCE INDICATOR DATABASE SYSTEM (PIDS) USER MANUAL LIBERIA STRATEGIC ANALYSIS TABLE OF CONTETABLE OF CONT. Version 1.
 USER MANUAL LIBERIA STRATEGIC ANALYSIS TABLE OF CONTETABLE OF CONT. Version 1.") UNITED STATES AGENCY FOR INTERNATIONAL DEVELOPMENT TABLE OF CONTETABLE OF CONT PERFORMANCE INDICATOR DATABASE SYSTEM (PIDS) LIBERIA STRATEGIC ANALYSIS DASHBOARD USER MANUAL Version 1.0 PERFORMANCE INDICATOR
UNITED STATES AGENCY FOR INTERNATIONAL DEVELOPMENT TABLE OF CONTETABLE OF CONT PERFORMANCE INDICATOR DATABASE SYSTEM (PIDS) LIBERIA STRATEGIC ANALYSIS DASHBOARD USER MANUAL Version 1.0 PERFORMANCE INDICATOR
PHPRad. PHPRad At a Glance. This tutorial will show you basic functionalities in PHPRad and
 PHPRad PHPRad At a Glance. This tutorial will show you basic functionalities in PHPRad and Getting Started Creating New Project To create new Project. Just click on the button. Fill In Project properties
Importing source database objects from a database
 Importing source database objects from a database We are now at the point where we can finally import our source database objects, source database objects. We ll walk through the process of importing from
COGNOS BI I) BI introduction Products Introduction Architecture Workflows
 BI introduction Products Introduction Architecture Workflows") COGNOS BI I) BI introduction Products Architecture Workflows II) Working with Framework Manager (Modeling Tool): Architecture Flow charts Creating Project Creating Data Sources Preparing Relational Metadata
COGNOS BI I) BI introduction Products Architecture Workflows II) Working with Framework Manager (Modeling Tool): Architecture Flow charts Creating Project Creating Data Sources Preparing Relational Metadata
IBM WebSphere Lombardi Edition 7.2 Business Process Management Workshop
 IBM IBM WebSphere Lombardi Edition 7.2 Business Process Management Workshop Lab Exercises Contents LAB 1 BUILD-FROM-SCRATCH LAB - PART 1... 4 1.1 START LOMBARDI AUTHORING ENVIRONMENT... 4 1.1.1 START THE
SURVEYOR/400. Users Guide. Copyright , LINOMA SOFTWARE LINOMA SOFTWARE is a division of LINOMA GROUP, Inc.
 SURVEYOR/400 Users Guide Copyright 1996-2013, LINOMA SOFTWARE LINOMA SOFTWARE is a division of LINOMA GROUP, Inc. Surveyor/400 version: 4.0.0 Publication date: August 7 th, 2013 Table of Contents SURVEYOR/400
Table of Contents. Table of Contents
 Powered by 1 Table of Contents Table of Contents Dashboard for Windows... 4 Dashboard Designer... 5 Creating Dashboards... 5 Printing and Exporting... 5 Dashboard Items... 5 UI Elements... 5 Providing
Integrating SMA data with SPSS Modeler and Cognos BI
 Integrating SMA data with SPSS Modeler and Cognos BI Subtitle: Accessing SMA data from SPSS Modeler. Creating custom Cognos reports on top of SMA data. Combining SMA data with internal customer data Keywords:
Display No Data Content for RAVE visualizations used in IBM Cognos Report Studio
 Tip or Technique Display No Data Content for RAVE visualizations used in IBM Cognos Product(s): IBM Cognos 10.2.2 Area of Interest: Reporting 2 Display No Data Content for RAVE visualizations used in IBM
Create Your First Print-Quality Reports
 Create Your First Print-Quality Reports This document supports Pentaho Business Analytics Suite 5.0 GA and Pentaho Data Integration 5.0 GA, documentation revision August 28, 2013, copyright 2013 Pentaho
Business Insight. Best Practices. Version: 7.0.x
 Business Insight Best Practices Version: 7.0.x Written by: Product Knowledge, R&D Date: August 2016 2015 Perceptive Software. All rights reserved. Lexmark and Perceptive Software are trademarks of Lexmark
Lesson 1: Creating and formatting an Answers analysis
 Lesson 1: Creating and formatting an Answers analysis Answers is the ad-hoc query environment in the OBIEE suite. It is in Answers that you create and format analyses to help analyze business results.
Nintex Reporting 2008 Help
 Nintex Reporting 2008 Help Last updated: Thursday, 24 December 2009 1 Using Nintex Reporting 2008 1.1 Chart Viewer Web Part 1.2 Importing and Exporting Reports 1.3 Import Nintex report page 1.4 Item Level
University of Rochester
 University of Rochester User s Guide to URGEMS Ad- Hoc Reporting Guide Using IBM Cognos Workspace Advanced, Version 10.2.1 Version 1.0 April, 2016 Updated 12/16/16 1 P age Table of Contents University
SQream Dashboard Version SQream Technologies
 SQream Dashboard Version 1.1.0 SQream Technologies 2018-11-06 Table of Contents Overview................................................................................... 1 1. The SQream Dashboard...................................................................
Reporting and Analysis Guide
 Reporting and Analysis Guide Oracle Health Sciences InForm 6.0.1 Part number: E56923-01 Copyright 2012-2014, Oracle and/or its affiliates. All rights reserved. This software and related documentation are
Contents. Common Site Operations. Home actions. Using SharePoint
 This is a companion document to About Share-Point. That document describes the features of a SharePoint website in as much detail as possible with an emphasis on the relationships between features. This
EDITING AN EXISTING REPORT
 Report Writing in NMU Cognos Administrative Reporting 1 This guide assumes that you have had basic report writing training for Cognos. It is simple guide for the new upgrade. Basic usage of report running
INSTITUTE BUSINESS SYSTEMS IMSS COGNOS REPORT STUDIO GUIDE
 INSTITUTE BUSINESS SYSTEMS IMSS COGNOS REPORT STUDIO GUIDE Table of Contents Logging into Cognos... 3 Viewing Summary Information... 6 Running a Report... 6 Rerunning a Report... 9 Comparing Summary Information...
Configuring External Links in Visual Discovery AE
 Copyright 2014 WebFOCUS Release 8.0 Version 08 July 2014 Technical Memo Information Builders Two Penn Plaza New York, NY 10121-2898 (212) 736-4433 TM4742 Configuring External Links in Visual Discovery
COGNOS User-Defined Prompts and Maps User Guide
 COGNOS User-Defined Prompts and Maps User Guide Introduction This user guide will walk you through the steps of creating a user-defined prompt and maps in Cognos. The package we are using for this user
Reporting and Analysis Guide
 Reporting and Analysis Guide Oracle Health Sciences InForm 6.1 Part number: E51802-01 Copyright 2014, Oracle and/or its affiliates. All rights reserved. The Programs (which include both the software and
Hyperion Interactive Reporting Reports & Dashboards Essentials
 Oracle University Contact Us: +27 (0)11 319-4111 Hyperion Interactive Reporting 11.1.1 Reports & Dashboards Essentials Duration: 5 Days What you will learn The first part of this course focuses on two
ScholarOne Manuscripts. COGNOS Reports User Guide
 ScholarOne Manuscripts COGNOS Reports User Guide 1-May-2018 Clarivate Analytics ScholarOne Manuscripts COGNOS Reports User Guide Page i TABLE OF CONTENTS USE GET HELP NOW & FAQS... 1 SYSTEM REQUIREMENTS...
Maximo 76 Cognos Dimensions
 IBM Tivoli Software Maximo Asset Management Version 7.6 Releases Maximo 76 Cognos Dimensions Application Example Pam Denny Maximo Report Designer/Architect CONTENTS Revision History... iii 1 Overview...
edev Technologies integreat4tfs 2015 Update 2 Release Notes
 edev Technologies integreat4tfs 2015 Update 2 Release Notes edev Technologies 11/18/2015 Table of Contents 1. INTRODUCTION... 2 2. SYSTEM REQUIREMENTS... 3 3. APPLICATION SETUP... 3 DASHBOARD... 4 1. FEATURES...
SAS. Information Map Studio 3.1: Creating Your First Information Map
 SAS Information Map Studio 3.1: Creating Your First Information Map The correct bibliographic citation for this manual is as follows: SAS Institute Inc. 2006. SAS Information Map Studio 3.1: Creating Your
SURVEYOR/400. Users Guide. Copyright , LINOMA SOFTWARE LINOMA SOFTWARE is a division of LINOMA GROUP, Inc.
 SURVEYOR/400 Users Guide Copyright 1996-2013, LINOMA SOFTWARE LINOMA SOFTWARE is a division of LINOMA GROUP, Inc. Surveyor/400 version: 4.0.0 Publication date: August 7 th, 2013 Table of Contents SURVEYOR/400
Introduction to Cognos
 Introduction to Cognos User Handbook 7800 E Orchard Road, Suite 280 Greenwood Village, CO 80111 Table of Contents... 3 Logging In To the Portal... 3 Understanding IBM Cognos Connection... 4 The IBM Cognos
Enterprise Portal Train the Trainer User Manual WEB PARTS
 Enterprise Portal Train the Trainer User Manual WEB PARTS Version 1.2.1 Date: January 31, 2012 Table of Contents Table of Contents... 2 1 I Need To... 3 2 Media Web Part... 10 3 Content Editor... 15 4
Admissions & Intro to Report Editing Participants Guide
 IBM Cognos Analytics Admissions & Intro to Report Editing Participants Guide Welcome to Cognos - Admissions and Introduction to Report Editing! Today s objectives include: Gain a Basic Understanding of
Using the IMS Universal Drivers and QMF to Access Your IMS Data Hands-on Lab
 Using the IMS Universal Drivers and QMF to Access Your IMS Data Hands-on Lab 1 Overview QMF for Workstation is an Eclipse-based, rich client desktop Java application, that uses JDBC to connect to data
How to make a power point presentation. Dr. Mohamed F. Foda
 How to make a power point presentation Dr. Mohamed F. Foda Step 1: Launch the PowerPoint Program When you launch the PowerPoint program, you may be prompted to pick what kind of document you want to create.
Cognos Analytics Reporting User Interface
 September 12, 2017 (v12.2.2 - BI v11) Cognos Analytics Reporting User Interface Business Intelligence Cognos Analytics Reporting Cognos Analytics Reporting is a Web-based tool used to create ad-hoc reports
Preview and Print Reports. Preview and Print Reports (for MAS Users) Participant Profile. Learning Outcomes
 Participant Profile. Learning Outcomes") Preview and Print Reports Preview and Print Reports (for MAS Users) This document includes a copy of the concepts and procedures that form the basis of this selfpaced online learning module. As you work
Preview and Print Reports Preview and Print Reports (for MAS Users) This document includes a copy of the concepts and procedures that form the basis of this selfpaced online learning module. As you work
COGNOS (R) 8 FRAMEWORK MANAGER USER GUIDE. Framework Manager User Guide Framework Manager 8.1
 8 FRAMEWORK MANAGER USER GUIDE. Framework Manager User Guide Framework Manager 8.1") COGNOS (R) 8 FRAMEWORK MANAGER USER GUIDE Framework Manager User Guide 01-08-2005 Framework Manager 8.1 Cognos(R) 8 Business Intelligence Readme Framework Manager User Guide USER GUIDE THE NEXT LEVEL OF
COGNOS (R) 8 FRAMEWORK MANAGER USER GUIDE Framework Manager User Guide 01-08-2005 Framework Manager 8.1 Cognos(R) 8 Business Intelligence Readme Framework Manager User Guide USER GUIDE THE NEXT LEVEL OF
Doc. Version 1.0 Updated:
 OneStop Reporting Report Designer/Player 3.5 User Guide Doc. Version 1.0 Updated: 2012-01-02 Table of Contents Introduction... 3 Who should read this manual... 3 What s included in this manual... 3 Symbols
Welcome to the JReport Tutorial
 Next Page Welcome to the JReport Tutorial Thank you for your interest in JReport, the leading Embedded Reporting Solution for Java Applications. With JReport, intuitive and sophisticated reporting can
Kaseya 2. User Guide. Version 7.0. English
 Kaseya 2 Custom Reports User Guide Version 7.0 English September 3, 2014 Agreement The purchase and use of all Software and Services is subject to the Agreement as defined in Kaseya s Click-Accept EULATOS
Introduction to Eclipse Rich Client Platform Support in IBM Rational HATS. For IBM System i (5250)
") Introduction to Eclipse Rich Client Platform Support in IBM Rational HATS For IBM System i (5250) 1 Lab instructions This lab teaches you how to use IBM Rational HATS to create a rich client plug-in application
Introduction to Eclipse Rich Client Platform Support in IBM Rational HATS For IBM System i (5250) 1 Lab instructions This lab teaches you how to use IBM Rational HATS to create a rich client plug-in application
How to import a WSDL Data Source and Prepare it for Use in Framework Manager
 Tip or Technique How to import a WSDL Data Source and Prepare it for Use in Framework Manager Product(s): Composite Software 4.5.0 Area of Interest: Infrastructure Manager 2 Copyright Copyright 2008 Cognos
Working with Actions Stratum.Viewer 6
 Working with Actions Stratum.Viewer 6 Getting Started Access to Actions Accessing Actions Functionality Introduction to Actions Quick Start Set up an Action Tasks Add an Email Action Add a File Share Action
IBM Cognos Open Mic Cognos Analytics 11 Part 1. 1 st Jun, IBM Corporation
 IBM Cognos Open Mic Cognos Analytics 11 Part 1 1 st Jun, 2016 IBM Cognos Open MIC Team Chakravarthi Mannava Presenter Subhash Kothari Technical Panel Member Deepak Giri Technical Panel Member 2 Agenda
Lab 11-1 Lab User Profiles and Tracking
 In the following lab instructions, you will be setting up groups, users, and passwords to require password-protected login to Kofax Capture modules. Rights will be assigned to the groups and users that
Application Note Creating a Composite Report For Managed Hosts 12-Oct-2016 Revision 1.0 Compiled by: Larry Balon
 Application Note Creating a Composite Report For Managed Hosts 12-Oct-2016 Revision 1.0 Compiled by: Larry Balon entuity.com info@entuity.com Table of Contents 1.0 Purpose... 3 2.0 Device Sub-Report...
Introduction to Eclipse Rich Client Platform Support in IBM Rational HATS For IBM System i (5250)
") Introduction to Eclipse Rich Client Platform Support in IBM Rational HATS For IBM System i (5250) Introduction to Eclipse Rich Client Platform Support in IBM Rational HATS 1 Lab instructions This lab teaches
Introduction to Eclipse Rich Client Platform Support in IBM Rational HATS For IBM System i (5250) Introduction to Eclipse Rich Client Platform Support in IBM Rational HATS 1 Lab instructions This lab teaches
Introducing Gupta Report Builder
 Business Reporting Chapter 1 Introducing Gupta Report Builder You can use Report Builder to design reports. This chapter describes: Our approach to building reports. Some of the reports you can build.
FLIR Tools+ and Report Studio
 Creating and Processing Word Templates http://www.infraredtraining.com 09-20-2017 2017, Infrared Training Center. 1 FLIR Report Studio Overview Report Studio is a Microsoft Word Reporting module that is
Join Queries in Cognos Analytics Reporting
 Join Queries in Cognos Analytics Reporting Business Intelligence Cross-Join Error A join is a relationship between a field in one query and a field of the same data type in another query. If a report includes
Reading Sample. Creating New Documents and Queries Creating a Report in Web Intelligence Contents. Index. The Authors
 First-hand knowledge. Reading Sample In this sample chapter, you l l start in Chapter 2 by creating your first document and query in SAP BusinessObjects BI. In this process, we ll explore the query panel,
Module 4: Creating Content Lesson 5: Creating Visualizations Try Now!
 Module 4: Creating Content Lesson 5: Creating Visualizations Try Now! In this Try Now! exercise, you will be creating a visualization in your Sales domain, based on the data you uploaded from your Microsoft
How to Export a Report in Cognos Analytics
 IBM Cognos Analytics How to Export a Report in Cognos Analytics Reports viewed in IBM Cognos Analytics can be exported in many formats including Excel. Some of the steps for exporting are different depending
SQL Server. Management Studio. Chapter 3. In This Chapter. Management Studio. c Introduction to SQL Server
 Chapter 3 SQL Server Management Studio In This Chapter c Introduction to SQL Server Management Studio c Using SQL Server Management Studio with the Database Engine c Authoring Activities Using SQL Server
Crystal Reports Compiled by Christopher Dairion
 Crystal Reports Compiled by Christopher Dairion Not for customer distribution! When you install Crystal Reports 9, the Excel and Access Add-In are added automatically. A Crystal Report Wizard 9 menu option