VarioAnalyze. User Manual. JENOPTIK Group.
|
|
|
- Lynette Wilkerson
- 6 years ago
- Views:
Transcription
1 VarioAnalyze User Manual JENOPTIK Group.
2 Dear User Dear User You should carefully read these instructions before you start operating the VarioAnalyze Software. Editorial deadline: October 2005 Document number: (english) JENOPTIK Laser, Optik, Systeme GmbH Göschwitzer Straße 25 D Jena Germany Phone: Fax: infraredtechnology@jenoptik.com CE Note: No part of this User Manual may be reproduced in any form (print, photocopy, microfilm or any other process), nor may it be processed, duplicated or distributed using electronic systems without the written permission of JENOPTIK Laser, Optik, Systeme GmbH. This document was produced with appropriate care. No liability will be accepted in the case of damages arising from non-observance of the information contained herein. We reserve the right to modify this document following technical advancements.
3 Content Content 1 Instructions for using this manual 7 2 Application field of VarioAnalyze 9 3 Supplied items and system requirements 11 4 Installation 13 5 Starting and ending the program Starting the program Structure of the software user interface VarioAnalyze Explorer window VarioAnalyze Analysis window End program 17 6 VarioAnalyze Explorer window Structure and function Toolbar in the VarioAnalyze Explorer window Menu description in the Explorer window File menu New root Save Save as Send New folder Previous folder Refresh directories Print Print preview Print Setup Exit Edit menu Image sequence Change comment View menu Settings Toolbar 29
4 Content Status bar Help menu Help About VarioAnalyze 30 7 VarioAnalyze Analysis window Structure and function of Analysis window Toolbar in the Analysis window Menu description in the Analysis window File menu Open Save Save as Print Print preview Print Setup Exit Edit menu Undo Copy Copy selection Copy measurement results Copy measurement results ASCII Copy to report Set selection Mirror Rotate Filter Change comment View menu Show measurement results Show temperature scale Profile Comment Parameters Visible image Toolbar 50 4
5 Content Status bar Thermogram menu Limits Units Grid settings Temperature Matrix Isotherms Point Line Rect Circle Ellipse Polygon Next Previous Measure menu Measurement results Correction menu Definition Extras menu Options Arrange icons Report menu Create new report Open existing report Help menu Help About VarioAnalyze Direct access with right mouse click Thermogram: Edit shapes Change limits and color palette Save, print, export thermograms 74 8 Create report: Report window Structure and function of the Report window Edit report fields 77 5
6 Content Changing the properties of a report field and importing images Menu description in the Report window File menu Open Save Save as Save template as Send Print preview Print Exit Edit menu Copy the page Add page Delete page View menu Next page Previous page Change the template 82 9 General procedure for image evaluation Service and support 85 6
7 Instructions for using this manual 1 Instructions for using this manual In this manual, the following linguistic and typographic synonyms and rules are used: Click Right click Click with the left mouse button Click with the right mouse button [OK] Identifies a button in a software window [x] Means the small cross in the top right corner of each window (close window) - Menu Submenu 1 Submenu 2 - Marks a path through the menus; you follow it using either the mouse pointer or the arrow keys on the keyboard Edit correction definitions shapename Window name. Instead of the expression in italics, the actual name taken from your image in the example, the shape name appears in the window. 7
8 Instructions for using this manual 8
9 Application field of VarioAnalyze 2 Application field of VarioAnalyze The VarioAnalyze software is used to manage, analyze and evaluate infrared images (thermograms). In particular, it is used for convenient analysis of thermograms which were taken using JENOPTIK thermal cameras. 9
10 Application field of VarioAnalyze 10
11 Supplied items and system requirements 3 Supplied items and system requirements The following are supplied: CD-ROM with software for Windows operating systems as executable file User manual The following are system requirements for installation and use of the software: Operating system Windows 2000, Windows XP Free hard disk space Minimum 512 MB RAM Minimum 256 MB, 512 MB or more recommended Processor clock frequency 1 GHz or higher Graphics card Windows 2000 or Windows XP compatible Minimum 16-bit color depth (true color) Screen resolution Minimum 1024 x 768 pixels, 1280 x 1024 pixels or higher recommended 11
12 Supplied items and system prerequisites 12
13 Installation 4 Installation To install the software directly from the data medium: 1. Insert the CD-ROM into the CD-ROM drive of the PC. 2. To install the English version: Double click on the file varioanalyze_engl.exe; to install the Japanese version: Double click on the file varioanalyze_jpn.exe; to install the Spanish version: Double click on the file varioanalyze_spn.exe. 3. Click on [OK] to confirm that you want to continue with the installation of VarioAnalyze. > Program installation is started. 4. If required, select the desired program folder. > The software is installed in full. > After installation, the program folder contains, among other things, the files varioanalyze.exe, varioanalyzemess.exe, varioanalyze.hlp, varioanalyzemess.hlp and the subdirectories Colors, Images and Doc. The Colors directory contains the color palette files. The Images directory contains example images. > The VarioAnalyze program icon is installed on the desktop if this option was chosen. > The installation routine reports that installation is complete. The program can now be used. 13
14 Installation 14
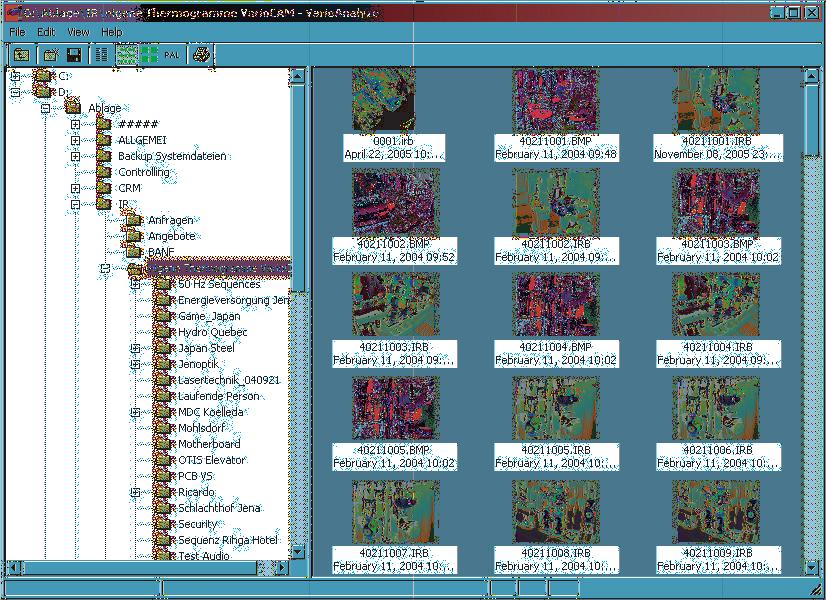
15 Starting and ending the progam 5 Starting and ending the program 5.1 Starting the program 1. Start VarioAnalyze by double-clicking with the left mouse button on the VarioAnalyze icon on your desktop, or select the program in the Windows start menu (e.g. - Start All programs VarioAnalyze - ). > The Select root window opens. 2. In the Select root window, select the path to the desired image directory, e.g. directory - thermograms -, and click on [open]. > The Explorer window of the software opens. See the following section 5.2 Structure of the software user interface. Depending on the number of drives which are connected to the computer and the number of existing directories and subdirectories, opening the Explorer window can take a few seconds. 5.2 Structure of the software user interface The VarioAnalyze user interface consists of two separate windows which remain open simultaneously: Explorer window to select directories and to display and select preview images (Fig. 5-1) Analysis window to analyze thermal images and produce analysis reports (Fig. 5-2) Switching from the open Explorer window to the open Analysis window and vice versa is possible, e.g. using the Windows standard key combination (Alt + Tab). 15
16 Starting and ending the program VarioAnalyze Explorer window Fig. 5-1 Explorer window From the Explorer window, you can open the desired IR image directly: Double click on the preview image in the righthand part of the window to show the image in the Analysis window. For a description of the Explorer window, see Chapter 6 VarioAnalyze Explorer window VarioAnalyze Analysis window Fig. 5-2 Analysis window For a description of the Analysis window, see Chapter 7 VarioAnalyze Analysis window. 16
17 Starting and ending the program 5.3 End program 1. Select in succession, in the Explorer window and Analysis window: - File Exit - or close the current window by clicking on [x]. > VarioAnalyze is ended. If required, you have the opportunity to save data which has not been stored until now. 17
18 Starting and ending the program 18
19 VarioAnalyze Explorer window 6 VarioAnalyze Explorer window 6.1 Structure and function In Explorer window Select the directory in which the IR images to be analyzed are stored If thumbnails (preview images) of the images which are stored in the current directory are displayed, open the desired IR image in the Analysis window by double-clicking on the preview image. Fig Menu and icon bars 2 Directory tree 3 Preview image VarioAnalyze Explorer window Menu and icon bar For a description of the menus, see Section 6.3 Menu description in the Explorer window. For a description of the icons, see Section 6.2 Toolbar in the VarioAnalyze Explorer window. 19
20 VarioAnalyze Explorer window Directory tree In the left-hand window area (directory tree), change the directory as for Windows Explorer, by marking the desired folder. Preview area In a similar way to Windows Explorer, in the Preview area information about the objects which are held in the current directory (images in the.irb,.bmp und.pcx formats) is displayed. Display options in the Preview area: Text list (No preview images / only text) Small preview images Large preview images Double click with the left mouse button on the preview image to open IRB files in the Analysis window. The other formats (.bmp,.pcx) are displayed only as preview image, and cannot be opened in the Analysis window. Right click on a marked image to open a flyout menu with the options Print Print the selected image; opens the print preview window (see Section Print preview ) Save as Save IRB files (see Section Save as ) 20
21 VarioAnalyze Explorer window 6.2 Toolbar in the VarioAnalyze Explorer window The icons in the toolbar are used to operate the software quickly using the mouse. The functions which they represent can also be reached via the menus of the VarioAnalyze Explorer window. In the menu description of the Explorer window, you will find the icon corresponding to each menu item. Change the shown directory to the next higher level Create a new folder Save as... Stores the selected thermogram in a freely selectable directory. VarioAnalyze displays the Save As dialog window. See Section File menu. No preview images On the right side of the VarioAnalyze Explorer screen the thermograms will just get shown with their filename, date, file type, camera type and pixel resolution in a list form. No preview images are shown. See Section View menu. Small preview images Small thumbnails (80x60 pixels) are displayed in the Preview area. See Section View menu. Large preview images Large thumbnails (160x120 pixels) are displayed in the Preview area. See Section View menu. 21
22 VarioAnalyze Explorer window Next palette Change color palette for the preview display (toggle key). The following palettes are used in a loop in this sequence: from IRB VARIOCAM BlackWhite IronBow BlueRed MrkedBW Rainbow. For an explanation of the palettes, see Section Settings. Print preview Print the marked image in the Preview area. VarioAnalyze opens a print preview window after again confirming the Windows print window. See Print preview. For displaying or hiding the toolbar, see Section Toolbar. 6.3 Menu description in the Explorer window File menu The File menu has the following options: New root Save Save as Send New folder Previous folder Refresh directories Print Print preview Print Setup Exit 22
23 VarioAnalyze Explorer window New root Select a new directory which is to be displayed, the next time the software starts, as the default directory for thermograms. > The Select root window opens. Fig. 6-2 Select root window The usual procedure for Windows: Select path and click on [open]. > The displays in the Directory area and Preview area are updated Save Store the current image under the same name and in the same directory. The existing file is overwritten Save as Store the current IRB image under a new name, in a different format and/or under another path. > The Save as window opens. In the Save as window: 1. Enter the filename and path 23
24 VarioAnalyze Explorer window Send Send selected image by . > Opens the client and attaches the file to a new . To send it, see your documentation for using your program New folder Create new folder in Explorer (Directory area) Previous folder Change to the higher-level folder Refresh directories Print 2. Click on [Save] > The file is saved. > The display in the Preview area is updated only after the Refresh directories function has been executed, see Section Refresh directories. Update the displays in the Directory and Preview areas. Print the marked image in the Preview area. > The Windows print window is opened. In the Windows print window: 1. Select printer and make settings for the selected printer 2. Click on [OK] > The image is printed. 24
25 VarioAnalyze Explorer window Print preview Print the marked image in the Preview area. > A Print Preview window is opened. Fig. 6-3 Print preview for printing from the VarioAnalyze Explorer window As well as the image content, the following file information is included in the print view: Path and filename Date Which camera was used, format (breadth and height in number of pixels) 25
26 VarioAnalyze Explorer window Function buttons in the Print Preview window [Print] Start printing [Zoom In] Zoom into image (enlarge representation) [Zoom Out] Zoom out of image (reduce representation) [Close] Close print preview To print the image: 1. Click on [Print] > The Windows print window opens. 2. Select printer, make settings for paper size, orientation, color options, etc. 3. Click on [OK] > The image is printed Print Setup Select the printer and printer connection for VarioAnalyze. Define printer settings. > The Windows print window is opened. In the Windows print window: 1. Select printer, make settings for selected printer, e.g. paper size, orientation, color options etc. 2. Click on [OK] > The settings are accepted as default settings for VarioAnalyze and called up at every start of the print function Exit End VarioAnalyze Explorer. 26
27 VarioAnalyze Explorer window Edit menu The Edit menu has the following options: Image sequence Change comment The functions of the Edit menu are available only if the Preview area is active (click with left mouse button in the Preview area) or if one or more images are marked there Image sequence Function to show only the selected (marked) images. 1. Mark desired images in Preview area with [Shift] + click or [Ctrl] + click. 2. Select menu - Edit Image sequence - > Only the selected images are displayed in the Preview area Change comment Change the image comment for the selected IRB image. The image comment can be displayed in the Analysis window, see Section Change comment. 27
28 VarioAnalyze Explorer window View menu The View menu has the following options: Settings Toolbar Status bar Settings Select properties for the display in the Explorer window. Palette for IRB Select color palette for the Preview display. The following palettes can be selected: from IRB Representation of the IR image in the color palette which is encoded in the IRB file. IRB is the color palette with which the thermogram was originally taken by the camera. VARIOCAM Representation in the color palette of the VarioCam BlackWhite Gray scale representation IronBow Color palette in the tempering colors of steel BlueRed Color palette from blue (low temperatures) to red (high temperatures) MrkedBW Marked Black-White: Color palette in gray scale representation with color marking of high temperatures (red) and low temperatures (blue) Rainbow Color palette in the colors of the rainbow Further options: Next Display in the next color palette of the list 28
29 VarioAnalyze Explorer window Invers Inverts the representation in the current color palette Thumbnails Select representation (of the thermograms in the selected directory) in the Preview area. The following options are possible: text only: Thermograms will get shown with their filename, date, file type, camera type and pixel resolution in a list form. No preview images are shown. small: display small Preview images. large: display large Preview images. Sort by Toolbar Sort the display in the Preview window. Possible sort criteria: Filename Filename, reverse File type File type, reverse Time upward Time downward Display or hide VarioAnalyze Explorer toolbar. For a description of the icons of the toolbar, see Section 6.2 Toolbar in the VarioAnalyze Explorer window Status bar Display/hide VarioAnalyze Explorer status bar. 29
30 VarioAnalyze Explorer window A check mark before the menu bar indicates whether the status bar is displayed. The status bar displays information in 5 fields of different sizes from left to right: Field 1 Description of the menu function which is currently marked if you move the cursor through the menus using the arrow keys of the keyboard If available, a description of the function of the printed icon in the toolbar If an image is marked (selected) in the Preview area, the associated filename. Field 2 Date and time most recently marked image was taken. The information remains even if another directory has already been opened in the directory tree. Fields 3 to 5 CAP NUM SCRL Caps lock key is pressed. Num lock key is pressed. Scroll lock key is pressed Help menu The Help menu has the following options: Help About VarioAnalyze Help Call up Help file About VarioAnalyze Display copyright and version information. 30
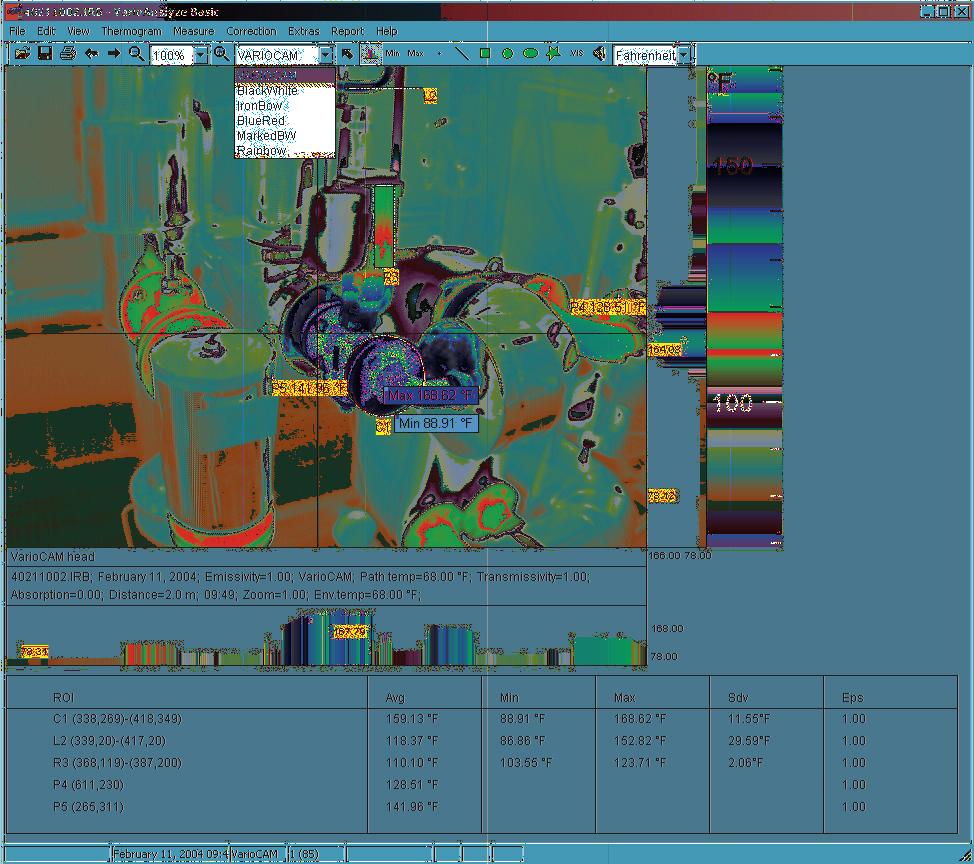
31 7 VarioAnalyze Analysis window 7.1 Structure and function of Analysis window The Analysis window Allows investigation of the open thermal image and displays its properties Makes it possible to produce, edit and print analysis reports. Fig Menu and icon bar 2 Open image 3 Shapes (ellipse, rectangle) 4 Comment bar and parameter bar 5 Temperature profile 6 Temperature scale 7 Table of measurement results VarioAnalyze Analysis window 31
32 From the Analysis window, depending on the selected function, other windows are opened as required (e.g. Report window). Menu and icon bar For a description of the menus, see Section 7.3 Menu description in the Analysis window. For a description of the icons, see section 7.2 Toolbar in the Analysis window. Image display Thermal image representation in selected color mode and with current temperature profiles Right click in the image to open a flyout menu with the options Save As Store the image as a new file (e.g. in IRB, JPG, BMP, ASC formats; see Section Save as ) Copy Copy the current window content to the Clipboard. It is then possible to insert it into other application programs. Print Print the current image; opens the Windows print window (see Section Print ) Shapes (ROIs) Regions-of-interest (ROI = shape) which are drawn in for evaluation of an image. For each shape, the measurement results are listed in a table below the image, see Item 7 in this figure. 32
33 Comment bar and parameter bar Top line: displays the comment which is stored in the image. For displaying or hiding the comment bar, see Section View menu. Bottom line: displays image parameters. For displaying or hiding the command bar, see Section View menu. Temperature profile Displays the vertical and horizontal temperature profile for the axes of the crosshair pointer. The crosshair pointer appears, and its position can be set, if the Profile function has been called. See Section View menu. Temperature scale Displays the temperature scale in the colors of the current color scale. For displaying or hiding the temperature scale, see Section Show temperature scale. Right click on the scale to open a window to edit the scale limits and color palette, see also Section Limits. Table of measurement results Displays the measurement results if shapes (shapes = ROIs = regions-of-interest) are drawn into the IR image. ROI Name and coordinates, see Section Thermogram menu Avg Average temperature Min Minimum Max Maximum Sdv Standard deviation Eps Emissivity 33
34 To correct/edit the measured values: Click on the table with the right mouse button > A separate window with the table of measured values opens. In this window, it is possible to save, load and delete shapes and change correction values (globally / for individual shapes). See Section Measure menu. 34
35 7.2 Toolbar in the Analysis window Icons The icons are used to operate the software quickly using the mouse. The functions which they represent can also be reached via the menus of the Analysis window. In the menu description of the Analysis window, you will find the icon corresponding to each menu item. Open Open new IRB file. VarioAnalyze displays the Open Windows dialog window. See Section Open. Save as... Store the current IRB image. VarioAnalyze displays the Save As dialog window. See Section Save as. Print preview Print current view of open image. VarioAnalyze opens a print preview window after again confirming the Windows print window. See Section Print preview. Previous image Opens the previous IRB image which is stored in the same directory (paging through a sequence). See Section Previous. Next image Opens the next IRB image which is stored in the same directory (paging through a sequence). See Section Next. Zoom- Display next smaller representation (zoom out) Zoom+ Display next larger representation (zoom in) 35
36 Set the selection Set the selection window. See Section Set selection. Profile Display vertical and horizontal temperature profile (for the axes of the crosshair pointer which appears), see also Section Profile. Minimum Display minimum temperature in image Maximum Display maximum temperature in image Point Set temperature measuring point. A shape in the form of a point can be set anywhere in the image. Line Set temperature measuring line. A shape in the form of a line can be set anywhere in the image. Rect Rectangle: Set rectangular temperature measuring area. A shape in the form of a rectangle can be set anywhere in the image. Circle Set circular temperature measuring area. A shape in the form of a circle can be set anywhere in the image. Ellipse Set elliptical temperature measuring area. A shape in the form of an ellipse can be set anywhere in the image. 36
37 Polygon Set temperature measuring area of arbitrary form. A shape of arbitrary form can be set anywhere in the image. The outline of the shape is generated by clicking on the desired positions. The drawing of the polygon is ended by a double click or right click on the starting point. Show VIS Shows the digital photo (visible image) of the current IR image in a separate window (see also Section Visible image ). Play audio Plays the audio information for the image (available only if an audio recording exists). Combo boxes The following combo boxes are integrated into the toolbar of the Analysis window: Set zoom Select enlargement of the display Change palette Select color palette, see Section Limits. Temperature unit Select unit for the temperature display, see Section Units. 37
38 7.3 Menu description in the Analysis window File menu Open Save Save as The File menu has the following options: Open Save Save as Print Print preview Print setup Exit Open an existing IRB image in the Analysis window. Store the current image under the same name and in the same directory. The existing file is overwritten. Save the current IRB image under a new name, in a different format (e.g. JPG, BMP, ASC) and/or under a different path. > The Save as window opens. In the Save as window: 1. Enter the filename and path 2. Click on [Save] > The file is saved. > The display in the Preview area of the Explorer window is updated only after the Refresh directories function has been executed, see Section Refresh directories. 38
39 Print Print the current image. > The Windows print window opens. Alternatively, you can reach this function by clicking on the thermogram with the right mouse button and choosing Print in the flyout menu. In the Windows print window: 1. Select printer and make settings for the selected printer 2. Click on [OK] > The image is printed Print preview Print the current image in the current Analysis display window. > A print preview is opened. 39
40 Fig. 7-2 Print preview for image printing in Analysis window Function buttons in the Print Preview window [Print] Start printing [Next Page] Change to next page (only if there are multiple pages) [One Page / Two Pages] Display one page / two pages simultaneously [Zoom In] Zoom into image (enlarge representation) [Zoom Out] Zoom out of image (reduce representation) [Close]Close print preview 40
41 To print the image: 1. Click on [Print] > The Windows print window opens. 2. Select printer, make settings for paper size, orientation, color options etc. 3. Click on [OK] > The image is printed Print Setup Select the printer and printer connection for VarioAnalyze. Define printer settings. > The Windows print window is opened. In the Windows print window: 1. Select printer, make settings for selected printer, e.g. paper size, orientation, color options etc. 2. Click on [OK] > The settings are accepted as default settings for VarioAnalyze and called up at every start of the print function Exit Close VarioAnalyze analysis window, end program. If appropriate, there is a safety query with the option of storing changes (measurement results table, report). 41
42 7.3.2 Edit menu Undo Copy The Edit menu has the following options: Undo Copy Copy selection Copy measurement results Copy measurement results ASCII Copy to report Set selection Mirror Rotate Filter Change comment Undo previous action (if possible). This function is available only if an action which can be undone has taken place. The name of the function varies depending on what the last action was. It changes to Can t Undo if the last action cannot be undone. The following actions can be undone: mirroring rotations applying filter Copy current Analysis window view to the Clipboard. > Any contents which were previously stored in the Clipboard are overwritten. 42
43 Copy selection Copy the content of the selection area to the Clipboard. The function is available only if a selection area is marked. For marking a selection area, see Section Set selection. The data from the Clipboard can be imported into other applications Copy measurement results Copy table with measured values as metafile (graphic) to the Clipboard. The function is available only if measured values are displayed in the current view. A measured value table is displayed if shapes (ROI) are defined in the Analysis view (using the Point, Line, Rect, Circle, Ellipse, Polygon functions). See Section Thermogram menu. For copying the measured values as text (ASCII), see Section Copy measurement results ASCII Copy measurement results ASCII Copy table with measured values as ASCII data (text only) to the Clipboard. This copy function is particularly recommended if the contents of the measured value table are to be evaluated or displayed using a spreadsheet program (e.g. Excel, Origin). The function is available only if measured values are displayed in the current view. A measured value table is displayed if shapes (ROI) are defined in the Analysis view (using the Point, Line, Rect, Circle, Ellipse, Polygon functions). See Section Thermogram menu. For copying the measured values in graphic format (metadata), see Section Copy measurement results. 43
44 Copy to report Copy current window content into open Report window. The function is available only if a Report window is open and at least one graphic field is free in it. The image is copied to the first free graphic field of the Report form. To open a Report window, use the functions Create new report or Open existing report, see Section Report Set selection Create a selection area in the image. The selection is independent of any shape, and can be marked in addition to shapes. The selection area can be used to define the temperature scale or copied to other applications via the Clipboard, see also Sections Limits and Copy selection. A check mark before the menu bar and the printed icon indicate whether the function is activated. To create a selection: 1. With the function activated, click with the left mouse button on the starting point of the desired selection rectangle in the IR image. 2. Keep the mouse button pressed and drag to the desired end point. 3. Release the mouse button. The outline of the selection rectangle is drawn by dragging. To remove a selection: Click again on the menu option or icon. 44
45 Mirror Mirror the image. horizontal vertical Mirror on the horizontal center axis Mirror on the vertical center axis Rotate Rotate the image. Left 90 Right Filter Rotates the image by 90 to the left around its center. Rotates the image by 90 to the right around its center. 180 Rotates the image by 180 around its center. Filter function to smooth the image and remove thermal noise. The function always acts on the whole IR image. Clean Filter function: Image cleaning. The function can be applied several times to optimize the cleaning. Original Restore original image Change comment Edit image comment > The Change comment window opens. Fig. 7-3 Change comment window 45
46 To change the image comment: 1. Click with the left mouse button in the text field, mark text 2. Enter new comment 3. To confirm, click on [OK]. To cancel, click on [Cancel]. > The changed comment is stored. The current comment is displayed in the Analysis window if the Comment function is active, see Section View menu. 46
47 7.3.3 View menu The View menu has the following options: Show measurement results Show temperature scale Profile Comment Parameters Visible image Toolbar Status bar Show measurement results Hide measured value table. The measured value table is shown for each drawing of a shape (ROI) in the IR image, under the thermogram (under the displayed profile if any). This table can be hidden using the Show measurement results function. It is automatically displayed again when a new shape (ROI) is drawn. Fig. 7-4 Measurement results for three different shapes (ROI) Meanings: ROI Name and coordinates of shape (ROI = region-of-interest), see Thermogram menu Avg Average temperature Min Minimum temperature Max Maximum temperature Sdv Standard deviation Eps Emissivity 47
48 To edit/correct the measured values and parameters: Click on the table with the right mouse button. > A separate window with the measurement results opens, see Section Measure menu Show temperature scale Display/hide temperature scale. The temperature scale in the selected color palette is displayed at the right-hand edge next to the IR image. A check mark before the menu bar indicates whether the function is activated. To edit/correct the temperature scale, click on the scale with the right mouse button. A separate window for editing opens, see also Section Thermogram menu Profile Display/hide temperature profiles for marked axes. A check mark before the menu bar indicates whether the function is activated. After the function is selected: 1. When the function is called up, a crosshair pointer appears below the mouse pointer. 2. Using this crosshair pointer, define horizontal and vertical axes for the temperature profile in the image and click on the desired position (intersection point of the axes). > The temperature profile axes (horizontal, vertical) are defined and displayed Comment Display/hide image comment. The comment which is stored in the image is displayed in the first cell below the IR image. A check mark before the menu bar indicates whether the function is activated. 48
49 For changing/editing the image comment, see Section Change comment Parameters Display/hide image parameters. The parameters are shown below the IR image (below the comment line if any). A check mark before the menu bar indicates whether the function is activated. The following parameters can be displayed: Transmissivity Emissivity Filename Time Date Ambient temperature Camera Zoom Path temperature Distance Absorption For selecting/changing the parameters, see Section Options Visible image Open Visible Image (VIS) in separate window. This function is available only if a digital photo (Visible Image) for the open IRB image exists. The digital photo (Visible Image, VIS) can either be stored in the IRB, or exists as a bitmap (BMP) with the same name as the IRB in the same directory. 49
50 Toolbar Display/hide toolbar in the Analysis window. A check mark before the menu bar indicates whether the Toolbar is displayed. For an explanation of the icons of the toolbar, see Section 7.2 Toolbar in the Analysis window Status bar Display/hide status bar in Analysis window. A check mark before the menu bar indicates whether the status bar is displayed. The status bar displays information in 8 fields of different sizes from left to right: Field 1 For navigation in the image: current cursor position in image (pixel) and associated temperature value For navigation in the menu: description of the menu function which is currently marked if you move the cursor through the menus using the arrow keys of the keyboard If available, a description of the function of the printed icon in the toolbar Field 2 Date and time image was taken. Field 3 Name of camera which was used to take the image. Field 4 Serial number of thermogram in current image directory. Data: serial number (total number). Field 5 Not used Fields 6 to 8 CAP NUM SCRL Caps lock key is pressed. Num lock key is pressed. Scroll lock key is pressed. 50
51 7.3.4 Thermogram menu Limits The Thermogram menu has the following options: Limits Units Grid setting Temperature Matrix Isotherms Point Line Rect Circle Ellipse Polygon Next Previous Define temperature limits and palette. > The Select limits and palette window opens. Alternatively, open the Select limits and palette window with a right mouse click on the temperature scale (color scale) in the Analysis window. Fig. 7-5 Select limits and palette window Setup limits area Possible settings for the temperature scale: Direct Specify temperature scale manually: Define Level and Range using the 51
52 Min/Max scrollbar, or enter values in the input field. Confirm and apply by clicking on [Apply]. Temperature scale is defined by minimum and maximum in the image Min/Max selection The temperature scale is defined by minimum and maximum in the current selection area. To use this function, a selection must be marked. To mark a selection area, use the function Set selection. Calib range From IRB Select palette area The calibration range of the camera is used as the temperature scale. The calibration range is encoded in the header of the IRB file. Level and Range are set to the same values as at the instant when the thermogram was taken using the camera. The values are encoded in the header of the IRB file. Select the color palette for the temperature scale from the combo box: VARIOCAM Representation in the color palette of the VarioCam BlackWhite Gray scale representation IronBow Color palette in the tempering colors of steel BlueRed Color palette from blue (low temperatures) to red (high temperatures) MrkedBW Marked Black-White: Color palette in gray scale representation with color marking of high temperatures (red) and low temperatures (blue) 52
53 Rainbow Steps invers Color palette in the colors of the rainbow Define number of color steps Invert selected color palette Units Define temperature and length units for image representation in the window. > The Select units window opens. Fig. 7-6 Select units window Temperature Possible temperature units: Celsius Kelvin Fahrenheit Distance Possible length units: Meter Foot 53
54 Grid settings Place the measuring grid on the IR image. Measuring grids can be used to simplify the structure of the image contents and for thermal categorization of thermogram areas. > The Grid settings window opens. Fig. 7-7 Grid settings window In the Grid settings window: 1. Activate Show grid function, to show IRB images in the Analysis window with measuring grid. 2. Define measuring grid properties: Line distance Distance between vertical grid lines, in pixels Column distance Distance between horizontal grid lines, in pixels Solid/dashed line Choice of solid and dashed grid lines Font selection Font and size for temperature data Color selection Color for grid and font 3. To display temperature values in each grid cell, select the desired options: Average temperature Minimum temperature Maximum temperature 54
55 Fig. 7-8 Representation of an IR image with grid, and giving the average temperature in each grid cell Temperature Matrix Open the temperature matrix for the current image. The temperature for each individual point of the image is given in a table. > The window imagename.irb Temperature matrix opens. 55
56 Fig. 7-9 Temperature matrix window The window offers the following menu functions: File menu Save as Print Exit Edit menu Copy Copy ASCII Mirror Save current temperature matrix as ASCII file Print current temperature matrix Close Temperature matrix window Store the current visble part of the temperature matrix as image in the Clipboard (metafile) Store current temperature matrix as text file in the Clipboard (ASCII, e.g. for import into Microsoft Excel) Mirror temperature matrix (vertically/ horizontally) Rotate Rotate temperature matrix (left 90 / right 90 /180 ) 56
57 Isotherms Show isotherms. You can define a maximum of 10 isotherms for each image. > The Isotherms window opens. Fig Isotherms window Point Line 1. Specify the following properties for each isotherm: Minimum temperature Maximum temperature Color 2. Click on Apply to confirm the entry for the isotherms you have just defined. 3. To display the isotherms in the current image, activate the Active function. Draw a measuring area (shape) in the form of a point. To change the shape properties (position, name, emissivity), see Section Thermogram: Edit shapes. Draw a measuring area (shape) in the form of a line. To change the shape properties (position, size, name, emissivity), see Section Thermogram: Edit shapes. 57
58 Rect Circle Ellipse Polygon Next Previous Rectangle: Draw a measuring area (shape) in the form of a rectangle. To change the shape properties (position, size, name, emissivity), see Section Thermogram: Edit shapes. Draw a measuring area (shape) in the form of a circle. To change the shape properties (position, size, name, emissivity), see Section Thermogram: Edit shapes. Draw a measuring area (shape) in the form of a ellipse. To change the shape properties (position, size, name, emissivity), see Section Thermogram: Edit shapes. Draw a measuring area (shape) in arbitrary form. The drawing of the polygon is ended by a double click or right click on the starting point. To change the shape properties (position, size, name, emissivity), see Section Thermogram: Edit shapes. Display next IRB image. The next IRB image in the current directory is displayed. Display previous IRB image. The previous IRB image in the current directory is displayed. 58
59 7.3.5 Measure menu The Measure menu has one option: Measurement results Measurement results Display measurement results for shapes (ROI). > A separate window with the table representation of the measurement results for all shapes opens. Fig Measurement results window The buttons open the following functions: [Delete] Delete marked shapes (ROI). To delete, confirm the safety query. [Correction] Opens the dialog Correction definitions, see Section Correction menu. [Save] Saves the position and properties of the current shapes (ROIs) as a *.roi file. The filename can be freely chosen. [Load] Opens a *.roi file and sets the stored ROIs in the current image. Close the window by clicking on [x]. 59
60 7.3.6 Correction menu The Measure menu has one option: Definition Definition Correct values which affect the measurements (e.g. ambient temperature, emissivity, transmissivity etc.). > The Correction definitions window opens. The window has two tabs: Global Shapes Global tab Define correction definitions for the whole current image. Fig Correction definitions window, Global tab 60
61 In the Correction definitions window, Global tab: 1. On this tab, correct (if required, corresponding to the actual conditions when the image was taken): Emissivity Ambient temperature Path temperature Transmissivity 2. Alternatively to direct entry, you can also calculate the transmissivity of the object environment by entering the values for distance and absorption and copy this value by clicking on [Get Transmissivity]. 3. Click on [Apply] to apply the entries. > The image display in the Analysis window is immediately updated. 4. Change to the Shapes tab Shapes tab Define correction definitions for each shape individually. Fig Correction definitions window, Shapes tab 61
62 1. Select a line (shape) 2. Click on [Edit] (alternatively: double-click on the Shape line) > The Edit dialog opens ( Edit correction definitions shapename window) Fig Edit correction definitions window In the Edit correction definitions window: 3. Correct the data (as for the Global tab) and confirm with [OK] > The image display in the Analysis window is immediately updated. 4. Close the window by clicking on [x] 62
63 7.3.7 Extras menu The Extras menu has the following options: Options Arrange icons Options Select settings and program options. > Options window opens The Options window has three tabs: Generally Parameter Global Properties Generally tab Do settings for representation in the Analysis window. Fig Options window: Generally tab 63
64 The options have the following meaning: Temperature presentation Number of digits after decimal point for measured temperature values Number of last used thermograms ROIs font Font for the shape (ROI) name Comment font Font in the comment and parameter line Background Background color in the window Profiles background Background color for temperature profile representation Parameters tab Select the parameters which are to be displayed in the parameter line. Fig Options window: Parameters tab The following parameters can be selected: Transmissivity Emissivity Filename Time Date 64
65 Ambient temperature Camera Zoom Path temperature Distance Absorption Global Properties tab Copy properties from the previously opened image. This option is useful, for instance, if you have recorded a series of measurements in approximately constant conditions and want to correct all images of this series with the same parameters. Fig Options window: Global Properties tab You can copy the following parameters from the previous image: Emissivity Ambient temperature Path temperature Transmissivity 65
66 The marked parameters are not changed when a new IRB image is opened. VarioAnalyze retains the associated values from the previous image Arrange icons Display/hide icons in the toolbar. > The Select toolbar icons window opens. Fig Select toolbar icons window To display icons: 1. Mark the icons which are to be displayed in the toolbar. 2. Confirm with [OK]. To cancel, click on [Cancel]. 66
67 7.3.8 Report menu The Report menu has the following options: Create new report Open existing report Create new report Create new report. > Select template window opens To create a report, you can choose between predefined templates (3 A4, 3 US letter formats) and open your own previously stored templates (*.tpl). For preselection of templates, the Select template window has 3 tabs: A4 templates US letter templates Own templates Fig Select template window: A4 templates tab 67
68 In the Select template window: 1. Select the tab which corresponds to the format you want. 2. Click on the template you want. > The VarioAnalyze basic report window opens the template. 3. For editing and saving a report, see Section 8 Create report: Report window Open existing report Open existing report. The report must previously have been stored in VarioAnalyze report format *.rep. > The Windows Open window opens. In the Open window: 1. Select path and filename 2. Click on Open > The report is opened in the VarioAnalyze basic report window. 3. For editing and saving the report, see Section 8 Create report: Report window. 68
69 7.3.9 Help menu Help The Help menu has the following options: Help About VarioAnalyze Open VarioAnalyze Windows help About VarioAnalyze Display copyright information about the software and the version number of your copy of VarioAnalyze. 69
70 7.4 Direct access with right mouse click The right mouse click on various objects of the Analysis window makes possible fast, convenient access to functions, some of which can also be reached via the menu. This section summarizes the essential functions which can be reached by a right click: Edit shapes in a thermogram (change size, position) Edit temperature limits and color palette of a thermogram representation Save, copy and print the content of the Analysis window (thermogram with displayed measured values, color palette etc.) Thermogram: Edit shapes If you have drawn shapes (ROIs) into the image to evaluate your thermogram, you have the option of changing the properties of each individual shape subsequently. Proceed as follows: 1. In the Analysis window, click with the right mouse button on the label of the shape to be corrected (e.g. R1) > The Change properties for shapename window opens. 70
71 Fig Change properties for shapename window 2. Correct the properties of the shape by using the scroll bars or by entries in the text fields: Position Label position Size Name Emissivity > You can observe the result in the image immediately if you place the Change properties window appropriately on your screen. 71
72 Fig Image in the Analysis window for editing a shape 3. Activate the Show minimum and/or Show maximum options if the minimum and/or maximum temperatures within the shape are to be displayed. 4. Confirm the settings by clicking on [Apply]. To delete the selected shape: Click on the [Delete] button in the Change properties for shapename window. > The shape is removed. Close the window by clicking on [x]. 72
73 7.4.2 Change limits and color palette To change the temperature limits and the color palette for your current thermogram in the Analysis window, use the following function: Click with the right mouse button on the temperature scale (color scale) in the Analysis window. > The Select limits and palette window opens. Fig Select limits and palette window For the description of the options and settings in the Select limits and palette window, see Section Limits. 73
74 7.4.3 Save, print, export thermograms Clicking with the right mouse button directly on the thermogram of the Analysis window opens a flyout menu with these options: Save As Save IRB files (see Section Save as ) Copy Copy the current window content to the Clipboard. It is then possible to insert it into other application programs. Print Print the current image. Selecting the function opens the Windows print window (see Section Print ) 74
75 Create report: Report window 8 Create report: Report window The report function makes it possible to summarize the analysis and evaluation of your thermograms clearly and uniformly, and to save them. The Report window VarioAnalyze basic report opens after one of the two options in the Report menu of the Analysis window is called up: - Report Create new report - or - Report Open existing report - (See Section Report menu ). 8.1 Structure and function of the Report window The VarioAnalyze basic report window opens either an empty report template or an existing report to be edited and saved. Each template has predefined report elements: text and graphic fields. 75
76 Create report: Report window Fig. 8-1 Report window Text field: Enter text directly Graphic field: Include images from the VarioAnalyze Analysis window or from another file 76
77 Create report: Report window Edit report fields Click with the left mouse button in the report field. > In a text field, the cursor flashes and you can write immediately. > In a graphic field, at first you see no reaction. To insert a graphic, use the Change properties of a report field function (see following Section Changing the properties of a report field and importing images ) or the menu option - View Copy to report Changing the properties of a report field and importing images 1. Click with the right mouse button on the report field of which you want to change the properties. > The Setup report element property window opens. Depending on whether the field is defined as a text or graphic field, the relevant options can be selected. 77
Training New standard software VarioAnalyze , November
 Training New standard software VarioAnalyze 1.0 2005, November VarioAnalyze 1.0 New convenient features, making thermogram analysis even more easier & comfortable Windows-like Thermogram EXPLORER for thermogram
ANALYSIS SOFTWARE. CAmReport
 ANALYSIS SOFTWARE CAmReport ENGLISH User Manual CONTENTS 1. INSTALLATION... 3 2. GETTING STARTED... 4 2.1 Starting and Exiting CAmReport... 4 2.2 Setup... 4 2.2.1 Language... 4 2.2.2 Units... 4 2.2.3 CAmReport
#61-844SW ThermalVision Software Instruction Manual
 ThermalVision Software Instruction Manual ND-7035-1 Page 1 of 23 Contents 1. Installing the ThermalVision software onto a PC... 3 2. Transferring saved images from the camera to the PC.... 3 2.1. Direct
XnView Image Viewer. a ZOOMERS guide
 XnView Image Viewer a ZOOMERS guide Introduction...2 Browser Mode... 5 Image View Mode...14 Printing... 22 Image Editing...26 Configuration... 34 Note that this guide is for XnView version 1.8. The current
Quick Start Guide. ARIS Architect. Version 9.8 Service Release 2
 ARIS Architect Version 9.8 Service Release 2 October 2015 This document applies to ARIS Version 9.8 and to all subsequent releases. Specifications contained herein are subject to change and these changes
SPRECON-E Display Editor
 SPRECON-E Display Editor Version 2.0b USERS MANUAL 94.2.912.60en 09/2004 ISSUE A page 2 / 61 Business Sector Enery Station Automation (ENA) [Power systems automation] Sprecher Automation GmbH Franckstrasse
Quick Start Guide. ARIS Architect. Version 9.7
 ARIS Architect Version 9.7 October 2014 This document applies to ARIS Version 9.7 and to all subsequent releases. Specifications contained herein are subject to change and these changes will be reported
MIMAKI ENGINEERING CO., LTD.
 For Windows XP/Windows 2000 Cutting Application Software SimpleCut Operation Manual MIMAKI ENGINEERING CO., LTD. D201463 Contents Introduction 1 About this Manual 2 Chapter 1 Installation Procedure 3
JASCO CANVAS PROGRAM OPERATION MANUAL
 JASCO CANVAS PROGRAM OPERATION MANUAL P/N: 0302-1840A April 1999 Contents 1. What is JASCO Canvas?...1 1.1 Features...1 1.2 About this Manual...1 2. Installation...1 3. Operating Procedure - Tutorial...2
Table of Contents. Logos Imaging Application User s Manual Version Page 1
 Table of Contents About... 4 System Requirements... 5 Uninstall Previous Versions... 5 Install LIA 6.0... 6 Install the Device Drivers... 13 Register... 14 Getting Help... 14 Technical Support... 14 Workspace
XnView 1.9. a ZOOMERS guide. Introduction...2 Browser Mode... 5 Image View Mode...15 Printing Image Editing...28 Configuration...
 XnView 1.9 a ZOOMERS guide Introduction...2 Browser Mode... 5 Image View Mode...15 Printing... 22 Image Editing...28 Configuration... 36 Written by Chorlton Workshop for hsbp Introduction This is a guide
OpenForms360 Validation User Guide Notable Solutions Inc.
 OpenForms360 Validation User Guide 2011 Notable Solutions Inc. 1 T A B L E O F C O N T EN T S Introduction...5 What is OpenForms360 Validation?... 5 Using OpenForms360 Validation... 5 Features at a glance...
StickFont Editor v1.01 User Manual. Copyright 2012 NCPlot Software LLC
 StickFont Editor v1.01 User Manual Copyright 2012 NCPlot Software LLC StickFont Editor Manual Table of Contents Welcome... 1 Registering StickFont Editor... 3 Getting Started... 5 Getting Started...
GET TO KNOW FLEXPRO IN ONLY 15 MINUTES
 GET TO KNOW FLEXPRO IN ONLY 15 MINUTES Data Analysis and Presentation Software GET TO KNOW FLEXPRO IN ONLY 15 MINUTES This tutorial provides you with a brief overview of the structure of FlexPro and the
Microsoft Excel 2010 Part 2: Intermediate Excel
 CALIFORNIA STATE UNIVERSITY, LOS ANGELES INFORMATION TECHNOLOGY SERVICES Microsoft Excel 2010 Part 2: Intermediate Excel Spring 2014, Version 1.0 Table of Contents Introduction...3 Working with Rows and
VHSE - COMPUTERISED OFFICE MANAGEMENT MODULE III - Communication and Publishing Art - PageMaker
 INTRODUCTION : It is one Adobe PageMaker 7.0 software is the ideal page layout program for business, education, and small- and home-office professionals who want to create high-quality publications such
ARIS Architect QUICK START GUIDE. Version Service Release 7
 ARIS Architect QUICK START GUIDE Version 9.8 - Service Release 7 December 2016 This document applies to ARIS Version 9.8 and to all subsequent releases. Specifications contained herein are subject to change
Copyright Notice. Trademarks
 Copyright Notice All rights reserved. No part of this publication may be reproduced, stored in a retrieval system, or transmitted in any form or by any means, electronic, mechanical, photocopying, recording,
User Manual Version 1.1 January 2015
 User Manual Version 1.1 January 2015 - 2 / 112 - V1.1 Variegator... 7 Variegator Features... 7 1. Variable elements... 7 2. Static elements... 7 3. Element Manipulation... 7 4. Document Formats... 7 5.
Fusion. CBR Fusion MLS Level 1 Core Functions. Class Handout
 Fusion 1 CBR Fusion MLS Level 1 Core Functions Class Handout GETTING STARTED IN FUSION Logging On and Off To log on to Fusion MLS: 1. Type your user name in the User ID box. 2. Type your password in the
MANUAL NO. OPS647-UM-151 USER S MANUAL
 MANUAL NO. OPS647-UM-151 USER S MANUAL Software Usage Agreement Graphtec Corporation ( Graphtec ) hereby grants the purchaser and authorized User (the User ) the right to use the software (the Software
LinkMotion and CorelDraw 9, 10, 11, 12, X3, X4, X5, X6, X7 and X8:
 LinkMotion and CorelDraw 9, 10, 11, 12, X3, X4, X5, X6, X7 and X8: After you install LinkMotion software and set up all settings launch CorelDraw software. Important notes: Solustan s LinkMotion driver
Plotting. Documentation. DDBSP - Dortmund Data Bank Software Package
 Plotting Documentation DDBSP - Dortmund Data Bank Software Package DDBST Software & Separation Technology GmbH Marie-Curie-Straße 10 D-26129 Oldenburg Tel.: +49 441 361819 0 Fax: +49 441 361819 10 E-Mail:
OnBase - EDM Services (Electronic Document Management Services)
") OnBase - EDM Services (Electronic Document Management Services) Overview EDM Services contains the following features: EDM Briefcase Prerequisites The EDM Briefcase allows you to: Document Templates Image
OnBase - EDM Services (Electronic Document Management Services) Overview EDM Services contains the following features: EDM Briefcase Prerequisites The EDM Briefcase allows you to: Document Templates Image
ECDL Module 6 REFERENCE MANUAL
 ECDL Module 6 REFERENCE MANUAL Presentation Microsoft PowerPoint XP Edition for ECDL Syllabus Four PAGE 2 - ECDL MODULE 6 (USING POWERPOINT XP) - MANUAL 6.1 GETTING STARTED... 4 6.1.1 FIRST STEPS WITH
USER S MANUAL Software Usage Agreement Registered Trademarks Notes on this Manual Disclaimer
 USER S MANUAL Software Usage Agreement Registered Trademarks Notes on this Manual Disclaimer 1 1.1 1.2 2 3 Introduction 2.1 2.2 Features System Requirements Installing Xyron Wishblade Software 3.1 3.2
User Guide 701P Wide Format Solution Wide Format Scan Service
 User Guide 701P44865 6204 Wide Format Solution Wide Format Scan Service Xerox Corporation Global Knowledge & Language Services 800 Phillips Road Bldg. 845-17S Webster, NY 14580 Copyright 2006 Xerox Corporation.
Motic Images Plus 3.0 ML Software. Windows OS User Manual
 Motic Images Plus 3.0 ML Software Windows OS User Manual Motic Images Plus 3.0 ML Software Windows OS User Manual CONTENTS (Linked) Introduction 05 Menus and tools 05 File 06 New 06 Open 07 Save 07 Save
-Table of Contents- 1. Overview Installation and removal Operation Main menu Trend graph... 13
 Thank you for buying Data Analysis Software. In order to use this software correctly and safely and to prevent trouble, please read this manual carefully. Notice 1. No part of this manual can be reproduced
ROBO Master OPS656. USER'S MANUAL MANUAL NO. OPS656m-UM Introduction 1.1 Features System Requirements... 3
 USER'S MANUAL MANUAL NO. m-um-152 Software Usage Agreement... 2 Registered Trademarks... 2 Notes on this Manual... 2 Disclaimer... 2 1 Introduction 1.1 Features... 3 1.2 System Requirements... 3 2 Installing
WEEK NO. 12 MICROSOFT EXCEL 2007
 WEEK NO. 12 MICROSOFT EXCEL 2007 LESSONS OVERVIEW: GOODBYE CALCULATORS, HELLO SPREADSHEET! 1. The Excel Environment 2. Starting A Workbook 3. Modifying Columns, Rows, & Cells 4. Working with Worksheets
Solo 4.6 Release Notes
 June9, 2017 (Updated to include Solo 4.6.4 changes) Solo 4.6 Release Notes This release contains a number of new features, as well as enhancements to the user interface and overall performance. Together
ezimagex2 User s Guide Version 1.0
 ezimagex2 User s Guide Version 1.0 Copyright and Trademark Information The products described in this document are copyrighted works of AVEN, Inc. 2015 AVEN, Inc. 4595 Platt Rd Ann Arbor, MI 48108 All
NETWORK PRINT MONITOR User Guide
 NETWORK PRINT MONITOR User Guide Legal Notes Unauthorized reproduction of all or part of this guide is prohibited. The information in this guide is subject to change for improvement without notice. We
Navigator Software User s Manual. User Manual. Navigator Software. Monarch Instrument Rev 0.98 May Page 1 of 17
 User Manual Navigator Software Monarch Instrument Rev 0.98 May 2006 Page 1 of 17 Contents 1. NAVIGATOR SOFTWARE 2. INSTALLATION 3. USING NAVIGATOR SOFTWARE 3.1 STARTING THE PROGRAM 3.2 SYSTEM SET UP 3.3
VANGUARD LOAD TAP CHANGER ANALYZER (LTCA) VERSION 2.xx SOFTWARE MANUAL. LTCA-10, LTCA-40, WRM-10P, WRM-40, TRM-20, TRM-40, TRM-203, and TRM-403
 VERSION 2.xx SOFTWARE MANUAL. LTCA-10, LTCA-40, WRM-10P, WRM-40, TRM-20, TRM-40, TRM-203, and TRM-403") VANGUARD LOAD TAP CHANGER ANALYZER (LTCA) VERSION 2.xx SOFTWARE MANUAL For Use with Vanguard s LTCA-10, LTCA-40, WRM-10P, WRM-40, TRM-20, TRM-40, TRM-203, and TRM-403 Load Tap Changer Analyzers and Winding
VANGUARD LOAD TAP CHANGER ANALYZER (LTCA) VERSION 2.xx SOFTWARE MANUAL For Use with Vanguard s LTCA-10, LTCA-40, WRM-10P, WRM-40, TRM-20, TRM-40, TRM-203, and TRM-403 Load Tap Changer Analyzers and Winding
Microsoft Office. Microsoft Office
 is an office suite of interrelated desktop applications, servers and services for the Microsoft Windows. It is a horizontal market software that is used in a wide range of industries. was introduced by
Scheme Editor. Version 6.3. Manual Edition 1
 Scheme Editor Version 6.3 Manual Edition 1 Bosch Rexroth AG Print Title Type of Documentation Document Typecode Internal File Reference Scheme Editor Version 6.3 Manual Print RS-0361ea845ef863400a6846a0010a9c70-19-en-US-3
Microsoft Excel 2010 Basic
 Microsoft Excel 2010 Basic Introduction to MS Excel 2010 Microsoft Excel 2010 is a spreadsheet software in the new Microsoft 2010 Office Suite. Excel allows you to store, manipulate and analyze data in
Insight: Measurement Tool. User Guide
 OMERO Beta v2.2: Measurement Tool User Guide - 1 - October 2007 Insight: Measurement Tool User Guide Open Microscopy Environment: http://www.openmicroscopy.org OMERO Beta v2.2: Measurement Tool User Guide
Opening Screen When you first enter Slick!, a blank opening screen will appear as shown below.
 Quick Start This will provide you an overview on how to:?? select and view a file?? zoom in an out of the graphics window?? panning around the graphics window?? zoom to the extents of graphics window??
BASIC MICROSOFT POWERPOINT
 BASIC MICROSOFT POWERPOINT PART ONE PHONE: 504-838-1144 IT Training Team Jefferson Parish Library EMAIL: jpltrain@jplibrary.net In this class you will learn to: Launch, close, and interact with Microsoft
Basic Modeling 1 Tekla Structures 12.0 Basic Training September 19, 2006
 Tekla Structures 12.0 Basic Training September 19, 2006 Copyright 2006 Tekla Corporation Contents Contents 3 1 5 1.1 Start Tekla Structures 6 1.2 Create a New Model BasicModel1 7 1.3 Create Grids 10 1.4
Breeze User Guide. Breeze Multiple Stream Video Processors. Light and Standard Editions Version 5.3.2
 Breeze User Guide Breeze Multiple Stream Video Processors Light and Standard Editions Version 5.3.2 Copyright 1989-2007 Discovery Scientific, LLC All rights reserved www.discoverybiz.net January 01, 2007
Adobe PageMaker Tutorial
 Tutorial Introduction This tutorial is designed to give you a basic understanding of Adobe PageMaker. The handout is designed for first-time users and will cover a few important basics. PageMaker is a
FactoryLink 7. Version 7.0. Client Builder Reference Manual
 FactoryLink 7 Version 7.0 Client Builder Reference Manual Copyright 2000 United States Data Corporation. All rights reserved. NOTICE: The information contained in this document (and other media provided
MIMAKI ENGINEERING CO., LTD.
 CAMLINK Instruction manual MIMAKI ENGINEERING CO., LTD. TKB Gotenyama Building, 5-9-41, Kitashinagawa, Shinagawa-ku, Tokyo 141-0001, Japan Phone: +81-3-5420-8671 Fax: +81-3-5420-8687 URL: http://www.mimaki.co.jp/
ENVI Tutorial: Introduction to ENVI
 ENVI Tutorial: Introduction to ENVI Table of Contents OVERVIEW OF THIS TUTORIAL...1 GETTING STARTED WITH ENVI...1 Starting ENVI...1 Starting ENVI on Windows Machines...1 Starting ENVI in UNIX...1 Starting
Océ Engineering Exec. Advanced Import and Index
 Océ Engineering Exec Advanced Import and Index Océ-Technologies B.V. Copyright 2004, Océ-Technologies B.V. Venlo, The Netherlands All rights reserved. No part of this work may be reproduced, copied, adapted,
CHAPTER 1 GETTING STARTED
 CHAPTER 1 GETTING STARTED Configuration Requirements This design of experiment software package is written for the Windows 2000, XP and Vista environment. The following system requirements are necessary
W-E
 Signage Suite V2.20 User Guide 605220-02-01-W-E-051613-02 Trademarks Windows XP, Windows Vista, Windows 7, and Microsoft are registered trademarks of Microsoft Corporation. All other trademarks are the
CHAPTER 1 COPYRIGHTED MATERIAL. Getting to Know AutoCAD. Opening a new drawing. Getting familiar with the AutoCAD and AutoCAD LT Graphics windows
 CHAPTER 1 Getting to Know AutoCAD Opening a new drawing Getting familiar with the AutoCAD and AutoCAD LT Graphics windows Modifying the display Displaying and arranging toolbars COPYRIGHTED MATERIAL 2
FILE MENU New Starts a New Blank Canvas Open- Allows you to import designs into the program. Close- Closes the current Design
 1 Quick Start Guide This guide is intended to give you an overview of the function of the program. The guide is arranged by section, Each section corresponds to the different pulldown menus in the program.
SI-100 Digital Microscope. User Manual
 SI-100 Digital Microscope User Manual Read this manual before use Keep for future reference Content 1 Introduction... 3 1.1 About The SI-100... 3 1.2 Advantage of SI-100... 3 1.3 Product Specification...
CENTAUR S REAL-TIME GRAPHIC INTERFACE V4.0 OPERATOR S MANUAL
 CENTAUR S REAL-TIME GRAPHIC INTERFACE V4.0 OPERATOR S MANUAL TABLE OF CONTENTS Installation... 6 Introduction to Centaur s real-time Graphic Interface... 6 Computer Requirements... 7 Operating System
Working with PDF s. To open a recent file on the Start screen, double click on the file name.
 Working with PDF s Acrobat DC Start Screen (Home Tab) When Acrobat opens, the Acrobat Start screen (Home Tab) populates displaying a list of recently opened files. The search feature on the top of the
Day : Date : Objects : Open MS Excel program * Open Excel application. Select : start. Choose: programs. Choose : Microsoft Office.
 Day : Date : Objects : Open MS Excel program * Open Excel application. Select : start Choose: programs Choose : Microsoft Office Select: Excel *The interface of Excel program - Menu bar. - Standard bar.
The Fundamentals. Document Basics
 3 The Fundamentals Opening a Program... 3 Similarities in All Programs... 3 It's On Now What?...4 Making things easier to see.. 4 Adjusting Text Size.....4 My Computer. 4 Control Panel... 5 Accessibility
Adobe Illustrator CS Design Professional GETTING STARTED WITH ILLUSTRATOR
 Adobe Illustrator CS Design Professional GETTING STARTED WITH ILLUSTRATOR Chapter Lessons Create a new document Explore the Illustrator window Create basic shapes Apply fill and stroke colors to objects
LINAX Series Videographic Recorders
 User Guide 154534_8 LINAX Series Videographic Recorders DataManager Software Electrical Safety This instrument complies with the requirements of CEI/IEC 61010-1:2001-2 'Safety Requirements for Electrical
Bombardier Business Aircraft Customer Services. Technical Publications. SmartPubs Viewer 3.0 User Guide. Updated January 2013 [2013]
![Bombardier Business Aircraft Customer Services. Technical Publications. SmartPubs Viewer 3.0 User Guide. Updated January 2013 [2013]](/thumbs/90/103657167.jpg "Bombardier Business Aircraft Customer Services. Technical Publications. SmartPubs Viewer 3.0 User Guide. Updated January 2013 [2013]") Bombardier Business Aircraft Customer Services Technical Publications SmartPubs Viewer 3.0 User Guide Updated January 2013 [2013] Table of Contents Application Views... 5 Collection View... 5 Manual View...
Bombardier Business Aircraft Customer Services Technical Publications SmartPubs Viewer 3.0 User Guide Updated January 2013 [2013] Table of Contents Application Views... 5 Collection View... 5 Manual View...
Impress Guide Chapter 11 Setting Up and Customizing Impress
 Impress Guide Chapter 11 Setting Up and Customizing Impress This PDF is designed to be read onscreen, two pages at a time. If you want to print a copy, your PDF viewer should have an option for printing
Anima-LP. Version 2.1alpha. User's Manual. August 10, 1992
 Anima-LP Version 2.1alpha User's Manual August 10, 1992 Christopher V. Jones Faculty of Business Administration Simon Fraser University Burnaby, BC V5A 1S6 CANADA chris_jones@sfu.ca 1992 Christopher V.
Impress Guide. Chapter 11 Setting Up and Customizing Impress
 Impress Guide Chapter 11 Setting Up and Customizing Impress Copyright This document is Copyright 2007 2013 by its contributors as listed below. You may distribute it and/or modify it under the terms of
WinCC V4. Manual Part 2/3 C79000-G8276-C107-01
 WinCC V4 Manual Part 2/3 Edition August 1997 WinCC, SIMATIC, SINEC, STEP are Siemens registered trademarks. All other product and system names in this manual are (registered) trademarks of their respective
Table of Contents Lesson 1: Introduction to the New Interface... 2 Lesson 2: Prepare to Work with Office
 Table of Contents Lesson 1: Introduction to the New Interface... 2 Exercise 1: The New Elements... 3 Exercise 2: Use the Office Button and Quick Access Toolbar... 4 The Office Button... 4 The Quick Access
v Annotation Tools GMS 10.4 Tutorial Use scale bars, North arrows, floating images, text boxes, lines, arrows, circles/ovals, and rectangles.
 v. 10.4 GMS 10.4 Tutorial Use scale bars, North arrows, floating images, text boxes, lines, arrows, circles/ovals, and rectangles. Objectives GMS includes a number of annotation tools that can be used
Vizit Pro User Manual
 Vizit Pro User Manual 1 Table of Contents Vizit Pro User Manual... 1 Using Vizit Pro... 3 The Vizit Pro User Interface... 3 Toolbars... 4 File Tab Toolbar... 4 Edit Tab Toolbar... 5 Annotations Tab Toolbar...
Working with Charts Stratum.Viewer 6
 Working with Charts Stratum.Viewer 6 Getting Started Tasks Additional Information Access to Charts Introduction to Charts Overview of Chart Types Quick Start - Adding a Chart to a View Create a Chart with
WINDOWS NT BASICS
 WINDOWS NT BASICS 9.30.99 Windows NT Basics ABOUT UNIVERSITY TECHNOLOGY TRAINING CENTER The University Technology Training Center (UTTC) provides computer training services with a focus on helping University
Operating Instructions
 Providing presentation solutions V iewer Software Program Operating Instructions NIPPON AVIONICS CO., LTD. 1 This manual describes the functions and operations for conducting presentations using ip Viewer.
Code Finix Label Designer V 1.0 User Guide
 Code Finix Label Designer V 1.0 User Guide Introduction Welcome, Code Finix Label Designer is a family of professional labeling software products that brings a complete barcode printing solution for desktop
 http://pdws.hccfl.edu March 2014 2014 Hillsborough Community College - Professional Development and Workshop Services Hillsborough Community College - Professional Development and Workshop Services The
Microsoft Office 2000 & Microsoft Word 2000 Page 1. ***** Help Options ***** To access [? ] quickly & for specific use then
![Microsoft Office 2000 & Microsoft Word 2000 Page 1. ***** Help Options ***** To access [? ] quickly & for specific use then](/thumbs/90/104468223.jpg "Microsoft Office 2000 & Microsoft Word 2000 Page 1. ***** Help Options ***** To access [? ] quickly & for specific use then") Microsoft Office 2000 & Microsoft Word 2000 Page 1 ***** Help Options ***** Microsoft Help: Options and Search [ F1 ] Fastest way to get to Office Assistant and MS Office Help! ESC to Exit File > Help
Microsoft Office 2000 & Microsoft Word 2000 Page 1 ***** Help Options ***** Microsoft Help: Options and Search [ F1 ] Fastest way to get to Office Assistant and MS Office Help! ESC to Exit File > Help
Dr.Engrave USER'S MANUAL
 Dr.Engrave USER'S MANUAL This document is the operation manual for Dr. Engrave for Windows, a program for plate engraving. Contents Introduction... 4 Operating environment... 5 Overview of Dr.Engrave...
For Windows VISTA /Windows XP Cutting Application Software Simple Studio. Operation Manual MIMAKI ENGINEERING CO., LTD. D
 For Windows VISTA /Windows XP Cutting Application Software Simple Studio Operation Manual MIMAKI ENGINEERING CO., LTD. D201923-11 Contents Introduction 1 About this Manual 3 Chapter 1 Installation Procedure
INTRODUCTION... 1 UNDERSTANDING CELLS... 2 CELL CONTENT... 4
 Introduction to Microsoft Excel 2016 INTRODUCTION... 1 The Excel 2016 Environment... 1 Worksheet Views... 2 UNDERSTANDING CELLS... 2 Select a Cell Range... 3 CELL CONTENT... 4 Enter and Edit Data... 4
AutoCAD 2009 User InterfaceChapter1:
 AutoCAD 2009 User InterfaceChapter1: Chapter 1 The AutoCAD 2009 interface has been enhanced to make AutoCAD even easier to use, while making as much screen space available as possible. In this chapter,
wiemarc 5.2 Manual Labeling Software wiemarc 5.2
 wiemarc 5.2 Manual Labeling Software wiemarc 5.2 Page 1 of 67 Release: February 16, 2016 Manual labeling software 5.2 Table of contents 1. System requirements 2. Software installation 3. Output devices
EASY INTERACTIVE WHITEBOARD
 EASY INTERACTIVE WHITEBOARD CONNECT COMPUTER/TURN ON PROJECTOR LAPTOP For the projectors in the labs, a computer is connected. These instructions are for you to connect a laptop computer to the projector.
1 THE PNP BASIC COMPUTER ESSENTIALS e-learning (MS Excel 2007)
") 1 THE PNP BASIC COMPUTER ESSENTIALS e-learning (MS Excel 2007) 2 THE PNP BASIC COMPUTER ESSENTIALS e-learning (MS Excel 2007) TABLE OF CONTENTS CHAPTER 1: GETTING STARTED... 5 THE EXCEL ENVIRONMENT...
1 THE PNP BASIC COMPUTER ESSENTIALS e-learning (MS Excel 2007) 2 THE PNP BASIC COMPUTER ESSENTIALS e-learning (MS Excel 2007) TABLE OF CONTENTS CHAPTER 1: GETTING STARTED... 5 THE EXCEL ENVIRONMENT...
1 ZoomBrowser EX Software User Guide 5.0
 1 ZoomBrowser EX Software User Guide 5.0 Table of Contents (1/2) Chapter 1 Chapter 2 Chapter 3 What is ZoomBrowser EX? What Can ZoomBrowser EX Do?... 4 Guide to the ZoomBrowser EX Windows... 5 Task Buttons
Press the Plus + key to zoom in. Press the Minus - key to zoom out. Scroll the mouse wheel away from you to zoom in; towards you to zoom out.
 Navigate Around the Map Interactive maps provide many choices for displaying information, searching for more details, and moving around the map. Most navigation uses the mouse, but at times you may also
14 July Ver CRView V3 User Guide. 1 P a g e
 Ver. 080707 CRView V3 User Guide 1 P a g e Contents Copyright notice... 3 Trademarks... 3 System requirements... 4 Required hardware... 4 Recommended hardware... 4 Installing CRView... 5 Installing from
Program and Graphical User Interface Design
 CHAPTER 2 Program and Graphical User Interface Design OBJECTIVES You will have mastered the material in this chapter when you can: Open and close Visual Studio 2010 Create a Visual Basic 2010 Windows Application
DA-CAD User Manual Dürkopp Adler AG
 DA-CAD 5000 User Manual DA-CAD 5000 All rights reserved No parts of this work may be reproduced in any form or by any means - graphic, electronic, or mechanical, including photocopying, recording, taping,
Introduction to Microsoft Office PowerPoint 2010
 Introduction to Microsoft Office PowerPoint 2010 TABLE OF CONTENTS Open PowerPoint 2010... 1 About the Editing Screen... 1 Create a Title Slide... 6 Save Your Presentation... 6 Create a New Slide... 7
2 Solutions Chapter 3. Chapter 3: Practice Example 1
 1 Solutions This section includes the step by step solutions for the practice exercise for the following chapters and sections: Chapter 3 Chapter 4 Chapter 5 Chapter 11: Rainbow Springs sample test Final
OrgPlus 6 Plug-in User Guide Version 6.0.3
 OrgPlus 6 Plug-in User Guide Version 6.0.3 The material presented in this publication is copyright-protected 2000-2006 by HumanConcepts and may not be reproduced in any form, by any method for any purpose
5.2. Click these tabs to jump to the Table of Contents, Index or start of each chapter.
 5.2 Click these tabs to jump to the, or start of each chapter. Click this button to advance to the next page. Click this button to return to the previous page. (Since this is the starting page, the [Back]
Numbers Basics Website:
 Website: http://etc.usf.edu/te/ Numbers is Apple's new spreadsheet application. It is installed as part of the iwork suite, which also includes the word processing program Pages and the presentation program
Legal Notes. Regarding Trademarks KYOCERA MITA Corporation
 Legal Notes Unauthorized reproduction of all or part of this guide is prohibited. The information in this guide is subject to change without notice. We cannot be held liable for any problems arising from
KODAK Software User s Guide. Software Version 9.0
 KODAK Create@Home Software User s Guide Software Version 9.0 Table of Contents 1 Welcome to KODAK Create@Home Software Features... 1-1 Supported File Formats... 1-1 System Requirements... 1-1 Software
SMART Board Interactive Whiteboard Basics
 SMART Board Interactive Whiteboard Basics This Quick Reference Guide provides an overview of the information you need to begin using a SMART Board interactive whiteboard. Before you begin, make sure the
LAB # 2 3D Modeling, Properties Commands & Attributes
 COMSATS Institute of Information Technology Electrical Engineering Department (Islamabad Campus) LAB # 2 3D Modeling, Properties Commands & Attributes Designed by Syed Muzahir Abbas 1 1. Overview of the
Anleitungen für Word 2016 als Word-Dokument zum Ausdrucken und fürs Intranet
 Anleitungen für Word 2016 als Word-Dokument zum Ausdrucken und fürs Intranet 19 Text and Tabs Tabs (tab stops) help you to write a list, for example, for an order or invoice. Larger spaces should not be
User Guide Belltech Systems, LLC
 User Guide Belltech Systems, LLC http://www.belltechsystems.com May, 2006 1. Introducing Belltech CaptureXT 2. Installation and Uninstallation Installation Running the Application Uninstallation 3. User
Tach Facts V3.0 Software
 Tach Facts V3.0 Software Download runs from your Auto Meter Playback Tach with Tach-Facts Software. Instr. No. 2650-978 Tach Facts provides complete race analysis on your personal computer. Introduction
Virtual MODELA USER'S MANUAL
 Virtual MODELA USER'S MANUAL Virtual MODELA is a program that simulates the movement of the tool on the screen. Contents Contents Part 1 Introduction 1-1 System Requirements... 4 1-2 Overview of Virtual
Layout and display. STILOG IST, all rights reserved
 2 Table of Contents I. Main Window... 1 1. DEFINITION... 1 2. LIST OF WINDOW ELEMENTS... 1 Quick Access Bar... 1 Menu Bar... 1 Windows... 2 Status bar... 2 Pop-up menu... 4 II. Menu Bar... 5 1. DEFINITION...