MESURgauge Software. User s Guide
|
|
|
- Sydney Wood
- 6 years ago
- Views:
Transcription
1 MESURgauge Software User s Guide
2 Thank you Thank you for purchasing MESURgauge software, a data collection and analysis program developed to: Measure Collect data from digital force gauges, torque gauges, test stands, travel displays, and other devices. Graph View a real time graph of load vs. time or travel. Analyze View an analysis graph, calculate statistics, and zoom to selected locations on the graph. Store Save results to a file, or export directly to Microsoft Excel TM. Save and recall previously saved test data, test setups and gauge configurations. MESURgauge expands the functionality of a Mark-10 testing system, typically comprising a test stand, force gauge, grips, and accessories. This User s Guide provides detailed operating instructions. For additional information or answers to your questions, please do not hesitate to contact us. Our technical support and engineering teams are eager to assist you. TABLE OF CONTENTS STARTUP... 2 PORT CONFIGURATION TAB...5 TEST SETUP TAB...7 ACQUISITION TAB...10 ANALYSIS TAB...14 DIGITAL DISPLAY TAB...17 GAUGE SETTINGS TAB...17 REPORT TAB...19 TROUBLESHOOTING
 is required to communicate with an instrument. A second COM port is needed to communicate with a digital travel display.")
3 1 STARTUP 1.1 Computer Requirements A PC running Microsoft Windows XP or later operating system with screen resolution of 1024 x 768 minimum is required to run MESURgauge software. An RS-232C serial port or USB port ( COM Port) is required to communicate with an instrument. A second COM port is needed to communicate with a digital travel display. If USB communication is required, be sure to install the appropriate USB driver. A USB driver is included with Mark-10 instruments as well as the RSU100 RS-232 to USB adapter. 1.2 Installation Instructions Insert the MESURgauge installation CD into the computer s CD-ROM drive. If AutoRun is enabled on the computer, the setup program will run automatically. If not, the setup program may be run manually. Click the START button on the Windows task bar, select Run, type D:Setup in the dialog box and press ENTER. Alternately, using My Computer or Windows Explorer, navigate to the CD-ROM drive and double-click the file Setup.exe. Follow the prompts on the screen to install MESURgauge. 1.3 Running MESURgauge Software When the installation is complete, run MESURgauge by clicking the Windows START button, locating MESURgauge by Mark-10 under Programs, and then clicking MESURgauge. You must enable full Administrator privileges on your PC to ensure proper functioning of MESURgauge. 1.4 Windows Security Settings Procedure for Windows 7 & 8 1. Log on to Windows as an administrator or as a user with administrator privileges. 2. Right-click on the MESURgauge software icon on the Desktop, select Properties, and then click the Compatibility tab. 3. At the bottom of the screen, check the box Run this program as an administrator. Then click the button below it, labeled Change settings for all users. Then, click OK. Procedure for Windows XP Note: This procedure may only be needed if your administrator has changed the settings. 1. Log on to Windows as an administrator or as a user with administrator privileges. 2. Right-click the MESURgauge software icon on the Desktop, select Properties, then click Find Target. Navigate to the program folder directory in Windows Explorer where MESURgauge was installed (default location is C:\Program Files\Mark-10 Software). 3. Right-click the Mark-10 Software folder and select Properties. In the Security tab click Advanced, then click on all of the users or groups desired and click Edit. Check the Allow Full control box. Then click OK three times to close the dialog boxes. If further instructions are required, consult with your IT administrator. 2

4 1.5 MESURgauge Overview MESURgauge is divided into tabs, each with its own set of functions: Acquisition Start and stop the test, view live table and graph. Analysis View table, graph, and statistics, zoom in on graph, save and recall test data, export to Excel. Digital Display View live data in large format. Test Setup Configure test start and stop conditions, test units, single vs. continuous readings, default file locations. Port Configuration Configure communication parameters. Gauge Settings Convenient interface for configuring certain Mark-10 gauges. Report Generate a report for the test data. 1.6 System Configuration Menu MESURgauge can be customized to interface with various test equipment through the Test Setup and Port Configuration tabs (details in the following sections). However, it is not necessary to manually input these parameters for typical Mark-10 configurations. The System Configuration menu lists common test configurations, plus a simulated data mode for evaluation purposes. Clicking on one of these selections will automatically populate the parameters of the aforementioned tabs as required (only the COM port number may need to be adjusted). The options are as follows: 1. Gauge Only For connecting a Mark-10 gauge directly to a PC. MESURgauge is able to plot load vs. time at up to 50 samples per second. This configuration requires one available port on the computer, and a USB or RS-232 cable. Typical system: M3-20 force gauge (USB cable included) Instrument baud rate: Set gauge to 9, Gauge + Travel Display For connecting a Mark-10 gauge directly to a PC utilizing one channel and a Mitutoyo travel display to a PC utilizing the other channel. MESURgauge is able to plot load vs. distance at up to 2 samples per second. This configuration requires two available USB or serial ports, and cables/adapters. Typical system: ES30 test stand, ESM001 travel display option, M4-100 force gauge (USB cable included), cable, MRS100A converter, RSU100 converter Instrument baud rates: Set gauge to 9,600, travel display baud rate is fixed 3
 at up to 50 samples per second.")
5 3. Gauge + ESM301 / ESM1500 / DC Controller with Travel For connecting an ESM301, ESM1500, or DC4040 controller (for use with TSTM-DC torque test stand) with integrated travel encoder to a PC utilizing one channel. MESURgauge is able to plot load vs. distance (or angle) at up to 50 samples per second. The gauge is connected to the test stand controller, and the controller is connected to a PC. This configuration requires one available USB or serial port, and appropriate cables/adapters. Typical system: ESM301 test stand, ESM integrated travel indication option, M5-200 force gauge, cable, cable, RSU100 converter Instrument baud rates: Set test stand to 115,200, set gauge to 9, Gauge + ESM301 / ESM1500 / DC Controller without Travel For connecting an ESM301, ESM1500, DC4010, or DC4030 controller without integrated travel encoder to a PC utilizing one channel. MESURgauge is able to plot load vs. time at up to 50 samples per second. The gauge is connected to the test stand controller to allow for functions such as overload protection and stop/reverse at load set points. The controller is connected to a PC. This configuration requires one available USB or serial port, and cables/adapters. Typical system: TSFM500-DC test stand, M5-500 force gauge (USB cable included), cable, cable, RSU100 converter Instrument baud rates: Set test stand to 115,200, set gauge to 9, Simulated Gauge For evaluating the functionality of MESURgauge without any instruments present. Simulated data is used to populate the graph and table. Note: If using the same configuration repeatedly, it is recommended to save the Port Configuration tab settings and Test Setup tab settings as default. To do so, click SAVE AS DEFAULT in both tabs. Refer to the following sections for details. 1.7 Other Menus File Factory Defaults Click to restore the factory default settings. Close Click to exit MESURgauge. Help Show Tip Strips Check this box to show tip strips (also known as tool tips ). These are text boxes that appear when the cursor hovers over an object or area of the screen. MESURgauge User s Guide Click to open the user s guide PDF document. (Note: Adobe Reader is required and is downloadable at Mark-10 Website Click this to link to the Mark-10 website. (About) Click the MESURgauge logo to display general software information. 4

6 2 PORT CONFIGURATION TAB Use this screen to configure the computer s COM port settings to which the instruments are connected. The default settings are the same as the factory default settings for Mark-10 instruments. This tab, along with the Test Setup tab, allows the user to override settings as applied by selection of one of the four typical configurations from the previous section. For most configurations it is unnecessary to make any changes in this tab, with the exception of the COM port number. 2.1 Gauge Port Settings COM Port Select the COM port that the instrument is connected to from the drop-down list. Clicking REFRESH updates the list with all installed ports. The COM port associated with the instrument can be identified under the Ports sub-section of Device Manager in Windows. Baud Rate Select the baud rate of the serial port. The default setting is 9600 baud. Be sure to configure the baud rate to match that of the instrument. Data Bits Select the number of data bits for the serial port, then click the APPLY button below. The default setting is 8 data bits. Parity Select the parity setting of the serial port. The default setting is None (no parity). 5
7 Stop Bits Select the number of stop bits for the serial port. The default setting is 1 stop bit. APPLY Click this button to apply changes to the above settings. 2.2 Reading Request String String to Write Enter the command string to request a reading from the instrument. The default string is? (no quotes). Select either or both of the CR and LF check boxes to append the string as required. CR (default) or CR-LF may be used for Mark-10 instruments. The default string can be recalled by right-clicking in the box and selecting "Reinitialize to Default Value". The ability to specify the request data command adds flexibility in testing. For example, peak or average readings may be read from the instrument. Additionally, it allows for the compatibility of MESURgauge with instruments not manufactured by Mark-10. String Read This is the raw character string read from the instrument. Display Codes Display control character '\' codes (\r = carriage return, \n = line feed, \s = space) 2.3 Gauge Name Optionally enter a name to be associated with the settings in this text box. This is helpful in identifying the particular instrument or system being used. This name is automatically entered in the file dialog box which opens when the SAVE configuration button is clicked. 2.4 Simulated Gauge Check this box to simulate data being received from an instrument. No serial connection is needed to an instrument. To start collecting data, click the Acquisition tab and click the START button. Data will populate the graph and table at the specified rate. This is provided for demonstration purposes only. This box is automatically checked when Simulated Gauge is selected from the System Configuration menu. 2.5 Travel Port Settings These settings apply to the second COM port. This COM port is intended only for use with an external digital travel display. 2.6 Travel & Load Data on Same Port Check this box for MESURgauge to accept two strings of data on one COM port, required when sending force and travel data from an ESM301 or ESM1500 test stand. Configure the data string as required by selecting the appropriate line numbers, field numbers, and field delimiter. The default settings apply to Mark-10 test stands. 2.7 Configuration File Folder Enter a full path or browse for a folder to use for Gauge Configuration (*.cfg) files. To browse for a folder, click the folder icon at the right of the text box and navigate to or create the desired folder, then click the "Current Folder" button in the dialog box. 2.8 Shared Buttons SAVE Click this button to open a file dialog box prompting to save the current settings to a configuration file (this file has a.cfg extension). Any file name may be entered and any folder may be selected or created. SAVE AS DEFAULT Clicking this button saves the current settings to the default configuration file Default.cfg. (No file dialog box opens.) 6

8 Note: Clicking this button only saves settings in the Port Configuration tab it does not save settings in the Test Setup tab. RECALL Click this button to open a dialog box in which to browse for previously saved configuration files. Parameter fields will be populated based on the information in the configuration file. 3 TEST SETUP TAB Use this tab to configure various parameters for the test. This includes test start and stop conditions, pass/fail limits, selection of continuous or single readings, and data sampling rate. 3.1 Start Condition Select an option button for time delay, load threshold, or travel to begin the test. Time Set time delay, in seconds, to begin the test. Load Set a load threshold to begin the test (the load units are as specified in the Select Units drop-down list box in the upper right area of this tab). Travel Set a travel distance threshold to begin the test. The second COM port must be enabled for this selection to be made (the travel units are as specified with the Inches / Millimeter option buttons in the right-center area 7
9 of this tab). 3.2 Stop Condition Select an option button for time, load, number of readings, or travel position to stop data collection. Time Seconds Set the duration of the test, in seconds. Load Threshold Set the load threshold at which to terminate the test (the load units are as specified in the Select Units drop-down list box in the upper right area of this tab). See Stop Threshold Options below for various load stop threshold options. Number of Readings Readings Set the number of readings at which to terminate the test. Travel Set the travel threshold to end the test. The second COM port must be enabled for this selection to be made (the travel units are as specified with the Inches / Millimeter option buttons in the right-center area of this tab). 3.3 Load Stop Condition Four test stop options based on load threshold are available: Rising Edge Stop threshold is higher than the start threshold (increasing load). Falling Edge 1 Stop threshold is lower than start threshold (decreasing load). Falling Edge 2 Stop threshold is higher than Start threshold, but the load is decreasing. Break Detect Stop the test when the load decreases to a specified percentage of the maximum (peak) reading during the test. 3.4 Reading Mode Single Readings When this option is selected, single readings are taken from the instrument each time READ is clicked, or the DATA button on the instrument is pressed. This button appears below the graph in the Acquisition tab when this option is selected. Continuous Readings When selected, readings are requested from the instrument at a rate set in the Readings per Second field. Readings per Second This numeric box sets the number of readings per second that MESURgauge requests data from the instrument in the Continuous Readings mode. Available range is to 50 readings per second. Note: When using a Mitutoyo brand travel display, it is recommended to limit the readings per second at 2, to prevent communication errors. 3.5 Invert Load Check this box to invert the polarity (sign) of the load reading. This is useful, for example, in tensile strength testing. Tension readings, which have a negative sign, can be reversed so that the graph shows increasing values instead of decreasing values. 8
10 Note: There is another instance of this check box in the Acquisition tab. Checking one box automatically checks the other. 3.6 Test Units Select Units The instrument s unit of measurement can be set by clicking on the appropriate selection from the dropdown menu. SET Sets the instrument to the units of measurement selected. READ Reads the unit of measurement to which the instrument is currently set. Units Read Displays the unit of measurement to which the instrument is currently set. Note: Reading and setting units is possible with Mark-10 instruments only. 3.7 Travel Port This section refers to the input of travel data in addition to load data. Data may be received from an external travel display or through the integrated encoders from certain Mark-10 test stands. Travel readings are tabulated and plotted vs. load instead of load vs. time. Enable Check this box to enable the second COM port for travel data collection. The settings for this port can be configured in the Port Configuration tab. Invert Travel Check this box to invert the polarity (sign) of the readings from the travel display. 3.8 Pass / Fail Limits Check this check box to enable high and low indicators for go / no go type testing. When checked, Pass, Fail High, and Fail Low indicators appear in the Acquisition tab, below the STOP button. 3.9 Folders Enter full paths or browse for folders to use for Test Data (*.log) and Test Setup (*.tst) files. To browse for a folder, click the folder icon at the right of the text box and navigate to or create the desired folder, then click the "Current Folder" button in the dialog box Shared Buttons SAVE Opens a file dialog box in which to save the current settings to a test setup file (.tst extension). Any file name may be entered and any folder may be selected or created. SAVE AS DEFAULT Clicking this button saves the current settings to the default test setup file, Default.tst. Note that clicking this button only saves settings in the Test Setup tab it does not save settings in the Port Configuration tab. RECALL Click this button to open a dialog box in which to browse for previously saved test setup files. Parameter fields will be populated based on the information in the test setup file. 9

11 4 ACQUISITION TAB Use this tab to view tabular and graphical data from an instrument as it is being received. When the START button is clicked, data will be graphed and tabulated, commencing when the start condition in the Test Setup tab is met. The test ends automatically when the stop condition in the Test Setup tab is met. The test can also be ended at any time by clicking the STOP button. Specific load and time (or travel) data points are displayed in the fields below the table. 4.1 START Starts a test. Readings from the instrument are captured when the start condition in the Test Setup tab is met. When data is being captured, the Acquiring Data indicator above the START button illuminates (bright green). 4.2 STOP Stops a test. The test will stop automatically when the selected stop condition in the Test Setup tab has been met. When the test is completed, the Acquiring Data indicator turns off (dark green). 4.3 Table Contains the reading number, load reading from the instrument, and relative time stamp (or travel datum) for each data point. Scroll to, or manually enter, the desired reading in the Reading box to display corresponding load and time (or travel) data in the indicators to the right. 4.4 SAVE Click this button to open a file dialog box in which to save the data from the table to a tab-delimited text file. Enter a file name and optionally browse to any desired folder location. The default file folder location for the test data files is set in the Test Data Folder box in the Test Setup tab. After saving, the file can then be opened by common Windows programs such as Notepad and Excel. Note: Saving cannot be performed until the test has been completed. 10
![4.5 Last Reading The most recent reading received from the instrument. 4.6 Total Readings The total number of readings taken during the test. 4.7 Units The unit of measurement received with the data (the instrument[s] must be configured to send Units information).](/docs-images/79/80310361/images/12-0.jpg "4.8 Graph The graph plots load versus time or load versus travel (time is default). Scale minimum and maximum values can be set by double-clicking on the numerals long the X and Y axes.")
12 4.5 Last Reading The most recent reading received from the instrument. 4.6 Total Readings The total number of readings taken during the test. 4.7 Units The unit of measurement received with the data (the instrument[s] must be configured to send Units information). 4.8 Graph The graph plots load versus time or load versus travel (time is default). Scale minimum and maximum values can be set by double-clicking on the numerals long the X and Y axes. Change the numbers to the desired values and press ENTER or click away from the numbers. Several options are available by right-clicking anywhere within the graph. A pop-up menu appears as follows: The menu items are provided for quick access and convenience to some common functions. The AutoScale X and Y items are equivalent to the padlock icon on the scale palette at the lower right of the graph, described below. 4.9 Plot Data This box is normally checked to permit data plotting in the graph. However, if Continuous Readings is selected in the Test Setup tab, the effective data acquisition rate could begin to slow (regardless of the Readings per Sec. setting) after hundreds or thousands of data points are collected. To prevent a reduction in this rate, uncheck the Plot Data box, and view the graph in Analysis tab after the test is complete Tools (under the graph) View Clicking on this button brings up the following six viewing options: Set a zoom window with adjustable x- and y- dimensions for a specific part of the graph Set a zoom window with adjustable x-dimension for a specific part of the graph Set a zoom window with adjustable y-dimension for a specific part of the graph View entire graph Zoom out Zoom in 11
. Auto-scale Click to auto-scale the axis.")
 Several plot options are available by clicking on the Plot Palette icon.")
13 Pan This allows the user to reposition the graph. Click on the graph, move and release the mouse button. the mouse to the desired location, 4.11 X- & Y-scale Settings Auto-scale lock When in the locked position, the scale is in auto-scale mode (default). Auto-scale Click to auto-scale the axis. Scale & grid properties Click to adjust various scale and grid properties. A pop-up context menu provides access to these properties Plot Palette (upper right corner of the graph) Several plot options are available by clicking on the Plot Palette icon. A menu of options will appear as follows: Plot settings and graph properties can be configured as desired Graph Colors 12


14 Background Color Picker Box Select the background color of the graph. Set Sets the graph to the selected background color. Defaults Restores the background, plot, and grid colors to factory defaults Pass/Fail Indicators When the Use Limits check box in the Pass/Fail Limits frame in the Test Setup tab is checked, the Pass/Fail indicators, shown below, become visible. While acquiring data, the load values received are compared to the upper and lower limits set in the Test Setup tab, and the appropriate indicator illuminates. A fail condition is represented by a bright red indicator. A pass condition is represented by a bright green indicator Pass/Fail Limit Lines Horizontal lines corresponding to the pass/fail limits set are displayed on the graph in red Invert Load See earlier sections Invert Travel This checkbox is not visible unless the travel port is enabled in the Test Setup tab ZERO GAUGE Zeroes a Mark-10 gauge display CLEAR GAUGE Clears the peaks and starts a new averaging or external trigger test (if a compatible gauge is enabled) ZERO TRAVEL Zeroes the travel display on a compatible Mark-10 test stand controller. 13

15 5 ANALYSIS TAB This tab is used to analyze the data obtained following a test. Saved data in an instrument may also be downloaded into this tab. Statistics are calculated and displayed automatically upon completion of the test or download of saved data. The graph cursor tools can be used to zoom to a specific area of the graph. Statistics may then be calculated for that region of the graph. Graph and table data from the Acquisition tab is automatically transferred to this graph and table when the test has been completed. 5.1 Graph Graph functionality and tools are the same as in the Acquisition tab, with one additional active icon: Cursor Movement Tool Clicking this button allows the X-Y cursor to be dragged to the desired position. Pass/Fail Limit Lines Horizontal lines corresponding to the pass/fail limits set are displayed on the graph in red. 5.2 REFRESH GRAPH Redraws the graph based on the data collected during the test. 14

16 5.3 Cursor Palette Center Cursor Centers the cursor in the graph area. Cursor Control Click on the quadrants of this icon to move the cursor in the corresponding direction. Cursor Table Displays the cursor position s X and Y values. Reading Number at Cursor Reading number corresponding to the current position of the cursor. 5.4 Download Memory Downloads saved data from a Mark-10 instrument. The instrument must be in the main operating mode (i.e. not in a menu or configuration area). A communication error message will appear if an incompatible instrument is used or it is not in the main operating mode. Note: The START button in the Acquisition tab must be pressed before memory download is possible. 5.5 Graph Colors The graph color selection functionality is the same as described in the Acquisition tab. 5.6 Statistics This frame displays statistical data for the test. Time / Travel / Reading Number Range Customize a data range, based on time, travel distance, or reading numbers. Minimum (data range) Minimum value in the desired data range. Maximum (data range) Maximum value in the desired data range. Maximum (statistic) The maximum load reading measured during the test. Minimum (statistic) The minimum load reading measured during the test. Average The average (mean) of the readings. Note that in situations where load fluctuates between positive and negative values, this function considers polarity, not the absolute values (for example, the average of +5 and -5 is calculated as 0). 15
17 Area Under Curve The average of the absolute values of the load readings multiplied by the selected time interval. Standard Deviation The standard deviation for the acquired data. The above statistics are based on the data range specified in the X-scale Settings frame. This range defaults to the full range at completion of the test. This range can be modified by entering the desired range in the Minimum and Maximum numeric boxes. Click the CALCULATE button to calculate the statistics for the specified range. The graph will automatically adjust to reflect the new range. 5.7 Table The table functionality is the same as described in the Acquisition tab. 5.8 RECALL Recall a previously saved test data file. The table and graph will be populated with the previously saved data, and the statistics will be automatically calculated for these data. Note: When recalling a test which used the travel port for travel measurement, or single readings, those options must be selected in the Test Setup tab in order for the x-axis label of the graph and the statistics to be displayed correctly. 5.9 SAVE Opens a file dialog box prompting to save the data from the table to a tab-delimited text file. Enter a file name and optionally browse to any desired folder location. The default file folder location for the test data files is set in the Test Data Folder box in the Test Setup tab. After saving, the file can then be opened by common Windows programs such as Notepad and Excel Export to Excel Clicking this button launches Microsoft Excel TM (if installed, sold separately) and populates a worksheet containing reading numbers, load, and time or travel directly into a worksheet. 16

18 6 DIGITAL DISPLAY TAB This tab is provided to display real time load readings (and, if the travel port is enabled, travel readings) in large numerals. If the Graph and Tabulate Data check box is checked, the graph and table in the Acquisition tab is populated. Data acquisition may be started and stopped from this tab, as with the Acquisition tab. See image below: 7 GAUGE SETTINGS TAB This tab provides a convenient utility with which to read and set gauge configuration parameters from a PC. Settings are applicable only for Mark-10 Series 7 / 5 gauges, as well as legacy Series BG / CG gauges. Select the appropriate gauge at the bottom right corner of the screen. Changes may only be made if the gauge is connected directly to the PC (i.e. not through a test stand such as the ESM301). Refer to the gauge s user s guide for details on the various parameters. In the lower left-hand part of the screen, it is possible to enter commands to send to any instrument via the primary serial port. 17

19 7.1 READ Populates the fields above with current settings from a Mark-10 gauge. 7.2 SAVE Saves the current gauge settings to the gauge s non-volatile memory. These will be the default settings when the gauge powers on. Note: The desired settings must be individually written to the gauge (by clicking the Set button adjacent to the parameter menu) before clicking SAVE. It is recommended to click the READ button to confirm the current settings before clicking SAVE. 7.3 Set Buttons (all) Click to set the Mark-10 gauge with the parameter selected from the drop-down menu adjacent to the respective Set button. 7.4 String to Send to Gauge Enter a command to send to the gauge via the primary serial port. This facility allows the user to communicate with and send commands to any gauge. Click Send to send the command. 7.5 String Read from Gauge This text box shows the response string, if any, that is received in response to the above command. 7.6 Display Codes Display control character '\' codes (\r = carriage return, \n = line feed, \s = space). 18

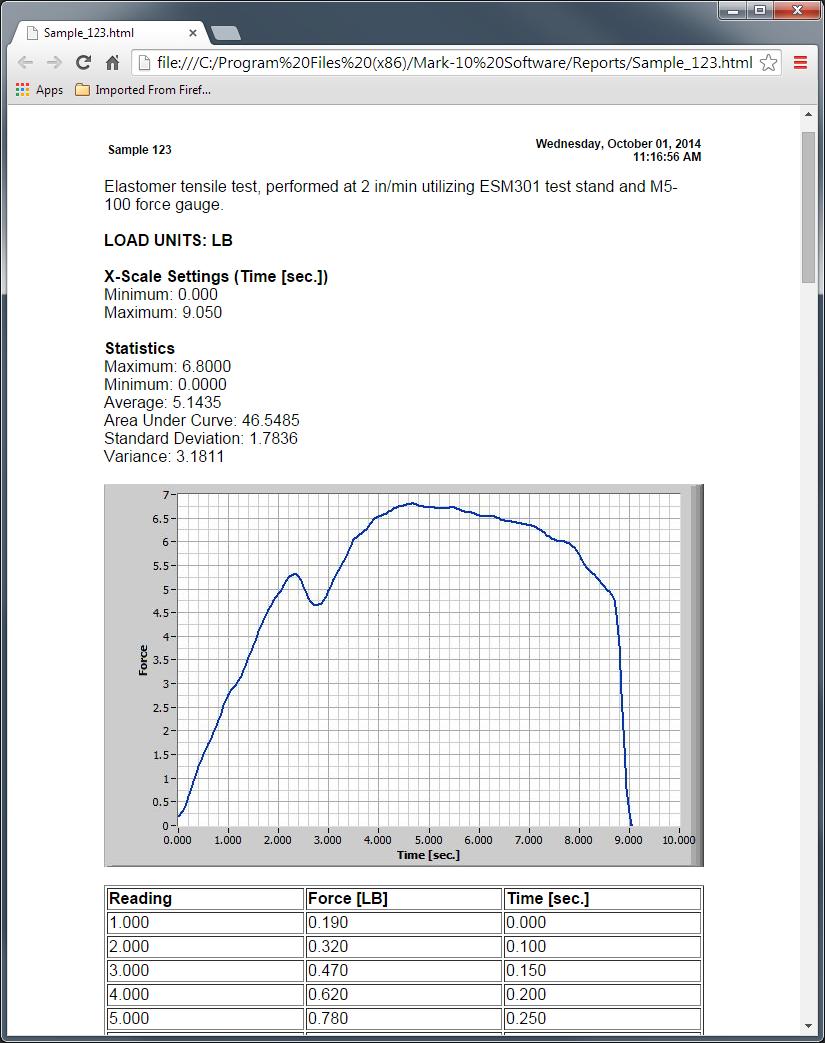
20 8 REPORT TAB Use this tab to set up a report for the saved data. The report may be printed or saved as an HTML file. A report template may be saved and recalled. 8.1 Select Printer Select the printer to which the report will print. The Windows default printer is selected initially. 8.2 PRINT Sends the report to the selected printer. 8.3 HTML Report Folder Enter or browse for a folder in which to save the report files. 8.4 SAVE Opens a file dialog box prompting to save the report. Enter a file name and optionally browse to any desired folder location. The default file folder location for report files is set in HTML Report Folder, as described above. 8.5 Left Header Text Enter text to appear in the upper left corner of the report. The text will appear as bold in the report. 8.6 Right Header Check Boxes Check the Date and/or Time boxes to include the current date and/or time in the right header of the report. Date and time will appear as bold in the report. 19
21 8.7 Initial Text Enter any initial text here. 8.8 Additional Text Enter any additional text here. 8.9 Conclusion Text Enter any concluding text here Left Footer Text Enter text to appear in the lower left corner of the report. The text will appear as bold in the report Right Footer Text Enter text to appear in the lower left corner of the report. The text will appear as bold in the report. Use the above text boxes to enter information and comments pertaining to the test. This information can be saved to a file as a template and can be recalled Include Statistics Check this check box to include statistics in the report Include Graph Check this check box to include an image of the graph in the report Include Table Check this check box to include the table data in the report Include Table Grid Check this check box to include a grid for the table Save Template Saves a template of all the information in the text boxes and selected settings to a file for recall Recall Template Recalls a previously saved template. A sample HTML report is shown below as it would appear in a browser: 20
22 21

23 9 TROUBLESHOOTING 1. Error message: No data received... This message appears when communication has not been achieved between the instrument and MESURgauge, due to a number of possible causes. Refer to the communication flowchart on the following page. If following these instructions does not resolve the issue, PC hardware problems may be the cause. Consult with your IT administrator. 2. Sometimes MESURgauge displays random or inconsistent data, such as random spikes or zero values. Disable the auto-output function in the gauge, or reduce the frequency of data collection. 3. MESURgauge prompts me to enter the serial number when opened. In Windows, enable full Administrator privileges for the MESURgauge program folder. Refer to the Setup section for details. 4. Test Setup and Port Configuration setup files and default setup files are not saved when closing and reopening MESURgauge. Enable full Administrator privileges, as indicated above. 5. The graph is upside down. The Load (y-axis) and Time / Travel (x-axis) values can be inverted to achieve the desired graph appearance. Checkboxes are provided in the Acquisition and Test Setup tabs. Some gauges can also be configured to output data with reversed polarity or without polarity (compression readings are normally positive, tension values are negative). 6. The START and STOP buttons do not start and stop test stand travel. MESURgauge is a data collection program only. It does not have test stand control capabilities. 7. The data acquisition rate (number of readings per second) decreases as more data points are collected. Live graphing in the Acquisition tab can slow down the data acquisition rate over the course of hundreds or thousands of collected data points. To prevent a reduction in this rate, uncheck the Plot Data box in the Acquisition tab. The graph may be viewed in the Analysis tab after the test is complete. 22

24 8. Communication Flowchart 23
25 NOTES: 24
26 Mark-10 Corporation has been an innovator in the force and torque measurement fields since We strive to achieve 100% customer satisfaction through excellence in product design, manufacturing and customer support. In addition to our standard line of products we can provide modifications and custom designs for OEM applications. Our engineering team is eager to satisfy any special requirements. Please contact us for further information or suggestions for improvement. Force and torque measurement engineered better Mark-10 Corporation 11 Dixon Avenue Copiague, NY USA MARK-TEN Tel: Fax: Internet: REV
MESURgauge Software. User s Guide
 MESURgauge Software User s Guide MESURgauge Software Thank you! Thank you for purchasing MESURgauge software, a data collection and analysis program developed to: Measure Collect data from digital force
MESUR TM gauge Software MESUR TM gauge Plus Software. User s Guide
 MESUR TM gauge Software MESUR TM gauge Plus Software User s Guide Thank you Thank you for purchasing MESURgauge / MESURgauge Plus software, applications developed to: Measure Collect data from digital
User s Guide. Model PTA PLUG & TEST TM ADAPTER
 Model PTA PLUG & TEST TM ADAPTER Thank you Thank you for purchasing a Mark-10 Model PTA Plug & Test TM Adapter and software, used to connect common strain gage-based load cells, force sensors, and torque
Digital Controllers Series DC MODEL DC4010 / ESMH-DC MODEL DC4020 / ESM-DC MODEL DC4030 / TSFM500-DC MODEL DC4040 / TSTM-DC.
 Digital Controllers Series DC MODEL DC4010 / ESMH-DC MODEL DC4020 / ESM-DC MODEL DC4030 / TSFM500-DC MODEL DC4040 / TSTM-DC User s Guide Series DC Digital Controllers Thank you! Thank you for purchasing
Navigator Software User s Manual. User Manual. Navigator Software. Monarch Instrument Rev 0.98 May Page 1 of 17
 User Manual Navigator Software Monarch Instrument Rev 0.98 May 2006 Page 1 of 17 Contents 1. NAVIGATOR SOFTWARE 2. INSTALLATION 3. USING NAVIGATOR SOFTWARE 3.1 STARTING THE PROGRAM 3.2 SYSTEM SET UP 3.3
VANGUARD LOAD TAP CHANGER ANALYZER (LTCA) VERSION 2.xx SOFTWARE MANUAL. LTCA-10, LTCA-40, WRM-10P, WRM-40, TRM-20, TRM-40, TRM-203, and TRM-403
 VERSION 2.xx SOFTWARE MANUAL. LTCA-10, LTCA-40, WRM-10P, WRM-40, TRM-20, TRM-40, TRM-203, and TRM-403") VANGUARD LOAD TAP CHANGER ANALYZER (LTCA) VERSION 2.xx SOFTWARE MANUAL For Use with Vanguard s LTCA-10, LTCA-40, WRM-10P, WRM-40, TRM-20, TRM-40, TRM-203, and TRM-403 Load Tap Changer Analyzers and Winding
VANGUARD LOAD TAP CHANGER ANALYZER (LTCA) VERSION 2.xx SOFTWARE MANUAL For Use with Vanguard s LTCA-10, LTCA-40, WRM-10P, WRM-40, TRM-20, TRM-40, TRM-203, and TRM-403 Load Tap Changer Analyzers and Winding
Cal-Bay Systems XY Plotter, Time-Base Recorder, Automated Tester. Users Guide. Rev 3.1
 Cal-Bay Systems XY Plotter, Time-Base Recorder, Automated Tester Users Guide Rev 3.1 Contents... 1 Quick Start Guide... 2 Selecting a Test Specification... 3 Clearing Traces... 4 Saving Traces...4 Loading
EZCT-2000 Software. VERSION 2.x USER'S MANUAL
 EZCT-2000 Software VERSION 2.x USER'S MANUAL For Use with Vanguard s EZCT-S2, EZCT-S2A, EZCT-2000, EZCT-2000A, EZCT-2000B, EZCT-2KA, EZCT-2000C Current Transformer Testers Vanguard Instruments Company,
SeeG3 Users Manual V2.00 Micro-g Solutions Inc. Erie, Colorado, USA
 SeeG3 Users Manual V2.00 Micro-g Solutions Inc. Erie, Colorado, USA September, 2003 Table of Contents Table of Contents 0 Table of Contents 1 Introduction 2 System Requirements 2 Installing SeeG3 3 SeeG3
CyberComm Pro 2.4 Data Acquisition Software Installation & User Guide. CyberScan DO 1500
 CyberComm Pro 2.4 Data Acquisition Software Installation & User Guide CyberScan DO 1500 Bench Dissolved Oxygen Meter Technology Made Easy... 68X292341 Rev.0 01/04 PREFACE Thank you for selecting the CyberScan
Series STA DIGITAL TORQUE TOOL TESTERS. User s Guide
 Series STA DIGITAL TORQUE TOOL TESTERS User s Guide Series STA Torque Tool Testers Thank you! Thank you for purchasing a Mark-10 Series STA Digital Torque Tool Tester. We are confident that you will get
Series CTA CAP TORQUE TESTERS. User s Guide
 Series CTA CAP TORQUE TESTERS User s Guide Series CTA Cap Torque Testers Thank you! Thank you for purchasing a Mark-10 Series CTA Cap Torque Tester. We are confident that you will get many years of service
CyberComm Pro Data Acquisition Software Installation & User Guide
 CyberComm Pro 2.2.3 Data Acquisition Software Installation & User Guide ph 1100 and ph 2100 Bench ph and Bench ph/ion Meter Technology Made Easy... 68X090822 rev 1 Aug 2002 2 PREFACE Thank you for selecting
Software Installation and Quick Start Guide. PowerMax-Pro PC
 Software Installation and Quick Start Guide PowerMax-Pro PC Software Installation and Quick Start Guide PowerMax-Pro PC 27650 SW 95th Ave. Wilsonville, OR 97070 This document and software is copyrighted
Working with Charts Stratum.Viewer 6
 Working with Charts Stratum.Viewer 6 Getting Started Tasks Additional Information Access to Charts Introduction to Charts Overview of Chart Types Quick Start - Adding a Chart to a View Create a Chart with
SERVICE MANU SER VICE MANU
 SERVICE MANUAL H ow t o U s e Table of Contents 1. 2. 3. 4. 5. 6. Launching the Service Manual Setting up the Service Manual icon Shutting down the Service Manual Basic controls Basic controls of Acrobat
CVI SPECTRAL PRODUCTS. 111 Highland Drive Putnam CT, (860) SM32Pro
 SM32Pro") CVI SPECTRAL PRODUCTS 111 Highland Drive Putnam CT, 06260 (860) 928-5834 SM32Pro 2.8.28 Table of Contents Warranty and Liability 1 Quick Start Installation Guide 2 System Requirements 3 Requirements for
CVI SPECTRAL PRODUCTS 111 Highland Drive Putnam CT, 06260 (860) 928-5834 SM32Pro 2.8.28 Table of Contents Warranty and Liability 1 Quick Start Installation Guide 2 System Requirements 3 Requirements for
Series ST. User s Guide DIGITAL TORQUE TOOL TESTERS. .com. Series ST Torque Tool Testers. User s Guide
 Series ST DIGITAL TORQUE TOOL TESTERS.com Mark-10 Corporation has been an innovator in the force and torque measurement fields since 1979. We strive to achieve 100% customer satisfaction through excellence
User s Guide. Series CT CLOSURE TORQUE TESTER. User s Guide
 User s Guide Series CT CLOSURE TORQUE TESTER User s Guide Series CT Closure Torque Testers User s Guide Thank you! Thank you for purchasing a Mark-10 Series CT Torque Tester. We are confident that you
41126 Cognento (MODENA) Italy Via Bottego 33/A Tel: +39-(0) Internet: Fax: +39-(0)
 Italy Via Bottego 33/A Tel: +39-(0) Internet: Fax: +39-(0)") QUICK ANALYZER User Guide Version 5.3 Index 1.0 Generality... 2 LICENSE AGREEMENT... 3 2.0 Channels Configuration... 4 2.1 IdroScan Data Log Management... 6 3.0 Test Results... 9 4.0 Excel Export... 10
QUICK ANALYZER User Guide Version 5.3 Index 1.0 Generality... 2 LICENSE AGREEMENT... 3 2.0 Channels Configuration... 4 2.1 IdroScan Data Log Management... 6 3.0 Test Results... 9 4.0 Excel Export... 10
Nellcor Pulse Oximetry Analytics Tool User Guide
 Nellcor Pulse Oximetry Analytics Tool User Guide I. DESCRIPTION OF THE NELLCOR ANALYTICS TOOL The Nellcor Analytics Tool (NAT) software facilitates the transfer of patient data to the end-user s personal
Grain Tracker Operators Manual
 Grain Tracker Operators Manual Ft. Atkinson, Wisconsin USA Pannigen, The Netherlands www.digi-star.com D3833-US Rev A April 15, 2009 Grain Tracker Software TABLE OF CONTENTS GRAIN TRACKER PC SOFTWARE...
BusinessObjects Frequently Asked Questions
 BusinessObjects Frequently Asked Questions Contents Is there a quick way of printing together several reports from the same document?... 2 Is there a way of controlling the text wrap of a cell?... 2 How
User Guide. Avery Dennison Web Ordering Solution for Steinmart
 User Guide Avery Dennison Web Ordering Solution for Steinmart March 2012 Copyright 2012 A very Dennison The information in this document is subject to change without notice and should not be construed
User s Guide. Series 3 DIGITAL FORCE GAUGES
 Series 3 DIGITAL FORCE GAUGES Thank you Thank you for purchasing a Mark-10 Series 3 digital force gauge, designed for tension and compression force testing applications from 0.12 lbf to 500 lbf (0.5 N
N2KExtractor. NMEA 2000 Data Extractor Software. User s Manual
 N2KExtractor NMEA 2000 Data Extractor Software User s Manual Revision 1.0.0 Copyright 2012 Maretron, LLP All Rights Reserved Maretron, LLP 9014 N. 23 rd Ave #10 Phoenix, AZ 85021-7850 http://www.maretron.com
Instruction Manual XLComm Data Acquisition Software For XL Series Meters
 Data Acquisition Software For XL Series Meters (XL 15, 20, 25, 30, 40, 50 and 60 meters) 68X090832 Rev. 0 JAN 07 Preface This manual serves to explain the use of the Acquisition Software. The manual functions
Guide to User Interface 4.3
 Datatel Colleague Guide to User Interface 4.3 Release 18 June 24, 2011 For corrections and clarifications to this manual, see AnswerNet page 1926.37. Guide to User Interface 4.3 All Rights Reserved The
AutoCAD 2009 User InterfaceChapter1:
 AutoCAD 2009 User InterfaceChapter1: Chapter 1 The AutoCAD 2009 interface has been enhanced to make AutoCAD even easier to use, while making as much screen space available as possible. In this chapter,
ZP Recorder INSTRUCTION MANUAL. Force Data Analyzer. For Force Gauge Models: ZP, ZPH and ZPS
 ZP Recorder Force Data Analyzer For Force Gauge Models: ZP, ZPH and ZPS INSTRUCTION MANUAL 2 YEAR WARRANTY (RESTRICTIONS APPLY) Imada, Inc. warrants its products to the original purchaser to be free from
Series E ERGONOMICS FORCE GAUGES. User s Guide
 Series E ERGONOMICS FORCE GAUGES Thank you Thank you for purchasing a Mark-10 Series E ergonomics force gauge, designed for tension and compression testing applications with a range of interchangeable
Model DFG-RSA Configurable Load Cell Adapter
 Model DFG-RSA Configurable Load Cell Adapter 1 Thank you Thank you for purchasing an Omega Model DFG-RSA adapter and software, used to connect common strain gage-based load cells, force sensors, and torque
BD CellQuest Pro Analysis Tutorial
 BD CellQuest Pro Analysis Tutorial Introduction This tutorial guides you through a CellQuest Pro Analysis run like the one demonstrated in the CellQuest Pro Analysis Movie on the BD FACStation Software
User's Guide. For CarChip and CarChip E/X 8210 & 8220
 User's Guide TM For CarChip and CarChip E/X 8210 & 8220 Product Number: 8210, 8220 Davis Instruments Part Number: 7395.064 DriveRight CarChip User s Manual Rev A (January 2, 2003) Davis Instruments Corp.,
Remote Display User Manual
 Remote Display User Manual 1 Contents Features... 3 Hardware Overview... 4 Quickstart Guide... 5 Android Application Operation... 6 Launching and Connecting... 6 Main Display... 7 Configuring Channels...
Track-It User s Guide. 1. Table of Contents. Track-It User Guide
 Track-It User s Guide Track-It is a PC based (Windows XP / Vista/ Windows 7) program to enable a user to program and view data from the Track-It series of micro data loggers. The program allows the loggers
User Guide 701P Wide Format Solution Wide Format Scan Service
 User Guide 701P44865 6204 Wide Format Solution Wide Format Scan Service Xerox Corporation Global Knowledge & Language Services 800 Phillips Road Bldg. 845-17S Webster, NY 14580 Copyright 2006 Xerox Corporation.
Sourcing - How to Create a Negotiation
 Martin Baker Secure Source-To-Pay Sourcing - How to Create a Negotiation December 07 Contents To Create a Project... To Create a Negotiation... 5 Attachments... 7 Private File Archive... 7 Creating Lines,
SeeSnake HQ User Guide
 SeeSnake HQ User Guide SeeSnake HQ Version 1.53.85.1426 23 May 2010 About SeeSnake HQ 3 Digital Technology 3 Installation and Updates 5 Windows XP 5 Windows Vista 5 Windows 7 5 The Home Window 6 Home Toolbar
Newage hardness testing
 Newage hardness testing DataView Data Acquisition Software Operation Manual Version 1.4.3 Newage Testing Instruments, Inc. reserves the right to alter designs, materials, and specifications when conditions
LEGENDplex Data Analysis Software Version 8 User Guide
 LEGENDplex Data Analysis Software Version 8 User Guide Introduction Welcome to the user s guide for Version 8 of the LEGENDplex data analysis software for Windows based computers 1. This tutorial will
Operator Manual. MS1000 Software. Trencher Monitoring System
 Operator Manual MS1000 Software Trencher Monitoring System MS1000 Software Trencher Monitoring System Operator Manual Release 1.2 This manual provides you with the basic information required to operate
Job Aid. Remote Access BAIRS Printing and Saving a Report. Table of Contents
 Remote Access BAIRS Printing and Saving a Report Table of Contents Remote Access BAIRS Printing a Report PDF HTML... 2 Remote Access BAIRS Printing a Report Export to PDF Interactive Reporting... 3 Remote
Work Smart: Windows 7 New Features
 About Windows 7 New Features The Windows 7 operating system offers several new features to help you work faster and more efficiently, and enable you to access the files, folders, programs, and applications
Spectrometer Visible Light Spectrometer V4.4
 Visible Light Spectrometer V4.4 Table of Contents Package Contents...3 Trademarks...4 Manual Driver and Application installation...5 Manual Application Installation...6 First Start of the Application...8
CHEMINSTRUMENTS DYNAMIC SHEAR TESTER MODEL DS-1000 OPERATING INSTRUCTIONS
 CHEMINSTRUMENTS DYNAMIC SHEAR TESTER MODEL DS-1000 OPERATING INSTRUCTIONS Overview...3 Operation...4 Load Cell Calibration...5 Units...5 Speed...5 Offset...5 Auto Return...6 Break Percent...6 Help...6
Software Manual. MadgeTech 4 Data Logger Software
 Software Manual MadgeTech 4 Data Logger Software Introduction 7 About MadgeTech, Inc... 7 Software Overview 8 Getting Started... 8 System Requirements...8 Software Installation: Installing the MadgeTech
Process Eye Professional. Recall
 Process Eye Professional Recall Process Eye Professional Recall User Manual SP104010.101 August 2005 As part of our continuous product improvement policy, we are always pleased to receive your comments
Logger Pro 3. Quick Reference
 Logger Pro 3 Quick Reference Getting Started Logger Pro Requirements To use Logger Pro, you must have the following equipment: Windows 98, 2000, ME, NT, or XP on a Pentium processor or equivalent, 133
New User Orientation PARTICIPANT WORKBOOK
 New User Orientation PARTICIPANT WORKBOOK INTEGRATED SOFTWARE SERIES New User Orientation PARTICIPANT WORKBOOK Version 2.0 Copyright 2005 2009. Interactive Financial Solutions, Inc. All Rights Reserved.
USB Instruments EasyLogger for PS40M10 "Swordfish" Help
 USB Instruments EasyLogger for PS40M10 "Swordfish" Help I EasyLogger for PS40M10 Help Table of Contents Part I Introduction 3 1 Welcome to... EasyLogger for PS40M10 3 2 EasyLogger... Features 4 Part II
Kulite DAQ. Data Acquisition Software User s Manual. Version 3.2.0
 Kulite DAQ Data Acquisition Software User s Manual Version 3.2.0 Table of Contents Kulite DAQ Overview... 3 Main Window... 4 1. Menu bar... 4 2. Interface selection... 5 3. Found devices... 5 4. Sorting...
Installation 3. PerTrac Reporting Studio Overview 4. The Report Design Window Overview 8. Designing the Report (an example) 13
 13") Contents Installation 3 PerTrac Reporting Studio Overview 4 The Report Design Window Overview 8 Designing the Report (an example) 13 PerTrac Reporting Studio Charts 14 Chart Editing/Formatting 17 PerTrac
Contents Installation 3 PerTrac Reporting Studio Overview 4 The Report Design Window Overview 8 Designing the Report (an example) 13 PerTrac Reporting Studio Charts 14 Chart Editing/Formatting 17 PerTrac
VersaPrint Operator s Manual
 VersaPrint Operator s Manual BadgerWare, LLC PO Box 292 Dayton, OH 45409 877.298.3759 www.badgerware.net Table of Contents Section 1: Introduction... 1 Section 2: VersaPrint Main Window... 4 Section 3:
User Guide. Model Temperature Datalogger Kit Model Temperature and Humidity Datalogger Kit Model SW276 Datalogging Software SW276
 User Guide Model 42265 Temperature Datalogger Kit Model 42275 Temperature and Humidity Datalogger Kit Model SW276 Datalogging Software SW276 Introduction Congratulations on your purchase of Extech Instrument
MANAGING MAPLE DOCUMENTS Worksheet or Document mode
 MANAGING MAPLE DOCUMENTS Worksheet or Document mode SAVING A MAPLE DOCUMENT These steps apply if you are saving a Maple document for the first time. Otherwise, see NOTE below. Either: From the menu bar,
ic-mh16 Evaluation Software Software Description
 Rev A1, Page 1/14 DESCRIPTION ic-haus ic-mh16 evaluation software is developed for PCs running the Windows operating system. The evaluation software is developed in LabVIEW and requires a one-time installation
Using your Brady Printer connected to your PC.
 Using your Brady Printer connected to your PC. While the IDXPERT Thermal Labeling System is sold as a standalone printer, it can also be used connected to your PC using optional Labelmark Software. This
Oracle. Field Service Cloud Configuring and Using Reports 18B
 Oracle Field Service Cloud 18B Part Number: E94743-02 Copyright 2018, Oracle and/or its affiliates. All rights reserved Authors: The Field Service Cloud Information Development Team This software and related
CCRS Quick Start Guide for Program Administrators. September Bank Handlowy w Warszawie S.A.
 CCRS Quick Start Guide for Program Administrators September 2017 www.citihandlowy.pl Bank Handlowy w Warszawie S.A. CitiManager Quick Start Guide for Program Administrators Table of Contents Table of Contents
Software User's Guide
 Software User's Guide The contents of this guide and the specifications of this product are subject to change without notice. Brother reserves the right to make changes without notice in the specifications
For best results, ensure that the VST is the only browser instance running and fully close the browser each time before accessing the VST again.
 This User Guide summarizes the interface and components of the Valve and Actuator Selection Tool. PDF viewing: If you are viewing this PDF from the browser, easily navigate this document using the Bookmarks
Direct Image Viewer User Tutorial
 Direct Image Viewer User Tutorial A guide to understanding the functions and features within the Direct Image Viewer to best present the data and to get the most understanding from the Direct Image logs.
DataPro Quick Start Guide
 DataPro Quick Start Guide Introduction The DataPro application provides the user with the ability to download and analyze data acquired using the ULTRA-LITE PRO range of Auto Meter products. Please see
Contents. CRITERION Vantage 3 Analysis Training Manual. Introduction 1. Basic Functionality of CRITERION Analysis 5. Charts and Reports 17
 CRITERION Vantage 3 Analysis Training Manual Contents Introduction 1 Basic Functionality of CRITERION Analysis 5 Charts and Reports 17 Preferences and Defaults 53 2 Contents 1 Introduction 4 Application
Remote Display User Manual
 Remote Display User Manual 1 Contents: Introduction - Features... 3 Hardware Overview... 4 Quick-Start Guide... 5 Android Application Operation... 6 Launching and Connecting... 6 Main Display... 7 Configuring
WebPakCS Software Version 1.0
 WebPakCS Software Version 1.0 Instruction Manual D2-3447 The information in this manual is subject to change without notice. Throughout this manual, the following notes are used to alert you to safety
i-weight - Acquistion and Statistics analysis Software for Balances Software version 2.0 (V8) User Manual
 User Manual") i-weight - Acquistion and Statistics analysis Software for Balances Software version 2.0 (V8) User Manual Manual edition: 10/10/2017 rev.0 Converter model FTDI INDEX 1. What is and what it does... 3 2.
i-weight - Acquistion and Statistics analysis Software for Balances Software version 2.0 (V8) User Manual Manual edition: 10/10/2017 rev.0 Converter model FTDI INDEX 1. What is and what it does... 3 2.
TDSPTD Protocol Trigger and Decode Application Online Help
 xx ZZZ TDSPTD Protocol Trigger and Decode Application Online Help *P077002502* 077-0025-02 ZZZ TDSPTD Protocol Trigger and Decode Application Online Help www.tektronix.com 077-0025-02 Copyright Tektronix.
SoftTools Suite 7.0. Flowserve Corporation
 SoftTools Suite 7.0 Quick Start Guide for SoftTools 7.0 with support for the HART Communications Protocol on the Logix 1200/1200e, 3200IQ, and 500/500si Series Positioners Flowserve Corporation Flow Control
DFS II Series. DFS II / DFS II-R / DFS II-R-ND Digital Force Gauge
 DFS II Series DFS II / DFS II-R / DFS II-R-ND Digital Force Gauge Functions and Features Easy-to-Read Display A large, easy-to-read full color LCD can display readings, icons and visually indicate gauge
DL75 ARCHIVED. FlowInspector Software Guide for the DL75 Data Logger System (2/01/08) Version 1.7
 Version 1.7") DL75 FlowInspector Software Guide for the DL75 Data Logger System Version 1.7 DL75 FlowInspector Software Guide for the DL75 Data Logger System FlowInspector Laptop Software Version 1.7 19026 72nd Avenue
DL75 FlowInspector Software Guide for the DL75 Data Logger System Version 1.7 DL75 FlowInspector Software Guide for the DL75 Data Logger System FlowInspector Laptop Software Version 1.7 19026 72nd Avenue
Sedao Ltd. QuickChange PROject. User Manual for QuickChange PROject version 2.1.5
 Sedao Ltd QuickChange PROject User Manual for QuickChange PROject version 2.1.5 Contents What is QuickChange PROject?... 2 Simple Artwork Creation... 5 Creating a project... 7 QuickChange PROject Template
N2KExtractor. Maretron Data Extraction Software User s Manual
 N2KExtractor Maretron Data Extraction Software User s Manual Revision 3.1.6 Copyright 2017 Maretron, LLP All Rights Reserved Maretron, LLP 9014 N. 23rd Ave #10 Phoenix, AZ 85021-7850 http://www.maretron.com
The following steps will allow you to install and quickly begin using DevCom2000:
 QUICK START DevCom2000 uses Device Descriptions (DDs) to access data stored in the memory of the smart field device. These DDs are developed by the manufacturer for their products and, in turn, distributed
-Table of Contents- 1. Overview Installation and removal Operation Main menu Trend graph... 13
 Thank you for buying Data Analysis Software. In order to use this software correctly and safely and to prevent trouble, please read this manual carefully. Notice 1. No part of this manual can be reproduced
AbraScan Test Strip Reader Digital Reading of Test Strips for the Determination of Cyanotoxins in Contaminated Water Samples
 AbraScan Test Strip Reader Digital Reading of Test Strips for the Determination of Cyanotoxins in Contaminated Water Samples Product No. 475025 1. General Description The AbraScan RDS-1500 Test Strip Reader
PROGRAMMING INSTRUCTIONS
 HOERBIGER Engine Solutions PROGRAMMING INSTRUCTIONS CPU-XL VARISPARK TERMINAL PROGRAM WARNING: WARNING: DEVIATION DEVIATION FROM THESE FROM INSTRUCTIONS THESE INSTRUCTIONS MAY LEAD MAY LEAD TO IMPROPER
Podium Plus Data Analysis Software. User Manual. SWIS10 Version
 SWIS10 Version Issue 1.10 February 2005 Contents 1 Introduction 6 1.1 What is Podium Plus? 6 1.2 About This Manual 6 1.3 Typographical Conventions 7 1.4 Getting Technical Support 7 2 Getting Started 8
Print Server. User s Manual. Rev. 01 (April, 2004) Made In Taiwan
 Made In Taiwan") Print Server User s Manual Rev. 01 (April, 2004) Made In Taiwan TABLE OF CONTENTS ABOUT THIS GUIDE... 4 INTRODUCTION... 5 PACKAGE CONTENTS... 6 SYSTEM REQUIREMENTS... 6 GENERAL FEATURES... 7 PRODUCT VIEW...
Print Server User s Manual Rev. 01 (April, 2004) Made In Taiwan TABLE OF CONTENTS ABOUT THIS GUIDE... 4 INTRODUCTION... 5 PACKAGE CONTENTS... 6 SYSTEM REQUIREMENTS... 6 GENERAL FEATURES... 7 PRODUCT VIEW...
IntuiLink for Basic (Agilent E3600 series) DC Power Supplies
 DC Power Supplies") IntuiLink for Basic (Agilent E3600 series) DC Power Supplies Agilent IntuiLink for Agilent E3600-Series DC power supplies offers the following capabilities: - Make a variety of measurements and insert
IntuiLink for Basic (Agilent E3600 series) DC Power Supplies Agilent IntuiLink for Agilent E3600-Series DC power supplies offers the following capabilities: - Make a variety of measurements and insert
Model 5270 Data Acquisition and Control Software Installation and Technical Support Manual
 Model 5270 Data Acquisition and Control Software Installation and Technical Support Manual Revision F, July 2002 P/N: 5270-0010f.doc 2001 N. Indianwood Ave. Broken Arrow, OK 74147 Telephone: 918-250-7200
Quick Start Guide Agilent Technologies 14565A Device Characterization Software for Windows 98, Windows NT 4.0, Windows 2000 and Windows XP
 Quick Start Guide Agilent Technologies 14565A Device Characterization Software for Windows 98, Windows NT 4.0, Windows 2000 and Windows XP sa Contents Description...3 System Requirements...3 Installing
PowerView for the EnergyPro
 Data Analysis Software User's Guide PowerView User's Guide Copyright 2005 CANDURA INSTRUMENTS. All Rights Reserved. The information in this document is subject to change without notice. CANDURA INSTRUMENTS
TopGuard Patrol PLUS has the following expanded or additional features above TopGuard Patrol: Report Options (Summary and Personnel Report only)
") 11/05 Page 1 General Overview TopGuard Patrol is a software package designed primarily for the acquisition, evaluation and reporting of guard tour data, and for communicating with and configuring GCS Escorte
11/05 Page 1 General Overview TopGuard Patrol is a software package designed primarily for the acquisition, evaluation and reporting of guard tour data, and for communicating with and configuring GCS Escorte
IGSS 13 Configuration Workshop - Exercises
 IGSS 13 Configuration Workshop - Exercises Contents IGSS 13 Configuration Workshop - Exercises... 1 Exercise 1: Working as an Operator in IGSS... 2 Exercise 2: Creating a new IGSS Project... 28 Exercise
CoSign Quick Guide Virtual Signing with CoSign
 CoSign Quick Guide Virtual Signing with CoSign Table of Contents Launching OmniSign 1 Launching OmniSign with a PDF file 1 Launching OmniSign with a non-pdf file 1 Getting Started with OmniSign 2 Creating
Technical Documentation Version 7.3 Output
 Technical Documentation Version 7.3 Output These documents are copyrighted by the Regents of the University of Colorado. No part of this document may be reproduced, stored in a retrieval system, or transmitted
GL500A Application Manual
 GL500A Application Manual Main Functions A Variety of Waveform Displays Y-T, X-Y, and FFT waveforms can be displayed on large, easy-to-read screens. Dual-screen Event and Current Data Replay Current data
User Manual For SmartRoom Managers
 User Manual For SmartRoom Managers Table of Contents 1.0 Login 2.0 Confidentiality Agreement 3.0 Software Installation 4.0 Dashboard 5.0 Document Review and Index Maintenance 5.1 View by Index 5.1.1 Index
Getting Started With DO Analyser Software Version 4
 Getting Started With DO Analyser Software Version 4 Getting Started With The DO Analyser Sofware Version 4 Jochen Arndt SiS Sensoren Instrumente Systeme GmbH Schwentinental The author and publisher have
User Manual. Thermo Scientific Orion
 User Manual Thermo Scientific Orion Orion Star Com Software Program 68X637901 Revision A April 2013 Contents Chapter 1... 4 Introduction... 4 Star Com Functions... 5 Chapter 2... 6 Software Installation
Model 3i DIGITAL FORCE / TORQUE INDICATOR. User s Guide
 Model 3i DIGITAL FORCE / TORQUE INDICATOR Thank you Thank you for purchasing a Mark-10 Model 3i digital force / torque indicator, designed for use with interchangeable remote force and torque sensors.
Trademark. Cadex C5100 BatteryStore User Guide
 Trademark C5100 BatteryStore is a trademark of Cadex Electronics Inc. All other trademarks or registered trademarks mentioned herein are the property of their respective owners. Copyright Notice Copyright
Nintex Reporting 2008 Help
 Nintex Reporting 2008 Help Last updated: Thursday, 24 December 2009 1 Using Nintex Reporting 2008 1.1 Chart Viewer Web Part 1.2 Importing and Exporting Reports 1.3 Import Nintex report page 1.4 Item Level
5.2. Click these tabs to jump to the Table of Contents, Index or start of each chapter.
 5.2 Click these tabs to jump to the, or start of each chapter. Click this button to advance to the next page. Click this button to return to the previous page. (Since this is the starting page, the [Back]
Release Notes Life Technologies Attune NxT Software v2.3
 Release Notes Life Technologies Attune NxT Software v2.3 In the following pages you will find instructions describing: New software features Known software/system issues with troubleshooting guidance Software
Using OPUS to Process Evolved Gas Data (8/12/15 edits highlighted)
") Using OPUS to Process Evolved Gas Data (8/12/15 edits highlighted) Once FTIR data has been acquired for the gases evolved during your DSC/TGA run, you will process using the OPUS software package. Select
Using OPUS to Process Evolved Gas Data (8/12/15 edits highlighted) Once FTIR data has been acquired for the gases evolved during your DSC/TGA run, you will process using the OPUS software package. Select
Windows NT Server Printer Driver Upgrade Instructions
 Windows NT Server Printer Driver Upgrade Instructions The steps detailed below describe the most reliable method to upgrade printer driver versions after v1.6.0227a on a Windows NT 4.0 Server that is shared
NuFlo TM. SCM Viewer TM. User Manual. Manual No , Rev. A
 NuFlo TM SCM Viewer TM User Manual Manual No. 30165020, Rev. A Revision History The following table shows the revision history for this document: Date Description Approved by 2-6-2006 Initial release of