Four Types of Slope Positive Slope Negative Slope Zero Slope Undefined Slope Slope Dude will help us understand the 4 types of slope
|
|
|
- Lynette Rogers
- 5 years ago
- Views:
Transcription
1
2
3
4
5


6

7 Four Types of Slope Positive Slope Negative Slope Zero Slope Undefined Slope Slope Dude will help us understand the 4 types of slope

8

9
10
11
12
13
14
15 Direct Variation 1. What is it a. A linear equation that crosses through (0, 0) b. You may see it in problems written as: y varies directly with or as x 2. Equation a. y=kx b. k represents the constant of variation
16 You can solve an equation for y and see if it is in the form for a direct variation. Does the equation represent a direct variation? If so, find the constant of variation. 1. 7y = 2x 2. 3y + 4x = 8
17 When given that the relationship between two quantities is direct, you can write the equations by substituting the known values into the equation y=kx. Suppose y varies directly with x, and y = 35 when x = 5. What direct variation equation relates x and y? What is the value of y when x = 9?
18 The x and y intercept X-Intercept The point where a graph crosses the - axis. X-intercepts happen when the y-coordinate is zero. To find the x-intercept from an equation, replace y or f(x) with zero and solve for x. Y-Intercept The point where a graph crosses the - axis. Y-intercepts happen when the x-coordinate is zero. To find the y-intercept from an equation, replace x with zero and solve for y.
19
20
21 When our equation is in slope-intercept form (y= mx + b), we can use the equation to find the and -intercept.
22 If the equation is NOT in slope intercept form, we can rearrange it and then find the and -intercept.
23 Identify the slope and y-intercept of the equation y = 3x - 2 y = -7x + 9 y=⅔x+2
24 Given the slope and y-intercept, write the equation m = 5 b = -9 m = -2 b = 8 m = ⅘ b = 17
25 Identify the slope and y-intercept of the equation y +3x = 15 2y -4x = 8 y + 8 = 5x
26 Graphing Using Slope Intercept Form 1) Equation MUST be in to graph. 2) Find (slope) and (y-intercept) 3) Plot (y-intercept) on the graph. **b is where you Begin. 4) Start at y-intercept and use (slope) to plot points for the line. ** is how many you Move **if m is positive, move and to the right. **if m is negative, move and to the right. 5) Draw a through the points.

27
28 Standard Form of a Linear Equation Ax+By=C Special Rules: 1. A, B, and C cannot be fractions or decimals

29 The goal is to get the equation into the form Ax+By=C with no fractions! Get rid of the fractions Move x and y to the same side Change an equation into Standard From
30 You try... Write each equation in standard form: 1. y + 3 = 4(x-1) 2. y=¼x-2 3. y + 2 = ⅔ (x+4) The goal is to get the equation into the form Ax+By=C with no fractions! Get rid of the fractions Move x and y to the same side
 2. y=¼x-2 3.")
31 You try Answers Write each equation in standard form: 1. y + 3 = 4(x-1) 2. y=¼x-2 3. y + 2 = ⅔ (x+4)

32 Graphing from Standard Form (Ax+By=C) Method 1 - Change to Slope Intercept Form and graph To change to Slope Intercept Form, just solve for y!

33 Graphing from Standard Form (Ax+By=C) Method 2 - Find and graph your x and y intercepts Find the y intercept a. Plug in 0 for x b. Solve for y Find the x-intercept a. Plug in 0 for y b. Solve for x Graph your intercepts and connect!

34 You try Example 1 Attempt using Method 1 Change to Slope Intercept Form Graph 3x + 5y = 15

35 You try Example 2 Attempt Method 2 Find the x and y intercepts Graph 3x + 5y = 15
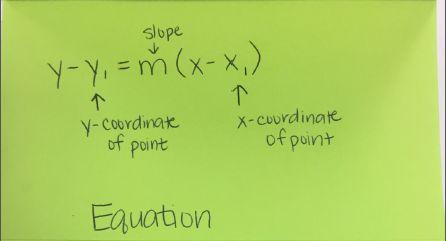
36 Some things to notice about Standard Form In standard form, A, B, and C do not represent anything (unlike m and b in slope intercept form). It s just the equation rearranged in a different order with specific rules! You cannot just take an equation that s in standard form and graph it you have to either find the intercepts or switch it to slope intercept form!

37 So what s the point of Standard Form? Why even use it if A, B, and C don t really mean anything? Well standard form makes a lot of sense in a lot of word problems look at this example. We would write the equation 1x+12y = 60 where x represents songs and y represents movies. It s natural to write this equation in standard form! So we need to know how to evaluate equations in standard form :)

38
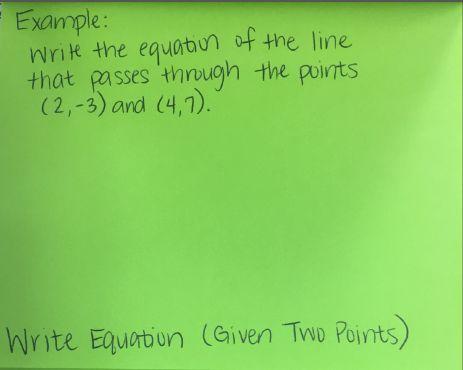
39

40
41

42
43
44 Write an equation of the line in point slope form
45 Write the equation of the line that has a slope of 5 and passes through (-1, 5).
46 Write the equation of the line that has a slope of -1/3 and passes through (4,-7).
47 Write the equation of the line that passes through (1, 4) and (-2, 3).
48 Write the equation of the line that passes through (-2, 0) and (4, 1).
49
Sec 4.1 Coordinates and Scatter Plots. Coordinate Plane: Formed by two real number lines that intersect at a right angle.
 Algebra I Chapter 4 Notes Name Sec 4.1 Coordinates and Scatter Plots Coordinate Plane: Formed by two real number lines that intersect at a right angle. X-axis: The horizontal axis Y-axis: The vertical
3-1 Writing Linear Equations
 3-1 Writing Linear Equations Suppose you have a job working on a monthly salary of $2,000 plus commission at a car lot. Your commission is 5%. What would be your pay for selling the following in monthly
Section 18-1: Graphical Representation of Linear Equations and Functions
 Section 18-1: Graphical Representation of Linear Equations and Functions Prepare a table of solutions and locate the solutions on a coordinate system: f(x) = 2x 5 Learning Outcome 2 Write x + 3 = 5 as
slope rise run Definition of Slope
 The Slope of a Line Mathematicians have developed a useful measure of the steepness of a line, called the slope of the line. Slope compares the vertical change (the rise) to the horizontal change (the
9.1 Linear Inequalities in Two Variables Date: 2. Decide whether to use a solid line or dotted line:
 9.1 Linear Inequalities in Two Variables Date: Key Ideas: Example Solve the inequality by graphing 3y 2x 6. steps 1. Rearrange the inequality so it s in mx ± b form. Don t forget to flip the inequality
Graphing Linear Equations
 Graphing Linear Equations A.REI.10 Understand that the graph of an equation in two variables is the set of all its solutions plotted in the coordinate plane. What am I learning today? How to graph a linear
SNAP Centre Workshop. Graphing Lines
 SNAP Centre Workshop Graphing Lines 45 Graphing a Line Using Test Values A simple way to linear equation involves finding test values, plotting the points on a coordinate plane, and connecting the points.
Test Name: Chapter 3 Review
 Test Name: Chapter 3 Review 1. For the following equation, determine the values of the missing entries. If needed, write your answer as a fraction reduced to lowest terms. 10x - 8y = 18 Note: Each column
Section 1.5. Finding Linear Equations
 Section 1.5 Finding Linear Equations Using Slope and a Point to Find an Equation of a Line Example Find an equation of a line that has slope m = 3 and contains the point (2, 5). Solution Substitute m =
Forms of Linear Equations
 6. 1-6.3 Forms of Linear Equations Name Sec 6.1 Writing Linear Equations in Slope-Intercept Form *Recall that slope intercept form looks like y = mx + b, where m = slope and b = y=intercept 1) Writing
Math-2. Lesson 3-1. Equations of Lines
 Math-2 Lesson 3-1 Equations of Lines How can an equation make a line? y = x + 1 x -4-3 -2-1 0 1 2 3 Fill in the rest of the table rule x + 1 f(x) -4 + 1-3 -3 + 1-2 -2 + 1-1 -1 + 1 0 0 + 1 1 1 + 1 2 2 +
Section Graphs and Lines
 Section 1.1 - Graphs and Lines The first chapter of this text is a review of College Algebra skills that you will need as you move through the course. This is a review, so you should have some familiarity
UNIT 4 NOTES. 4-1 and 4-2 Coordinate Plane
 UNIT 4 NOTES 4-1 and 4-2 Coordinate Plane y Ordered pairs on a graph have several names. (X coordinate, Y coordinate) (Domain, Range) (Input,Output) Plot these points and label them: a. (3,-4) b. (-5,2)
2.1 Transforming Linear Functions
 2.1 Transforming Linear Functions Before we begin looking at transforming linear functions, let s take a moment to review how to graph linear equations using slope intercept form. This will help us because
graphing_9.1.notebook March 15, 2019
 1 2 3 Writing the equation of a line in slope intercept form. In order to write an equation in y = mx + b form you will need the slope "m" and the y intercept "b". We will subsitute the values for m and
Hot X: Algebra Exposed
 Hot X: Algebra Exposed Solution Guide for Chapter 11 Here are the solutions for the Doing the Math exercises in Hot X: Algebra Exposed! DTM from p.149 2. Since m = 2, our equation will look like this:
College Prep Algebra II Summer Packet
 Name: College Prep Algebra II Summer Packet This packet is an optional review which is highly recommended before entering CP Algebra II. It provides practice for necessary Algebra I topics. Remember: When
Vocabulary Unit 2-3: Linear Functions & Healthy Lifestyles. Scale model a three dimensional model that is similar to a three dimensional object.
 Scale a scale is the ratio of any length in a scale drawing to the corresponding actual length. The lengths may be in different units. Scale drawing a drawing that is similar to an actual object or place.
GRAPHING WORKSHOP. A graph of an equation is an illustration of a set of points whose coordinates satisfy the equation.
 GRAPHING WORKSHOP A graph of an equation is an illustration of a set of points whose coordinates satisfy the equation. The figure below shows a straight line drawn through the three points (2, 3), (-3,-2),
Practice Test (page 391) 1. For each line, count squares on the grid to determine the rise and the run. Use slope = rise
 1. For each line, count squares on the grid to determine the rise and the run. Use slope = rise") Practice Test (page 91) 1. For each line, count squares on the grid to determine the rise and the. Use slope = rise 4 Slope of AB =, or 6 Slope of CD = 6 9, or Slope of EF = 6, or 4 Slope of GH = 6 4,
Practice Test (page 91) 1. For each line, count squares on the grid to determine the rise and the. Use slope = rise 4 Slope of AB =, or 6 Slope of CD = 6 9, or Slope of EF = 6, or 4 Slope of GH = 6 4,
Graphing Linear Equations
 Graphing Linear Equations Question 1: What is a rectangular coordinate system? Answer 1: The rectangular coordinate system is used to graph points and equations. To create the rectangular coordinate system,
List of Topics for Analytic Geometry Unit Test
 List of Topics for Analytic Geometry Unit Test 1. Finding Slope 2. Rule of 4 (4 forms of a line) Graph, Table of Values, Description, Equation 3. Find the Equations- Vertical and Horizontal Lines 4. Standard
Notes Lesson 3 4. Positive. Coordinate. lines in the plane can be written in standard form. Horizontal
 A, B, C are Notes Lesson 3 4 Standard Form of an Equation: Integers Ax + By = C Sometimes it is preferred that A is Positive All lines in the plane can be written in standard form. Oblique Coordinate Horizontal
Intro. To Graphing Linear Equations
 Intro. To Graphing Linear Equations The Coordinate Plane A. The coordinate plane has 4 quadrants. B. Each point in the coordinate plain has an x-coordinate (the abscissa) and a y-coordinate (the ordinate).
3-6 Lines in the Coordinate Plane
 3-6 Lines in the Coordinate Plane Warm Up Lesson Presentation Lesson Quiz Geometry Warm Up Substitute the given values of m, x, and y into the equation y = mx + b and solve for b. 1. m = 2, x = 3, and
Math 1313 Prerequisites/Test 1 Review
 Math 1313 Prerequisites/Test 1 Review Test 1 (Prerequisite Test) is the only exam that can be done from ANYWHERE online. Two attempts. See Online Assignments in your CASA account. Note the deadline too.
2.1 Basics of Functions and Their Graphs
 .1 Basics of Functions and Their Graphs Section.1 Notes Page 1 Domain: (input) all the x-values that make the equation defined Defined: There is no division by zero or square roots of negative numbers
The Rectangular Coordinate System and Equations of Lines. College Algebra
 The Rectangular Coordinate System and Equations of Lines College Algebra Cartesian Coordinate System A grid system based on a two-dimensional plane with perpendicular axes: horizontal axis is the x-axis
Tangent line problems
 You will find lots of practice problems and homework problems that simply ask you to differentiate. The following examples are to illustrate some of the types of tangent line problems that you may come
Section 7D Systems of Linear Equations
 Section 7D Systems of Linear Equations Companies often look at more than one equation of a line when analyzing how their business is doing. For example a company might look at a cost equation and a profit
Lesson 19: The Graph of a Linear Equation in Two Variables is a Line
 Lesson 19: The Graph of a Linear Equation in Two Variables is a Line Classwork Exercises Theorem: The graph of a linear equation y = mx + b is a non-vertical line with slope m and passing through (0, b),
Chapter 1 Section 1 Solving Linear Equations in One Variable
 Chapter Section Solving Linear Equations in One Variable A linear equation in one variable is an equation which can be written in the form: ax + b = c for a, b, and c real numbers with a 0. Linear equations
Chapter 1. Linear Equations and Straight Lines. 2 of 71. Copyright 2014, 2010, 2007 Pearson Education, Inc.
 Chapter 1 Linear Equations and Straight Lines 2 of 71 Outline 1.1 Coordinate Systems and Graphs 1.4 The Slope of a Straight Line 1.3 The Intersection Point of a Pair of Lines 1.2 Linear Inequalities 1.5
Writing and Graphing Linear Equations. Linear equations can be used to represent relationships.
 Writing and Graphing Linear Equations Linear equations can be used to represent relationships. Linear equation An equation whose solutions form a straight line on a coordinate plane. Collinear Points that
Linear Topics Notes and Homework DUE ON EXAM DAY. Name: Class period:
 Linear Topics Notes and Homework DUE ON EXAM DAY Name: Class period: Absolute Value Axis b Coordinate points Continuous graph Constant Correlation Dependent Variable Direct Variation Discrete graph Domain
Chapter 4: Solving Linear Equations Study Guide
 4.1: Plot Points in the Coordinate Plane Chapter 4: Solving Linear Equations Study Guide - Identify/graph ordered pairs Ex: Write the coordinates of - Identify the 4 quadrants point graphed and identify
1.5 Equations of Lines and Planes in 3-D
 1.5. EQUATIONS OF LINES AND PLANES IN 3-D 55 Figure 1.16: Line through P 0 parallel to v 1.5 Equations of Lines and Planes in 3-D Recall that given a point P = (a, b, c), one can draw a vector from the
0.4 Family of Functions/Equations
 0.4 Family of Functions/Equations By a family of functions, we are referring to a function definition such as f(x) = mx + 2 for m = 2, 1, 1, 0, 1, 1, 2. 2 2 This says, work with all the functions obtained
Geometry Pre AP Graphing Linear Equations
 Geometry Pre AP Graphing Linear Equations Name Date Period Find the x- and y-intercepts and slope of each equation. 1. y = -x 2. x + 3y = 6 3. x = 2 4. y = 0 5. y = 2x - 9 6. 18x 42 y = 210 Graph each
NOTES Linear Equations
 NOTES Linear Equations Linear Parent Function Linear Parent Function the equation that all other linear equations are based upon (y = x) Horizontal and Vertical Lines (HOYY VUXX) V vertical line H horizontal
Quadratic Functions Dr. Laura J. Pyzdrowski
 1 Names: (8 communication points) About this Laboratory A quadratic function in the variable x is a polynomial where the highest power of x is 2. We will explore the domains, ranges, and graphs of quadratic
In this class, we addressed problem 14 from Chapter 2. So first step, we expressed the problem in STANDARD FORM:
 In this class, we addressed problem 14 from Chapter 2. So first step, we expressed the problem in STANDARD FORM: Now that we have done that, we want to plot our constraint lines, so we can find our feasible
3.1. 3x 4y = 12 3(0) 4y = 12. 3x 4y = 12 3x 4(0) = y = x 0 = 12. 4y = 12 y = 3. 3x = 12 x = 4. The Rectangular Coordinate System
 4y = 12. 3x 4y = 12 3x 4(0) = y = x 0 = 12. 4y = 12 y = 3. 3x = 12 x = 4. The Rectangular Coordinate System") 3. The Rectangular Coordinate System Interpret a line graph. Objectives Interpret a line graph. Plot ordered pairs. 3 Find ordered pairs that satisfy a given equation. 4 Graph lines. 5 Find x- and y-intercepts.
3. The Rectangular Coordinate System Interpret a line graph. Objectives Interpret a line graph. Plot ordered pairs. 3 Find ordered pairs that satisfy a given equation. 4 Graph lines. 5 Find x- and y-intercepts.
Exploring Slope. We use the letter m to represent slope. It is the ratio of the rise to the run.
 Math 7 Exploring Slope Slope measures the steepness of a line. If you take any two points on a line, the change in y (vertical change) is called the rise and the change in x (horizontal change) is called
Section 4.4: Parabolas
 Objective: Graph parabolas using the vertex, x-intercepts, and y-intercept. Just as the graph of a linear equation y mx b can be drawn, the graph of a quadratic equation y ax bx c can be drawn. The graph
3.5 Day 1 Warm Up. Graph each line. 3.4 Proofs with Perpendicular Lines
 3.5 Day 1 Warm Up Graph each line. 1. y = 4x 2. y = 3x + 2 3. y = x 3 4. y = 4 x + 3 3 November 2, 2015 3.4 Proofs with Perpendicular Lines Geometry 3.5 Equations of Parallel and Perpendicular Lines Day
Hot X: Algebra Exposed
 Hot X: Algebra Exposed Solution Guide for Chapter 10 Here are the solutions for the Doing the Math exercises in Hot X: Algebra Exposed! DTM from p.137-138 2. To see if the point is on the line, let s plug
Algebra 1 Semester 2 Final Review
 Team Awesome 011 Name: Date: Period: Algebra 1 Semester Final Review 1. Given y mx b what does m represent? What does b represent?. What axis is generally used for x?. What axis is generally used for y?
Relations and Functions 2.1
 Relations and Functions 2.1 4 A 2 B D -5 5 E -2 C F -4 Relation a set of ordered pairs (Domain, Range). Mapping shows how each number of the domain is paired with each member of the range. Example 1 (2,
Slide 1 / 220. Linear Relations and Functions
 Slide 1 / 220 Linear Relations and Functions Slide 2 / 220 Table of Contents Domain and Range Discrete v Continuous Relations and Functions Function Notation Linear Equations Graphing a Linear Equation
UNIT 3B CREATING AND GRAPHING EQUATIONS Lesson 4: Solving Systems of Equations Instruction
 Prerequisite Skills This lesson requires the use of the following skills: graphing multiple equations on a graphing calculator graphing quadratic equations graphing linear equations Introduction A system
[CALCULATOR OPERATIONS]
![[CALCULATOR OPERATIONS]](/thumbs/89/100577945.jpg "[CALCULATOR OPERATIONS]") Example 1: Set up a table of values (with x-values between 3 and 3) and use it to draw the graph of 3. Press MENU 2: VIEW A: SHOW TABLE 1. Select the GRAPHS option: Or Press MENU 5: TRACE 1: GRAPH TRACE
Example 1: Set up a table of values (with x-values between 3 and 3) and use it to draw the graph of 3. Press MENU 2: VIEW A: SHOW TABLE 1. Select the GRAPHS option: Or Press MENU 5: TRACE 1: GRAPH TRACE
Linear Functions. College Algebra
 Linear Functions College Algebra Linear Function A linear function is a function whose graph is a straight line. Linear functions can be written in the slope-intercept form of a line: f(x) = mx + b where
Math 154 Elementary Algebra. Equations of Lines 4.4
 Math Elementary Algebra Caspers Name Date Equations of Lines. For each graph, solve each equation for y (if necessary), then write down the slope and y-intercept.. y x. y x - - - - - - - - - - - - - -
You should be able to plot points on the coordinate axis. You should know that the the midpoint of the line segment joining (x, y 1 1
 Name GRAPHICAL REPRESENTATION OF DATA: You should be able to plot points on the coordinate axis. You should know that the the midpoint of the line segment joining (x, y 1 1 ) and (x, y ) is x1 x y1 y,.
Calculus Limits Images in this handout were obtained from the My Math Lab Briggs online e-book.
 Calculus Limits Images in this handout were obtained from the My Math Lab Briggs online e-book. A it is the value a function approaches as the input value gets closer to a specified quantity. Limits are
UNIT 3 EXPRESSIONS AND EQUATIONS Lesson 3: Creating Quadratic Equations in Two or More Variables
 Guided Practice Example 1 Find the y-intercept and vertex of the function f(x) = 2x 2 + x + 3. Determine whether the vertex is a minimum or maximum point on the graph. 1. Determine the y-intercept. The
Vertical Line Test a relationship is a function, if NO vertical line intersects the graph more than once
 Algebra 2 Chapter 2 Domain input values, X (x, y) Range output values, Y (x, y) Function For each input, there is exactly one output Example: Vertical Line Test a relationship is a function, if NO vertical
Classwork/Homework. Midterm Review. 1) 9 more than the product of a number and 12 2) 5 less than a number squared is twelve.
 9 more than the product of a number and 12 2) 5 less than a number squared is twelve.") Name: Classwork/Homework Midterm Review Verbal Expressions *Translate the words to math * *The word THAN changes the order of the terms *Square Root, Cube Root 3 *Squared x 2, Cubed x 3 *Quantity use parentheses!
Name: Classwork/Homework Midterm Review Verbal Expressions *Translate the words to math * *The word THAN changes the order of the terms *Square Root, Cube Root 3 *Squared x 2, Cubed x 3 *Quantity use parentheses!
Important Things to Remember on the SOL
 Notes Important Things to Remember on the SOL Evaluating Expressions *To evaluate an expression, replace all of the variables in the given problem with the replacement values and use (order of operations)
2-4 Graphing Rational Functions
 2-4 Graphing Rational Functions Factor What are the zeros? What are the end behaviors? How to identify the intercepts, asymptotes, and end behavior of a rational function. How to sketch the graph of a
Algebra Unit 2: Linear Functions Notes. Slope Notes. 4 Types of Slope. Slope from a Formula
 Undefined Slope Notes Types of Slope Zero Slope Slope can be described in several ways: Steepness of a line Rate of change rate of increase or decrease Rise Run Change (difference) in y over change (difference)
Section 1.2. Graphing Linear Equations
 Graphing Linear Equations Definition of Solution, Satisfy, and Solution Set Definition of Solution, Satisfy, and Solution Set Consider the equation y = 2x 5. Let s find y when x = 3. y = 2x 5 Original
Sketching graphs of polynomials
 Sketching graphs of polynomials We want to draw the graphs of polynomial functions y = f(x). The degree of a polynomial in one variable x is the highest power of x that remains after terms have been collected.
Section 3.7 Notes. Rational Functions. is a rational function. The graph of every rational function is smooth (no sharp corners)
") Section.7 Notes Rational Functions Introduction Definition A rational function is fraction of two polynomials. For example, f(x) = x x + x 5 Properties of Rational Graphs is a rational function. The graph
Section.7 Notes Rational Functions Introduction Definition A rational function is fraction of two polynomials. For example, f(x) = x x + x 5 Properties of Rational Graphs is a rational function. The graph
Math 3 Coordinate Geometry Part 2 Graphing Solutions
 Math 3 Coordinate Geometry Part 2 Graphing Solutions 1 SOLVING SYSTEMS OF EQUATIONS GRAPHICALLY The solution of two linear equations is the point where the two lines intersect. For example, in the graph
5. In the Cartesian plane, a line runs through the points (5, 6) and (-2, -2). What is the slope of the line?
 and (-2, -2). What is the slope of the line?") Slope review Using two points to find the slope In mathematics, the slope of a line is often called m. We can find the slope if we have two points on the line. We'll call the first point and the second
Slope review Using two points to find the slope In mathematics, the slope of a line is often called m. We can find the slope if we have two points on the line. We'll call the first point and the second
Walt Whitman High School SUMMER REVIEW PACKET. For students entering AP CALCULUS BC
 Walt Whitman High School SUMMER REVIEW PACKET For students entering AP CALCULUS BC Name: 1. This packet is to be handed in to your Calculus teacher on the first day of the school year.. All work must be
The x-intercept can be found by setting y = 0 and solving for x: 16 3, 0
 y=-3/4x+4 and y=2 x I need to graph the functions so I can clearly describe the graphs Specifically mention any key points on the graphs, including intercepts, vertex, or start/end points. What is the
Math 2 Coordinate Geometry Part 2 Lines & Systems of Equations
 Name: Math 2 Coordinate Geometry Part 2 Lines & Systems of Equations Date: USING TWO POINTS TO FIND THE SLOPE - REVIEW In mathematics, the slope of a line is often called m. We can find the slope if we
Chapter P: Preparation for Calculus
 1. Which of the following is the correct graph of y = x x 3? E) Copyright Houghton Mifflin Company. All rights reserved. 1 . Which of the following is the correct graph of y = 3x x? E) Copyright Houghton
CONCAVITY AND INFLECTION POINTS
 CONCAVITY AND INFLECTION POINTS Find the Second Derivative of the function, f. Set the Second Derivative equal to zero and solve. Determine whether the Second Derivative is undefined for any x-values.
MATH 021 UNIT 2 HOMEWORK ASSIGNMENTS
 MATH 021 UNIT 2 HOMEWORK ASSIGNMENTS General Instructions You will notice that most of the homework assignments for a section have more than one part. Usually, the part (A) questions ask for explanations,
Revision Topic 11: Straight Line Graphs
 Revision Topic : Straight Line Graphs The simplest way to draw a straight line graph is to produce a table of values. Example: Draw the lines y = x and y = 6 x. Table of values for y = x x y - - - - =
Bell Ringer Write each phrase as a mathematical expression. Thinking with Mathematical Models
 Bell Ringer Write each phrase as a mathematical expression. 1. the sum of nine and eight 2. the sum of nine and a number 3. nine increased by a number x 4. fourteen decreased by a number p 5. the product
Welcome to Solving Systems Using the TI-Nspire
 Welcome to Solving Systems Using the TI-Nspire Presented by: Julie Speelman Madeira High School Cincinnati, Ohio jspeelman@madeiracityschools.org Please login to your calculators. Press the button. Select
Chapter 3: Polynomials. When greeted with a power of a power, multiply the two powers. (x 2 ) 3 = x 6
 3 = x 6") Chapter 3: Polynomials When greeted with a power of a power, multiply the two powers. (x 2 ) 3 = x 6 When multiplying powers with the same base, add the exponents. 15 7 x15 14 = 15 21 When dividing powers
Chapter 3: Polynomials When greeted with a power of a power, multiply the two powers. (x 2 ) 3 = x 6 When multiplying powers with the same base, add the exponents. 15 7 x15 14 = 15 21 When dividing powers
Did You Find a Parking Space?
 Lesson.4 Skills Practice Name Date Did You Find a Parking Space? Parallel and Perpendicular Lines on the Coordinate Plane Vocabulary Complete the sentence. 1. The point-slope form of the equation of the
ASMT 31: due Weds
 Please do NOT use a calculator unless problem is marked with an asterisk. (*) ASMT 31: due Weds 10 4 17 SHOW work for all problems, including calculator-permitted ones! TEST 3 on Friday review Les 3.6
Example 1: Give the coordinates of the points on the graph.
 Ordered Pairs Often, to get an idea of the behavior of an equation, we will make a picture that represents the solutions to the equation. A graph gives us that picture. The rectangular coordinate plane,
Section 1.1 The Distance and Midpoint Formulas
 Section 1.1 The Distance and Midpoint Formulas 1 y axis origin x axis 2 Plot the points: ( 3, 5), (0,7), ( 6,0), (6,4) 3 Distance Formula y x 4 Finding the Distance Between Two Points Find the distance
In math, the rate of change is called the slope and is often described by the ratio rise
 Chapter 3 Equations of Lines Sec. Slope The idea of slope is used quite often in our lives, however outside of school, it goes by different names. People involved in home construction might talk about
1.1 Functions. Cartesian Coordinate System
 1.1 Functions This section deals with the topic of functions, one of the most important topics in all of mathematics. Let s discuss the idea of the Cartesian coordinate system first. Cartesian Coordinate
Geometry Unit 2: Linear. Section Page and Problems Date Assigned
 Geometry Name: Geometry Unit 2: Linear Topics Covered: Midpoint formula Distance formula Slope Slope- Intercept Form Point- Slope Form Standard Form Assignment # Section Page and Problems Date Assigned
Section 2.1 Graphs. The Coordinate Plane
 Section 2.1 Graphs The Coordinate Plane Just as points on a line can be identified with real numbers to form the coordinate line, points in a plane can be identified with ordered pairs of numbers to form
1.5 Equations of Lines and Planes in 3-D
 56 CHAPTER 1. VECTORS AND THE GEOMETRY OF SPACE Figure 1.16: Line through P 0 parallel to v 1.5 Equations of Lines and Planes in 3-D Recall that given a point P = (a, b, c), one can draw a vector from
Functions. Name. Use an XY Coordinate Pegboard to graph each line. Make a table of ordered pairs for each line. y = x + 5 x y.
 Lesson 1 Functions Name Use an XY Coordinate Pegboard to graph each line. Make a table of ordered pairs for each line. 1. = + = + = 2 3 = 2 3 Using an XY Coordinate Pegboard, graph the line on a coordinate
2. Write the point-slope form of the equation of the line passing through the point ( 2, 4) with a slope of 3. (1 point)
 with a slope of 3. (1 point)") Parallel and Perpendicular Lines Unit Test David Strong is taking this assessment. Multiple Choice 1. Which construction is illustrated above? a segment congruent to a given segment an angle congruent
Parallel and Perpendicular Lines Unit Test David Strong is taking this assessment. Multiple Choice 1. Which construction is illustrated above? a segment congruent to a given segment an angle congruent
Sketching Straight Lines (Linear Relationships)
") Sketching Straight Lines (Linear Relationships) The slope of the line is m = y x = y 2 y 1 = rise run. Horizontal lines have the form y = b and have slope m = 0. Vertical lines have the form x = a and
Sketching Straight Lines (Linear Relationships) The slope of the line is m = y x = y 2 y 1 = rise run. Horizontal lines have the form y = b and have slope m = 0. Vertical lines have the form x = a and
STANDARDS OF LEARNING CONTENT REVIEW NOTES ALGEBRA I. 2 nd Nine Weeks,
 STANDARDS OF LEARNING CONTENT REVIEW NOTES ALGEBRA I 2 nd Nine Weeks, 2016-2017 1 OVERVIEW Algebra I Content Review Notes are designed by the High School Mathematics Steering Committee as a resource for
Name Class Date. Using Graphs to Relate Two Quantities
 4-1 Reteaching Using Graphs to Relate Two Quantities An important life skill is to be able to a read graph. When looking at a graph, you should check the title, the labels on the axes, and the general
1.1 - Functions, Domain, and Range
 1.1 - Functions, Domain, and Range Lesson Outline Section 1: Difference between relations and functions Section 2: Use the vertical line test to check if it is a relation or a function Section 3: Domain
Coordinate Geometry. Coordinate geometry is the study of the relationships between points on the Cartesian plane
 Coordinate Geometry Coordinate geometry is the study of the relationships between points on the Cartesian plane What we will explore in this tutorial (a) Explore gradient I. Identify the gradient of a
Vertical and Horizontal Translations
 SECTION 4.3 Vertical and Horizontal Translations Copyright Cengage Learning. All rights reserved. Learning Objectives 1 2 3 4 Find the vertical translation of a sine or cosine function. Find the horizontal
Chapter 9 Review. By Charlie and Amy
 Chapter 9 Review By Charlie and Amy 9.1- Inverse and Joint Variation- Explanation There are 3 basic types of variation: direct, indirect, and joint. Direct: y = kx Inverse: y = (k/x) Joint: y=kxz k is
Maths Revision Worksheet: Algebra I Week 1 Revision 5 Problems per night
 2 nd Year Maths Revision Worksheet: Algebra I Maths Revision Worksheet: Algebra I Week 1 Revision 5 Problems per night 1. I know how to add and subtract positive and negative numbers. 2. I know how to
Today is the last day to register for CU Succeed account AND claim your account. Tuesday is the last day to register for my class
 Today is the last day to register for CU Succeed account AND claim your account. Tuesday is the last day to register for my class Back board says your name if you are on my roster. I need parent financial
Section 2.2 Graphs of Linear Functions
 Section. Graphs of Linear Functions Section. Graphs of Linear Functions When we are working with a new function, it is useful to know as much as we can about the function: its graph, where the function
Functions. Copyright Cengage Learning. All rights reserved.
 Functions Copyright Cengage Learning. All rights reserved. 2.2 Graphs Of Functions Copyright Cengage Learning. All rights reserved. Objectives Graphing Functions by Plotting Points Graphing Functions with
Advanced Algebra. Equation of a Circle
 Advanced Algebra Equation of a Circle Task on Entry Plotting Equations Using the table and axis below, plot the graph for - x 2 + y 2 = 25 x -5-4 -3 0 3 4 5 y 1 4 y 2-4 3 2 + y 2 = 25 9 + y 2 = 25 y 2