NEXTMap World 30 Digital Surface Model
|
|
|
- Lindsay Barton
- 5 years ago
- Views:
Transcription


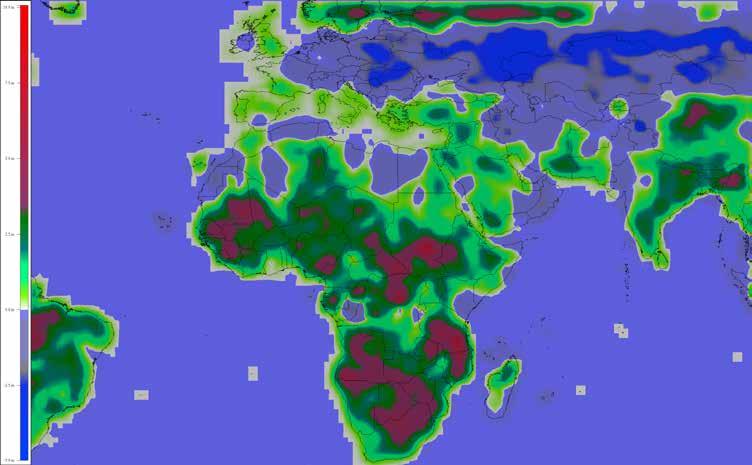
1 NEXTMap World 30 Digital Surface Model Intermap Technologies, Inc South Valley Highway, Suite 400 Englewood, CO v3 NEXTMap World 30 (top) provides an improvement in vertical accuracy and representation of elevations compared to the components of SRTM (middle) with elevation depression artifacts, and ASTER with spikes in elevation artifacts (bottom).
 covering all land mass over the entire planet.")
2 Summary The NEXTMap World 30 Digital Surface Model (DSM) by Intermap Technologies is a fused data model using corrected public data as the input source. This model provides seamless, best available surface elevation data with a 30-meter ground sampling distance (GSD) covering all land mass over the entire planet. NEXTMap World 30 DSM is a combination of 90-meter Shuttle Radar Topographic Mission (SRTM) v2.1 data, 30-meter ASTER Global DEM v2, and 1-kilometer GTOPO30 data, all of which have been ground controlled using LiDAR data from NASA s Ice, Cloud and Land Elevation Satellite (ICESat) collection. Based on internal testing with airborne LiDAR datasets, Intermap believes ICESat data, when restricted to flat un-obstructed terrain, has an accuracy of 25 centimeters. SRTM3 v2.1 ASTER v2.0 GTOPO30 Intermap applies a proprietary algorithm when merging datasets into our World 30 DSM. Our approach involves a sequence of steps designed to optimize the vertical and DEM Type File Format DSM Signed 16-bit HGT DSM Signed 16-bit GeoTIFF DSM Signed 16-bit DEM/ HDR spatial integrity of the final product. We pre-condition data Projection Geographic Geographic Geographic with the application of a sophisticated varying vertical Horizontal WGS84 WGS84 WGS84 correction. Data fusion is then done with a complex Datum weighting schema designed to retain higher value data. A non-linear blending is then passed over the boundary between datasets to ensure a smooth and continuous result. The result is a product that is specifically designed to generate, in Intermap s view, the best World digital elevation model (DEM) available today. Vertical Datum Geoid Tile Size Post Spacing WGS84 EGM96 1 x1 3 WGS84 EGM96 1 x1 1 WGS84 EGM96 50 x40 30 x60 for Antarctica 30 World 30 Inputs The input DEM datasets used for producing the World 30 DEM along with their specifications (as downloaded) are described in Table 1. SRTM90 v2.1 Ninety-meter posted DSM, IFSAR collection conducted in February of Data extends from 60 degrees north to 56 degrees south and has a claimed vertical accuracy of 14 meters LE95. Known issues include varying levels of vertical accuracy and significant numbers of data voids. Coverage <=60 N & >=56 S <=83 N & >=83 S Worldwide Void Value Vertical 14m 20m Variable Accuracy LE95 Horizontal Accuracy CE95 10m 30m Variable Table 1. Input dataset specifications. ASTER 30 v2.0 Thirty-meter posted DSM, optical satellite collection spanning from 1999 to Data extends from 83 degrees north to 83 degrees south and has a claimed vertical accuracy of 20 meters LE95. Known issues include poor vertical accuracy, data voids, and extensive spike blunders. ICESat LiDAR points from a Geoscience Laser Altimeter System (GLAS) Satellite. Collection spanned from 2003 to 2010 and was conducted as a direct nadir pulse collected in a polar orbital path. Known issues include unreliable vertical elevations due to cloud returns and anomalies. GTOPO30 One thousand-meter posted DSM, derived from eight raster and vector sources by the USGS in The DSM is known to exclude ridgelines and valleys due to course resolution. Coverage of ICESat LiDAR satellite tracks (red diagonal lines) across a 1 degree tile. 2

3 JAMIE WILL INSERT UPDATED GRAPHIC NEXTMap World 30 DSM data sources. All sources are edited to remove anomalies, and vertically controlled and corrected with 25cm LiDAR ICESat data. Process The NEXTMap World 30 DSM is primarily composed of SRTM v2.1. To improve upon the SRTM data, Intermap improved its vertical accuracy, infilled all the voids, and up-sampled the resolution. To improve the vertical accuracy, Intermap first ran a proprietary filter process on the ICESat LiDAR points to remove all non-ground anomalies. The resulting ICESat data had dense global coverage and a 25 centimeter RMSE, well suited for use as a ground control dataset. With the ICESat as a control set, Intermap built a correction model for the SRTM surface and applied the correction to the z values of the DSM. For detailed regional comparisons of SRTM to World 30 control points, please see page 11. The resulting corrected DSM model had vertical adjustments from -5 to +10 meters and the overall mean error was improved by 4 meters. These adjustments to the surface model were all made without compromising the SRTM hydro edits. The final output was then upsampled to a 30-meter post using a bicubic interpolation. With an improved vertical accuracy of the DSM complete, Intermap then focused on infilling the voids left in the terrain model from the SRTM. Using ASTER 30 as the infill data source, Intermap used their proprietary fusion process to adjust the vertical values and perform a planar tilt of SRTM - ICESat adjustment (derived from over 87 million global GCPs) 3


4 the data for each infill piece of ASTER data. The result was a seamless void filled dataset where the infilled ASTER matched all the surrounding edges of the master surface model. If any anomalies were detected in the input ASTER they were removed before being added to the World 30 DSM. In instances where both SRTM and ASTER had voids over the same geography GTOPO30 was used as the infill data. The final component of the World 30 build was the addition of ASTER and GTOPO30 DSM models to the northern and southern latitudes allowing for full global coverage. Just as the SRTM surface had been corrected using the filled ICESat control points, so too was the ASTER surface model. The ASTER surface model correction was significantly more extensive than the SRTM correction and resulted in adjustments to the z value that ranged from -23 meters to +23 meters. With the ASTER data vertically corrected it could be merged to the World 30 model at 60 degrees north latitude covering up to 89 degrees north latitude. The remaining last one degree of polar data was covered using the GTOPO30 data upsampled to a 30-meter post. The intersecting datasets had very similar vertical values at their lines of intersection since both were corrected using the same ground control set. But due to the texture detail differences of the varying DSM native posts, it was important to blend the data using a proprietary smoothing technique that extended 200 kilometers into the extent of both datasets. Coarse resolution and voids can be seen in this SRTM 90-meter DSM depicted in the top image. NEXTMap World 30 with a 30-meter GSD and filled voids is shown in the bottom image. ASTER - ICESat adjustment (derived from over 117 million global GCPs) 4

5 For the southern latitudes the same process of correction and blending was used involving ASTER and GTOPO30. Thus the resulting dataset extended from pole to pole. Validation and Edits The World 30 data was validated using automated elevation comparisons to verify that no outstanding differences were detected. The data was also subjected to a slope identification process that flagged all areas containing slopes over 80 degrees. Areas identified to have high slopes were manually edited to make sure the identified slope was an anomaly, and, if so, edited using infill data. Accuracy Assessment Intermap conducted three accuracy assessments on the World 30 DSM. SRTM-ASTER blend: Blending was done over 200 posts (approximately 6km) in order to minimize the transition as much as 1. First, World 30 elevations possible. were compared to the filtered ICESat LiDAR ground control points that have a vertical accuracy of 25 centimeter RMSE a. Methods: Sample selection criteria, data reformatting prior to analysis, statistics calculated b. Combined Samples: Statistics on all points, statistics on points between ±60, statistics on points +60 N, and statistics on points -60 S c. ICESat Interpolation Bilinear interpolation d. Statistics Calculated: Maximum, Minimum, Mean, Standard Deviation, RMSE, LE68, LE90, LE95 Histogram, Cumulative Distribution Function e. The statistics calculated from all samples are summarized below (statistics do not include points with differences greater than 500 meters and points located over Greenland): Number of Points Mean (m) Standard Deviation (m) RMSE (m) LE68 (m) LE90 (m) LE95 (m) All ICESat Points ± ± 60 North > 60 South
6 All Points ± 60 >60 N <60 S All Points ± 60 6
7 All Points ± For the second assessment, the World 30 DSM was compared to surveyed and validated Intermap ground control points as well as external ground control points from government programs. ISCP. ECP. 7
8 a. The statistics calculated for the control points are summarized below: Number Maximum Minimum Mean Standard of Points (m) (m) (m) Deviation (m) RMSE (m) LE68 (m) LE90 (m) LE95 (m) All ISCP ± 60 ISCP > 60 ISCP All ECP b. Intermap Survey Control Points (ISCP) and External Control Points (ECP) Control points used to validate NEXTMap Bilinear interpolation used when differencing to World 30 c. Statistics Calculated: Maximum, Minimum, Mean, Standard Deviation, RMSE, LE68, LE90, LE95 Histogram, Cumulative Distribution Function Statistics by Latitude: World 30 - ISCP All Points Between ±60 Greater than 60 N Statistics by Latitude: World 30 - ECP All Points (Between ±60 ) 8

9 d. ISCP by Continent Number Maximum Minimum Mean Standard of Points (m) (m) (m) Deviation (m) RMSE (m) LE68 (m) LE90 (m) LE95 (m) North America Europe Australia SE Asia e. ECP by Continent Number Maximum Minimum Mean Standard of Points (m) (m) (m) Deviation (m) RMSE (m) LE68 (m) LE90 (m) LE95 (m) North America Europe The final accuracy assessment was done using Intermap s 5-meter posted IFSAR DSM data. a. The statistics calculated from the samples are summarized below: Maximum (m) Minimum (m) Mean (m) Standard Deviation (m) RMSE (m) LE68 (m) LE90 (m) LE95 (m) All Samples ± 60 (water pixels removed) > b. Sample sites were chosen based on: SRTM ICESat adjustment model Location of NEXTMap DSM data Global distribution 9
10 c. NEXTMap 5 meter DSM down-sampled to 30 meter Average down-sampling method Some samples reprojected from UTM to Geographic Some samples datum transformation applied Some samples geoid transformation applied d. Final NEXTMap Format: Projection: Geographic Horizontal Datum: WGS84 Geoid: EGM96 e. Statistics Calculated: Maximum, Minimum, Mean, Standard Deviation, RMSE, LE68 LE90, LE95 Histogram, Cumulative Distribution Function Overall Statistics All Samples ±60 >60 N Summary of NEXTMap World 30 Product Specifications World wide coverage digital surface model A fusion of SRTM, ASTER, GTOPO30, using ICESat for vertical control Format: bil, hdr, row major starting in upper left corner 1 arc second postings (~30 meter) 1 x1 cell (~50MB) File dimensions 3601 X 3601 Pixel size IEEE 32 bit floating point Geographic Projection WGS84 Horizontal Datum WGS84 Vertical Datum EGM96 Geoid No data value
 (m) (m) Standard RMSE (m) LE68 (m) LE90 (m) LE95 (m) Deviation (m) 33.12-59.53-1.38 2.19 2.")
11 f. Individual Sample Statistics: Note the SRTM Water MAsk was used to remove points over water for all samples in the below table, except Alaska. Continent North America Central America South America Sample Locations New Mexico Maximum Minimum Mean (m) (m) (m) Standard RMSE (m) LE68 (m) LE90 (m) LE95 (m) Deviation (m) Arkansas Alaska Belize Columbia and Peru Guaviara River Europe Spain France UK Africa Congo SE Asia Malaysia Sumatra Australia Australia Comparison of Vertical Differences Vertical differences identified between SRTM and World 30 control points based on one-degree grid comparisons. 11
12 12
NEXTMap World 10 Digital Elevation Model
 NEXTMap Digital Elevation Model Intermap Technologies, Inc. 8310 South Valley Highway, Suite 400 Englewood, CO 80112 10012015 NEXTMap (top) provides an improvement in vertical accuracy and brings out greater
VALIDATION OF A NEW 30 METER GROUND SAMPLED GLOBAL DEM USING ICESAT LIDARA ELEVATION REFERENCE DATA
 VALIDATION OF A NEW 30 METER GROUND SAMPLED GLOBAL DEM USING ICESAT LIDARA ELEVATION REFERENCE DATA M. Lorraine Tighe Director, Geospatial Solutions Intermap Session: Photogrammetry & Image Processing
Digital Elevation Models
 Digital Elevation Models National Elevation Dataset 1 Data Sets US DEM series 7.5, 30, 1 o for conterminous US 7.5, 15 for Alaska US National Elevation Data (NED) GTOPO30 Global Land One-kilometer Base
Resource assessment and siting using SRTM 3 arc-second elevation data
 Downloaded from orbit.dtu.dk on: Dec 19, 2017 Resource assessment and siting using SRTM 3 arc-second elevation data Mortensen, Niels Gylling Publication date: 2005 Link back to DTU Orbit Citation (APA):
VOID FILL OF SRTM ELEVATION DATA - PRINCIPLES, PROCESSES AND PERFORMANCE INTRODUCTION
 VOID FILL OF SRTM ELEVATION DATA - PRINCIPLES, PROCESSES AND PERFORMANCE Steve Dowding, Director, NEXTMap Products Division Trina Kuuskivi, SRTM Quality Manager Xiaopeng Li, Ph.D., Mapping Scientist Intermap
Improving wide-area DEMs through data fusion - chances and limits
 Improving wide-area DEMs through data fusion - chances and limits Konrad Schindler Photogrammetry and Remote Sensing, ETH Zürich How to get a DEM for your job? for small projects (or rich people) contract
ADVANCED TERRAIN PROCESSING: ANALYTICAL RESULTS OF FILLING VOIDS IN REMOTELY SENSED DATA TERRAIN INPAINTING
 ADVANCED TERRAIN PROCESSING: ANALYTICAL RESULTS OF FILLING VOIDS IN REMOTELY SENSED DATA J. Harlan Yates Patrick Kelley Josef Allen Mark Rahmes Harris Corporation Government Communications Systems Division
High Resolution Digital Elevation Model (HRDEM) CanElevation Series Product Specifications. Edition
 CanElevation Series Product Specifications. Edition") High Resolution Digital Elevation Model (HRDEM) CanElevation Series Product Specifications Edition 1.1 2017-08-17 Government of Canada Natural Resources Canada Telephone: +01-819-564-4857 / 1-800-661-2638
High Resolution Digital Elevation Model (HRDEM) CanElevation Series Product Specifications Edition 1.1 2017-08-17 Government of Canada Natural Resources Canada Telephone: +01-819-564-4857 / 1-800-661-2638
Alaska Department of Transportation Roads to Resources Project LiDAR & Imagery Quality Assurance Report Juneau Access South Corridor
 Alaska Department of Transportation Roads to Resources Project LiDAR & Imagery Quality Assurance Report Juneau Access South Corridor Written by Rick Guritz Alaska Satellite Facility Nov. 24, 2015 Contents
Lecture 21 - Chapter 8 (Raster Analysis, part2)
") GEOL 452/552 - GIS for Geoscientists I Lecture 21 - Chapter 8 (Raster Analysis, part2) Today: Digital Elevation Models (DEMs), Topographic functions (surface analysis): slope, aspect hillshade, viewshed,
GEOL 452/552 - GIS for Geoscientists I Lecture 21 - Chapter 8 (Raster Analysis, part2) Today: Digital Elevation Models (DEMs), Topographic functions (surface analysis): slope, aspect hillshade, viewshed,
Alberta-wide ALOS DSM "ALOS_DSM15.tif", "ALOS_DSM15_c6.tif"
 Alberta-wide ALOS DSM "ALOS_DSM15.tif", "ALOS_DSM15_c6.tif" Alberta Biodiversity Monitoring Institute Geospatial Centre May 2017 Contents 1. Overview... 2 1.1. Summary... 2 1.2 Description... 2 1.3 Credits...
Files Used in this Tutorial
 RPC Orthorectification Tutorial In this tutorial, you will use ground control points (GCPs), an orthorectified reference image, and a digital elevation model (DEM) to orthorectify an OrbView-3 scene that
ICESATPROCESSOR, AN INTERFACE FOR ICESAT DATA EXTRACTION: APPLICATION GUIDE
 ICESATPROCESSOR, AN INTERFACE FOR ICESAT DATA EXTRACTION: APPLICATION GUIDE September, 2017 Otá vio Augusto Pássáiá Rodrigo C. D. Páivá 1 INTRODUCTION This manual aims to present an application guide for
Files Used in this Tutorial
 RPC Orthorectification Tutorial In this tutorial, you will use ground control points (GCPs), an orthorectified reference image, and a digital elevation model (DEM) to orthorectify an OrbView-3 scene that
Digital Raster Acquisition Project Eastern Ontario (DRAPE) 2014 Digital Surface Model and Digital Terrain Model
 2014 Digital Surface Model and Digital Terrain Model") Digital Raster Acquisition Project Eastern Ontario (DRAPE) 2014 Digital Surface Model and Digital Terrain Model User Guide Provincial Mapping Unit Mapping and Information Resources Branch Corporate Management
Digital Raster Acquisition Project Eastern Ontario (DRAPE) 2014 Digital Surface Model and Digital Terrain Model User Guide Provincial Mapping Unit Mapping and Information Resources Branch Corporate Management
Lecture 4: Digital Elevation Models
 Lecture 4: Digital Elevation Models GEOG413/613 Dr. Anthony Jjumba 1 Digital Terrain Modeling Terms: DEM, DTM, DTEM, DSM, DHM not synonyms. The concepts they illustrate are different Digital Terrain Modeling
Reality Check: Processing LiDAR Data. A story of data, more data and some more data
 Reality Check: Processing LiDAR Data A story of data, more data and some more data Red River of the North Red River of the North Red River of the North Red River of the North Introduction and Background
Terrain Analysis. Using QGIS and SAGA
 Terrain Analysis Using QGIS and SAGA Tutorial ID: IGET_RS_010 This tutorial has been developed by BVIEER as part of the IGET web portal intended to provide easy access to geospatial education. This tutorial
Initial GMES Service for Geospatial Reference Data Access. Remote Sensing Department. INDRA ESPACIO
 Initial GMES Service for Geospatial Reference Data Access Remote Sensing Department. INDRA ESPACIO Brussels, 260-09-2011 CONTENT 01 Overview 02 EU-DEM 03 Hydrography 04 Production Coordination 05 Access
Stellenbosch University Digital Elevation Model (SUDEM) 2016 Edition (v16.01)
 2016 Edition (v16.01)") Stellenbosch University Digital Elevation Model (SUDEM) 2016 Edition (v16.01) ii Stellenbosch University Digital Elevation Model (SUDEM) 2016 Edition (v16.01) Adriaan van Niekerk Centre for Geographical
Stellenbosch University Digital Elevation Model (SUDEM) 2016 Edition (v16.01) ii Stellenbosch University Digital Elevation Model (SUDEM) 2016 Edition (v16.01) Adriaan van Niekerk Centre for Geographical
SWOT LAKE PRODUCT. Claire POTTIER(CNES) and P. Callahan (JPL) SWOT ADT project team J.F. Cretaux, T. Pavelsky SWOT ST Hydro leads
 and P. Callahan (JPL) SWOT ADT project team J.F. Cretaux, T. Pavelsky SWOT ST Hydro leads") SWOT LAKE PRODUCT Claire POTTIER(CNES) and P. Callahan (JPL) SWOT ADT project team J.F. Cretaux, T. Pavelsky SWOT ST Hydro leads Lake, Climate and Remote Sensing Workshop Toulouse June 1&2 2017 High Rate
SWOT LAKE PRODUCT Claire POTTIER(CNES) and P. Callahan (JPL) SWOT ADT project team J.F. Cretaux, T. Pavelsky SWOT ST Hydro leads Lake, Climate and Remote Sensing Workshop Toulouse June 1&2 2017 High Rate
Tutorial 1: Downloading elevation data
 Tutorial 1: Downloading elevation data Objectives In this exercise you will learn how to acquire elevation data from the website OpenTopography.org, project the dataset into a UTM coordinate system, and
Contents of Lecture. Surface (Terrain) Data Models. Terrain Surface Representation. Sampling in Surface Model DEM
 Data Models. Terrain Surface Representation. Sampling in Surface Model DEM") Lecture 13: Advanced Data Models: Terrain mapping and Analysis Contents of Lecture Surface Data Models DEM GRID Model TIN Model Visibility Analysis Geography 373 Spring, 2006 Changjoo Kim 11/29/2006 1
Lecture 13: Advanced Data Models: Terrain mapping and Analysis Contents of Lecture Surface Data Models DEM GRID Model TIN Model Visibility Analysis Geography 373 Spring, 2006 Changjoo Kim 11/29/2006 1
Image Services for Elevation Data
 Image Services for Elevation Data Peter Becker Need for Elevation Using Image Services for Elevation Data sources Creating Elevation Service Requirement: GIS and Imagery, Integrated and Accessible Field
Combining Airborne LIDAR and Satellite RADAR for a Dynamic DEM. Ramon Hanssen, Delft University of Technology
 Combining Airborne LIDAR and Satellite RADAR for a Dynamic DEM Ramon Hanssen, Delft University of Technology 1 Release 27 September 2 Land surface elevation H(t) = H(t 0 ) + dh(dt) dt Elevation at time
DIGITAL HEIGHT MODELS BY CARTOSAT-1
 DIGITAL HEIGHT MODELS BY CARTOSAT-1 K. Jacobsen Institute of Photogrammetry and Geoinformation Leibniz University Hannover, Germany jacobsen@ipi.uni-hannover.de KEY WORDS: high resolution space image,
MULTIPLE DEM MEASURED ACCURACY
 MULTIPLE DEM MEASURED ACCURACY Jeff Carpenter, Systems Engineer Jim Hogarty, Senior Systems Engineer Integrity Applications Incorporated 5180 Parkstone Drive, Suite 260 Chantilly, VA, 20151 jcarpenter@integrity-apps.com
Final project: Lecture 21 - Chapter 8 (Raster Analysis, part2) GEOL 452/552 - GIS for Geoscientists I
 GEOL 452/552 - GIS for Geoscientists I") GEOL 452/552 - GIS for Geoscientists I Lecture 21 - Chapter 8 (Raster Analysis, part2) Talk about class project (copy follow_along_data\ch8a_class_ex into U:\ArcGIS\ if needed) Catch up with lecture 20
GEOL 452/552 - GIS for Geoscientists I Lecture 21 - Chapter 8 (Raster Analysis, part2) Talk about class project (copy follow_along_data\ch8a_class_ex into U:\ArcGIS\ if needed) Catch up with lecture 20
GEO 465/565 - Lab 7 Working with GTOPO30 Data in ArcGIS 9
 GEO 465/565 - Lab 7 Working with GTOPO30 Data in ArcGIS 9 This lab explains how work with a Global 30-Arc-Second (GTOPO30) digital elevation model (DEM) from the U.S. Geological Survey. This dataset can
Accuracy Characteristics of ALOS World 3D 30m DSM
 Accuracy Characteristics of ALOS World 3D 30m DSM Karsten Jacobsen Leibniz University Hannover, Germany Institute of Photogrammetry and Geoinformation jacobsen@ipi.uni-hannover.de 1 Introduction Japanese
Should Contours Be Generated from Lidar Data, and Are Breaklines Required? Lidar data provides the most
 Should Contours Be Generated from Lidar Data, and Are Breaklines Required? Lidar data provides the most accurate and reliable representation of the topography of the earth. As lidar technology advances
Downloading and importing DEM data from ASTER or SRTM (~30m resolution) into ArcMap
 into ArcMap") Downloading and importing DEM data from ASTER or SRTM (~30m resolution) into ArcMap Step 1: ASTER or SRTM? There has been some concerns about the quality of ASTER data, nicely exemplified in the following
Downloading and importing DEM data from ASTER or SRTM (~30m resolution) into ArcMap Step 1: ASTER or SRTM? There has been some concerns about the quality of ASTER data, nicely exemplified in the following
EVALUATION OF ZY-3 FOR DSM AND ORTHO IMAGE GENERATION
 EVALUATION OF FOR DSM AND ORTHO IMAGE GENERATION Pablo d Angelo German Aerospace Center (DLR), Remote Sensing Technology Institute D-82234 Wessling, Germany email: Pablo.Angelo@dlr.de KEY WORDS:, Satellite,
PROBLEMS AND LIMITATIONS OF SATELLITE IMAGE ORIENTATION FOR DETERMINATION OF HEIGHT MODELS
 PROBLEMS AND LIMITATIONS OF SATELLITE IMAGE ORIENTATION FOR DETERMINATION OF HEIGHT MODELS K. Jacobsen Institute of Photogrammetry and GeoInformation, Leibniz University Hannover, Germany jacobsen@ipi.uni-hannover.de
Accuracy Enhancement of ASTER Global Digital Elevation Models Using ICESat Data
 Remote Sens. 2011, 3, 1323-1343; doi:10.3390/rs3071323 OPEN ACCESS Remote Sensing ISSN 2072-4292 www.mdpi.com/journal/remotesensing Article Accuracy Enhancement of ASTER Global Digital Elevation Models
MassCEC Rooftop Solar Map
 MassCEC Rooftop Solar Map Data and Methods Summary Critigen, LLC Overview The detailed analysis of solar rooftop potential is a multi-step workflow with many facets and input parameters to the analysis
CHARACTERISTICS OF WORLDWIDE AND NEARLY WORLDWIDE HEIGHT MODELS
 CHARACTERISTICS OF WORLDWIDE AND NEARLY WORLDWIDE HEIGHT MODELS Karsten Jacobsen Leibniz University Hannover, Institute of Photogrammetry and Geoinformation, Germany; jacobsen@ipi.uni-hannover.de ISPRS
ACCURACY ASSESSMENT OF RADARGRAMMETRIC DEMS DERIVED FROM RADARSAT-2 ULTRAFINE MODE
 ISPRS Istanbul Workshop 2010 on Modeling of optical airborne and spaceborne Sensors, WG I/4, Oct. 11-13, IAPRS Vol. XXXVIII-1/W17. ACCURACY ASSESSMENT OF RADARGRAMMETRIC DEMS DERIVED FROM RADARSAT-2 ULTRAFINE
IMPROVING DEMS USING SAR INTERFEROMETRY. University of British Columbia. ABSTRACT
 IMPROVING DEMS USING SAR INTERFEROMETRY Michael Seymour and Ian Cumming University of British Columbia 2356 Main Mall, Vancouver, B.C.,Canada V6T 1Z4 ph: +1-604-822-4988 fax: +1-604-822-5949 mseymour@mda.ca,
GSD-Elevation data, grid 50+ nh
 1(5) Date: Document version: 2016-12-01 1.1 Product description: GSD-Elevation data, grid 50+ nh LANTMÄTERIET 2016-12-01 2 (5) Table of contents 1 General description... 3 1.1 Contents... 3 1.2 Geographic
GSD-Elevation data, Grid 2+
 Date: Document version: 2016-12-01 2.3 Product description: GSD-Elevation data, Grid 2+ LANTMÄTERIET 2016-12-01 2 (12) List of contents 1 General description... 3 1.1 Contents... 3 1.2 Geographic coverage...
HIGH RESOLUTION DEMs AND ORTHO-IMAGE BASEMAPS FOR LOCAL GOVERNMENT APPLICATIONS
 HIGH RESOLUTION DEMs AND ORTHO-IMAGE BASEMAPS FOR LOCAL GOVERNMENT APPLICATIONS STATEMENT OF PROBLEM Digital Elevation Models (DEMs) are the digital representation of topographic and/or manmade features
ELIMINATION OF THE OUTLIERS FROM ASTER GDEM DATA
 ELMNATON OF THE OUTLERS FROM ASTER GDEM DATA Hossein Arefi and Peter Reinartz Remote Sensing Technology nstitute German Aerospace Center (DLR) 82234 Wessling, Germany hossein.arefi@dlr.de, peter.reinartz@dlr.de
Lecture 06. Raster and Vector Data Models. Part (1) Common Data Models. Raster. Vector. Points. Points. ( x,y ) Area. Area Line.
 Common Data Models. Raster. Vector. Points. Points. ( x,y ) Area. Area Line.") Lecture 06 Raster and Vector Data Models Part (1) 1 Common Data Models Vector Raster Y Points Points ( x,y ) Line Area Line Area 2 X 1 3 Raster uses a grid cell structure Vector is more like a drawn map
Lecture 06 Raster and Vector Data Models Part (1) 1 Common Data Models Vector Raster Y Points Points ( x,y ) Line Area Line Area 2 X 1 3 Raster uses a grid cell structure Vector is more like a drawn map
SMS v D Summary Table. SRH-2D Tutorial. Prerequisites. Requirements. Time. Objectives
 SMS v. 12.3 SRH-2D Tutorial Objectives Learn the process of making a summary table to compare the 2D hydraulic model results with 1D hydraulic model results. This tutorial introduces a method of presenting
Files Used in this Tutorial
 Generate Point Clouds and DSM Tutorial This tutorial shows how to generate point clouds and a digital surface model (DSM) from IKONOS satellite stereo imagery. You will view the resulting point clouds
Overview. 1. Aerial LiDAR in Wisconsin (20 minutes) 2. Demonstration of data in CAD (30 minutes) 3. High Density LiDAR (20 minutes)
 2. Demonstration of data in CAD (30 minutes) 3. High Density LiDAR (20 minutes)") Overview 1. Aerial LiDAR in Wisconsin (20 minutes) 2. Demonstration of data in CAD (30 minutes) 3. High Density LiDAR (20 minutes) 4. Aerial lidar technology advancements (15 minutes) 5. Q & A 1. Aerial
Overview 1. Aerial LiDAR in Wisconsin (20 minutes) 2. Demonstration of data in CAD (30 minutes) 3. High Density LiDAR (20 minutes) 4. Aerial lidar technology advancements (15 minutes) 5. Q & A 1. Aerial
High resolution survey and orthophoto project of the Dosso-Gaya region in the Republic of Niger. by Tim Leary, Woolpert Inc.
 High resolution survey and orthophoto project of the Dosso-Gaya region in the Republic of Niger by Tim Leary, Woolpert Inc. Geospatial Solutions Photogrammetry & Remote Sensing LiDAR Professional Surveying
Municipal Projects in Cambridge Using a LiDAR Dataset. NEURISA Day 2012 Sturbridge, MA
 Municipal Projects in Cambridge Using a LiDAR Dataset NEURISA Day 2012 Sturbridge, MA October 15, 2012 Jeff Amero, GIS Manager, City of Cambridge Presentation Overview Background on the LiDAR dataset Solar
Objectives for Terrain Week
 The Terrain Correction Chuck Connor, Laura Connor Potential Fields Geophysics: Terrain Week for Terrain Week Learn about the terrain correction The inner terrain correction Learn about The outer terrain
An Introduction to Lidar & Forestry May 2013
 An Introduction to Lidar & Forestry May 2013 Introduction to Lidar & Forestry Lidar technology Derivatives from point clouds Applied to forestry Publish & Share Futures Lidar Light Detection And Ranging
Quality of the TanDEM-X DEM
 Quality of the TanDEM-X DEM Manfred Zink, Markus Bachmann, Thomas Fritz, Paola Rizzoli, Daniel Schulze, Birgit Wessel CEOS SAR 2016 07-09 September 2016 Tokyo Denki University, Japan TerraSAR-X-add-on
POSITIONING A PIXEL IN A COORDINATE SYSTEM
 GEOREFERENCING AND GEOCODING EARTH OBSERVATION IMAGES GABRIEL PARODI STUDY MATERIAL: PRINCIPLES OF REMOTE SENSING AN INTRODUCTORY TEXTBOOK CHAPTER 6 POSITIONING A PIXEL IN A COORDINATE SYSTEM The essential
EVALUATION OF WORLDVIEW-1 STEREO SCENES AND RELATED 3D PRODUCTS
 EVALUATION OF WORLDVIEW-1 STEREO SCENES AND RELATED 3D PRODUCTS Daniela POLI, Kirsten WOLFF, Armin GRUEN Swiss Federal Institute of Technology Institute of Geodesy and Photogrammetry Wolfgang-Pauli-Strasse
Using rasters for interpolation and visualization in GMS
 v. 10.3 GMS 10.3 Tutorial Using rasters for interpolation and visualization in GMS Objectives This tutorial teaches how GMS uses rasters to support all kinds of digital elevation models and how rasters
DIGITAL SURFACE MODELS OF CITY AREAS BY VERY HIGH RESOLUTION SPACE IMAGERY
 DIGITAL SURFACE MODELS OF CITY AREAS BY VERY HIGH RESOLUTION SPACE IMAGERY Jacobsen, K. University of Hannover, Institute of Photogrammetry and Geoinformation, Nienburger Str.1, D30167 Hannover phone +49
Introduction to Lidar Technology and Data Collection
 Introduction to Lidar Technology and Data Collection Christopher Crosby San Diego Supercomputer Center / OpenTopography (with content adapted from NCALM, David Phillips (UNVACO), Ian Madin (DOGAMI), Ralph
Accuracy Assessment of an ebee UAS Survey
 Accuracy Assessment of an ebee UAS Survey McCain McMurray, Remote Sensing Specialist mmcmurray@newfields.com July 2014 Accuracy Assessment of an ebee UAS Survey McCain McMurray Abstract The ebee unmanned
InSAR DEM; why it is better?
 InSAR DEM; why it is better? What is a DEM? Digital Elevation Model (DEM) refers to the process of demonstrating terrain elevation characteristics in 3-D space, but very often it specifically means the
I. An Intro to ArcMap Version 9.3 and 10. 1) Arc Map is basically a build your own Google map
 Arc Map is basically a build your own Google map") I. An Intro to ArcMap Version 9.3 and 10 What is Arc Map? 1) Arc Map is basically a build your own Google map a. Display and manage geo-spatial data (maps, images, points that have a geographic location)
I. An Intro to ArcMap Version 9.3 and 10 What is Arc Map? 1) Arc Map is basically a build your own Google map a. Display and manage geo-spatial data (maps, images, points that have a geographic location)
Aerial and Mobile LiDAR Data Fusion
 Creating Value Delivering Solutions Aerial and Mobile LiDAR Data Fusion Dr. Srini Dharmapuri, CP, PMP What You Will Learn About LiDAR Fusion Mobile and Aerial LiDAR Technology Components & Parameters Project
DIGITAL TERRAIN MODELS
 DIGITAL TERRAIN MODELS 1 Digital Terrain Models Dr. Mohsen Mostafa Hassan Badawy Remote Sensing Center GENERAL: A Digital Terrain Models (DTM) is defined as the digital representation of the spatial distribution
ATOMI Automatic road centreline extraction
 ATOMI input and output data Ortho images DTM/DSM 2D inaccurate structured road vector data ATOMI Automatic road centreline extraction 3D accurate structured road vector data Classification of roads according
Sandy River, OR Bathymetric Lidar Project, 2012 Delivery QC Analysis Lidar QC Report March 26 th, 2013
 O R E G O N D E P A R T M E N T O F G E O L O G Y A N D M I N E R A L I N D U S T R I E S OLC Sandy River, OR Bathymetric Lidar Project Delivery Acceptance Report. Department of Geology & Mineral Industries
Download elevation model page 2 Re-Project DEM coordinates page 5 Cut region of interest page 10
 1 Download elevation model page 2 Re-Project DEM coordinates page 5 Cut region of interest page 10 Version June 2017, Dr. Jonas von Rütte, Dr. Peter Lehmann 2 Download elevation model for region of interest:
Lidar Technical Report
 Lidar Technical Report Oregon Department of Forestry Sites Presented to: Oregon Department of Forestry 2600 State Street, Building E Salem, OR 97310 Submitted by: 3410 West 11st Ave. Eugene, OR 97402 April
Workshops funded by the Minnesota Environment and Natural Resources Trust Fund
 Workshops funded by the Minnesota Environment and Natural Resources Trust Fund Conservation Applications of LiDAR Data Workshops funded by: Minnesota Environment and Natural Resources Trust Fund Presented
Terrain and Imagery Tutorial. Contents. By: Brian Zager
 Terrain and Imagery Tutorial By: Brian Zager http://www.zagerdesign.com/golf_design/ This tutorial provides and overview on how terrain data and overhead imagery are used to create real courses or courses
Creating raster DEMs and DSMs from large lidar point collections. Summary. Coming up with a plan. Using the Point To Raster geoprocessing tool
 Page 1 of 5 Creating raster DEMs and DSMs from large lidar point collections ArcGIS 10 Summary Raster, or gridded, elevation models are one of the most common GIS data types. They can be used in many ways
TerrainOnDemand ArcGIS
 TM TerrainOnDemand ArcGIS Connect to Intermap Technologies NEXTMap data within: ArcGIS Desktop 9.3.1 and Above AGDQS0312 TerrainOnDemand ArcGIS 2 TerrainOnDemand ArcGIS Table of Contents 1. Introduction...1
LIDAR an Introduction and Overview
 LIDAR an Introduction and Overview Rooster Rock State Park & Crown Point. Oregon DOGAMI Lidar Project Presented by Keith Marcoe GEOG581, Fall 2007. Portland State University. Light Detection And Ranging
ACCURACY COMPARISON OF VHR SYSTEMATIC-ORTHO SATELLITE IMAGERIES AGAINST VHR ORTHORECTIFIED IMAGERIES USING GCP
 ACCURACY COMPARISON OF VHR SYSTEMATIC-ORTHO SATELLITE IMAGERIES AGAINST VHR ORTHORECTIFIED IMAGERIES USING GCP E. Widyaningrum a, M. Fajari a, J. Octariady a * a Geospatial Information Agency (BIG), Cibinong,
LiDAR QA/QC - Quantitative and Qualitative Assessment report -
 LiDAR QA/QC - Quantitative and Qualitative Assessment report - CT T0009_LiDAR September 14, 2007 Submitted to: Roald Haested Inc. Prepared by: Fairfax, VA EXECUTIVE SUMMARY This LiDAR project covered approximately
OLC Wasco County: Delivery One.
 OLC Wasco County: Delivery One www.quantumspatial.com January 2, 2014 Trimble R7 Receiver set up over GPS monument WASCO_02. Data collected for: Oregon Department of Geology and Mineral Industries 800
APPENDIX E2. Vernal Pool Watershed Mapping
 APPENDIX E2 Vernal Pool Watershed Mapping MEMORANDUM To: U.S. Fish and Wildlife Service From: Tyler Friesen, Dudek Subject: SSHCP Vernal Pool Watershed Analysis Using LIDAR Data Date: February 6, 2014
2. POINT CLOUD DATA PROCESSING
 Point Cloud Generation from suas-mounted iphone Imagery: Performance Analysis A. D. Ladai, J. Miller Towill, Inc., 2300 Clayton Road, Suite 1200, Concord, CA 94520-2176, USA - (andras.ladai, jeffrey.miller)@towill.com
N.J.P.L.S. An Introduction to LiDAR Concepts and Applications
 N.J.P.L.S. An Introduction to LiDAR Concepts and Applications Presentation Outline LIDAR Data Capture Advantages of Lidar Technology Basics Intensity and Multiple Returns Lidar Accuracy Airborne Laser
LiDAR Derived Contours
 LiDAR Derived Contours Final Delivery June 10, 2009 Prepared for: Prepared by: Metro 600 NE Grand Avenue Portland, OR 97232 Watershed Sciences, Inc. 529 SW Third Avenue, Suite 300 Portland, OR 97204 Metro
E3De. E3De Discover the Next Dimension of Your Data.
 International Support Exelis Visual Information Solutions is a global company with direct offices in North America, Europe, and Asia. Combined with our extensive, worldwide distributor network, we can
Accuracy Assessment of Ames Stereo Pipeline Derived DEMs Using a Weighted Spatial Dependence Model
 Accuracy Assessment of Ames Stereo Pipeline Derived DEMs Using a Weighted Spatial Dependence Model Intro Problem Statement A successful lunar mission requires accurate, high resolution data products to
Presented at the FIG Congress 2018, May 6-11, 2018 in Istanbul, Turkey
 Presented at the FIG Congress 2018, May 6-11, 2018 in Istanbul, Turkey Evangelos MALTEZOS, Charalabos IOANNIDIS, Anastasios DOULAMIS and Nikolaos DOULAMIS Laboratory of Photogrammetry, School of Rural
Mapping Photoperiod as a Variable in Vegetation Distribution Analysis. Photoperiod is defined as the duration of time for which an organism receives
 Paul Southard December 7 th, 2017 Mapping Photoperiod as a Variable in Vegetation Distribution Analysis Introduction Photoperiod is defined as the duration of time for which an organism receives illumination.
A Comparison of the Performance of Digital Elevation Model Pit Filling Algorithms for Hydrology
 20th International Congress on Modelling and Simulation, Adelaide, Australia, 1 6 December 2013 www.mssanz.org.au/modsim2013 A Comparison of the Performance of Digital Elevation Model Pit Filling Algorithms
v SMS Tutorials Working with Rasters Prerequisites Requirements Time Objectives
 v. 12.2 SMS 12.2 Tutorial Objectives Learn how to import a Raster, view elevations at individual points, change display options for multiple views of the data, show the 2D profile plots, and interpolate
An Introduction to Using Lidar with ArcGIS and 3D Analyst
 FedGIS Conference February 24 25, 2016 Washington, DC An Introduction to Using Lidar with ArcGIS and 3D Analyst Jim Michel Outline Lidar Intro Lidar Management Las files Laz, zlas, conversion tools Las
Objectives Learn how GMS uses rasters to support all kinds of digital elevation models and how rasters can be used for interpolation in GMS.
 v. 9.1 GMS 9.1 Tutorial Using rasters for interpolation and visualization in GMS Objectives Learn how GMS uses rasters to support all kinds of digital elevation models and how rasters can be used for interpolation
Generate Digital Elevation Models Using Laser Altimetry (LIDAR) Data. Christopher Weed
 Data. Christopher Weed") Generate Digital Elevation Models Using Laser Altimetry (LIDAR) Data Christopher Weed Final Report EE 381K Multidimensional Digital Signal Processing December 11, 2000 Abstract A Laser Altimetry (LIDAR)
Generate Digital Elevation Models Using Laser Altimetry (LIDAR) Data Christopher Weed Final Report EE 381K Multidimensional Digital Signal Processing December 11, 2000 Abstract A Laser Altimetry (LIDAR)
A Method to Create a Single Photon LiDAR based Hydro-flattened DEM
 A Method to Create a Single Photon LiDAR based Hydro-flattened DEM Sagar Deshpande 1 and Alper Yilmaz 2 1 Surveying Engineering, Ferris State University 2 Department of Civil, Environmental, and Geodetic
BLM Fire Project, 2013 QC Analysis Lidar and Orthophoto QC Report November 25th, 2013
 O R E G O N D E P A R T M E N T O F G E O L O G Y 1937 A N D M I N E R A L I N D U S T R I E S Department of Geology & Mineral Industries 800 NE Oregon St, Suite 965 Portland, OR 97232 BLM Fire Project,
Esri International User Conference. July San Diego Convention Center. Lidar Solutions. Clayton Crawford
 Esri International User Conference July 23 27 San Diego Convention Center Lidar Solutions Clayton Crawford Outline Data structures, tools, and workflows Assessing lidar point coverage and sample density
Geometric Rectification of Remote Sensing Images
 Geometric Rectification of Remote Sensing Images Airborne TerrestriaL Applications Sensor (ATLAS) Nine flight paths were recorded over the city of Providence. 1 True color ATLAS image (bands 4, 2, 1 in
CALPUFF View. Interface for the CALPUFF Air Dispersion Modeling System: CALPUFF, CALMET and CALPOST. Release Notes
 CALPUFF View Interface for the CALPUFF Air Dispersion Modeling System: CALPUFF, CALMET and CALPOST Release Notes Release Notes Version 2.2 Release Notes Version 2.0 Release Notes Version 1.9 Release Notes
Geometric Accuracy Evaluation, DEM Generation and Validation for SPOT-5 Level 1B Stereo Scene
 Geometric Accuracy Evaluation, DEM Generation and Validation for SPOT-5 Level 1B Stereo Scene Buyuksalih, G.*, Oruc, M.*, Topan, H.*,.*, Jacobsen, K.** * Karaelmas University Zonguldak, Turkey **University
Central Coast LIDAR Project, 2011 Delivery 1 QC Analysis LIDAR QC Report February 17 th, 2012
 O R E G O N D E P A R T M E N T O F G E O L O G Y A N D M I N E R A L I N D U S T R I E S OLC Central Coast Delivery 1 Acceptance Report. Department of Geology & Mineral Industries 800 NE Oregon St, Suite
Geometric Correction of Imagery
 Geometric Correction of Imagery Geometric Correction of Imagery Present by: Dr.Weerakaset Suanpaga D.Eng(RS&GIS) The intent is to compensate for the distortions introduced by a variety of factors, so that
Gravity Data Correction in QCTool
 Gravity Data Correction in QCTool January 20, 2017 info@qc-tool.com 2 1. Importing Data You must import to QCTool measured gravity data from ASCII files. Then you need to import the data from CSV files
ROCKY FORK TRACT: VIEWSHED ANALYSIS REPORT
 ROCKY FORK TRACT: VIEWSHED ANALYSIS REPORT Prepared for: The Conservation Fund Prepared by: A Carroll GIS 3711 Skylark Trail Chattanoga, TN 37416 INTRODUCTION This report documents methods and results
CO-REGISTERING AND NORMALIZING STEREO-BASED ELEVATION DATA TO SUPPORT BUILDING DETECTION IN VHR IMAGES
 CO-REGISTERING AND NORMALIZING STEREO-BASED ELEVATION DATA TO SUPPORT BUILDING DETECTION IN VHR IMAGES Alaeldin Suliman, Yun Zhang, Raid Al-Tahir Department of Geodesy and Geomatics Engineering, University
Validation of Aerial LiDAR Products For Transportation Applications
 Creating Value Delivering Solutions Validation of Aerial LiDAR Products For Transportation Applications Dr. Srini Dharmapuri, CP, PMP Michael Baker Jr., Inc. Lauren Little, PE Alaska DOT Public Facility
Lecture 9. Raster Data Analysis. Tomislav Sapic GIS Technologist Faculty of Natural Resources Management Lakehead University
 Lecture 9 Raster Data Analysis Tomislav Sapic GIS Technologist Faculty of Natural Resources Management Lakehead University Raster Data Model The GIS raster data model represents datasets in which square