Watershed Sciences 4930 & 6920 GEOGRAPHIC INFORMATION SYSTEMS
|
|
|
- Charlotte Clarke
- 5 years ago
- Views:
Transcription


 Regular Grid")
1 HOUSEKEEPING Watershed Sciences 4930 & 6920 GEOGRAPHIC INFORMATION SYSTEMS Quizzes Lab 8? WEEK EIGHT Lecture INTERPOLATION & SPATIAL ESTIMATION Joe Wheaton READING FOR TODAY WHAT CAN WE COLLECT AT POINTS? Think of everything we can. DIFFERENT SAMPLING STRATEGIES A) Regular Grid (systematic) B) Random C) Cluster D) Adaptive 1
 WHAT S WRONG WITH OUR")
 to have samples everywhere Even if finite number of objects in study area, usually too many to measure all Some sites")
2 SAMPLING PATTERNS WE VE DISCUSSED Point Based Sampling Sampling Patterns? Uniform grid? Sections? Irregular Random Featurebased A FEW OTHER VARIANTS Sampling Pattern: appropriate arrangement of samples considering both spatial interpolation and statistical inference (Berry) WHAT S WRONG WITH OUR SAMPLING? NOT spatially continuous over area of interest Can t afford (time and money) to have samples everywhere Even if finite number of objects in study area, usually too many to measure all Some sites impossible or unfeasible to visit INTERPOLATION DEFINED NATIONAL AIR QUALITY Interpolation predicts values for cells in a raster from a limited number of sample data points. It can be used to predict unknown values for any geographic point data, such as elevation, rainfall, chemical concentrations, noise levels, and so on. Interpolated in space from 50ish stations Interpolated in time through temporal averaging 2
: GIS")
: GIS com THE AVERAGE IS HARDLY")
: GIS com")

 Raster Grid Interpolation from Vector Polygo TIN or Theisan Polygons) to:")
3 WHY INTERPOLATE? WHY INTERPOLATE? What difference does it make? Easier to see spatial patterns and trends in surfaces then raw discrete data From Berry (2009): GIS Modeling & Analysis: on Because variations from the mean might matter From Berry (2009): GIS Modeling & Analysis: on THE AVERAGE IS HARDLY ANYWHERE! DIFFERENT INTERPOLATIONS ALSO GIVE DIFFERENT RESULTS. These differences are less problematic But worth considering From Berry (2009): GIS Modeling & Analysis: on INTERPOLATION TYPES VARY IN SOPHISTICATION WHAT DO WE USE INTERPOLATION FOR? Interpolation from point observations to: A continuous surface, which can be: Vector Polygons (e.g. TIN or Theisan Polygons) Raster Grid Interpolation from Vector Polygons (e.g. TIN or Theisan Polygons) to: Raster Grid Extraction (by interpolation) from raster to points Because we want to know approximate values at areas where we don t have observations 3


: GIS Modeling &")


4 IS YOUR RASTER A GRID OR LATTICE? Is this just a display thing or is it algorithmic? Grid centered or node centered? POINT EXTRACTION Points to be extracted won t line up exactly on a cell center so what is the value? From Berry (2009): GIS Modeling & Analysis: on If interpolation checked, it uses a bilinear interpolation? SOME INTERPOLATION EXAMPLES A DATASET WE LL KEEP LOOKING AT Elevation points. DEM ANOTHER DATASET WE LL KEEP LOOKING AT INTERPOLATION IN ARCGIS Three primary places: 1. 3D Analyst Tools 2. Geostatistical Analyst Tools 3. Spatial Analyst Tools 4
 Points TIN 3D Surface Visualization of TIN McCullagh MJ. 1981. Creation of smooth contours over irregularly distributed data using local surface patches. Geophysical Analysis. 13: 51-63.")
 data since it does not alter value of input Once location of cell's center on output raster located on input raster, nearest neighbor assignment")

5 BUILDING A TIN FROM VECTOR DATA A Triangular Irregular Network (TIN) is the simplest and most common interpolation technique for building surfaces with irregularly spaced elevation data (McCullagh, 1981) Points TIN 3D Surface Visualization of TIN McCullagh MJ Creation of smooth contours over irregularly distributed data using local surface patches. Geophysical Analysis. 13: TIN to RASTER RESAMPLING (A FORM OF INTERPOLATION) Natural neighbors vs. Linear An interpolation choice when going from vector to raster 1. Nearest Neighbor Assignment 2. Bilinear Interpolation 3. Cubic Convolution Good for discrete (categorical) data since it does not alter value of input Once location of cell's center on output raster located on input raster, nearest neighbor assignment determines location of the closest cell center RESAMPLING (A FORM OF INTERPOLATION) RESAMPLING (A FORM OF INTERPOLATION) 1. Nearest Neighbor Assignment 2. Bilinear Interpolations 3. Cubic Convolution Uses values of 4 nearest input cell centers to determine the value of output New value is a distance-weighted average Results in smoother-looking surface then nearest neighbor 1. Nearest Neighbor Assignment 2. Bilinear Interpolation 3. Cubic Convolution Similar to bilinear interpolation except that weighted average is calculated from the 16 nearest input cell centers and their values 5


 Use Create Thiessen")

6 RECALL OUR TIN -> DEM RESAMPLE EXAMPLE Resampling choices 10 m to 30 m Raster Cubic Resampling Bilinear Resampling Nearest Neighbor Resampling THIESSEN (VORONI) POLYGONS First build the olive polygons by bisecting lines of perimeter polygon Then build the central peach polygon by bisecting lines to each of surrounding points and connecting midpoints Every polygon has ONLY one point to be interpolated! This is AKA Nearest Neighbor. (not to be confused with Natural Neighbors) IN ARC NEAREST NEIGHBOR (AKA NATURAL NEIGHBOR) Use Create Thiessen Polygons Notice Influence of point spacing Extension outside of sampled area The points are not interpolated in this example, the region (Thiessen polygon) is 6

7 FIXED RADIUS INTERPOLATION FIXED RADIUS INTERPOLATION FIXED RADIUS APPLIED Not an exact interpolator. Why? INVERSE DISTANCE WEIGHTED Estimates a value for a location as the weightedaverage of the nearby data values within the roving window Average weighted so influence of surrounding values decrease with increasing distance from location being estimated 1 Inverse Distance 7
 of each sample point is determined by its")


8 INVERSE DISTANCE WEIGHTED Value of unknown points estimated using sampled values and distance to those samples The weight (or importance) of each sample point is determined by its distance away IDW EXAMPLE 1 IDW SENSITVITY Exponent n ast a point s influence deteriorates with distance Number of points i controls search distance Local influences are stronger as both n and i increase INVERSE DISTANCE WEIGHTED INVERSE DISTANCE WEIGHTED Method assumes variable being mapped decreases in influence with distance from sampled location Notice Interpolation extent 8


 applied to")
, 2 nd order (quadratic)")


9 NATURAL NEIGHBOR NATURAL NEIGHBOR Not to be confused with nearest neighbor SPLINE INTERPOLATION 1D A flexible ruler Can be represented with series of polynomial equations Same principle as line functions (right) applied to surface splines Equations can be first order (linear), 2 nd order (quadratic) and higher order polynomial fits SPLINE INTERPOLATION 2D SPLINE Designed to minimize surface curvature Creates smooth surface that passes exactly through input points 9


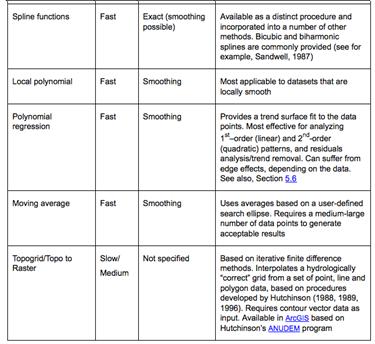
10 TOPO TO RASTER TOPO TO RASTER Variance Estimate VIII.Kriging WHAT IS KRIGING? An advanced geostatistical procedure that generates an estimated surface from a scattered set of points with z-values Unlike other interpolation methods, Kriging involves an interactive investigation of the spatial behavior of the phenomenon represented by the z-values before you select the best estimation method for generating the output surface TWO STEPS. Statistically based estimator of spatial variables Relies on: Spatial Trend increase or decrease in a variable in some direction Local spatial autocorrelation Random stochastic variation 10

 in your data, we can make a")
 Like IDW, kriging forms weights from")

11 THE FIRST STEP FIT EMPIRICAL DATA TO SEMIVARIOGRAM Models: Circular Spherical Exponential Gaussian Linear STEP 2: MAKING THE PREDICITON KRIGING Now you ve uncovered dependence (autocorrelation) in your data, we can make a prediction using fitted model (set aside empirical semivariogram) Like IDW, kriging forms weights from surrounding measured values to predict unmeasured locations Instead of just using distance, kriging uses semivariogram KRIGING KRIGING Variance Estimate 11
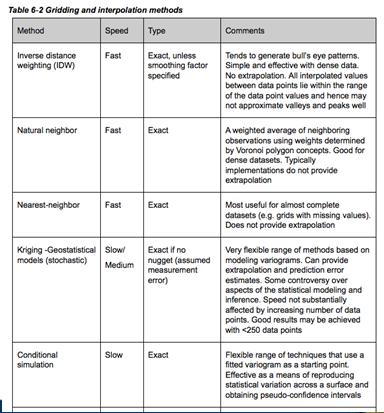

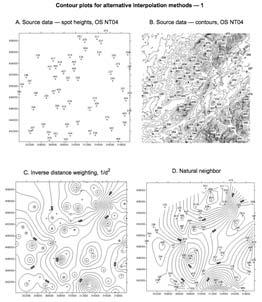
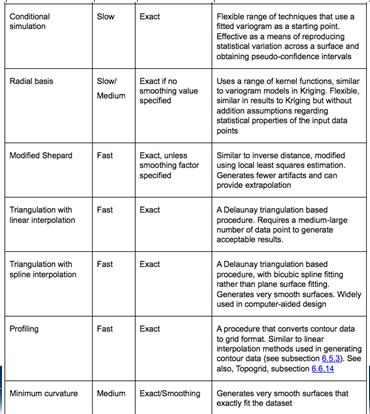
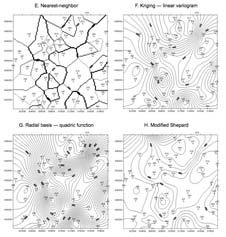
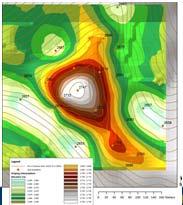
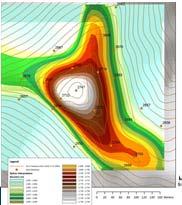
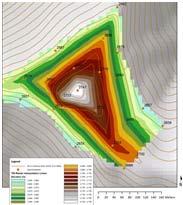
12 INTERPOLATION METHODS COMPARED From INTERPOLATION METHODS COMPARED INTERPOLATION METHODS COMPARED TIN with Linear Interpolation Local Polynomial Local Polynomial From From INTERPOLATION TECHNIQUES COMPARED CONCISE ARTICLE SUMMARY 12
13 13
Spatial Interpolation & Geostatistics
 (Z i Z j ) 2 / 2 Spatial Interpolation & Geostatistics Lag Lag Mean Distance between pairs of points 1 Tobler s Law All places are related, but nearby places are related more than distant places Corollary:
Spatial Interpolation - Geostatistics 4/3/2018
 Spatial Interpolation - Geostatistics 4/3/201 (Z i Z j ) 2 / 2 Spatial Interpolation & Geostatistics Lag Distance between pairs of points Lag Mean Tobler s Law All places are related, but nearby places
What can we represent as a Surface?
 Geography 38/42:376 GIS II Topic 7: Surface Representation and Analysis (Chang: Chapters 13 & 15) DeMers: Chapter 10 What can we represent as a Surface? Surfaces can be used to represent: Continuously
Lesson 5 overview. Concepts. Interpolators. Assessing accuracy Exercise 5
 Interpolation Tools Lesson 5 overview Concepts Sampling methods Creating continuous surfaces Interpolation Density surfaces in GIS Interpolators IDW, Spline,Trend, Kriging,Natural neighbors TopoToRaster
Watershed Sciences 4930 & 6920 GEOGRAPHIC INFORMATION SYSTEMS
 HOUSEKEEPING Watershed Sciences 4930 & 6920 GEOGRAPHIC INFORMATION SYSTEMS CONTOURS! Self-Paced Lab Due Friday! WEEK SIX Lecture RASTER ANALYSES Joe Wheaton YOUR EXCERCISE Integer Elevations Rounded up
Spatial Interpolation & Geostatistics
 (Z i Z j ) 2 / 2 Spatial Interpolation & Geostatistics Lag Lag Mean Distance between pairs of points 11/3/2016 GEO327G/386G, UT Austin 1 Tobler s Law All places are related, but nearby places are related
Geol 588. GIS for Geoscientists II. Zonal functions. Feb 22, Zonal statistics. Interpolation. Zonal statistics Sp. Analyst Tools - Zonal.
 Zonal functions Geol 588 GIS for Geoscientists II Feb 22, 2011 Zonal statistics Interpolation Zonal statistics Sp. Analyst Tools - Zonal Choose correct attribute for zones (usually: must be unique ID for
Creating Surfaces. Steve Kopp Steve Lynch
 Steve Kopp Steve Lynch Overview Learn the types of surfaces and the data structures used to store them Emphasis on surface interpolation Learn the interpolation workflow Understand how interpolators work
Dijkstra's Algorithm
 Shortest Path Algorithm Dijkstra's Algorithm To find the shortest path from the origin node to the destination node No matrix calculation Floyd s Algorithm To find all the shortest paths from the nodes
Spatial Analysis (Vector) II
 II") Spatial Analysis (Vector) II GEOG 300, Lecture 9 Dr. Anthony Jjumba 1 A Spatial Network is a set of geographic locations interconnected in a system by a number of routes is a system of linear features
Spatial Analysis (Vector) II GEOG 300, Lecture 9 Dr. Anthony Jjumba 1 A Spatial Network is a set of geographic locations interconnected in a system by a number of routes is a system of linear features
GEOGRAPHIC INFORMATION SYSTEMS Lecture 24: Spatial Analyst Continued
 GEOGRAPHIC INFORMATION SYSTEMS Lecture 24: Spatial Analyst Continued Spatial Analyst - Spatial Analyst is an ArcGIS extension designed to work with raster data - in lecture I went through a series of demonstrations
Spatial Analysis and Modeling (GIST 4302/5302) Guofeng Cao Department of Geosciences Texas Tech University
 Guofeng Cao Department of Geosciences Texas Tech University") Spatial Analysis and Modeling (GIST 4302/5302) Guofeng Cao Department of Geosciences Texas Tech University 1 Outline of This Week Last topic, we learned: Spatial autocorrelation of areal data Spatial regression
Spatial Analysis and Modeling (GIST 4302/5302) Guofeng Cao Department of Geosciences Texas Tech University 1 Outline of This Week Last topic, we learned: Spatial autocorrelation of areal data Spatial regression
Surface Creation & Analysis with 3D Analyst
 Esri International User Conference July 23 27 San Diego Convention Center Surface Creation & Analysis with 3D Analyst Khalid Duri Surface Basics Defining the surface Representation of any continuous measurement
Esri International User Conference. San Diego, California. Technical Workshops. July Creating Surfaces. Steve Kopp and Steve Lynch
 Esri International User Conference San Diego, California Technical Workshops July 2011 Creating Surfaces Steve Kopp and Steve Lynch Overview Learn the types of surfaces and the data structures used to
Surface Analysis with 3D Analyst
 2013 Esri International User Conference July 8 12, 2013 San Diego, California Technical Workshop Surface Analysis with 3D Analyst Khalid H. Duri Esri UC2013. Technical Workshop. Why use 3D GIS? Because
Geostatistics Predictions with Deterministic Procedures
 Instituto Superior de Estatística e Gestão de Informação Universidade Nova de Lisboa Master of Science in Geospatial Technologies Geostatistics Predictions with Deterministic Procedures Carlos Alberto
IMPROVING THE ACCURACY OF DIGITAL TERRAIN MODELS
 STUDIA UNIV. BABEŞ BOLYAI, INFORMATICA, Volume XLV, Number 1, 2000 IMPROVING THE ACCURACY OF DIGITAL TERRAIN MODELS GABRIELA DROJ Abstract. The change from paper maps to GIS, in various kinds of geographical
Georeferencing & Spatial Adjustment
 Georeferencing & Spatial Adjustment Aligning Raster and Vector Data to the Real World Rotation Differential Scaling Distortion Skew Translation 1 The Problem How are geographically unregistered data, either
GIS Tools - Geometry. A GIS stores data as different layers of information Different feature types are stored in individual files.
 A Definition of GIS GIS is a system of hardware, software, and procedures designed to support the capture, management, manipulation, analysis, modeling and display of spatially referenced data for solving
Geo372 Vertiefung GIScience. Spatial Interpolation
 Geo372 Vertiefung GIScience Spatial Interpolation Herbstsemester Ross Purves Last week We looked at data quality and integration We saw how uncertainty could be introduced by the concepts we chose, by
Georeferencing & Spatial Adjustment 2/13/2018
 Georeferencing & Spatial Adjustment The Problem Aligning Raster and Vector Data to the Real World How are geographically unregistered data, either raster or vector, made to align with data that exist in
The Problem. Georeferencing & Spatial Adjustment. Nature Of The Problem: For Example: Georeferencing & Spatial Adjustment 9/20/2016
 Georeferencing & Spatial Adjustment Aligning Raster and Vector Data to the Real World The Problem How are geographically unregistered data, either raster or vector, made to align with data that exist in
The Problem. Georeferencing & Spatial Adjustment. Nature of the problem: For Example: Georeferencing & Spatial Adjustment 2/4/2014
 Georeferencing & Spatial Adjustment Aligning Raster and Vector Data to a GIS The Problem How are geographically unregistered data, either raster or vector, made to align with data that exist in geographical
Lecture 6: GIS Spatial Analysis. GE 118: INTRODUCTION TO GIS Engr. Meriam M. Santillan Caraga State University
 Lecture 6: GIS Spatial Analysis GE 118: INTRODUCTION TO GIS Engr. Meriam M. Santillan Caraga State University 1 Spatial Data It can be most simply defined as information that describes the distribution
Cell based GIS. Introduction to rasters
 Week 9 Cell based GIS Introduction to rasters topics of the week Spatial Problems Modeling Raster basics Application functions Analysis environment, the mask Application functions Spatial Analyst in ArcGIS
Statistical surfaces and interpolation. This is lecture ten
 Statistical surfaces and interpolation This is lecture ten Data models for representation of surfaces So far have considered field and object data models (represented by raster and vector data structures).
Geographic Surfaces. David Tenenbaum EEOS 383 UMass Boston
 Geographic Surfaces Up to this point, we have talked about spatial data models that operate in two dimensions How about the rd dimension? Surface the continuous variation in space of a third dimension
Lab 12: Sampling and Interpolation
 Lab 12: Sampling and Interpolation What You ll Learn: -Systematic and random sampling -Majority filtering -Stratified sampling -A few basic interpolation methods Videos that show how to copy/paste data
Lecture 22 - Chapter 8 (Raster Analysis, part 3)
") GEOL 452/552 - GIS for Geoscientists I Lecture 22 - Chapter 8 (Raster Analysis, part 3) Today: Zonal Analysis (statistics) for polygons, lines, points, interpolation (IDW), Effects Toolbar, analysis masks
GEOL 452/552 - GIS for Geoscientists I Lecture 22 - Chapter 8 (Raster Analysis, part 3) Today: Zonal Analysis (statistics) for polygons, lines, points, interpolation (IDW), Effects Toolbar, analysis masks
Geostatistics 2D GMS 7.0 TUTORIALS. 1 Introduction. 1.1 Contents
 GMS 7.0 TUTORIALS 1 Introduction Two-dimensional geostatistics (interpolation) can be performed in GMS using the 2D Scatter Point module. The module is used to interpolate from sets of 2D scatter points
DEM Artifacts: Layering or pancake effects
 Outcomes DEM Artifacts: Stream networks & watersheds derived using ArcGIS s HYDROLOGY routines are only as good as the DEMs used. - Both DEM examples below have problems - Lidar and SRTM DEM products are
Geometric Rectification of Remote Sensing Images
 Geometric Rectification of Remote Sensing Images Airborne TerrestriaL Applications Sensor (ATLAS) Nine flight paths were recorded over the city of Providence. 1 True color ATLAS image (bands 4, 2, 1 in
Raster Data. James Frew ESM 263 Winter
 Raster Data 1 Vector Data Review discrete objects geometry = points by themselves connected lines closed polygons attributes linked to feature ID explicit location every point has coordinates 2 Fields
Lab 12: Sampling and Interpolation
 Lab 12: Sampling and Interpolation What You ll Learn: -Systematic and random sampling -Majority filtering -Stratified sampling -A few basic interpolation methods Data for the exercise are in the L12 subdirectory.
Lecture 9. Raster Data Analysis. Tomislav Sapic GIS Technologist Faculty of Natural Resources Management Lakehead University
 Lecture 9 Raster Data Analysis Tomislav Sapic GIS Technologist Faculty of Natural Resources Management Lakehead University Raster Data Model The GIS raster data model represents datasets in which square
Geoprocessing and georeferencing raster data
 Geoprocessing and georeferencing raster data Raster conversion tools Geoprocessing tools ArcCatalog tools ESRI Grid GDB Raster Raster Dataset Raster Catalog Erdas IMAGINE TIFF ArcMap - raster projection
CPSC 695. Methods for interpolation and analysis of continuing surfaces in GIS Dr. M. Gavrilova
 CPSC 695 Methods for interpolation and analysis of continuing surfaces in GIS Dr. M. Gavrilova Overview Data sampling for continuous surfaces Interpolation methods Global interpolation Local interpolation
GEOGRAPHIC INFORMATION SYSTEMS Lecture 25: 3D Analyst
 GEOGRAPHIC INFORMATION SYSTEMS Lecture 25: 3D Analyst 3D Analyst - 3D Analyst is an ArcGIS extension designed to work with TIN data (triangulated irregular network) - many of the tools in 3D Analyst also
Lecture 21 - Chapter 8 (Raster Analysis, part2)
") GEOL 452/552 - GIS for Geoscientists I Lecture 21 - Chapter 8 (Raster Analysis, part2) Today: Digital Elevation Models (DEMs), Topographic functions (surface analysis): slope, aspect hillshade, viewshed,
GEOL 452/552 - GIS for Geoscientists I Lecture 21 - Chapter 8 (Raster Analysis, part2) Today: Digital Elevation Models (DEMs), Topographic functions (surface analysis): slope, aspect hillshade, viewshed,
Surface Analysis. Data for Surface Analysis. What are Surfaces 4/22/2010
 Surface Analysis Cornell University Data for Surface Analysis Vector Triangulated Irregular Networks (TIN) a surface layer where space is partitioned into a set of non-overlapping triangles Attribute and
Introduction to 3D Analysis. Jinwu Ma Jie Chang Khalid Duri
 Introduction to 3D Analysis Jinwu Ma Jie Chang Khalid Duri Area & Volume 3D Analyst Features Detect Change Determine Cut/Fill Calculate Surface Area & Volume Data Management Data Creation Data Conversion
University of West Hungary, Faculty of Geoinformatics. Béla Márkus. Spatial Analysis 5. module SAN5. 3D analysis
 University of West Hungary, Faculty of Geoinformatics Béla Márkus Spatial Analysis 5. module SAN5 3D analysis SZÉKESFEHÉRVÁR 2010 The right to this intellectual property is protected by the 1999/LXXVI
Introduction to Geographic Information Science. Some Updates. Last Lecture 4/6/2017. Geography 4103 / Raster Data and Tesselations.
 Geography 43 / 3 Introduction to Geographic Information Science Raster Data and Tesselations Schedule Some Updates Last Lecture We finished DBMS and learned about storage of data in complex databases Relational
Blacksburg, VA July 24 th 30 th, 2010 Georeferencing images and scanned maps Page 1. Georeference
 George McLeod Prepared by: With support from: NSF DUE-0903270 in partnership with: Geospatial Technician Education Through Virginia s Community Colleges (GTEVCC) Georeference The process of defining how
Lab 12: Sampling and Interpolation
 Lab 12: Sampling and Interpolation What You ll Learn: -Systematic and random sampling -Majority filtering -Stratified sampling -A few basic interpolation methods Data for the exercise are found in the
Software Tutorial Session Universal Kriging
 Software Tutorial Session Universal Kriging The example session with PG2000 which is described in this and Part 1 is intended as an example run to familiarise the user with the package. This documented
Contents of Lecture. Surface (Terrain) Data Models. Terrain Surface Representation. Sampling in Surface Model DEM
 Data Models. Terrain Surface Representation. Sampling in Surface Model DEM") Lecture 13: Advanced Data Models: Terrain mapping and Analysis Contents of Lecture Surface Data Models DEM GRID Model TIN Model Visibility Analysis Geography 373 Spring, 2006 Changjoo Kim 11/29/2006 1
Lecture 13: Advanced Data Models: Terrain mapping and Analysis Contents of Lecture Surface Data Models DEM GRID Model TIN Model Visibility Analysis Geography 373 Spring, 2006 Changjoo Kim 11/29/2006 1
Getting Started with Spatial Analyst. Steve Kopp Elizabeth Graham
 Getting Started with Spatial Analyst Steve Kopp Elizabeth Graham Spatial Analyst Overview Over 100 geoprocessing tools plus raster functions Raster and vector analysis Construct workflows with ModelBuilder,
Analysis of different interpolation methods for uphole data using Surfer software
 10 th Biennial International Conference & Exposition P 203 Analysis of different interpolation methods for uphole data using Surfer software P. Vohat *, V. Gupta,, T. K. Bordoloi, H. Naswa, G. Singh and
DATA MODELS IN GIS. Prachi Misra Sahoo I.A.S.R.I., New Delhi
 DATA MODELS IN GIS Prachi Misra Sahoo I.A.S.R.I., New Delhi -110012 1. Introduction GIS depicts the real world through models involving geometry, attributes, relations, and data quality. Here the realization
interpolation, color, & light Outline HW I Announcements HW II--due today, 5PM HW III on the web later today
 interpolation, color, & light Outline Announcements HW II--due today, 5PM HW III on the web later today HW I: Issues Structured vs. Unstructured Meshes Working with unstructured meshes Interpolation colormaps
Practical 11: Interpolating Point Data in R
 Practical 11: Interpolating Point Data in R This practical provides an introduction to some techniques which are useful for interpolating point data across space in R. Interpolation describes a means of
Constraint-Based Visualization of Spatial Interpolation Data
 Constraint-Based Visualization of Spatial Interpolation Data Peter Revesz Lixin Li Computer Science and Engineering Department University of Nebraska-Lincoln Lincoln, NE 68588, U.S.A. {revesz, lli}@cse.unl.edu
Gridding and Contouring in Geochemistry for ArcGIS
 Gridding and Contouring in Geochemistry for ArcGIS The Geochemsitry for ArcGIS extension includes three gridding options: Minimum Curvature Gridding, Kriging and a new Inverse Distance Weighting algorithm.
Accuracy, Support, and Interoperability. Michael F. Goodchild University of California Santa Barbara
 Accuracy, Support, and Interoperability Michael F. Goodchild University of California Santa Barbara The traditional view Every object has a true position and set of attributes with enough time and resources
Steps for Modeling a Proposed New Reservoir in GIS
 Steps for Modeling a Proposed New Reservoir in GIS Requirements: ArcGIS ArcMap, ArcScene, Spatial Analyst, and 3D Analyst There s a new reservoir proposed for Right Hand Fork in Logan Canyon. I wanted
Generating a New Shapefile
 Week 9 Generating a New Shapefile STEPS 1) Select a appropriate folder or folder connection in the Catalog tree. 2) Click on Contents tab and move cursor into that window 3) Right click in that window
Final project: Lecture 21 - Chapter 8 (Raster Analysis, part2) GEOL 452/552 - GIS for Geoscientists I
 GEOL 452/552 - GIS for Geoscientists I") GEOL 452/552 - GIS for Geoscientists I Lecture 21 - Chapter 8 (Raster Analysis, part2) Talk about class project (copy follow_along_data\ch8a_class_ex into U:\ArcGIS\ if needed) Catch up with lecture 20
GEOL 452/552 - GIS for Geoscientists I Lecture 21 - Chapter 8 (Raster Analysis, part2) Talk about class project (copy follow_along_data\ch8a_class_ex into U:\ArcGIS\ if needed) Catch up with lecture 20
Watershed Sciences 4930 & 6920 ADVANCED GIS
 Slides by Wheaton et al. (2009-2014) are licensed under a Creative Commons Attribution-NonCommercial-ShareAlike 3.0 Unported License Watershed Sciences 4930 & 6920 ADVANCED GIS VECTOR ANALYSES Joe Wheaton
ANALYSIS OF THE PROBLEMS OF INTERPOLATION IN GIS MEDIUM
 ANALYSIS OF THE PROBLEMS OF INTERPOLATION IN GIS MEDIUM Abstract George Valev, Penka Kastreva The spatial interpolation is a widely spread operation in GIS. In a previous paper [6] of the authors it has
Watershed Sciences 4930 & 6920 GEOGRAPHIC INFORMATION SYSTEMS
 Watershed Sciences 4930 & 6920 GEOGRAPHIC INFORMATION SYSTEMS WATS 4930/6920 WHERE WE RE GOING WATS 6915 welcome to tag along for any, all or none WEEK FIVE Lecture VECTOR ANALYSES Joe Wheaton HOUSEKEEPING
Getting Started with Spatial Analyst. Steve Kopp Elizabeth Graham
 Getting Started with Spatial Analyst Steve Kopp Elizabeth Graham Workshop Overview Fundamentals of using Spatial Analyst What analysis capabilities exist and where to find them How to build a simple site
Learn the various 3D interpolation methods available in GMS
 v. 10.4 GMS 10.4 Tutorial Learn the various 3D interpolation methods available in GMS Objectives Explore the various 3D interpolation algorithms available in GMS, including IDW and kriging. Visualize the
Crea%ng DEMs From LiDAR Point Cloud Data
 Crea%ng DEMs From LiDAR Point Cloud Data C. Crosby (ccrosby@sdsc.edu) San Diego Supercomputer Center / OpenTopography.org Ramon Arrowsmith SESE, ASU 2009 SCEC LiDAR Short Course Digital ElevaEon Models
DIGITAL TERRAIN MODELS
 DIGITAL TERRAIN MODELS 1 Digital Terrain Models Dr. Mohsen Mostafa Hassan Badawy Remote Sensing Center GENERAL: A Digital Terrain Models (DTM) is defined as the digital representation of the spatial distribution
Using Kriging Methods to Estimate Damage Distribution
 Lehigh University Lehigh Preserve Theses and Dissertations 2011 Using Kriging Methods to Estimate Damage Distribution Bing Wang Lehigh University Follow this and additional works at: http://preserve.lehigh.edu/etd
LECTURE 2 SPATIAL DATA MODELS
 LECTURE 2 SPATIAL DATA MODELS Computers and GIS cannot directly be applied to the real world: a data gathering step comes first. Digital computers operate in numbers and characters held internally as binary
Non Stationary Variograms Based on Continuously Varying Weights
 Non Stationary Variograms Based on Continuously Varying Weights David F. Machuca-Mory and Clayton V. Deutsch Centre for Computational Geostatistics Department of Civil & Environmental Engineering University
3. Data Structures for Image Analysis L AK S H M O U. E D U
 3. Data Structures for Image Analysis L AK S H M AN @ O U. E D U Different formulations Can be advantageous to treat a spatial grid as a: Levelset Matrix Markov chain Topographic map Relational structure
DIGITAL TERRAIN MODELLING. Endre Katona University of Szeged Department of Informatics
 DIGITAL TERRAIN MODELLING Endre Katona University of Szeged Department of Informatics katona@inf.u-szeged.hu The problem: data sources data structures algorithms DTM = Digital Terrain Model Terrain function:
DEM Artifacts: Layering or pancake effects
 Outcomes DEM Artifacts: Stream networks & watersheds derived using ArcGIS s HYDROLOGY routines are only as good as the DEMs used. - Both DEM examples below have problems - Lidar and SRTM DEM products are
Representing Geography
 Data models and axioms Chapters 3 and 7 Representing Geography Road map Representing the real world Conceptual models: objects vs fields Implementation models: vector vs raster Vector topological model
GEO 580 Lab 4 Geostatistical Analysis
 GEO 580 Lab 4 Geostatistical Analysis In this lab, you will move beyond basic spatial analysis (querying, buffering, clipping, joining, etc.) to learn the application of some powerful statistical techniques
Watershed Sciences 4930 & 6920 GEOGRAPHIC INFORMATION SYSTEMS
 Watershed Sciences 4930 & 6920 GEOGRAPHIC INFORMATION SYSTEMS WEEK Four Lecture 7 EDITING & ATTRIBUTING DATA & METADATA Joe Wheaton HOUSEKEEPING - AFTER WATS 4931/6921 Proposals Due Feb 1 st Feb 3 rd!
Lecture 20 - Chapter 8 (Raster Analysis, part1)
") GEOL 452/552 - GIS for Geoscientists I Lecture 20 - Chapter 8 (Raster Analysis, part) 4 lectures on rasters - but won t cover everything (Raster GIS course: Geol 588: GIS II (Spring 20) Today: Raster data,
GEOL 452/552 - GIS for Geoscientists I Lecture 20 - Chapter 8 (Raster Analysis, part) 4 lectures on rasters - but won t cover everything (Raster GIS course: Geol 588: GIS II (Spring 20) Today: Raster data,
SPATIAL DATA MODELS Introduction to GIS Winter 2015
 SPATIAL DATA MODELS Introduction to GIS Winter 2015 GIS Data Organization The basics Data can be organized in a variety of ways Spatial location, content (attributes), frequency of use Come up with a system
ELEVATION SURFACE INTERPOLATION OF POINT DATA USING DIFFERENT TECHNIQUES A GIS APPROACH
 ELEVATION SURFACE INTERPOLATION OF POINT DATA USING DIFFERENT TECHNIQUES A GIS APPROACH Kulapraote Prathuchai Geoinforatics Center, Asian Institute of Technology, 58 Moo9, Klong Luang, Pathuthani, Thailand.
A COMPARISON OF SPATIAL INTERPOLATION METH- ODS FOR ESTIMATION OF AVERAGE ELECTROMAG- NETIC FIELD MAGNITUDE
 Progress In Electromagnetics Research M, Vol. 14, 135 145, 2010 A COMPARISON OF SPATIAL INTERPOLATION METH- ODS FOR ESTIMATION OF AVERAGE ELECTROMAG- NETIC FIELD MAGNITUDE M. Azpurua and K. Dos Ramos Instituto
Mapping Distance and Density
 Mapping Distance and Density Distance functions allow you to determine the nearest location of something or the least-cost path to a particular destination. Density functions, on the other hand, allow
Spatial and temporal rainfall approximation using additive models
 ANZIAM J. 42 (E) ppc1599 C1611, 2000 C1599 Spatial and temporal rainfall approximation using additive models C. Zoppou S. Roberts M. Hegland (Received 7 August 2000) Abstract We investigate the approximation
Spatial Analysis Exercise GIS in Water Resources Fall 2011
 Spatial Analysis Exercise GIS in Water Resources Fall 2011 Prepared by David G. Tarboton and David R. Maidment Goal The goal of this exercise is to serve as an introduction to Spatial Analysis with ArcGIS.
Applied Cartography and Introduction to GIS GEOG 2017 EL. Lecture-7 Chapters 13 and 14
 Applied Cartography and Introduction to GIS GEOG 2017 EL Lecture-7 Chapters 13 and 14 Data for Terrain Mapping and Analysis DEM (digital elevation model) and TIN (triangulated irregular network) are two
A technique for constructing monotonic regression splines to enable non-linear transformation of GIS rasters
 18 th World IMACS / MODSIM Congress, Cairns, Australia 13-17 July 2009 http://mssanz.org.au/modsim09 A technique for constructing monotonic regression splines to enable non-linear transformation of GIS
Copyright The McGraw-Hill Companies, Inc. Permission required for reproduction or display.
 Chapter 13. TERRAIN MAPPING AND ANALYSIS 13.1 Data for Terrain Mapping and Analysis 13.1.1 DEM 13.1.2 TIN Box 13.1 Terrain Data Format 13.2 Terrain Mapping 13.2.1 Contouring 13.2.2 Vertical Profiling 13.2.3
Surface Modeling with GIS
 Surface Modeling with GIS By Abdul Mohsen Al Maskeen ID # 889360 For CRP 514: Introduction to GIS Course Instructor: Dr. Baqer Al-Ramadan Date: December 29, 2004 1 Outline Page # Outline -------------------------------------------------------------
Crea%ng DEMs From LiDAR Point Cloud Data
 Crea%ng DEMs From LiDAR Point Cloud Data C. Crosby (ccrosby@sdsc.edu) San Diego Supercomputer Center / OpenTopography.org Ramon Arrowsmith SESE, ASU 2011 SCEC LiDAR Short Course Digital ElevaEon Models
Raster model. Alexandre Gonçalves, DECivil, IST
 Raster model 1. Resolution 2. Values and data types 3. Storage 4. Fitting rasters 5. Map algebra 6. Interpolation 7. Conversion vector raster 8. Vector vs. raster 1 Raster model Divides the space into
ASSIGNMENT 3 Cobalt data T:\sys502\arcview\projects\Cobalt_2 T:\sys502\arcview\ projects\cobalt_2\cobalt_2.mxd T:\sys502\arcview\projects\Cobalt_2
 ESE 502 Tony E. Smith ASSIGNMENT 3 (1) In this study you will use some of the Cobalt data from Vancouver Island Geochemistry data set in B&G (pp.150, 202) to carry out essentially the same type of analysis
Introduction to Objective Analysis
 Chapter 4 Introduction to Objective Analysis Atmospheric data are routinely collected around the world but observation sites are located rather randomly from a spatial perspective. On the other hand, most
FMA901F: Machine Learning Lecture 3: Linear Models for Regression. Cristian Sminchisescu
 FMA901F: Machine Learning Lecture 3: Linear Models for Regression Cristian Sminchisescu Machine Learning: Frequentist vs. Bayesian In the frequentist setting, we seek a fixed parameter (vector), with value(s)
Exercise #5b - Geometric Correction of Image Data
 Exercise #5b - Geometric Correction of Image Data 5.6 Geocoding or Registration of geometrically uncorrected image data 5.7 Resampling 5.8 The Ukrainian coordinate system 5.9 Selecting Ground Control Points
Raster Data. James Frew ESM 263 Winter
 Raster Data 1 Vector Data Review discrete objects geometry = points by themselves connected lines closed polygons agributes linked to feature ID explicit localon every point has coordinates 2 Fields in
Lab 1: Introduction to ArcGIS
 Lab 1: Introduction to ArcGIS Objectives In this lab you will: 1) Learn the basics of the software package we will be using for the remainder of the semester, and 2) Discover the role that climate and
03 - Reconstruction. Acknowledgements: Olga Sorkine-Hornung. CSCI-GA Geometric Modeling - Spring 17 - Daniele Panozzo
 3 - Reconstruction Acknowledgements: Olga Sorkine-Hornung Geometry Acquisition Pipeline Scanning: results in range images Registration: bring all range images to one coordinate system Stitching/ reconstruction:
L7 Raster Algorithms
 L7 Raster Algorithms NGEN6(TEK23) Algorithms in Geographical Information Systems by: Abdulghani Hasan, updated Nov 216 by Per-Ola Olsson Background Store and analyze the geographic information: Raster
Chapter 8: How to Pick a GIS
 Chapter 8: How to Pick a GIS 8. The Evolution of GIS Software 8.2 GIS and Operating Systems 8.3 GIS Software Capabilities 8.4 GIS Software and Data Structures 8.5 Choosing the Best GIS David Tenenbaum
Raster GIS applications
 Raster GIS applications Columns Rows Image: cell value = amount of reflection from surface DEM: cell value = elevation (also slope/aspect/hillshade/curvature) Thematic layer: cell value = category or measured
EAT 233/3 GEOGRAPHIC INFORMATION SYSTEM (GIS)
") EAT 233/3 GEOGRAPHIC INFORMATION SYSTEM (GIS) CO3: Ability to produce detail mapping using geographic information systems (GIS) BY : AYU WAZIRA AZHARI SPATIAL DATA & THE MODELLING Spatial Data in GIS Spatial
EAT 233/3 GEOGRAPHIC INFORMATION SYSTEM (GIS) CO3: Ability to produce detail mapping using geographic information systems (GIS) BY : AYU WAZIRA AZHARI SPATIAL DATA & THE MODELLING Spatial Data in GIS Spatial
Stream network delineation and scaling issues with high resolution data
 Stream network delineation and scaling issues with high resolution data Roman DiBiase, Arizona State University, May 1, 2008 Abstract: In this tutorial, we will go through the process of extracting a stream
Thoughts on Representing Spatial Objects. William A. Huber Quantitative Decisions Rosemont, PA
 Thoughts on Representing Spatial Objects William A. Huber Quantitative Decisions Rosemont, PA Overview 1. Some Ways to Structure Space 2. What to Put into a Grid 3. Objects and Fields 4. Hybrid Structures