Review of Cartographic Data Types and Data Models
|
|
|
- Colin Lee
- 6 years ago
- Views:
Transcription
1 Review of Cartographic Data Types and Data Models
2 GIS Data Models
3 Raster Versus Vector in GIS Analysis Fundamental element used to represent spatial features: Raster: pixel or grid cell. Vector: x,y coordinate pair. Area for which data values are stored in each system: Raster: must store value for each cell of the grid, which covers the entire study area. Vector: stores locational data only for objects of interest within the study area.


4 Modeling Geospatial Reality Raster Model Vector Model Real World
5 Coding Vector GIS Reality Vector Mode Model of Reality

6 Coding Vector GIS node B node C node A node D Polygon I Polygon IV Polygon II node E Polygon III Polygon V node G node F Reality Vector Mode Model of Reality
7 Coding Raster GIS Data Reality Raster Mode Model of Reality

8 Coding Raster GIS Data Reality Raster Mode Model of Reality
9 Representing Value and Location in Raster points: Space: Points location: cell position as specified by row and column position within grid, which should be geo-referenced. value: specified by the number stored for the cell. Vector points: location: position specified by single x, y coordinate pair. value: stored as data values in attribute file and tied to the point by means of a geo-code.
10 Points in the World Out There Raster Encoding Points Encoded as Raster Resulting Image
11 Y 1 2 Point X Y 1 X 1 Y X 2 Y 2 3 X 3 Y 3 4 Points in the World Out There X 4 X 4 Y 4 Vector Encoding Points Encoded as Vector Resulting Image
12 Representing Value and Location in Raster lines: Space: Lines location: linear set of contiguous cells, each identified by a row and column location and each having the same data value. value: data value of each linear feature is represented by the cell value stored for each cell. Vector lines: location: ordered set of x,y coordinate pairs. value: a geo-code assigned to the line is tied to a geocode in an attribute file where the computer stores the data value or values for the line.
13 Lines in the World Out There No 0Road Road Raster Encoding Lines Encoded as Raster Resulting Image
14 Y Line X Y Lines in the World Out There Vertex Node X 1 X 11 Y 11 X 12 Y X 1n Y 1n 2 X 21 Y 21 X 2n Y 2n 3 X 31 Y 31 X 32 Y X 3n Y 3n 4 X 41 Y 41 X 4n Y 4n Vector Encoding Lines Encoded as Vector Resulting Image
15 Vector Line Theme Raster Line Theme Vector & Raster Themes
16 Representing Values and Location in Raster areas: Space: Areas location: region of contiguous cells all of which have the same data value. value: data value stored for each cell is the data value for the area [e.g., for population density, a density of 589 would be represented by assigning each cell comprising the area the value 589]. Vector areas: location: closed set of x,y coordinate pairs. value: point within area is tied by means of a geo-code to an attribute file value or values to be assigned to the area defined by the x,y coordinates.
17 Industry Residential Agriculture Areas in the World Out There Raster Encoding Areas Encoded as Raster Resulting Raster Image
18 Capturing Vector Data
19 Y Industry 1 Digitizing Polygon 1 Residential 2 Digitizing Polygon Agriculture 3 Digitizing Polygon 3 Digitizing is fun for a short time X
20 Y Area X Y Industry 1 Residential 2 1 X 11 Y 11 X 1i Y 1i X 11 Y 11 2 X 21 Y 21. Agriculture 3 Areas in the World Out There X X 2i Y 2i X 21 Y 21 3 X 31 Y 31 X 3i Y 3i X 31 Y 31 Areas Vector Encoding Encoded as Industry Residential Vector Agriculture Resulting Vector Image

21 Vector Area Theme Raster Area Theme
22 Representing Values and Location in Raster volume: Space: Volume location: row and column position represents position on the surface. value: cell data value represents the height of the surface at the location of the cell. Vector volume: location: x,y coordinates position triangles that comprise a TIN. value: z data value stored for each x,y coordinate position.


23 Vector Surface Theme Raster Surface Theme
24 Whether Raster or Vector All Layers Must Be Geo-referenced and Rectified
25 Wells Streams Block Groups Latitude Earth Longitude Elevation Assign Coordinate Values to Locations
26 Raster Conventions
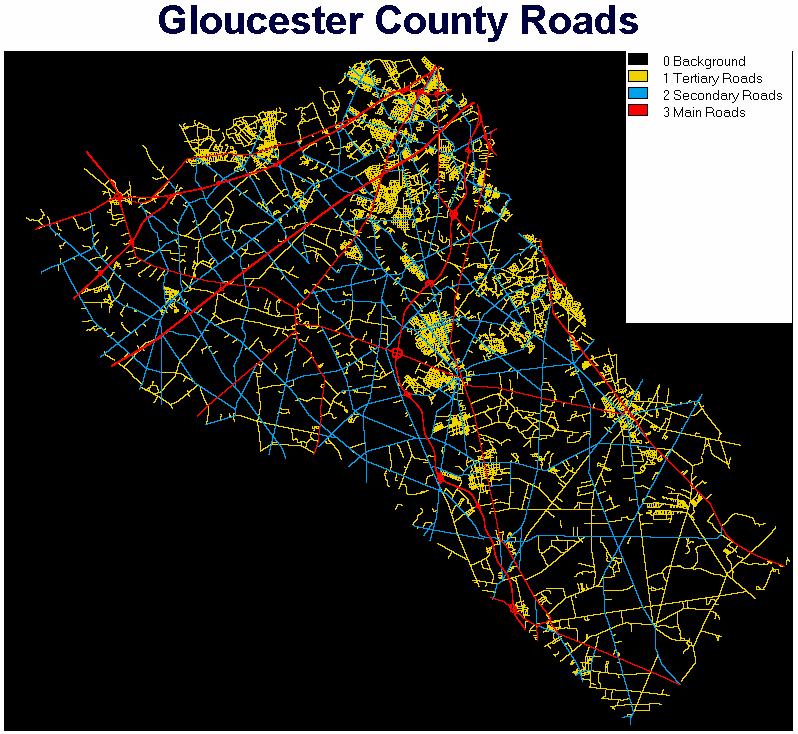
27 Raster Database Conventions Divide entire study area in a regular grid of cells. Assign one and only one data value to each cell. Database consists of a set of maps or layers each of which depicts the same well-defined region or study area [Washington Township in Gloucester County]. Each layer describes a single characteristic of each cell within the study area [e.g., land use]. Describe multiple features with multiple layers.
28 Raster Definitions Orientation: angle between true north and the direction defined by the columns of the raster. N
29 Raster Definitions Region: within a single layer, a set of contiguous cells that all have the same value. Zone: all of the regions within a layer that have the same value 1. 1 In much of the GIS literature Arc Map s region is called a zone and Arc Map s zone is called a class.

30 Raster Zone and Region All of the forest taken together represents a single zone. Zone Region Each individual set of contiguous forest cells represents a single region.
31 Cell Value Assignment: Qualitative Data Predominant type or majority rules--category taking up largest proportion of cell determines cell value [land use]. Cell center value-cell gets value of category at its center. Presence or absence [e.g., if phenomenon is present, cell takes value--road] Precedence of types: assign cell a value reflecting the most important category present. Number or proportion [e.g., cell value = number of items present in cell--wells]

32 Majority Rules Assignment

33 Presence / Absence
34 Precedence of Type

35 Ratio Value
36 Interpolated Value
SPATIAL DATA MODELS Introduction to GIS Winter 2015
 SPATIAL DATA MODELS Introduction to GIS Winter 2015 GIS Data Organization The basics Data can be organized in a variety of ways Spatial location, content (attributes), frequency of use Come up with a system
LECTURE 2 SPATIAL DATA MODELS
 LECTURE 2 SPATIAL DATA MODELS Computers and GIS cannot directly be applied to the real world: a data gathering step comes first. Digital computers operate in numbers and characters held internally as binary
Class #2. Data Models: maps as models of reality, geographical and attribute measurement & vector and raster (and other) data structures
 data structures") Class #2 Data Models: maps as models of reality, geographical and attribute measurement & vector and raster (and other) data structures Role of a Data Model Levels of Data Model Abstraction GIS as Digital
Class #2 Data Models: maps as models of reality, geographical and attribute measurement & vector and raster (and other) data structures Role of a Data Model Levels of Data Model Abstraction GIS as Digital
17/07/2013 RASTER DATA STRUCTURE GIS LECTURE 4 GIS DATA MODELS AND STRUCTURES RASTER DATA MODEL& STRUCTURE TIN- TRIANGULAR IRREGULAR NETWORK
 RASTER DATA STRUCTURE GIS LECTURE 4 GIS DATA MODELS AND STRUCTURES Space is subdivided into regular grids of square grid cells or other forms of polygonal meshes known as picture elements (pixels) the
GEOGRAPHIC INFORMATION SYSTEMS Lecture 02: Feature Types and Data Models
 GEOGRAPHIC INFORMATION SYSTEMS Lecture 02: Feature Types and Data Models Feature Types and Data Models How Does a GIS Work? - a GIS operates on the premise that all of the features in the real world can
Attribute Accuracy. Quantitative accuracy refers to the level of bias in estimating the values assigned such as estimated values of ph in a soil map.
 Attribute Accuracy Objectives (Entry) This basic concept of attribute accuracy has been introduced in the unit of quality and coverage. This unit will teach a basic technique to quantify the attribute
Spatial Data Models. Raster uses individual cells in a matrix, or grid, format to represent real world entities
 Spatial Data Models Raster uses individual cells in a matrix, or grid, format to represent real world entities Vector uses coordinates to store the shape of spatial data objects David Tenenbaum GEOG 7
Maps as Numbers: Data Models
 Maps as Numbers: Data Models vertices E Reality S E S arcs S E Conceptual Models nodes E Logical Models S Start node E End node S Physical Models 1 The Task An accurate, registered, digital map that can
Understanding Geospatial Data Models
 Understanding Geospatial Data Models 1 A geospatial data model is a formal means of representing spatially referenced information. It is a simplified view of physical entities and a conceptualization of
Data Models and Data processing in GIS
 PDHonline Course L155G (5 PDH) Data Models and Data processing in GIS Instructor: Steve Ramroop, Ph.D. 2012 PDH Online PDH Center 5272 Meadow Estates Drive Fairfax, VA 22030-6658 Phone & Fax: 703-988-0088
GEOGRAPHIC INFORMATION SYSTEMS Lecture 25: 3D Analyst
 GEOGRAPHIC INFORMATION SYSTEMS Lecture 25: 3D Analyst 3D Analyst - 3D Analyst is an ArcGIS extension designed to work with TIN data (triangulated irregular network) - many of the tools in 3D Analyst also
Longley Chapter 3. Representations
 Longley Chapter 3 Digital Geographic Data Representation Geographic Data Type Data Models Representing Spatial and Temporal Data Attributes The Nature of Geographic Data Representations Are needed to convey
Cell based GIS. Introduction to rasters
 Week 9 Cell based GIS Introduction to rasters topics of the week Spatial Problems Modeling Raster basics Application functions Analysis environment, the mask Application functions Spatial Analyst in ArcGIS
EAT 233/3 GEOGRAPHIC INFORMATION SYSTEM (GIS)
") EAT 233/3 GEOGRAPHIC INFORMATION SYSTEM (GIS) CO3: Ability to produce detail mapping using geographic information systems (GIS) BY : AYU WAZIRA AZHARI SPATIAL DATA & THE MODELLING Spatial Data in GIS Spatial
EAT 233/3 GEOGRAPHIC INFORMATION SYSTEM (GIS) CO3: Ability to produce detail mapping using geographic information systems (GIS) BY : AYU WAZIRA AZHARI SPATIAL DATA & THE MODELLING Spatial Data in GIS Spatial
DATA MODELS IN GIS. Prachi Misra Sahoo I.A.S.R.I., New Delhi
 DATA MODELS IN GIS Prachi Misra Sahoo I.A.S.R.I., New Delhi -110012 1. Introduction GIS depicts the real world through models involving geometry, attributes, relations, and data quality. Here the realization
Contents of Lecture. Surface (Terrain) Data Models. Terrain Surface Representation. Sampling in Surface Model DEM
 Data Models. Terrain Surface Representation. Sampling in Surface Model DEM") Lecture 13: Advanced Data Models: Terrain mapping and Analysis Contents of Lecture Surface Data Models DEM GRID Model TIN Model Visibility Analysis Geography 373 Spring, 2006 Changjoo Kim 11/29/2006 1
Lecture 13: Advanced Data Models: Terrain mapping and Analysis Contents of Lecture Surface Data Models DEM GRID Model TIN Model Visibility Analysis Geography 373 Spring, 2006 Changjoo Kim 11/29/2006 1
Computer Database Structure for Managing Data :-
 The Map as an Abstraction of Space :- We begin the process of abstraction by conceptualizing what we encounter as a group of points, lines, areas and surfaces. We make decision about which object to take
GIS Visualization, 3D Visualization and Animation. Tomislav Sapic GIS Technologist Faculty of Natural Resources Management Lakehead University
 GIS Visualization, 3D Visualization and Animation Tomislav Sapic GIS Technologist Faculty of Natural Resources Management Lakehead University Definitions 3D Visualization: Presenting or observing spatial,
Neighbourhood Operations Specific Theory
 Neighbourhood Operations Specific Theory Neighbourhood operations are a method of analysing data in a GIS environment. They are especially important when a situation requires the analysis of relationships
GPS/GIS Activities Summary
 GPS/GIS Activities Summary Group activities Outdoor activities Use of GPS receivers Use of computers Calculations Relevant to robotics Relevant to agriculture 1. Information technologies in agriculture
Maps as Numbers: Data Models
 Maps as Numbers: Data Models vertices nodes tart node nd node arcs Reality Conceptual Models The Task An accurate, registered, digital map that can be queried and analyzed Translate: Real World Locations,
Suitability Modeling with GIS
 Developed and Presented by Juniper GIS 1/33 Course Objectives What is Suitability Modeling? The Suitability Modeling Process Cartographic Modeling GIS Tools for Suitability Modeling Demonstrations of Models
Objectives. Cartographic Data Capture. Concepts, and Hardware, Review Review of data needed to make a map. Overview. Information needed to make a map
 Objectives Cartographic Data Capture Concepts, and Hardware, Provide Provide an overview of the basic tasks of data capture: conversion of graphic information that appears as points, lines, and areas on
Introduction to Geographic Information Science. Some Updates. Last Lecture 4/6/2017. Geography 4103 / Raster Data and Tesselations.
 Geography 43 / 3 Introduction to Geographic Information Science Raster Data and Tesselations Schedule Some Updates Last Lecture We finished DBMS and learned about storage of data in complex databases Relational
Lecture 06. Raster and Vector Data Models. Part (1) Common Data Models. Raster. Vector. Points. Points. ( x,y ) Area. Area Line.
 Common Data Models. Raster. Vector. Points. Points. ( x,y ) Area. Area Line.") Lecture 06 Raster and Vector Data Models Part (1) 1 Common Data Models Vector Raster Y Points Points ( x,y ) Line Area Line Area 2 X 1 3 Raster uses a grid cell structure Vector is more like a drawn map
Lecture 06 Raster and Vector Data Models Part (1) 1 Common Data Models Vector Raster Y Points Points ( x,y ) Line Area Line Area 2 X 1 3 Raster uses a grid cell structure Vector is more like a drawn map
Smart GIS Course. Developed By. Mohamed Elsayed Elshayal. Elshayal Smart GIS Map Editor and Surface Analysis. First Arabian GIS Software
 Smart GIS Course Developed By Mohamed Elsayed Elshayal Elshayal Smart GIS Map Editor and Surface Analysis First Arabian GIS Software http://www.freesmartgis.blogspot.com/ http://tech.groups.yahoo.com/group/elshayalsmartgis/
GIS in agriculture scale farm level - used in agricultural applications - managing crop yields, monitoring crop rotation techniques, and estimate
 Types of Input GIS in agriculture scale farm level - used in agricultural applications - managing crop yields, monitoring crop rotation techniques, and estimate soil loss from individual farms or agricultural
RASTER ANALYSIS S H A W N L. P E N M A N E A R T H D A T A A N A LY S I S C E N T E R U N I V E R S I T Y O F N E W M E X I C O
 RASTER ANALYSIS S H A W N L. P E N M A N E A R T H D A T A A N A LY S I S C E N T E R U N I V E R S I T Y O F N E W M E X I C O TOPICS COVERED Spatial Analyst basics Raster / Vector conversion Raster data
layers in a raster model
 layers in a raster model Layer 1 Layer 2 layers in an vector-based model (1) Layer 2 Layer 1 layers in an vector-based model (2) raster versus vector data model Raster model Vector model Simple data structure
Statistical surfaces and interpolation. This is lecture ten
 Statistical surfaces and interpolation This is lecture ten Data models for representation of surfaces So far have considered field and object data models (represented by raster and vector data structures).
Advances in geographic information systems and remote sensing for fisheries and aquaculture
 29 5. Preparing data for GIS use G.J. Meaden (FAO consultant, Canterbury, United Kingdom), J. Jenness (FAO consultant, Flagstaff, Arizona, United States of America), and S.Walker (NOAA Coastal Services
Welcome to NR402 GIS Applications in Natural Resources. This course consists of 9 lessons, including Power point presentations, demonstrations,
 Welcome to NR402 GIS Applications in Natural Resources. This course consists of 9 lessons, including Power point presentations, demonstrations, readings, and hands on GIS lab exercises. Following the last
Guide to Mapping Website (Public) December 2016 GC_236594
 December 2016 GC_236594") Guide to Mapping Website (Public) December 2016 GC_236594 Table of Contents Guide to Mapping Website (Public)... 1 December 2016... 1 Quick Start... 3 Map Layers... 4 How do I?... 5 Draw on the Map...
Guide to Mapping Website (Public) December 2016 GC_236594 Table of Contents Guide to Mapping Website (Public)... 1 December 2016... 1 Quick Start... 3 Map Layers... 4 How do I?... 5 Draw on the Map...
8 Geographers Tools: Automated Mapping. Digitizing a Map IMPORTANT 2/19/19. v Tues., Feb. 26, 2019.
 Next Class: FIRST EXAM v Tues., Feb. 26, 2019. Combination of multiple choice questions and map interpretation. Bring a #2 pencil with eraser. Based on class lectures supplementing Chapter 1. Review lectures
Introduction to GIS. Geographic Information Systems SOCR-377 9/24/2015. R. Khosla Fall Semester The real world. What in the world is GIS?
 Introduction to GIS Geographic Information Systems SOCR-377 What in the world is GIS? GIS is simultaneously the telescope, the microscope, the computer and the Xerox machine of regional analysis and synthesis
8 Geographers Tools: Automated Mapping. Digitizing a Map 2/19/19 IMPORTANT. Revising a Digitized Map. The Digitized Map. vtues., Feb. 26, 2019.
 Next Class: FIRST EXAM 8 Geographers Tools: Automated Mapping vtues., Feb. 26, 2019. Combination of multiple choice questions and map interpretation. Bring a #2 pencil with eraser. Based on class lectures
Geoprocessing and georeferencing raster data
 Geoprocessing and georeferencing raster data Raster conversion tools Geoprocessing tools ArcCatalog tools ESRI Grid GDB Raster Raster Dataset Raster Catalog Erdas IMAGINE TIFF ArcMap - raster projection
Spatial data and QGIS
 Spatial data and QGIS Xue Jingbo IT Center 2017.08.07 A GIS consists of: Spatial Data. Computer Hardware. Computer Software. Longitude Latitude Disease Date 26.870436-31.909519 Mumps 13/12/2008 26.868682-31.909259
Applied Cartography and Introduction to GIS GEOG 2017 EL. Lecture-7 Chapters 13 and 14
 Applied Cartography and Introduction to GIS GEOG 2017 EL Lecture-7 Chapters 13 and 14 Data for Terrain Mapping and Analysis DEM (digital elevation model) and TIN (triangulated irregular network) are two
Esri International User Conference. July San Diego Convention Center. Lidar Solutions. Clayton Crawford
 Esri International User Conference July 23 27 San Diego Convention Center Lidar Solutions Clayton Crawford Outline Data structures, tools, and workflows Assessing lidar point coverage and sample density
GIS DATA MODELS AND SPATIAL DATA STRUCTURE
 UNIT 5 GIS DATA MODELS AND SPATIAL DATA STRUCTURE GIS Data Models and Spatial Data 5.1 Introduction Objectives 5.2 GIS Data Models Raster Data Models Vector Data Models Comparison of Raster and Vector
GIS Data Models. 4/9/ GIS Data Models
 GIS Data Models 1 Conceptual models of the real world The real world can be described using two conceptually different models: 1. As discrete objects, possible to represent as points, lines or polygons.
Lecture 6: GIS Spatial Analysis. GE 118: INTRODUCTION TO GIS Engr. Meriam M. Santillan Caraga State University
 Lecture 6: GIS Spatial Analysis GE 118: INTRODUCTION TO GIS Engr. Meriam M. Santillan Caraga State University 1 Spatial Data It can be most simply defined as information that describes the distribution
Objectives Learn how to work with projections in SMS, and how to combine data from different coordinate systems into the same SMS project.
 v. 12.3 SMS 12.3 Tutorial Working with map projections in SMS Objectives Learn how to work with projections in SMS, and how to combine data from different coordinate systems into the same SMS project.
GEOSPATIAL ENGINEERING COMPETENCIES. Geographic Information Science
 GEOSPATIAL ENGINEERING COMPETENCIES Geographic Information Science The character and structure of spatial information, its methods of capture, organisation, classification, qualification, analysis, management,
Chapter 17 Creating a New Suit from Old Cloth: Manipulating Vector Mode Cartographic Data
 Chapter 17 Creating a New Suit from Old Cloth: Manipulating Vector Mode Cartographic Data Imagine for a moment that digital cartographic databases were a perfect analog of the paper map. Once you digitized
GEOGRAPHIC INFORMATION SYSTEMS Lecture 18: Spatial Modeling
 Spatial Analysis in GIS (cont d) GEOGRAPHIC INFORMATION SYSTEMS Lecture 18: Spatial Modeling - the basic types of analysis that can be accomplished with a GIS are outlined in The Esri Guide to GIS Analysis
Geographic Information Systems. using QGIS
 Geographic Information Systems using QGIS 1 - INTRODUCTION Generalities A GIS (Geographic Information System) consists of: -Computer hardware -Computer software - Digital Data Generalities GIS softwares
Measure the Perimeter of Polygons Over a Surface. Operations. What Do I Need?
 Measure the Perimeter of Polygons Over a Surface Operations What Do I Need? Incremental Frontage Score To measure the perimeter of polygons over a surface you need to have two input map layers. The first
Steps for Modeling a Proposed New Reservoir in GIS
 Steps for Modeling a Proposed New Reservoir in GIS Requirements: ArcGIS ArcMap, ArcScene, Spatial Analyst, and 3D Analyst There s a new reservoir proposed for Right Hand Fork in Logan Canyon. I wanted
v SMS Tutorials Working with Rasters Prerequisites Requirements Time Objectives
 v. 12.2 SMS 12.2 Tutorial Objectives Learn how to import a Raster, view elevations at individual points, change display options for multiple views of the data, show the 2D profile plots, and interpolate
Purpose: To explore the raster grid and vector map element concepts in GIS.
 GIS INTRODUCTION TO RASTER GRIDS AND VECTOR MAP ELEMENTS c:wou:nssi:vecrasex.wpd Purpose: To explore the raster grid and vector map element concepts in GIS. PART A. RASTER GRID NETWORKS Task A- Examine
Surface Creation & Analysis with 3D Analyst
 Esri International User Conference July 23 27 San Diego Convention Center Surface Creation & Analysis with 3D Analyst Khalid Duri Surface Basics Defining the surface Representation of any continuous measurement
L7 Raster Algorithms
 L7 Raster Algorithms NGEN6(TEK23) Algorithms in Geographical Information Systems by: Abdulghani Hasan, updated Nov 216 by Per-Ola Olsson Background Store and analyze the geographic information: Raster
v Working with Rasters SMS 12.1 Tutorial Requirements Raster Module Map Module Mesh Module Time minutes Prerequisites Overview Tutorial
 v. 12.1 SMS 12.1 Tutorial Objectives This tutorial teaches how to import a Raster, view elevations at individual points, change display options for multiple views of the data, show the 2D profile plots,
Metadata or "data about data" describe the content, quality, condition, and other characteristics of data. The Federal Geographic Data Committee
 Metadata or "data about data" describe the content, quality, condition, and other characteristics of data. The Federal Geographic Data Committee (http://www.fgdc.gov/) approved the Content Standard for
Remote Sensing and GIS. GIS Spatial Overlay Analysis
 Subject Paper No and Title Module No and Title Module Tag Geology Remote Sensing and GIS GIS Spatial Overlay Analysis RS & GIS XXXI Principal Investigator Co-Principal Investigator Co-Principal Investigator
Representing Geography
 Data models and axioms Chapters 3 and 7 Representing Geography Road map Representing the real world Conceptual models: objects vs fields Implementation models: vector vs raster Vector topological model
Raster GIS. Raster GIS 11/1/2015. The early years of GIS involved much debate on raster versus vector - advantages and disadvantages
 Raster GIS Google Earth image (raster) with roads overlain (vector) Raster GIS The early years of GIS involved much debate on raster versus vector - advantages and disadvantages 1 Feb 21, 2010 MODIS satellite
Algorithms for GIS csci3225
 Algorithms for GIS csci3225 Laura Toma Bowdoin College Spatial data types and models Spatial data in GIS satellite imagery planar maps surfaces networks point cloud (LiDAR) Spatial data in GIS satellite
v TUFLOW-2D Hydrodynamics SMS Tutorials Time minutes Prerequisites Overview Tutorial
 v. 12.2 SMS 12.2 Tutorial TUFLOW-2D Hydrodynamics Objectives This tutorial describes the generation of a TUFLOW project using the SMS interface. This project utilizes only the two dimensional flow calculation
Tutorial: Using SAGA for Least Cost Path Analysis
 Tutorial: Using SAGA for Least Cost Path Analysis Developed by Kim Cimmery (Kapcimmery at hot mail dot com) March 2013 1. Introduction The shortest path between two points is a straight line (unless you
4/7/2009. Model: Abstraction of reality following formal rules e.g. Euclidean space for physical space
 Model: Abstraction of reality following formal rules e.g. Euclidean space for physical space At different levels: mathematical model (Euclidean space) conceptual design model (ER model) data model (design)
Geographic Information Systems (GIS) Spatial Analyst [10] Dr. Mohammad N. Almasri. [10] Spring 2018 GIS Dr. Mohammad N. Almasri Spatial Analyst
![Geographic Information Systems (GIS) Spatial Analyst [10] Dr. Mohammad N. Almasri. [10] Spring 2018 GIS Dr. Mohammad N. Almasri Spatial Analyst](/thumbs/80/81171101.jpg "Geographic Information Systems (GIS) Spatial Analyst [10] Dr. Mohammad N. Almasri. [10] Spring 2018 GIS Dr. Mohammad N. Almasri Spatial Analyst") Geographic Information Systems (GIS) Spatial Analyst [10] Dr. Mohammad N. Almasri 1 Preface POINTS, LINES, and POLYGONS are good at representing geographic objects with distinct shapes They are less good
Geographic Information Systems (GIS) Spatial Analyst [10] Dr. Mohammad N. Almasri 1 Preface POINTS, LINES, and POLYGONS are good at representing geographic objects with distinct shapes They are less good
Registering new custom watershed models or other polygonal themes
 Technical manual 55 Registering new custom watershed models or other polygonal themes Add new watershed model The Add New Watershed Model... option on the AWRD Modules menu allows users to register new
FREE TUTORING. Digitizing a Map. 8 Geographers Tools: Automated Mapping. The Digitized Map. Revising a Digitized Map 9/28/2018. Next class: First Exam
 Next class: First Exam Tuesday, October 2, 2018. Combination of multiple choice questions and map interpretation. Bring a #2 pencil with eraser. Based on class lectures supplementing Chapter 1. Review
Map Library ArcView Version 1 02/20/03 Page 1 of 12. ArcView GIS
 Map Library ArcView Version 1 02/20/03 Page 1 of 12 1. Introduction 1 ArcView GIS ArcView is the most popular desktop GIS analysis and map presentation software package.. With ArcView GIS you can create
Geol 588. GIS for Geoscientists II. Zonal functions. Feb 22, Zonal statistics. Interpolation. Zonal statistics Sp. Analyst Tools - Zonal.
 Zonal functions Geol 588 GIS for Geoscientists II Feb 22, 2011 Zonal statistics Interpolation Zonal statistics Sp. Analyst Tools - Zonal Choose correct attribute for zones (usually: must be unique ID for
Introduction to Geographic Information Systems Dr. Arun K Saraf Department of Earth Sciences Indian Institute of Technology, Roorkee
 Introduction to Geographic Information Systems Dr. Arun K Saraf Department of Earth Sciences Indian Institute of Technology, Roorkee Lecture 04 Raster data model and comparisons with vector Hello friends,
I. An Intro to ArcMap Version 9.3 and 10. 1) Arc Map is basically a build your own Google map
 Arc Map is basically a build your own Google map") I. An Intro to ArcMap Version 9.3 and 10 What is Arc Map? 1) Arc Map is basically a build your own Google map a. Display and manage geo-spatial data (maps, images, points that have a geographic location)
I. An Intro to ArcMap Version 9.3 and 10 What is Arc Map? 1) Arc Map is basically a build your own Google map a. Display and manage geo-spatial data (maps, images, points that have a geographic location)
Objectives Learn how to work with projections in SMS, and how to combine data from different coordinate systems into the same SMS project.
 v. 12.2 SMS 12.2 Tutorial Working with map projections in SMS Objectives Learn how to work with projections in SMS, and how to combine data from different coordinate systems into the same SMS project.
GOVERNMENT GAZETTE REPUBLIC OF NAMIBIA
 GOVERNMENT GAZETTE OF THE REPUBLIC OF NAMIBIA N$7.20 WINDHOEK - 7 October 2016 No. 6145 CONTENTS Page GENERAL NOTICE No. 406 Namibia Statistics Agency: Data quality standard for the purchase, capture,
The 3D Analyst extension extends ArcGIS to support surface modeling and 3- dimensional visualization. 3D Shape Files
 NRM 435 Spring 2016 ArcGIS 3D Analyst Page#1 of 9 0B3D Analyst Extension The 3D Analyst extension extends ArcGIS to support surface modeling and 3- dimensional visualization. 3D Shape Files Analogous to
GIS Workshop Spring 2016
 1/ 14 GIS Geographic Information System. An integrated collection of computer software and data used to view and manage information about geographic places, analyze spatial relationships, and model spatial
Bharath Setturu Research scholar, EWRG, Center for Ecological Sciences, IISc, Bangalore & EWRG-CES IIIT-HYDERABAD
 Bharath Setturu Research scholar, EWRG, Center for Ecological Sciences, IISc, Bangalore settur@ces.iisc.ernet.in & IIIT-HYDERABAD Introduction to QGIS oquantum GIS (QGIS) is a GIS tool for managing geographical
Raster GIS applications
 Raster GIS applications Columns Rows Image: cell value = amount of reflection from surface DEM: cell value = elevation (also slope/aspect/hillshade/curvature) Thematic layer: cell value = category or measured
Geometric Rectification of Remote Sensing Images
 Geometric Rectification of Remote Sensing Images Airborne TerrestriaL Applications Sensor (ATLAS) Nine flight paths were recorded over the city of Providence. 1 True color ATLAS image (bands 4, 2, 1 in
Graphic Display of Vector Object
 What is GIS? GIS stands for Geographic Information Systems, although the term Geographic Information Science is gaining popularity. A GIS is a software platform for storing, organizing, viewing, querying,
Lab 12: Sampling and Interpolation
 Lab 12: Sampling and Interpolation What You ll Learn: -Systematic and random sampling -Majority filtering -Stratified sampling -A few basic interpolation methods Videos that show how to copy/paste data
Algorithms for GIS. Spatial data: Models and representation (part I) Laura Toma. Bowdoin College
 Laura Toma. Bowdoin College") Algorithms for GIS Spatial data: Models and representation (part I) Laura Toma Bowdoin College Outline Spatial data in GIS applications Point data Networks Terrains Planar maps and meshes Data structures
Algorithms for GIS Spatial data: Models and representation (part I) Laura Toma Bowdoin College Outline Spatial data in GIS applications Point data Networks Terrains Planar maps and meshes Data structures
Image Services for Elevation Data
 Image Services for Elevation Data Peter Becker Need for Elevation Using Image Services for Elevation Data sources Creating Elevation Service Requirement: GIS and Imagery, Integrated and Accessible Field
Matthew Heric, Geoscientist and Kevin D. Potter, Product Manager. Autometric, Incorporated 5301 Shawnee Road Alexandria, Virginia USA
 INTEGRATIONS OF STRUCTURED QUERY LANGUAGE WITH GEOGRAPHIC INFORMATION SYSTEM PROCESSING: GeoServer Matthew Heric, Geoscientist and Kevin D. Potter, Product Manager Autometric, Incorporated 5301 Shawnee
Main concepts of ILWIS 3.0
 CHAPTER 2 Main concepts of ILWIS 3.0 In chapter one, Introduction to ILWIS, you started with ILWIS, and learned the basics of the user interface. This chapter presents some key concepts of ILWIS. In section
v Introduction to WMS Become familiar with the WMS interface WMS Tutorials Time minutes Prerequisite Tutorials None
 s v. 10.0 WMS 10.0 Tutorial Become familiar with the WMS interface Objectives Read files into WMS and change modules and display options to become familiar with the WMS interface. Prerequisite Tutorials
Lidar and GIS: Applications and Examples. Dan Hedges Clayton Crawford
 Lidar and GIS: Applications and Examples Dan Hedges Clayton Crawford Outline Data structures, tools, and workflows Assessing lidar point coverage and sample density Creating raster DEMs and DSMs Data area
M. Andrea Rodríguez-Tastets. I Semester 2008
 M. -Tastets Universidad de Concepción,Chile andrea@udec.cl I Semester 2008 Outline refers to data with a location on the Earth s surface. Examples Census data Administrative boundaries of a country, state
Training i Course Remote Sensing Basic Theory & Image Processing Methods September 2011
 Training i Course Remote Sensing Basic Theory & Image Processing Methods 19 23 September 2011 Geometric Operations Michiel Damen (September 2011) damen@itc.nl ITC FACULTY OF GEO-INFORMATION SCIENCE AND
Bharath Setturu Research scholar, EWRG, Center for Ecological Sciences, IISc, Bangalore & IIIT-HYDERABAD
 Bharath Setturu Research scholar, EWRG, Center for Ecological Sciences, IISc, Bangalore settur@ces.iisc.ernet.in & IIIT-HYDERABAD Introduction to QGIS oquantum GIS (QGIS) is a GIS tool for managing geographical
Accuracy, Support, and Interoperability. Michael F. Goodchild University of California Santa Barbara
 Accuracy, Support, and Interoperability Michael F. Goodchild University of California Santa Barbara The traditional view Every object has a true position and set of attributes with enough time and resources
Raster Data. James Frew ESM 263 Winter
 Raster Data 1 Vector Data Review discrete objects geometry = points by themselves connected lines closed polygons attributes linked to feature ID explicit location every point has coordinates 2 Fields
First Exam Thurs., Sept 28
 First Exam Thurs., Sept 28 Combination of multiple choice questions and map interpretation. Bring a #2 pencil with eraser. Based on class lectures supplementing chapter. Review lecture presentations 9.
Ilham Marsudi Universitas Negeri Yogyakarta Yogyakarta, Indonesia
 1st International Conference on Technology and Vocational Teachers (ICTVT 2017) Making a Digital Contour Map Ilham Marsudi Universitas Negeri Yogyakarta Yogyakarta, Indonesia ilham@uny.ac.id Abstract---
Data Representation in Visualisation
 Data Representation in Visualisation Visualisation Lecture 4 Taku Komura Institute for Perception, Action & Behaviour School of Informatics Taku Komura Data Representation 1 Data Representation We have
RASTER ANALYSIS GIS Analysis Fall 2013
 RASTER ANALYSIS GIS Analysis Fall 2013 Raster Data The Basics Raster Data Format Matrix of cells (pixels) organized into rows and columns (grid); each cell contains a value representing information. What
Chapter 3: Maps as Numbers
 Chapter 3: Maps as Numbers 3. Representing Maps as Numbers 3.2 Structuring Attributes 3.3 Structuring Maps 3.4 Why Topology Matters 3.5 Formats for GIS Data 3.6 Exchanging Data David Tenenbaum EEOS 265
Lecture 4: Digital Elevation Models
 Lecture 4: Digital Elevation Models GEOG413/613 Dr. Anthony Jjumba 1 Digital Terrain Modeling Terms: DEM, DTM, DTEM, DSM, DHM not synonyms. The concepts they illustrate are different Digital Terrain Modeling
4.0 DIGITIZATION, EDITING AND STRUCTURING OF MAP DATA
 .0 DIGITIZATION, EDITING AND STRUCTURING OF MAP DATA The process of digitizing existing maps is a transformation from one analog) form of information to another digital) form. Data input is the operation
Introducing ArcScan for ArcGIS
 Introducing ArcScan for ArcGIS An ESRI White Paper August 2003 ESRI 380 New York St., Redlands, CA 92373-8100, USA TEL 909-793-2853 FAX 909-793-5953 E-MAIL info@esri.com WEB www.esri.com Copyright 2003
v Introduction to WMS WMS 11.0 Tutorial Become familiar with the WMS interface Prerequisite Tutorials None Required Components Data Map
 s v. 11.0 WMS 11.0 Tutorial Become familiar with the WMS interface Objectives Import files into WMS and change modules and display options to become familiar with the WMS interface. Prerequisite Tutorials