Contour Plots for Slab Elevation Data using MathCAD. John M. Clark Clark Engineers, Inc. May 8, 2013
|
|
|
- Leslie Mitchell
- 6 years ago
- Views:
Transcription
1 Contour Plots for Slab Elevation Data using MathCAD John M. Clark Clark Engineers, Inc. May 8, 2013
2 Contour Plots for Slab Elevation Data using MathCAD
3 Why use MathCAD when there are other contour plotting programs available? 3
4 Why use MathCAD when there are other contour plotting programs available? The power of MathCAD 4
5 Why use MathCAD when there are other contour plotting programs available? The power of MathCAD Plots in inches, mm, feet etc. 5
6 Why use MathCAD when there are other contour plotting programs available? The power of MathCAD Plots in Inches, mm, feet etc. Can be done by competent ACAD operator 6
7 What is MathCAD Live mathematical calculator 7
8 What is MathCAD Live mathematical calculator Equations are live Not hidden in cells like Excel 8
9 What is MathCAD Live mathematical calculator Equations are live Not hidden in cells like Excel Names are unique Can use subscripts & various fonts, Greek letters 9
10 What is MathCAD Live mathematical calculator Equations are live Not hidden in cells like Excel Names are unique Can use subscripts & various fonts, Greek letters Work with any units 10
11 What is MathCAD Live mathematical calculator Equations are live Not hidden in cells like Excel Names are unique Can use subscripts & various fonts, Greek letters Work with any units Can define your own units eg. pcf 11
12 What is MathCAD Live mathematical calculator Equations are live Not hidden in cells like Excel Names are unique Can use subscripts & various fonts, Greek letters Work with any units Can define your own units eg. pcf Can mix units eg. lbf * mm= kip* ft 12
13 What is MathCAD Live mathematical calculator Equations are live Not hidden in cells like Excel Names are unique Can use subscripts & various fonts, Greek letters Work with any units Can define your own units eg. pcf Can mix units eg. lbf * mm= kip* ft Results can be displayed in any unit system 13
14 What is MathCAD Live mathematical calculator Equations are live Not hidden in cells like Excel Names are unique Can use subscripts & various fonts, Greek letters Work with any units Can define your own units eg. pcf Can mix units eg. lbf * mm= kip* ft Results can be displayed in any unit system Never have to multiply or divide by 12 14
15 What is MathCAD Live mathematical calculator Equations are live Not hidden in cells like Excel Names are unique Can use subscripts & various fonts, Greek letters Work with any units Can define your own units eg. pcf Can mix units eg. lbf * mm= kip* ft Results can be displayed in any unit system Never have to multiply or divide by 12 Hundreds of built in functions (logical, statistical, math, matrices) 15
16 What is MathCAD Live mathematical calculator Equations are live Not hidden in cells like Excel Names are unique Can use subscripts & various fonts, Greek letters Work with any units Can define your own units eg. pcf Can mix units eg. lbf * mm= kip* ft Results can be displayed in any unit system Never have to multiply or divide by 12 Hundreds of built in functions (logical, statistical, math, matrices) Many Built in Units For length, time, temp., pressure, current, acceleration, currency, 16
17 What is MathCAD Live mathematical calculator Equations are live Not hidden in cells like Excel Names are unique Can use subscripts & various fonts, Greek letters Work with any units Can define your own units eg. pcf Can mix units eg. lbf * mm= kip* ft Results can be displayed in any unit system Never have to multiply or divide by 12 Hundreds of built in functions (logical, statistical, math, matrices) Many Built in Units For length, time, temp., pressure, current, acceleration, currency, All physical fields Many built in constants, e, R, K, F, c,, 17
18 What is MathCAD Live mathematical calculator Equations are live Not hidden in cells like Excel Names are unique Can use subscripts & various fonts, Greek letters Work with any units Can define your own units eg. pcf Can mix units eg. lbf * mm= kip* ft Results can be displayed in any unit system Never have to multiply or divide by 12 Hundreds of built in functions (logical, statistical, math, matrices) Many Built in Units For length, time, temp., pressure, current, acceleration, currency, All physical fields Many built in constants, e, R, K, F, c,, Complex Numbers 18
19 What is MathCAD Live mathematical calculator Equations are live Not hidden in cells like Excel Names are unique Can use subscripts & various fonts, Greek letters Work with any units Can define your own units eg. pcf Can mix units eg. lbf * mm= kip* ft Results can be displayed in any unit system Never have to multiply or divide by 12 Hundreds of built in functions (logical, statistical, math, matrices) Many Built in Units For length, time, temp., pressure, current, acceleration, currency, All physical fields Many built in constants, e, R, K, F, c,, Complex Numbers Write small programs for special conditions or functions 19
20 What is MathCAD Live mathematical calculator Equations are live Not hidden in cells like Excel Names are unique Can use subscripts & various fonts, Greek letters Work with any units Can define your own units eg. pcf Can mix units eg. lbf * mm= kip* ft Results can be displayed in any unit system Never have to multiply or divide by 12 Hundreds of built in functions (logical, statistical, math, matrices) Many Built in Units For length, time, temp., pressure, current, acceleration, currency, All physical fields Many built in constants, e, R, K, F, c,, Complex Numbers Write small programs for special conditions or functions Like a live visible program 20
21 What is MathCAD Live mathematical calculator Equations are live Not hidden in cells like Excel Names are unique Can use subscripts & various fonts, Greek letters Work with any units Can define your own units eg. pcf Can mix units eg. lbf * mm= kip* ft Results can be displayed in any unit system Never have to multiply or divide by 12 Hundreds of built in functions (logical, statistical, math, matrices) Many Built in Units For length, time, temp., pressure, current, acceleration, currency, All physical fields Many built in constants, e, R, K, F, c,, Complex Numbers Write small programs for special conditions or functions Like a live visible program Does pretty much all that spreadsheets will do and much more 21
22 What is MathCAD Live mathematical calculator Equations are live Not hidden in cells like Excel Names are unique Can use subscripts & various fonts, Greek letters Work with any units Can define your own units eg. pcf Can mix units eg. lbf * mm= kip* ft Results can be displayed in any unit system Never have to multiply or divide by 12 Hundreds of built in functions (logical, statistical, math, matrices) Many Built in Units For length, time, temp., pressure, current, acceleration, currency, All physical fields Many built in constants, e, R, K, F, c,, Complex Numbers Write small programs for special conditions or functions Like a live visible program Does pretty much all that spreadsheets will do and much more Clark Engineers, Inc. has used MathCAD since 1996 for all calculations 22
23 What is MathCAD Live mathematical calculator Equations are live Not hidden in cells like Excel Names are unique Can use subscripts & various fonts, Greek letters Work with any units Can define your own units eg. pcf Can mix units eg. lbf * mm= kip* ft Results can be displayed in any unit system Never have to multiply or divide by 12 Hundreds of built in functions (logical, statistical, math, matrices) Many Built in Units For length, time, temp., pressure, current, acceleration, currency, All physical fields Many built in constants, e, R, K, F, c,, Complex Numbers Write small programs for special conditions or functions Like a live visible program Does pretty much all that spreadsheets will do and much more Clark Engineers, Inc. has used MathCAD since 1996 for all calculations Built design sheets for our clients 23
24 Method Plot data in AutoCAD 24
25 Method continued Plot data in AutoCAD Export X, Y, Z coordinates to Excel 25
26 Method continued Plot data in AutoCAD Export X, Y, Z coordinates to Excel Copy data vectors to MathCAD 26
27 Step 1 Take accurate elevations of the foundation 27
28 Step 1 continued Take accurate elevations of the foundation See FPA paper SC012 for more information on data points 28
29 Step 1 continued Take accurate elevations of the foundation See FPA paper SC012 for more information on data points Locate points on accurate field drawing to ± 6 to 12 each way If there is an architectural floor plan available, use this to record points 29
30 Step 2 Make an accurate floor plan in AutoCAD 30
31 Step 2 Make an accurate floor plan in AutoCAD Set units to decimal 31
32 Step 2 Make an accurate floor plan in AutoCAD Set units to decimal Set bottom left and corner to 0,0 32
33 Step 2 Make an accurate floor plan in AutoCAD Set units to decimal Set bottom left and corner to 0,0 Add data points to AutoCAD drawing Must use AutoCAD point command Add Elevation labels as text 33
34 Step 3 For each elevation point, 34
35 Step 3 continued For each elevation point, Click on a single point 35
36 Step 3 continued For each elevation point, Click on a single point Right click 36
37 Step 3 continued For each elevation point, Click on a single point Right click Select properties, menu opens 37

38 Step 3 continued For each elevation point, Click on a single point Right click Select properties, menu opens Edit geometry and record elevation value for z 38

39 Step 3 continued Completed plot with elevation points and text for values. 39


40 Step 4 Data Extraction GO TO: Tools> Data Extraction> 40

41 Step 5 Select Create a new data extraction 41

42 Step 6 Create a file name for the data extraction: Projectname_ELDATA 42

43 Step 7 Select: Select object in drawing 43


44 Step 8 Select entire drawing to select points for contour plots 44

45 Step 9 Select objects cont. Check point box and select next 45
46 Step 10 Under Category Filter, uncheck everything except geometry 46
47 Step 10 Under Category Filter, uncheck everything except geometry Under Properties Filter uncheck X and Y position, leaving only Z position checked 47

48 Step 10 Under Category Filter, uncheck everything except geometry Under Properties Filter uncheck X and Y position, leaving only Z position checked Click next 48
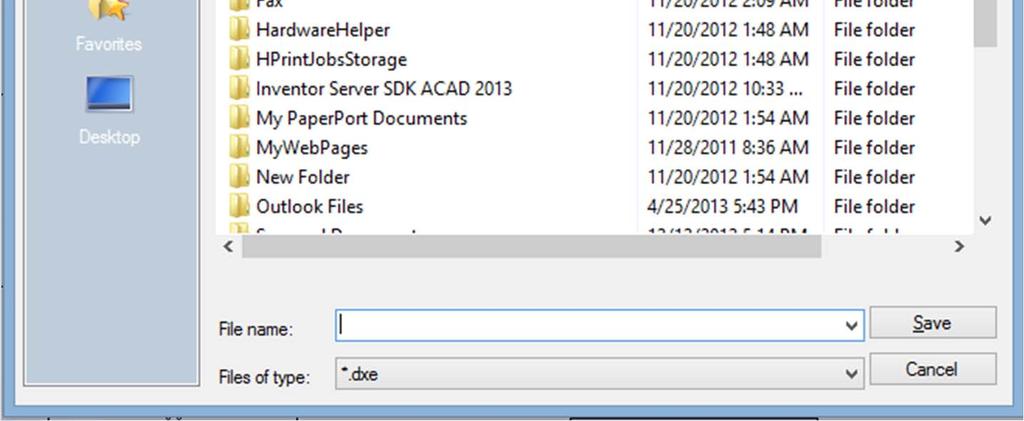
49 Step 11 On final screen, select: Output to external file 49
50 Step 11 On final screen, select: Output to external file Save as name and file type desired (.xls) 50

51 Step 11 On final screen, select: Output to external file Save as name and file type desired (.xls) Click here to browse 51
52 Step 12 Data in Excel Excel Sheet
53 Step 13 Paste data into MathCad Create a variable for the first data column (usually x values) 53
54 Step 13 Paste data into MathCad In the red solid box Right click on the red box and select paste 54

55 Step 13 Paste data into MathCad Add correct units for the vector In this case inches Input vector Vector with units 55
56 Step 13 Paste data into MathCad Add correct units for the vectors In this case inches Use any desired units Output vector Units Changed output to feet 56

57 Step 13 Paste data into MathCad Repeat steps for Y and Z vector 57
58 Step 14 Data will automatically generate a contour plot, surface plot and polynomial of any selected order (n) data fit plot. Typical order for n to use is 1, 2, or 3 Contour Plot Contour Plot 58


59 Step 14 continued You will probably have to adjust X and Y scale 59

60 Raw Data Plot Surface plot These views can be rotated

61 Polynomial Plot These views can be rotated 61


62 Step 15 Adjust scales as required for each plot. For surface plots the Z scale will also have to be adjusted eg: If min elev= -4 ¾ in and max elev= 0.9 in, select say -5 to 1.0 and so on 62

63 Step 15 continued Select number of spaces for convenient vertical scale In this case 6 or 12 63
64 Step 16 Iterate on the polynomial order, usually 2 nd or 3 rd order is ok. Do not use higher than 4 th order. 64
65 Step 17 Once the contour plot is set, Copy and Paste floor plan into excel Zoom in on the floor plan and select all desired members Copy and paste contour plot into excel 65
66 Step 18 Send the contour plot to the back and the floor plan to the front 66
67 Step 19 Align the plots so that the contour plot is aligned with the floor plan 67
68 Step 20 Areas of the contour that are outside the floor plan can be filled by pasting white filled areas using excel drawing tools, or group pictures and edit in Paint what ever is easiest 68
69 Step 21 Select all areas of the final plot and group them 69
70 Step 22 Copy and paste the finished plot to your report document as required 70
71 MathCAD Sheet This MathCAD sheet can be obtained free from by providing three documented appropriate references (engineers, architects, scientists, CAD technicians, contractors etc.) who are not members of FPA. 71
WEEK NO. 12 MICROSOFT EXCEL 2007
 WEEK NO. 12 MICROSOFT EXCEL 2007 LESSONS OVERVIEW: GOODBYE CALCULATORS, HELLO SPREADSHEET! 1. The Excel Environment 2. Starting A Workbook 3. Modifying Columns, Rows, & Cells 4. Working with Worksheets
Pre-Lab Excel Problem
 Pre-Lab Excel Problem Read and follow the instructions carefully! Below you are given a problem which you are to solve using Excel. If you have not used the Excel spreadsheet a limited tutorial is given
Name: Dr. Fritz Wilhelm Lab 1, Presentation of lab reports Page # 1 of 7 5/17/2012 Physics 120 Section: ####
 Name: Dr. Fritz Wilhelm Lab 1, Presentation of lab reports Page # 1 of 7 Lab partners: Lab#1 Presentation of lab reports The first thing we do is to create page headers. In Word 2007 do the following:
Following a tour is the easiest way to learn Prism.
 Page 1 of 25 A tour of Prism Following a tour is the easiest way to learn Prism. View a movie Watch and listen to a ten minute introductory movie from Prism's Welcome dialog. Or view it on the web. Read
Fractions and decimals have opposites, just as integers do. For example, 5 8 and 2 5
 Domain 1 Lesson Rational Numbers Common Core Standards: 6.NS., 6.NS.6.c, 6.NS.7.c Getting the Idea A rational number is a number that can be expressed as the ratio of two integers in the form a, where
Quick. Efficient. Versatile. Graphing Software for Scientists and Engineers.
 Quick. GrapherTM 3 Efficient. Versatile. Graphing Discover the easy-to-use and powerful capabilities of Grapher 3! Your graphs are too important not to use the most superior graphing program available.
Designing & Creating your GIS Poster
 Designing & Creating your GIS Poster Revised by Carolyn Talmadge, 11/26/2018 First think about your audience and purpose, then design your poster! Here are instructions for setting up your poster using
lab MS Excel 2010 active cell
 MS Excel is an example of a spreadsheet, a branch of software meant for performing different kinds of calculations, numeric data analysis and presentation, statistical operations and forecasts. The main
Microsoft Excel 2007
 Microsoft Excel 2007 1 Excel is Microsoft s Spreadsheet program. Spreadsheets are often used as a method of displaying and manipulating groups of data in an effective manner. It was originally created
Scientific Graphing in Excel 2007
 Scientific Graphing in Excel 2007 When you start Excel, you will see the screen below. Various parts of the display are labelled in red, with arrows, to define the terms used in the remainder of this overview.
PARTS OF A WORKSHEET. Rows Run horizontally across a worksheet and are labeled with numbers.
 1 BEGINNING EXCEL While its primary function is to be a number cruncher, Excel is a versatile program that is used in a variety of ways. Because it easily organizes, manages, and displays information,
Using Arrays and Vectors to Make Graphs In Mathcad Charles Nippert
 Using Arrays and Vectors to Make Graphs In Mathcad Charles Nippert This Quick Tour will lead you through the creation of vectors (one-dimensional arrays) and matrices (two-dimensional arrays). After that,
Department of Chemical Engineering ChE-101: Approaches to Chemical Engineering Problem Solving Excel Tutorial VIII
 Department of Chemical Engineering ChE-101: Approaches to Chemical Engineering Problem Solving Excel Tutorial VIII EXCEL Basics (last updated 4/12/06 by GGB) Objectives: These tutorials are designed to
Appendix A. HINTS WHEN USING EXCEL w
 Appendix A HINTS WHEN USING EXCEL w This appendix provides hints when using Microsoft Excel. Appendix A includes general features that are useful in all the applications solved with Excel in this book.
PTC Mathcad Prime 3.0
 Essential PTC Mathcad Prime 3.0 A Guide for New and Current Users Brent Maxfield, P.E. AMSTERDAM BOSTON HEIDELBERG LONDON NEW YORK OXFORD PARIS SAN DIEGO SAN FRANCISCO SINGAPORE SYDNEY TOKYO @ Academic
Scientific Graphing in Excel 2013
 Scientific Graphing in Excel 2013 When you start Excel, you will see the screen below. Various parts of the display are labelled in red, with arrows, to define the terms used in the remainder of this overview.
A cell is highlighted when a thick black border appears around it. Use TAB to move to the next cell to the LEFT. Use SHIFT-TAB to move to the RIGHT.
 Instructional Center for Educational Technologies EXCEL 2010 BASICS Things to Know Before You Start The cursor in Excel looks like a plus sign. When you click in a cell, the column and row headings will
ADD AND NAME WORKSHEETS
 1 INTERMEDIATE EXCEL While its primary function is to be a number cruncher, Excel is a versatile program that is used in a variety of ways. Because it easily organizes, manages, and displays information,
Excel Advanced
 Excel 2016 - Advanced LINDA MUCHOW Alexandria Technical & Community College 320-762-4539 lindac@alextech.edu Table of Contents Macros... 2 Adding the Developer Tab in Excel 2016... 2 Excel Macro Recorder...
Office Suites Seminar
 - 1 - Seminar a Bowie Senior Center Seminar, July 2007 Teacher: Eric Hein (hein1@verizon.net) Download the seminar slides: Start Internet_Explorer go to http://home.comcast.net/~bscclub/training.htm right-click
Within the spreadsheet, columns are labeled with letters and rows are labeled with numbers.
 Excel Exercise 1: Goals: 1. Become familiar with Guidelines for spans and proportions of common spanning members (Chapter 1). 2. Become familiar with basic commands in Excel for performing simple tasks
Basic Math in Microsoft Excel
 Chapter 1 Basic Math in Microsoft Excel In this chapter, we will learn the following to World Class standards: The Excel Layout The Ribbon in Excel Adding in Excel Subtracting in Excel Multiplying in Excel
The toolbars at the top are the standard toolbar and the formatting toolbar.
 Lecture 8 EXCEL Excel is a spreadsheet (all originally developed for bookkeeping and accounting). It is very useful for any mathematical or tabular operations. It allows you to make quick changes in input
STEPHEN WOLFRAM MATHEMATICADO. Fourth Edition WOLFRAM MEDIA CAMBRIDGE UNIVERSITY PRESS
 STEPHEN WOLFRAM MATHEMATICADO OO Fourth Edition WOLFRAM MEDIA CAMBRIDGE UNIVERSITY PRESS Table of Contents XXI a section new for Version 3 a section new for Version 4 a section substantially modified for
The Mathcad Workspace 7
 For information on system requirements and how to install Mathcad on your computer, refer to Chapter 1, Welcome to Mathcad. When you start Mathcad, you ll see a window like that shown in Figure 2-1. By
Lab1: Use of Word and Excel
 Dr. Fritz Wilhelm; physics 230 Lab1: Use of Word and Excel Page 1 of 9 Lab partners: Download this page onto your computer. Also download the template file which you can use whenever you start your lab
Starting Excel application
 MICROSOFT EXCEL 1 2 Microsoft Excel: is a special office program used to apply mathematical operations according to reading a cell automatically, just click on it. It is called electronic tables Starting
Run Specifi by clicking on the icon on your Desktop.
 Run Specifi by clicking on the icon on your Desktop. Note: If you are using a demo version, once the program is loaded, a message will tell you the remaining days of the evaluation period. The main screen
How to Make Graphs with Excel 2007
 Appendix A How to Make Graphs with Excel 2007 A.1 Introduction This is a quick-and-dirty tutorial to teach you the basics of graph creation and formatting in Microsoft Excel. Many of the tasks that you
Microsoft Excel for Beginners
 Microsoft Excel for Beginners training@health.ufl.edu Basic Computing 4 Microsoft Excel 2.0 hours This is a basic computer workshop. Microsoft Excel is a spreadsheet program. We use it to create reports
Drawing. Chapter 11. Bridge. A. Insert Views. Step 1. Click File Menu > New, click Drawing and OK. on the View Layout toolbar.
 Chapter 11 Bridge Drawing A. Insert Views. Step 1. Click File Menu > New, click Drawing and OK. Step 2. Click Model View on the View Layout toolbar. Step 3. Click Browse in the Property Manager. Step 4.
4 th Grade MATH Pacing Guide
 Week 1 First 9 Weeks 4.OA.1 Interpret a multiplication equation as a comparison, e.g., interpret 35 = 5 7 as a statement that 35 is 5 times as many as 7 and 7 times as many as 5. Represent verbal statements
Ms excel. The Microsoft Office Button. The Quick Access Toolbar
 Ms excel MS Excel is electronic spreadsheet software. In This software we can do any type of Calculation & inserting any table, data and making chart and graphs etc. the File of excel is called workbook.
Dale s Freight Fuel Report Assignment. Objectives By the end of this lesson, you will be able to:
 Dale s Freight Fuel Report Assignment Objectives By the end of this lesson, you will be able to: Set up a worksheet Navigate an Excel Window Enter labels and values Create formulas using math operators
Microsoft Excel 2013: Excel Basics June 2014
 Microsoft Excel 2013: Excel Basics June 2014 Description Excel is a powerful spreadsheet program. Please note that in this class we will use Excel 2010 or 2013. Learn how to create spreadsheets, enter
DWG FastView for Web. User Guide
 DWG FastView for Web User Guide Contents 1. Software installation and start-up... 1 1.1 Software installation... 1 1.2 Software start-up... 1 2.Operation interface and functions... 3 2.1 Operation interface...
Run Specifi by clicking on the icon on your Desktop.
 Run Specifi by clicking on the icon on your Desktop. Note: If you are using a demo version, once the program is loaded, a message will tell you the remaining days of the evaluation period. The main screen
Designing & Creating your GIS Poster
 Designing & Creating your GIS Poster Revised by Carolyn Talmadge and Kyle Monahan 4/24/2017 First think about your audience and purpose, then design your poster! Here are instructions for setting up your
EXCEL EXPERT. Starting Excel EXPLORING THE EXCEL WINDOW
 Microsoft Excel Basics What you will learn from this lesson: Explore the workbook window. Navigate through the workbook. Create an Excel worksheet. Use automatic fill. Create formulas. Open an existing
Graphing on Excel. Open Excel (2013). The first screen you will see looks like this (it varies slightly, depending on the version):
. The first screen you will see looks like this (it varies slightly, depending on the version):") Graphing on Excel Open Excel (2013). The first screen you will see looks like this (it varies slightly, depending on the version): The first step is to organize your data in columns. Suppose you obtain
Graphing on Excel Open Excel (2013). The first screen you will see looks like this (it varies slightly, depending on the version): The first step is to organize your data in columns. Suppose you obtain
v SMS Tutorials Working with Rasters Prerequisites Requirements Time Objectives
 v. 12.2 SMS 12.2 Tutorial Objectives Learn how to import a Raster, view elevations at individual points, change display options for multiple views of the data, show the 2D profile plots, and interpolate
Using Mathcad to Perform Mathematics Charles Nippert
 Using Mathcad to Perform Mathematics Charles Nippert These notes are designed to be an introduction to Mathcad. They all are a quick tour of the principal features of the Mathcad program. To prepare these
CAPS Computer Aided Product Selection Program
 CAPS Computer Aided Product Selection Program This instructional guide includes: Improve and Increase Your Design Throughput and Productivity with CAPS....... 3 1. Create a My Greenheck Account............................
Microsoft Excel 2016 / 2013 Basic & Intermediate
 Microsoft Excel 2016 / 2013 Basic & Intermediate Duration: 2 Days Introduction Basic Level This course covers the very basics of the Excel spreadsheet. It is suitable for complete beginners without prior
How to use Excel Spreadsheets for Graphing
 How to use Excel Spreadsheets for Graphing 1. Click on the Excel Program on the Desktop 2. You will notice that a screen similar to the above screen comes up. A spreadsheet is divided into Columns (A,
John's Tutorial on Everyday Mathcad (Version 9/2/09) Mathcad is not the specialist's ultimate mathematical simulator
 Mathcad is not the specialist's ultimate mathematical simulator") John's Tutorial on Everyday Mathcad (Version 9/2/09) Mathcad isn't: Mathcad is not the specialist's ultimate mathematical simulator Applied mathematicians may prefer the power of Mathematica Complex programs
John's Tutorial on Everyday Mathcad (Version 9/2/09) Mathcad isn't: Mathcad is not the specialist's ultimate mathematical simulator Applied mathematicians may prefer the power of Mathematica Complex programs
Migrating from Autodesk Land Desktop to Autodesk Civil 3D CV42-3L
 December 2-5, 2003 MGM Grand Hotel Las Vegas Migrating from Autodesk Land Desktop to Autodesk Civil 3D CV42-3L About the Speaker: Pete Kelsey is an Autodesk Authorized Consultant an Autodesk Certified
Creating a Basic Chart in Excel 2007
 Creating a Basic Chart in Excel 2007 A chart is a pictorial representation of the data you enter in a worksheet. Often, a chart can be a more descriptive way of representing your data. As a result, those
Using Word & Excel to Label and Calculate Catchment Areas and Rainfall Income
 Using Word & Excel to Label and Calculate Catchment Areas and Rainfall Income There are lots of little details you ll need to understand to use Word as a drawing tool, but each individual detail is pretty
MOVING FROM CELL TO CELL
 VCAE: EXCEL Lesson 1 Please send comments to Author: Zahra Siddiqui at zed_ess@hotmail.com Concepts Covered: Cell Address; Cell Pointer; Moving across Cells Constants: Entering, Editing, Formatting Using
EXCEL 2003 DISCLAIMER:
 EXCEL 2003 DISCLAIMER: This reference guide is meant for experienced Microsoft Excel users. It provides a list of quick tips and shortcuts for familiar features. This guide does NOT replace training or
1. Define the material properties. Activate the Data Entry menu if it s not already visible, and click on Materials.
 CE 533, Fall 2014 Guide for Using RISA3D 1 / 9 Example Structure. The procedure for calculating frequencies and modes shapes of a multidegree of freedom (MDOF) system will be demonstrated using the following
Introduction to Microsoft Excel
 Athens-Clarke County Library Page 1 What is a spreadsheet program? Microsoft Excel is an example of a spreadsheet program that will maintain records for you relating to finances, products, activities,
Entering Data in the Spreadsheet
 Excel How To Parts of the Spreadsheet Tiffany Davis, Briggs Elementary School A, B, C, etc. are the heads of the columns. 1, 2, 3, etc. are the heads of the rows. A cell is created by the intersection
Grade 4 Math Proficiency Scales-T1
 Measurement & Data Geometry Critical Thinking Communication Grade 4 Math Proficiency Scales-T1 Novice 1 and of the Make mathematical arguments and critique the reasoning of others. Partially Proficient
Gloucester County Library System. Excel 2010
 Gloucester County Library System Excel 2010 Introduction What is Excel? Microsoft Excel is an electronic spreadsheet program. It is capable of performing many different types of calculations and can organize
Building Professional Services
 Building Professional Services How to create Drawings from your models using Bentley Building Electrical Systems and the USACE Dataset: The Electrical Discipline Master Model: The Discipline Master Model
SAPPHIRE Viewer: The Collaboration Tool
 SAPPHIRE Viewer: The Collaboration Tool MiTek SAPPHIRE Viewer is a scaled down version of SAPPHIRE Structure that allows users to open, view, comment on, and print Structure files. This free application
เพ มภาพตามเน อหาของแต ละบท. Microsoft Excel Benjamas Panyangam and Dr. Dussadee Praserttitipong. Adapted in English by Prakarn Unachak
 เพ มภาพตามเน อหาของแต ละบท Microsoft Excel 2016 Benjamas Panyangam and Dr. Dussadee Praserttitipong Adapted in English by Prakarn Unachak 204100 IT AND MODERN LIFE 1. Excel Basics 2. Calculation and Formula
GAZIANTEP UNIVERSITY INFORMATICS SECTION SEMETER
 GAZIANTEP UNIVERSITY INFORMATICS SECTION 2010-2011-2 SEMETER Microsoft Excel is located in the Microsoft Office paket. in brief Excel is spreadsheet, accounting and graphics program. WHAT CAN WE DO WITH
Effective Collaboration using Autodesk Revit Structure and Autodesk Building Systems
 AUTODESK REVIT STRUCTURE AUTODESK BUILDING SYSTEMS Effective Collaboration using Autodesk Revit Structure and Autodesk Building Systems This white paper explains how structural engineers using Autodesk
Office of Instructional Technology
 Office of Instructional Technology Microsoft Excel 2016 Contact Information: 718-254-8565 ITEC@citytech.cuny.edu Contents Introduction to Excel 2016... 3 Opening Excel 2016... 3 Office 2016 Ribbon... 3
EXCEL SPREADSHEET TUTORIAL
 EXCEL SPREADSHEET TUTORIAL Note to all 200 level physics students: You will be expected to properly format data tables and graphs in all lab reports, as described in this tutorial. Therefore, you are responsible
Using Annotation Sets Part 3 TIP TUTORIAL. Using Annotation Sets Part 3
 TIP TUTORIAL Using Annotation Sets Part 3 INTRODUCTION In Annotation Sets Part 3 you will learn how to work with annotation sets. An annotation set is basically a collection of defaults and layers, which
AGB 260: Agribusiness Data Literacy. Excel Basics
 AGB 260: Agribusiness Data Literacy Excel Basics Useful Chapters in the Textbook Regarding this Lecture Chapter 1: Introducing Excel Chapter 2: Entering and Editing Worksheet Data Chapter 3: Essential
ENV Laboratory 2: Graphing
 Name: Date: Introduction It is often said that a picture is worth 1,000 words, or for scientists we might rephrase it to say that a graph is worth 1,000 words. Graphs are most often used to express data
Skittles Excel Project
 Skittles Excel Project Entering Your Data and Creating Data Displays 1. Open Microsoft Excel 2. Create a table for your Skittles colors: a. In cell A1 type in a title for your chart b. In cell A2 type
Finding the Volume of Solids
 S E S S I O N 1. 5 A Finding the Volume of Solids Math Focus Points Using formulas to find the volume of rectangular prisms Finding the volume of a solid composed of two rectangular prisms Today s Plan
SUM - This says to add together cells F28 through F35. Notice that it will show your result is
 COUNTA - The COUNTA function will examine a set of cells and tell you how many cells are not empty. In this example, Excel analyzed 19 cells and found that only 18 were not empty. COUNTBLANK - The COUNTBLANK
Contents. Session 2. COMPUTER APPLICATIONS Excel Spreadsheets
 Session 2 Contents Contents... 23 Cell Formats cont..... 24 Worksheet Views... 24 Naming Conventions... 25 Copy / Duplicate Worksheets... 27 Entering Formula & Functions... 28 Page - 23 Cell Formats cont..
Microsoft Excel 2010 Tutorial
 1 Microsoft Excel 2010 Tutorial Excel is a spreadsheet program in the Microsoft Office system. You can use Excel to create and format workbooks (a collection of spreadsheets) in order to analyze data and
Excel 2013 Workshop. Prepared by
 Excel 2013 Workshop Prepared by Joan Weeks Computer Labs Manager & Madeline Davis Computer Labs Assistant Department of Library and Information Science June 2014 Excel 2013: Fundamentals Course Description
ezimagex2 User s Guide Version 1.0
 ezimagex2 User s Guide Version 1.0 Copyright and Trademark Information The products described in this document are copyrighted works of AVEN, Inc. 2015 AVEN, Inc. 4595 Platt Rd Ann Arbor, MI 48108 All
MagiCAD for AutoCAD. Frequently Asked Questions
 MagiCAD for AutoCAD Frequently Asked Questions 2 (27) WHY AFTER AN INSTALLATION OF MAGICAD FOR AUTOCAD IT SOMETIMES HAPPENS THAT MAGICAD'S TABS AND MENUS ARE NOT LOADED, OR THAT ALL THE BUTTONS HAVE CLOUDS
KIP Certified AutoCAD Driver. KIP Cost Review Application
 KIP Certified AutoCAD Driver KIP Cost Review Application Contents Introduction... 2 Installation... 3 Cost Review Application Main Menu... 5 Entering Pricing Information and Usage Categories... 6 Production
Intermediate Microsoft Excel 2008
 Intermediate Microsoft Excel 2008 Table of Contents ADVANCED FORMATTING... 2 FORMATTING NUMBERS... 2 WRAPPING TEXT... 3 THE MERGE AND CENTER FUNCTIONS... 4 INSERTING COMMENTS... 5 FREEZE PANES... 6 INSERTING
What's New GRAITEC Advance PowerPack 2016
 What's New GRAITEC Advance PowerPack 2016 Table of contents WELCOME TO GRAITEC POWERPACK FOR REVIT... 5 NEWS... 6 Managers... 6 1: Family Manager... 6 BIM Connect... 7 1: Compliancy with Autodesk Revit
Unit 9: Excel Page( )
") Unit 9: Excel Page( 496-499) Lab: A. Font B. Fill color C. Font color D. View buttons E. Numeric entry F. Row G. Cell H. Column I. Workbook window J. Active sheet K. Status bar L. Range M. Column labels
Unit 9: Excel Page( 496-499) Lab: A. Font B. Fill color C. Font color D. View buttons E. Numeric entry F. Row G. Cell H. Column I. Workbook window J. Active sheet K. Status bar L. Range M. Column labels
EXCEL BASICS: MICROSOFT OFFICE 2010
 EXCEL BASICS: MICROSOFT OFFICE 2010 GETTING STARTED PAGE 02 Prerequisites What You Will Learn USING MICROSOFT EXCEL PAGE 03 Opening Microsoft Excel Microsoft Excel Features Keyboard Review Pointer Shapes
Creating a Directory with a Mail Merge from an Excel Document
 Creating a Directory with a Mail Merge from an Excel Document When you run a mail merge, Word pulls names, addresses, and other information directly from your Excel spreadsheet into the documents you re
Using Attributes. Engineering Design Technology Sacramento City College. Using Attributes 1
 Engineering Design Technology Sacramento City College 1 Objectives Assign attributes to blocks. Edit attributes defined for existing blocks. Create a template file for the storage of block attribute data.
Excel & Business Math Video/Class Project #01 Introduction to Excel. Why We Use Excel for Math. First Formula.
 Excel & Business Math Video/Class Project #01 Introduction to Excel. Why We Use Excel for Math. First Formula. Topics Covered in Video: 1) USB Drive to store files from class... 2 2) Save As to Download
Microsoft Excel 2002 M O D U L E 2
 THE COMPLETE Excel 2002 M O D U L E 2 CompleteVISUAL TM Step-by-step Series Computer Training Manual www.computertrainingmanual.com Copyright Notice Copyright 2002 EBook Publishing. All rights reserved.
KIP Track System User Guide
 User Guide Contents Introduction... 2 System Requirements... 3 Installation... 3 Custom Name of the KIP Track fields... 6 KIP Track Rules... 6 Setup KIP Track Data... 6 Enter and Upload KIP Track Data...
Introducing Microsoft Excel 2000
 Introducing Microsoft Excel 2000 Microsoft Excel is a spreadsheet and graphing program. It replaces your calculator, ledger, and graphing equipment to help you record, analyze, and represent quantitative
Madison County Schools Suggested 4 th Grade Math Pacing Guide
 Madison County Schools Suggested 4 th Grade Math Pacing Guide The following Standards have changes from the original 2015-16 MS College- and Career-Readiness Standards: Significant Changes (ex: change
Open a new Excel workbook and look for the Standard Toolbar.
 This activity shows how to use a spreadsheet to draw line graphs. Open a new Excel workbook and look for the Standard Toolbar. If it is not there, left click on View then Toolbars, then Standard to make
SPREADSHEETS GENERAL FORMATTING & PRINTING.
 SPREADSHEETS GENERAL FORMATTING & PRINTING Spreadsheet Formatting - Contents Printing to one sheet only Displaying gridlines on printouts Displaying column letters and row numbers on printouts Inserting
Microsoft Excel Microsoft Excel
 Excel 101 Microsoft Excel is a spreadsheet program that can be used to organize data, perform calculations, and create charts and graphs. Spreadsheets or graphs created with Microsoft Excel can be imported
3ds Max Cottage Step 1. Always start out by setting up units: We re going with this setup as we will round everything off to one inch.
 3ds Max Cottage Step 1 Always start out by setting up units: We re going with this setup as we will round everything off to one inch. File/Import the CAD drawing Be sure Files of Type is set to all formats
EXCEL BASICS: MICROSOFT OFFICE 2007
 EXCEL BASICS: MICROSOFT OFFICE 2007 GETTING STARTED PAGE 02 Prerequisites What You Will Learn USING MICROSOFT EXCEL PAGE 03 Opening Microsoft Excel Microsoft Excel Features Keyboard Review Pointer Shapes
DOING MORE WITH EXCEL: MICROSOFT OFFICE 2013
 DOING MORE WITH EXCEL: MICROSOFT OFFICE 2013 GETTING STARTED PAGE 02 Prerequisites What You Will Learn MORE TASKS IN MICROSOFT EXCEL PAGE 03 Cutting, Copying, and Pasting Data Basic Formulas Filling Data
Excel 2010: Getting Started with Excel
 Excel 2010: Getting Started with Excel Excel 2010 Getting Started with Excel Introduction Page 1 Excel is a spreadsheet program that allows you to store, organize, and analyze information. In this lesson,
Gloucester County Library System EXCEL 2007
 Gloucester County Library System EXCEL 2007 Introduction What is Excel? Microsoft E x c e l is an electronic s preadsheet program. I t is capable o f performing many diff e r e n t t y p e s o f c a l
GASWorkS 10.0 Example. Town DXF. Summary. Steps. 1) Import The DXF File
 Import The DXF File") Summary In this example, a model will be created from an existing DXF file. The piping drawn in the DXF file will be imported to create the model schematic. The DXF file will also be used as a background
Summary In this example, a model will be created from an existing DXF file. The piping drawn in the DXF file will be imported to create the model schematic. The DXF file will also be used as a background
Excel Primer CH141 Fall, 2017
 Excel Primer CH141 Fall, 2017 To Start Excel : Click on the Excel icon found in the lower menu dock. Once Excel Workbook Gallery opens double click on Excel Workbook. A blank workbook page should appear
Tips & Tricks: MS Excel
 Tips & Tricks: MS Excel 080501.2319 Table of Contents Navigation and References... 3 Layout... 3 Working with Numbers... 5 Power Features... 7 From ACS to Excel and Back... 8 Teacher Notes: Test examples
addition + =5+C2 adds 5 to the value in cell C2 multiplication * =F6*0.12 multiplies the value in cell F6 by 0.12
 BIOL 001 Excel Quick Reference Guide (Office 2010) For your lab report and some of your assignments, you will need to use Excel to analyze your data and/or generate graphs. This guide highlights specific
MICROSOFT EXCEL BIS 202. Lesson 1. Prepared By: Amna Alshurooqi Hajar Alshurooqi
 MICROSOFT EXCEL Prepared By: Amna Alshurooqi Hajar Alshurooqi Lesson 1 BIS 202 1. INTRODUCTION Microsoft Excel is a spreadsheet application used to perform financial calculations, statistical analysis,
Technology Is For You!
 Technology Is For You! Technology Department of Idalou ISD because we love learning! Tuesday, March 4, 2014 MICROSOFT EXCEL Useful website for classroom ideas: YouTube lessons for visual learners: http://www.alicechristie.org/edtech/ss/