Lecture 6: GIS Spatial Analysis. GE 118: INTRODUCTION TO GIS Engr. Meriam M. Santillan Caraga State University
|
|
|
- Lisa Susan Gilmore
- 6 years ago
- Views:
Transcription

1 Lecture 6: GIS Spatial Analysis GE 118: INTRODUCTION TO GIS Engr. Meriam M. Santillan Caraga State University 1

2 Spatial Data It can be most simply defined as information that describes the distribution of things upon the surface of the earth. In effect, it involves any information concerning the location, shape of, and relationships among, geographic features. 2

3 Spatial Analysis Manipulation of spatial data into various forms to be able to extract additional and meaningful information to understand the real-world. Can be highly technical/mathematical but can also be very simple and intuitive. 3
4 Common Examples of Spatial Data Analysis Measurements (lengths, perimeters, areas) Querying Reclassification Buffering and neighborhood functions Map overlay (vector overlay and raster overlay) Spatial interpolation Trend surface analysis Network analysis Suitability analysis 4
5 Measurement in GIS Only an approximation of the true distance on the ground Vector data are stored as line segments even curved lines are stored as short line segments Raster data are approximated using a grid cell representation Measurements can be stored as attributes in vector GIS 5
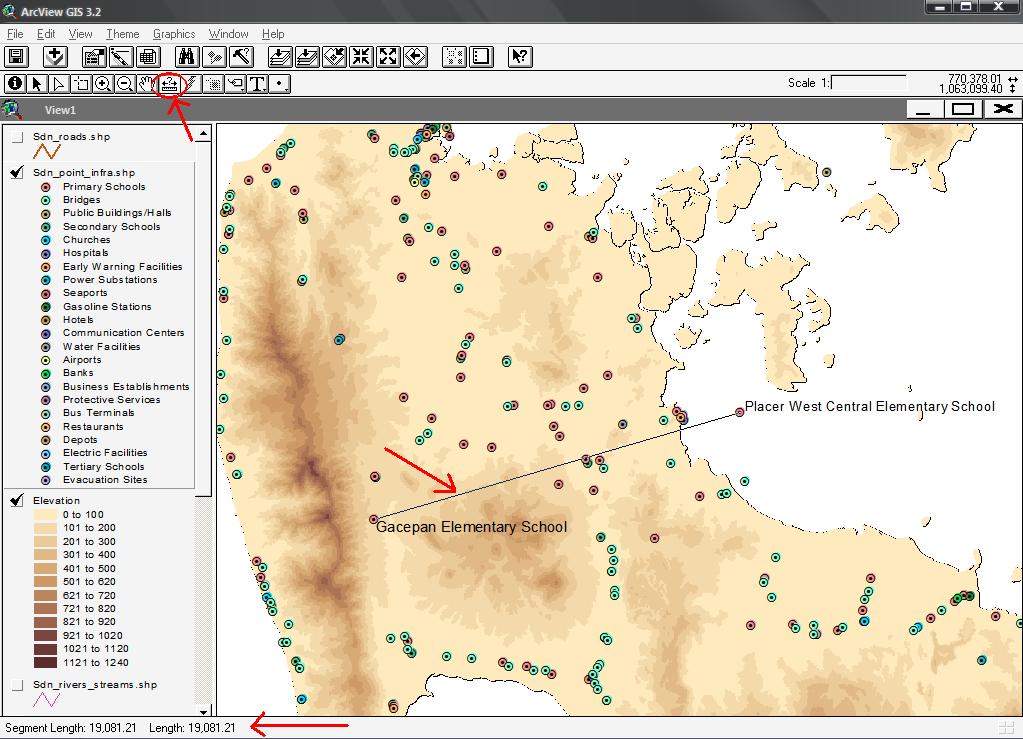
6 Distance Measurement 6


7 Distance Measurement of Raster Data Euclidean distance shortest distance/path Manhattan distance distance along raster cell sides from one point to another Proximity concentric equidistant zones are established around the start point A, and the distance to B is taken to be the corresponding radius of the circle that intersects it 7
8 Perimeter Measurement of Raster Data Number of cell sides that make up the boundary of the feature is multiplied by the grid resolution Perimeter = (number of cell sides) x (resolution) 8
9 Area Measurement of Raster Data Number of cells of a feature is multiplied by the known area of an individual grid cell Area = (number of cells) x (area of individual cell) 9
10 Measurements of Vector Data Euclidean distance obtained by using Pythagorean Theorem Perimeter - sum of the straight line lengths of the boundary Area - sum of areas of simple geometric shapes formed by subdividing the feature of interest 10
11 Querying Method of data retrieval Can be performed either on data that are part of the GIS database or on new data produced as a result of data analysis 11
12 Two types of query for GIS 1. Aspatial Query Questions about the attributes of features Example: How many elementary schools are there? 2. Spatial Query Requires information about the location of a feature Example: Where in Surigao are gas stations located? 12
13 Combined Querying Individual queries can be combined to identify features that satisfy two or more spatial and/or aspatial criteria Example: Where are the municipalities which have a population greater than 5000? Usually uses Boolean operators (AND, OR, NOT) Example: What are the bridges located in Surigao City? How many are they? 13

14 Querying 14
15 Reclassification An important variation of querying in GIS Can be used in place of querying for raster GIS Uses reclassification rules to reclassify or assign new values to cells Results to a new image May be Boolean or Weighted 15
16 Boolean Reclassification Produces a two-coded image from a complex image Original image is reclassified to an image with only 0 or 1 as cell values Example, if the production forests are of interest, all cells representing forestry can be assigned a value of 1, and all other cells a value of 0. 16
17 Reclassification by Weighting A different weight is assigned to different feature types or classes, based on the purpose of the reclassification Higher weights can be assigned to priority classes while lower weights to those of lower priority Example, if the purpose is for forest conservation, a weight of 5 can be assigned to forestry and lower weights to other features 17
18 Reclassification Example Land use Original value New value: Boolean New value: Weighted Forestry Water Settlement Agricultural Land

19 Proximity Analysis (Buffering) Creation of a zone of interest around an entity Point entity: circular buffer zone Line entity: elongated buffer zone Polygon entity: buffer zone has the same shape as original polygon, but larger 19
20 Sample Questions that Proximity Analysis Can Address How many houses lie within 100 m of this water main? What is the total number of patients within 10 km of this healthcare facility? What proportion of identified cases lies within 500 m of a suspected well (as source of infection)? 20
21 Neighborhood Functions (Filtering) Values of individual cells are altered based on the adjacent/neighboring cells May be used to remove noise/noisy pixels 21
22 Filter Group of cells around a target cell Usually called kernel or window Size and shape are defined by the operator Common shapes are square or circle Passed across the raster dataset (image) and used to recalculate new values for the central cell/pixel for each filter position 22

23 Topological Overlay Topology relationships between linked elements Perhaps the most important or key GIS analysis function Integrating data from two or more sources to produce a new map layer More powerful when combined with other spatial analysis methods 23
24 Raster Overlay Uses the idea of map algebra ( Mapematics ) Mathematical operators are performed on corresponding cells from two or more layers to produce an output value Input layers may be added, subtracted, multiplied, or divided to produce output data Quick, straightforward, and efficient 24
25 Raster Overlay An input layer is usually reclassified by Boolean to make it more meaningful and easier to analyze It is important that the features on each layer are appropriately coded for easier analysis Lacks spatial accuracy for coarse cells/low resolution data 25

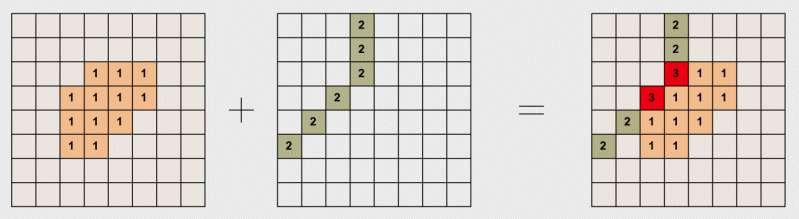

26 Raster Overlay 26
27 Vector Overlay Individual data layers to be overlaid have to be topologically correct (lines should meet at nodes and polygon boundaries are closed) Seldom used in isolation commonly used with querying Time-consuming, complex, and computationally expensive 27
28 Vector Overlay Topology must be created for the resulting layer by calculating the intersections of lines and polygons from the input layers time-consuming, especially for complex data Problem is the possible generation of sliver or weird polygons from the overlay results from overlaying two layers that contain the same spatial entities that are not exactly registered to one another 28
29 Types of Vector Overlay 1. Point-in-polygon 2. Line-in-polygon 3. Polygon-on-polygon 29

30 Point-in-Polygon Overlay used to find the polygon in which a point falls within, or find a point or points that fall within a certain polygon 30

31 Line-in-Polygon Overlay used to find the polygon in which a line or lines fall within, or find a line or lines that fall within a certain polygon 31

32 Polygon-on-Polygon Overlay used to determine which polygons from two layers intersect or are within another polygon 32
33 Types of Polygon-on-Polygon Overlay Union Clip/Cookie-cutting Intersect 33

34 Union Corresponds to the Boolean operator OR Output layer contains polygons from both input layers 34

35 Clip/Cookie-cutting Corresponds to the Boolean operator NOT A polygon layer is used to cut out the portion of another polygon layer that falls within the first polygon 35

36 Intersect Corresponds to the Boolean operator AND Output is the polygon of intersection of two polygon layers 36
37 Spatial Interpolation Procedure of estimating values at unsampled sites within an area with existing observations Used to fill the gaps between observed data points Interpolated data is only an approximation of the true value Commonly used to construct height contours 37
38 Spatial Interpolation Methods 1. Thiessen Polygons or Voronoi Polygons 2. Triangulated Irregular Network (TIN) 3. Spatial Moving Average 38
39 Thiessen Polygons Used to establish area territories for a set of points Examples: transformation of point climate stations to watersheds; construction of areas of influence around population centers 39

40 Steps in creating Thiessen Polygons Draw lines joining nearest neighboring points Draw perpendicular bisectors of these lines Use the bisectors as edges of the polygons that make up the surface 40
41 Triangulated Irregular Network An elegant way of constructing a surface form a set of irregularly spaced data points Most often used to generate DEMs Exact interpolation based on local data points Adjacent data points are connected by lines to form a network of irregular triangles 41

42 Triangulated Irregular Network 42
43 Spatial Moving Averages Most common interpolation method used in GIS Involves calculating a value for a location based on the range of values attached to neighboring points that fall within a userdefined range uses a filter that moves across the region of interest and calculates interpolated values per location 43
44 Spatial Moving Averages An approximate interpolation does not honor the values of known data points (recalculates them) Used when values of known data points are not exact/erroneous Examples: interpolation of census data, questionnaire responses, soil PH, rainfall infiltration rates 44


45 Surface Analysis Slope and aspect calculation Visibility analysis 45
46 Visibility Analysis Identification of areas of terrain that can be seen from a particular point on the terrain surface Applications: Locating towers for geodetic surveying Locating radio transmitters for maximum coverage 46
47 Network analysis Involves linear features or network of linear features that are topologically structured roads, rivers, pipelines, cables, etc. Examples: shortest path time of travel route tracing 47

48 Network Analysis Example 48
49 Thank you! 49
LECTURE 2 SPATIAL DATA MODELS
 LECTURE 2 SPATIAL DATA MODELS Computers and GIS cannot directly be applied to the real world: a data gathering step comes first. Digital computers operate in numbers and characters held internally as binary
Spatial Analysis (Vector) II
 II") Spatial Analysis (Vector) II GEOG 300, Lecture 9 Dr. Anthony Jjumba 1 A Spatial Network is a set of geographic locations interconnected in a system by a number of routes is a system of linear features
Spatial Analysis (Vector) II GEOG 300, Lecture 9 Dr. Anthony Jjumba 1 A Spatial Network is a set of geographic locations interconnected in a system by a number of routes is a system of linear features
DATA MODELS IN GIS. Prachi Misra Sahoo I.A.S.R.I., New Delhi
 DATA MODELS IN GIS Prachi Misra Sahoo I.A.S.R.I., New Delhi -110012 1. Introduction GIS depicts the real world through models involving geometry, attributes, relations, and data quality. Here the realization
Class #2. Data Models: maps as models of reality, geographical and attribute measurement & vector and raster (and other) data structures
 data structures") Class #2 Data Models: maps as models of reality, geographical and attribute measurement & vector and raster (and other) data structures Role of a Data Model Levels of Data Model Abstraction GIS as Digital
Class #2 Data Models: maps as models of reality, geographical and attribute measurement & vector and raster (and other) data structures Role of a Data Model Levels of Data Model Abstraction GIS as Digital
Contents of Lecture. Surface (Terrain) Data Models. Terrain Surface Representation. Sampling in Surface Model DEM
 Data Models. Terrain Surface Representation. Sampling in Surface Model DEM") Lecture 13: Advanced Data Models: Terrain mapping and Analysis Contents of Lecture Surface Data Models DEM GRID Model TIN Model Visibility Analysis Geography 373 Spring, 2006 Changjoo Kim 11/29/2006 1
Lecture 13: Advanced Data Models: Terrain mapping and Analysis Contents of Lecture Surface Data Models DEM GRID Model TIN Model Visibility Analysis Geography 373 Spring, 2006 Changjoo Kim 11/29/2006 1
Dijkstra's Algorithm
 Shortest Path Algorithm Dijkstra's Algorithm To find the shortest path from the origin node to the destination node No matrix calculation Floyd s Algorithm To find all the shortest paths from the nodes
Maps as Numbers: Data Models
 Maps as Numbers: Data Models vertices E Reality S E S arcs S E Conceptual Models nodes E Logical Models S Start node E End node S Physical Models 1 The Task An accurate, registered, digital map that can
Analytical and Computer Cartography Winter Lecture 9: Geometric Map Transformations
 Analytical and Computer Cartography Winter 2017 Lecture 9: Geometric Map Transformations Cartographic Transformations Attribute Data (e.g. classification) Locational properties (e.g. projection) Graphics
Applied Cartography and Introduction to GIS GEOG 2017 EL. Lecture-7 Chapters 13 and 14
 Applied Cartography and Introduction to GIS GEOG 2017 EL Lecture-7 Chapters 13 and 14 Data for Terrain Mapping and Analysis DEM (digital elevation model) and TIN (triangulated irregular network) are two
Geographic Information Systems (GIS) Spatial Analyst [10] Dr. Mohammad N. Almasri. [10] Spring 2018 GIS Dr. Mohammad N. Almasri Spatial Analyst
![Geographic Information Systems (GIS) Spatial Analyst [10] Dr. Mohammad N. Almasri. [10] Spring 2018 GIS Dr. Mohammad N. Almasri Spatial Analyst](/thumbs/80/81171101.jpg "Geographic Information Systems (GIS) Spatial Analyst [10] Dr. Mohammad N. Almasri. [10] Spring 2018 GIS Dr. Mohammad N. Almasri Spatial Analyst") Geographic Information Systems (GIS) Spatial Analyst [10] Dr. Mohammad N. Almasri 1 Preface POINTS, LINES, and POLYGONS are good at representing geographic objects with distinct shapes They are less good
Geographic Information Systems (GIS) Spatial Analyst [10] Dr. Mohammad N. Almasri 1 Preface POINTS, LINES, and POLYGONS are good at representing geographic objects with distinct shapes They are less good
Representing Geography
 Data models and axioms Chapters 3 and 7 Representing Geography Road map Representing the real world Conceptual models: objects vs fields Implementation models: vector vs raster Vector topological model
Getting Started with Spatial Analyst. Steve Kopp Elizabeth Graham
 Getting Started with Spatial Analyst Steve Kopp Elizabeth Graham Spatial Analyst Overview Over 100 geoprocessing tools plus raster functions Raster and vector analysis Construct workflows with ModelBuilder,
Spatial Analysis 2. Basic operations Béla Márkus
 Spatial Analysis 2. Basic operations Béla Márkus Spatial Analysis 2.: Basic operations Béla Márkus Lector: János Tamás This module was created within TÁMOP - 4.1.2-08/1/A-2009-0027 "Tananyagfejlesztéssel
Mapping Distance and Density
 Mapping Distance and Density Distance functions allow you to determine the nearest location of something or the least-cost path to a particular destination. Density functions, on the other hand, allow
GEOGRAPHIC INFORMATION SYSTEMS Lecture 25: 3D Analyst
 GEOGRAPHIC INFORMATION SYSTEMS Lecture 25: 3D Analyst 3D Analyst - 3D Analyst is an ArcGIS extension designed to work with TIN data (triangulated irregular network) - many of the tools in 3D Analyst also
RASTER ANALYSIS S H A W N L. P E N M A N E A R T H D A T A A N A LY S I S C E N T E R U N I V E R S I T Y O F N E W M E X I C O
 RASTER ANALYSIS S H A W N L. P E N M A N E A R T H D A T A A N A LY S I S C E N T E R U N I V E R S I T Y O F N E W M E X I C O TOPICS COVERED Spatial Analyst basics Raster / Vector conversion Raster data
17/07/2013 RASTER DATA STRUCTURE GIS LECTURE 4 GIS DATA MODELS AND STRUCTURES RASTER DATA MODEL& STRUCTURE TIN- TRIANGULAR IRREGULAR NETWORK
 RASTER DATA STRUCTURE GIS LECTURE 4 GIS DATA MODELS AND STRUCTURES Space is subdivided into regular grids of square grid cells or other forms of polygonal meshes known as picture elements (pixels) the
Statistical surfaces and interpolation. This is lecture ten
 Statistical surfaces and interpolation This is lecture ten Data models for representation of surfaces So far have considered field and object data models (represented by raster and vector data structures).
Understanding Geospatial Data Models
 Understanding Geospatial Data Models 1 A geospatial data model is a formal means of representing spatially referenced information. It is a simplified view of physical entities and a conceptualization of
Remote Sensing and GIS. GIS Spatial Overlay Analysis
 Subject Paper No and Title Module No and Title Module Tag Geology Remote Sensing and GIS GIS Spatial Overlay Analysis RS & GIS XXXI Principal Investigator Co-Principal Investigator Co-Principal Investigator
Module 7 Raster operations
 Introduction Geo-Information Science Practical Manual Module 7 Raster operations 7. INTRODUCTION 7-1 LOCAL OPERATIONS 7-2 Mathematical functions and operators 7-5 Raster overlay 7-7 FOCAL OPERATIONS 7-8
4.0 DIGITIZATION, EDITING AND STRUCTURING OF MAP DATA
 .0 DIGITIZATION, EDITING AND STRUCTURING OF MAP DATA The process of digitizing existing maps is a transformation from one analog) form of information to another digital) form. Data input is the operation
Geographic Surfaces. David Tenenbaum EEOS 383 UMass Boston
 Geographic Surfaces Up to this point, we have talked about spatial data models that operate in two dimensions How about the rd dimension? Surface the continuous variation in space of a third dimension
Watershed Sciences 4930 & 6920 ADVANCED GIS
 Slides by Wheaton et al. (2009-2014) are licensed under a Creative Commons Attribution-NonCommercial-ShareAlike 3.0 Unported License Watershed Sciences 4930 & 6920 ADVANCED GIS VECTOR ANALYSES Joe Wheaton
Creating Surfaces. Steve Kopp Steve Lynch
 Steve Kopp Steve Lynch Overview Learn the types of surfaces and the data structures used to store them Emphasis on surface interpolation Learn the interpolation workflow Understand how interpolators work
+ = Spatial Analysis of Raster Data. 2 =Fault in shale 3 = Fault in limestone 4 = no Fault, shale 5 = no Fault, limestone. 2 = fault 4 = no fault
 Spatial Analysis of Raster Data 0 0 1 1 0 0 1 1 1 0 1 1 1 1 1 1 2 4 4 4 2 4 5 5 4 2 4 4 4 2 5 5 4 4 2 4 5 4 3 5 4 4 4 2 5 5 5 3 + = 0 = shale 1 = limestone 2 = fault 4 = no fault 2 =Fault in shale 3 =
Spatial Analysis and Modeling (GIST 4302/5302) Guofeng Cao Department of Geosciences Texas Tech University
 Guofeng Cao Department of Geosciences Texas Tech University") Spatial Analysis and Modeling (GIST 4302/5302) Guofeng Cao Department of Geosciences Texas Tech University Outline of Today Last week, we learned: Characteristics of spatial data Types of spatial data
Spatial Analysis and Modeling (GIST 4302/5302) Guofeng Cao Department of Geosciences Texas Tech University Outline of Today Last week, we learned: Characteristics of spatial data Types of spatial data
Data handling 3: Alter Process
 Introduction Geo information Science (GRS 10306) Data handling 3: Alter Process 2009/2010 CGI GIRS 2 Alter / process / analysis / operations definition Query a data handling class of operators which doesn
Raster GIS applications
 Raster GIS applications Columns Rows Image: cell value = amount of reflection from surface DEM: cell value = elevation (also slope/aspect/hillshade/curvature) Thematic layer: cell value = category or measured
GIS Tools - Geometry. A GIS stores data as different layers of information Different feature types are stored in individual files.
 A Definition of GIS GIS is a system of hardware, software, and procedures designed to support the capture, management, manipulation, analysis, modeling and display of spatially referenced data for solving
Watershed Sciences 4930 & 6920 GEOGRAPHIC INFORMATION SYSTEMS
 Watershed Sciences 4930 & 6920 GEOGRAPHIC INFORMATION SYSTEMS WATS 4930/6920 WHERE WE RE GOING WATS 6915 welcome to tag along for any, all or none WEEK FIVE Lecture VECTOR ANALYSES Joe Wheaton HOUSEKEEPING
Map Analysis of Raster Data I 3/8/2018
 Map Analysis of Raster Data I /8/8 Spatial Analysis of Raster Data What is Spatial Analysis? = shale = limestone 4 4 4 4 5 5 4 4 4 4 5 5 4 4 4 5 4 5 4 4 4 5 5 5 + = = fault =Fault in shale 4 = no fault
Getting Started with Spatial Analyst. Steve Kopp Elizabeth Graham
 Getting Started with Spatial Analyst Steve Kopp Elizabeth Graham Workshop Overview Fundamentals of using Spatial Analyst What analysis capabilities exist and where to find them How to build a simple site
GEOGRAPHIC INFORMATION SYSTEMS Lecture 18: Spatial Modeling
 Spatial Analysis in GIS (cont d) GEOGRAPHIC INFORMATION SYSTEMS Lecture 18: Spatial Modeling - the basic types of analysis that can be accomplished with a GIS are outlined in The Esri Guide to GIS Analysis
Grade 9 Math Terminology
 Unit 1 Basic Skills Review BEDMAS a way of remembering order of operations: Brackets, Exponents, Division, Multiplication, Addition, Subtraction Collect like terms gather all like terms and simplify as
layers in a raster model
 layers in a raster model Layer 1 Layer 2 layers in an vector-based model (1) Layer 2 Layer 1 layers in an vector-based model (2) raster versus vector data model Raster model Vector model Simple data structure
Copyright The McGraw-Hill Companies, Inc. Permission required for reproduction or display.
 CHAPTER 11 VECTOR DATA ANALYSIS 11.1 Buffering 11.1.1 Variations in Buffering Box 11.1 Riparian Buffer Width 11.1.2 Applications of Buffering 11.2 Overlay 11.2.1 Feature Type and Overlay 11.2.2 Overlay
Multidimensional (spatial) Data and Modelling (2)
 Data and Modelling (2)") Multidimensional (spatial) Data and Modelling (2) 1 Representative operations on maps l l l l l are operations on layers used in maps (all 2-d). Synonyms f. map: layer, spatial partition Def. properties:
Multidimensional (spatial) Data and Modelling (2) 1 Representative operations on maps l l l l l are operations on layers used in maps (all 2-d). Synonyms f. map: layer, spatial partition Def. properties:
M. Andrea Rodríguez-Tastets. I Semester 2008
 M. -Tastets Universidad de Concepción,Chile andrea@udec.cl I Semester 2008 Outline refers to data with a location on the Earth s surface. Examples Census data Administrative boundaries of a country, state
Watershed Sciences 4930 & 6920 GEOGRAPHIC INFORMATION SYSTEMS
 HOUSEKEEPING Watershed Sciences 4930 & 6920 GEOGRAPHIC INFORMATION SYSTEMS Quizzes Lab 8? WEEK EIGHT Lecture INTERPOLATION & SPATIAL ESTIMATION Joe Wheaton READING FOR TODAY WHAT CAN WE COLLECT AT POINTS?
Multidimensional Data and Modelling - DBMS
 Multidimensional Data and Modelling - DBMS 1 DBMS-centric approach Summary: l Spatial data is considered as another type of data beside conventional data in a DBMS. l Enabling advantages of DBMS (data
Steps for Modeling a Proposed New Reservoir in GIS
 Steps for Modeling a Proposed New Reservoir in GIS Requirements: ArcGIS ArcMap, ArcScene, Spatial Analyst, and 3D Analyst There s a new reservoir proposed for Right Hand Fork in Logan Canyon. I wanted
GIS Data Models. 4/9/ GIS Data Models
 GIS Data Models 1 Conceptual models of the real world The real world can be described using two conceptually different models: 1. As discrete objects, possible to represent as points, lines or polygons.
Voronoi Diagrams in the Plane. Chapter 5 of O Rourke text Chapter 7 and 9 of course text
 Voronoi Diagrams in the Plane Chapter 5 of O Rourke text Chapter 7 and 9 of course text Voronoi Diagrams As important as convex hulls Captures the neighborhood (proximity) information of geometric objects
Topic 5: Raster and Vector Data Models
 Geography 38/42:286 GIS 1 Topic 5: Raster and Vector Data Models Chapters 3 & 4: Chang (Chapter 4: DeMers) 1 The Nature of Geographic Data Most features or phenomena occur as either: discrete entities
Vector-Based GIS Data Processing. Chapter 6
 Vector-Based GIS Data Processing Chapter 6 Vector Data Model Feature Classes points lines polygons Layers limited to one class of data Figure p. 186 Vector Data Model Shapefiles ArcView non-topological
ENGRG Introduction to GIS
 ENGRG 59910 Introduction to GIS Michael Piasecki April 3, 2014 Lecture 11: Raster Analysis GIS Related? 4/3/2014 ENGRG 59910 Intro to GIS 2 1 Why we use Raster GIS In our previous discussion of data models,
Algorithms for GIS csci3225
 Algorithms for GIS csci3225 Laura Toma Bowdoin College Spatial data types and models Spatial data in GIS satellite imagery planar maps surfaces networks point cloud (LiDAR) Spatial data in GIS satellite
Announcements. Data Sources a list of data files and their sources, an example of what I am looking for:
 Data Announcements Data Sources a list of data files and their sources, an example of what I am looking for: Source Map of Bangor MEGIS NG911 road file for Bangor MEGIS Tax maps for Bangor City Hall, may
Thoughts on Representing Spatial Objects. William A. Huber Quantitative Decisions Rosemont, PA
 Thoughts on Representing Spatial Objects William A. Huber Quantitative Decisions Rosemont, PA Overview 1. Some Ways to Structure Space 2. What to Put into a Grid 3. Objects and Fields 4. Hybrid Structures
Outline. 14. Query, Measurement, and Transformation. Spatial analysis. Definitions. The Snow map. What is spatial analysis?
 Outline 14. Query, Measurement, and Transformation What is spatial analysis? Transformations Geographic Information Systems and Science SECOND EDITION Paul A. Longley, Michael F. Goodchild, David J. Maguire,
Lecture 2: GIS Data Sources, Data Types and Representation. GE 118: INTRODUCTION TO GIS Engr. Meriam M. Santillan Caraga State University
 Lecture 2: GIS Data Sources, Data Types and Representation GE 118: INTRODUCTION TO GIS Engr. Meriam M. Santillan Caraga State University Geographic Data in GIS Can be obtained from various sources in different
Spatial Analysis (Vector) I
 I") Spatial Analysis (Vector) I GEOG 300, Lecture 8 Dr. Anthony Jjumba 1 Spatial Analysis In a GIS, Data are usually grouped into layers (or themes). The analysis functions of a GIS use the spatial and non-spatial
Spatial Analysis (Vector) I GEOG 300, Lecture 8 Dr. Anthony Jjumba 1 Spatial Analysis In a GIS, Data are usually grouped into layers (or themes). The analysis functions of a GIS use the spatial and non-spatial
Purpose: To explore the raster grid and vector map element concepts in GIS.
 GIS INTRODUCTION TO RASTER GRIDS AND VECTOR MAP ELEMENTS c:wou:nssi:vecrasex.wpd Purpose: To explore the raster grid and vector map element concepts in GIS. PART A. RASTER GRID NETWORKS Task A- Examine
[Figure about here]
![[Figure about here]](/thumbs/78/77444676.jpg "[Figure about here]") CHAPTER 3.6: SPATIAL ANALYSIS AND MODELING Michael F. Goodchild University of California, Santa Barbara 3.6.1 Introduction In the previous chapters we have seen how a wide variety of types of geographic
CHAPTER 3.6: SPATIAL ANALYSIS AND MODELING Michael F. Goodchild University of California, Santa Barbara 3.6.1 Introduction In the previous chapters we have seen how a wide variety of types of geographic
Georeferencing. Georeferencing: = linking a layer or dataset with spatial coordinates. Registration: = lining up layers with each other
 Georeferencing How do we make sure all our data layers line up? Georeferencing: = linking a layer or dataset with spatial coordinates Registration: = lining up layers with each other Rectification: The
Maps as Numbers: Data Models
 Maps as Numbers: Data Models vertices nodes tart node nd node arcs Reality Conceptual Models The Task An accurate, registered, digital map that can be queried and analyzed Translate: Real World Locations,
Raster Data. James Frew ESM 263 Winter
 Raster Data 1 Vector Data Review discrete objects geometry = points by themselves connected lines closed polygons attributes linked to feature ID explicit location every point has coordinates 2 Fields
Lecture 8. Vector Data Analyses. Tomislav Sapic GIS Technologist Faculty of Natural Resources Management Lakehead University
 Lecture 8 Vector Data Analyses Tomislav Sapic GIS Technologist Faculty of Natural Resources Management Lakehead University Vector Data Analysis Vector data analysis involves one or a combination of: Measuring
Spatial Analysis and Modeling (GIST 4302/5302) Database Fundaments. Database. Review: Bits and Bytes
 Database Fundaments. Database. Review: Bits and Bytes") Spatial Analysis and Modeling (GIST 4302/5302) Database Fundaments Guofeng Cao Department of Geosciences Texas Tech University Review: Bits and Bytes Data stored in a computer system is measured in bits
Spatial Analysis and Modeling (GIST 4302/5302) Database Fundaments Guofeng Cao Department of Geosciences Texas Tech University Review: Bits and Bytes Data stored in a computer system is measured in bits
Suitability Modeling with GIS
 Developed and Presented by Juniper GIS 1/33 Course Objectives What is Suitability Modeling? The Suitability Modeling Process Cartographic Modeling GIS Tools for Suitability Modeling Demonstrations of Models
Lidar and GIS: Applications and Examples. Dan Hedges Clayton Crawford
 Lidar and GIS: Applications and Examples Dan Hedges Clayton Crawford Outline Data structures, tools, and workflows Assessing lidar point coverage and sample density Creating raster DEMs and DSMs Data area
Using GIS To Estimate Changes in Runoff and Urban Surface Cover In Part of the Waller Creek Watershed Austin, Texas
 Using GIS To Estimate Changes in Runoff and Urban Surface Cover In Part of the Waller Creek Watershed Austin, Texas Jordan Thomas 12-6-2009 Introduction The goal of this project is to understand runoff
What can we represent as a Surface?
 Geography 38/42:376 GIS II Topic 7: Surface Representation and Analysis (Chang: Chapters 13 & 15) DeMers: Chapter 10 What can we represent as a Surface? Surfaces can be used to represent: Continuously
WMS 9.1 Tutorial Hydraulics and Floodplain Modeling Floodplain Delineation Learn how to us the WMS floodplain delineation tools
 v. 9.1 WMS 9.1 Tutorial Hydraulics and Floodplain Modeling Floodplain Delineation Learn how to us the WMS floodplain delineation tools Objectives Experiment with the various floodplain delineation options
Watershed Sciences 4930 & 6920 GEOGRAPHIC INFORMATION SYSTEMS
 HOUSEKEEPING Watershed Sciences 4930 & 6920 GEOGRAPHIC INFORMATION SYSTEMS CONTOURS! Self-Paced Lab Due Friday! WEEK SIX Lecture RASTER ANALYSES Joe Wheaton YOUR EXCERCISE Integer Elevations Rounded up
Raster Data Model & Analysis
 Topics: 1. Understanding Raster Data 2. Adding and displaying raster data in ArcMap 3. Converting between floating-point raster and integer raster 4. Converting Vector data to Raster 5. Querying Raster
Computer Database Structure for Managing Data :-
 The Map as an Abstraction of Space :- We begin the process of abstraction by conceptualizing what we encounter as a group of points, lines, areas and surfaces. We make decision about which object to take
Surface Analysis. Data for Surface Analysis. What are Surfaces 4/22/2010
 Surface Analysis Cornell University Data for Surface Analysis Vector Triangulated Irregular Networks (TIN) a surface layer where space is partitioned into a set of non-overlapping triangles Attribute and
Graphic Display of Vector Object
 What is GIS? GIS stands for Geographic Information Systems, although the term Geographic Information Science is gaining popularity. A GIS is a software platform for storing, organizing, viewing, querying,
Introduction to GIS 2011
 Introduction to GIS 2011 Digital Elevation Models CREATING A TIN SURFACE FROM CONTOUR LINES 1. Start ArcCatalog from either Desktop or Start Menu. 2. In ArcCatalog, create a new folder dem under your c:\introgis_2011
Geol 588. GIS for Geoscientists II. Zonal functions. Feb 22, Zonal statistics. Interpolation. Zonal statistics Sp. Analyst Tools - Zonal.
 Zonal functions Geol 588 GIS for Geoscientists II Feb 22, 2011 Zonal statistics Interpolation Zonal statistics Sp. Analyst Tools - Zonal Choose correct attribute for zones (usually: must be unique ID for
Soil texture: based on percentage of sand in the soil, partially determines the rate of percolation of water into the groundwater.
 Overview: In this week's lab you will identify areas within Webster Township that are most vulnerable to surface and groundwater contamination by conducting a risk analysis with raster data. You will create
CPSC 695. Methods for interpolation and analysis of continuing surfaces in GIS Dr. M. Gavrilova
 CPSC 695 Methods for interpolation and analysis of continuing surfaces in GIS Dr. M. Gavrilova Overview Data sampling for continuous surfaces Interpolation methods Global interpolation Local interpolation
Neighbourhood Operations Specific Theory
 Neighbourhood Operations Specific Theory Neighbourhood operations are a method of analysing data in a GIS environment. They are especially important when a situation requires the analysis of relationships
An Introduction to Spatial Databases
 An Introduction to Spatial Databases R. H. Guting VLDB Journal v3, n4, October 1994 Speaker: Giovanni Conforti Outline: a rather old (but quite complete) survey on Spatial DBMS Introduction & definition
Review of Cartographic Data Types and Data Models
 Review of Cartographic Data Types and Data Models GIS Data Models Raster Versus Vector in GIS Analysis Fundamental element used to represent spatial features: Raster: pixel or grid cell. Vector: x,y coordinate
Vector Data Analysis Working with Topographic Data. Vector data analysis working with topographic data.
 Vector Data Analysis Working with Topographic Data Vector data analysis working with topographic data. 1 Triangulated Irregular Network Triangulated Irregular Network 2 Triangulated Irregular Networks
Cell based GIS. Introduction to rasters
 Week 9 Cell based GIS Introduction to rasters topics of the week Spatial Problems Modeling Raster basics Application functions Analysis environment, the mask Application functions Spatial Analyst in ArcGIS
GIS in the Social and Natural Sciences. Last Lecture. Today s Outline 5/14/2017. GEOG 4110/5100 Special Topics in Geography
 GEOG 4110/5100 Special Topics in Geography GIS in the Social and Natural Sciences Working with Vector Data in a GIS Last Lecture We talked about the main types of vector data models (CDS, TDS, TIN, Networks)
GEOGRAPHIC INFORMATION SYSTEMS Lecture 02: Feature Types and Data Models
 GEOGRAPHIC INFORMATION SYSTEMS Lecture 02: Feature Types and Data Models Feature Types and Data Models How Does a GIS Work? - a GIS operates on the premise that all of the features in the real world can
Raster Analysis and Functions. David Tenenbaum EEOS 465 / 627 UMass Boston
 Raster Analysis and Functions Local Functions By-cell operations Operated on by individual operators or by coregistered grid cells from other themes Begin with each target cell, manipulate through available
Spatial Analysis and Modeling (GIST 4302/5302) Representation of Spatial Data. Representation of Spatial Data Models 3/5/18
 Representation of Spatial Data. Representation of Spatial Data Models 3/5/18") 3/5/8 Spatial Analysis and Modeling (GIST 432/532) Representation of Spatial Data Guofeng Cao Department of Geosciences Texas Tech University Representation of Spatial Data Models Object-based model: treats
3/5/8 Spatial Analysis and Modeling (GIST 432/532) Representation of Spatial Data Guofeng Cao Department of Geosciences Texas Tech University Representation of Spatial Data Models Object-based model: treats
Introduction to GIS. Geographic Information Systems SOCR-377 9/24/2015. R. Khosla Fall Semester The real world. What in the world is GIS?
 Introduction to GIS Geographic Information Systems SOCR-377 What in the world is GIS? GIS is simultaneously the telescope, the microscope, the computer and the Xerox machine of regional analysis and synthesis
Lecture 9. Raster Data Analysis. Tomislav Sapic GIS Technologist Faculty of Natural Resources Management Lakehead University
 Lecture 9 Raster Data Analysis Tomislav Sapic GIS Technologist Faculty of Natural Resources Management Lakehead University Raster Data Model The GIS raster data model represents datasets in which square
Algorithms for GIS. Spatial data: Models and representation (part I) Laura Toma. Bowdoin College
 Laura Toma. Bowdoin College") Algorithms for GIS Spatial data: Models and representation (part I) Laura Toma Bowdoin College Outline Spatial data in GIS applications Point data Networks Terrains Planar maps and meshes Data structures
Algorithms for GIS Spatial data: Models and representation (part I) Laura Toma Bowdoin College Outline Spatial data in GIS applications Point data Networks Terrains Planar maps and meshes Data structures
Chapter 8: How to Pick a GIS
 Chapter 8: How to Pick a GIS 8. The Evolution of GIS Software 8.2 GIS and Operating Systems 8.3 GIS Software Capabilities 8.4 GIS Software and Data Structures 8.5 Choosing the Best GIS David Tenenbaum
Lecture 7 Digitizing. Dr. Zhang Spring, 2017
 Lecture 7 Digitizing Dr. Zhang Spring, 2017 Model of the course Using and making maps Navigating GIS maps Map design Working with spatial data Geoprocessing Spatial data infrastructure Digitizing File
Geometry GEOMETRY. Congruence
 Geometry Geometry builds on Algebra I concepts and increases students knowledge of shapes and their properties through geometry-based applications, many of which are observable in aspects of everyday life.
Mathematics Curriculum
 6 G R A D E Mathematics Curriculum GRADE 6 5 Table of Contents 1... 1 Topic A: Area of Triangles, Quadrilaterals, and Polygons (6.G.A.1)... 11 Lesson 1: The Area of Parallelograms Through Rectangle Facts...
GEOSPATIAL ENGINEERING COMPETENCIES. Geographic Information Science
 GEOSPATIAL ENGINEERING COMPETENCIES Geographic Information Science The character and structure of spatial information, its methods of capture, organisation, classification, qualification, analysis, management,
RASTER ANALYSIS GIS Analysis Fall 2013
 RASTER ANALYSIS GIS Analysis Fall 2013 Raster Data The Basics Raster Data Format Matrix of cells (pixels) organized into rows and columns (grid); each cell contains a value representing information. What
Geometry Vocabulary Math Fundamentals Reference Sheet Page 1
 Math Fundamentals Reference Sheet Page 1 Acute Angle An angle whose measure is between 0 and 90 Acute Triangle A that has all acute Adjacent Alternate Interior Angle Two coplanar with a common vertex and
Raster GIS. Raster GIS 11/1/2015. The early years of GIS involved much debate on raster versus vector - advantages and disadvantages
 Raster GIS Google Earth image (raster) with roads overlain (vector) Raster GIS The early years of GIS involved much debate on raster versus vector - advantages and disadvantages 1 Feb 21, 2010 MODIS satellite
Spatial data and QGIS
 Spatial data and QGIS Xue Jingbo IT Center 2017.08.07 A GIS consists of: Spatial Data. Computer Hardware. Computer Software. Longitude Latitude Disease Date 26.870436-31.909519 Mumps 13/12/2008 26.868682-31.909259
Lesson 5 overview. Concepts. Interpolators. Assessing accuracy Exercise 5
 Interpolation Tools Lesson 5 overview Concepts Sampling methods Creating continuous surfaces Interpolation Density surfaces in GIS Interpolators IDW, Spline,Trend, Kriging,Natural neighbors TopoToRaster
Introduction to 3D Analysis. Jinwu Ma Jie Chang Khalid Duri
 Introduction to 3D Analysis Jinwu Ma Jie Chang Khalid Duri Area & Volume 3D Analyst Features Detect Change Determine Cut/Fill Calculate Surface Area & Volume Data Management Data Creation Data Conversion
Accuracy, Support, and Interoperability. Michael F. Goodchild University of California Santa Barbara
 Accuracy, Support, and Interoperability Michael F. Goodchild University of California Santa Barbara The traditional view Every object has a true position and set of attributes with enough time and resources
Chapter 7 Spatial Operation
 7.1 Introduction Chapter 7 Spatial Operation Q: What is spatial operation? A: Spatial operation is computational manipulation of spatial objects that deepen our understanding of spatial phenomena. In spatial
Coverage data model. Vector-Based Spatial Analysis: Tools Processes. Topological Data Model. Polygons Files. Geographic Information Systems.
 GEOG4340 Geographic Information Systems Lecture Four 2013winter Vector-Based Spatial Analysis: Tools Processes Reading materials: Chapter 6 of Intro GIS by J. R. Jensen and R.R. Jensen Cheng. Q., Earth